
Create successful ePaper yourself
Turn your PDF publications into a flip-book with our unique Google optimized e-Paper software.
<strong>Tata</strong> <strong>Motors</strong><br />
<strong>3Q</strong> <strong>FY04</strong> <strong>Review</strong><br />
Snapshot<br />
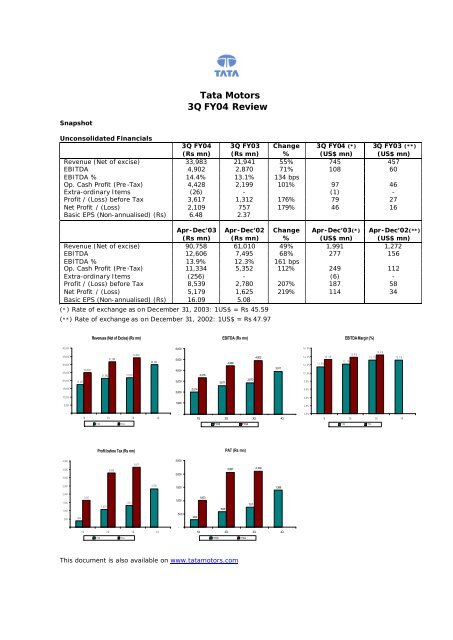
Unconsolidated Financials<br />
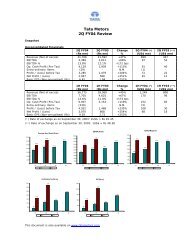
<strong>3Q</strong> <strong>FY04</strong> <strong>3Q</strong> FY03 Change <strong>3Q</strong> <strong>FY04</strong> (*) <strong>3Q</strong> FY03 (**)<br />
(Rs mn) (Rs mn) % (US$ mn) (US$ mn)<br />
Revenue (Net of excise) 33,983 21,941 55% 745 457<br />
EBITDA 4,902 2,870 71% 108 60<br />
EBITDA % 14.4% 13.1% 134 bps<br />
Op. Cash Profit (Pre-Tax) 4,428 2,199 101% 97 46<br />
Extra-ordinary Items (26) - (1) -<br />
Profit / (Loss) before Tax 3,617 1,312 176% 79 27<br />
Net Profit / (Loss) 2,109 757 179% 46 16<br />
Basic EPS (Non-annualised) (Rs) 6.48 2.37<br />
Apr-Dec’03 Apr-Dec’02 Change Apr-Dec’03(*) Apr-Dec’02(**)<br />
(Rs mn) (Rs mn) % (US$ mn) (US$ mn)<br />
Revenue (Net of excise) 90,758 61,010 49% 1,991 1,272<br />
EBITDA 12,606 7,495 68% 277 156<br />
EBITDA % 13.9% 12.3% 161 bps<br />
Op. Cash Profit (Pre-Tax) 11,334 5,352 112% 249 112<br />
Extra-ordinary Items (256) - (6) -<br />
Profit / (Loss) before Tax 8,539 2,780 207% 187 58<br />
Net Profit / (Loss) 5,179 1,625 219% 114 34<br />
Basic EPS (Non-annualised) (Rs) 16.09 5.08<br />
(*) Rate of exchange as on December 31, 2003: 1US$ = Rs 45.59<br />
(**) Rate of exchange as on December 31, 2002: 1US$ = Rs 47.97<br />
Revenues (Net of Excise) (Rs mn)<br />
EBITDA (Rs mn)<br />
EBITDA Margin (%)<br />
40,000<br />
35,000<br />
30,000<br />
25,000<br />
20,000<br />
17,477<br />
25,009<br />
31,766<br />
21,592 21,941<br />
33,983<br />
29,922<br />
6,000<br />
5,000<br />
4,000<br />
3,000<br />
3,316<br />
2,611<br />
4,389<br />
2,870<br />
4,902<br />
3,911<br />
16.0%<br />
14.0%<br />
12.0%<br />
10.0%<br />
8.0%<br />
11.5%<br />
13.3%<br />
12.1%<br />
13.8%<br />
14.4%<br />
13.1% 13.1%<br />
15,000<br />
2,000<br />
2,014<br />
6.0%<br />
10,000<br />
4.0%<br />
5,000<br />
1,000<br />
2.0%<br />
-<br />
1Q 2Q <strong>3Q</strong> 4Q<br />
-<br />
1Q 2Q <strong>3Q</strong> 4Q<br />
0.0%<br />
1Q 2Q <strong>3Q</strong> 4Q<br />
FY03<br />
<strong>FY04</strong><br />
FY03<br />
<strong>FY04</strong><br />
FY03<br />
<strong>FY04</strong><br />
Profit before Tax (Rs mn)<br />
PAT (Rs mn)<br />
4,000<br />
3,500<br />
3,000<br />
3,285<br />
3,617<br />
2,500<br />
2,000<br />
2,067 2,109<br />
2,500<br />
2,336<br />
1,500<br />
1,388<br />
2,000<br />
1,500<br />
1,000<br />
500<br />
389<br />
1,637<br />
1,079<br />
1,312<br />
1,000<br />
500<br />
280<br />
1,003<br />
588<br />
757<br />
-<br />
-<br />
1Q 2Q <strong>3Q</strong> 4Q<br />
1Q 2Q <strong>3Q</strong> 4Q<br />
FY03<br />
<strong>FY04</strong><br />
FY03 <strong>FY04</strong><br />
This document is also available on www.tatamotors.com
Business <strong>Review</strong><br />
Summary<br />
As a part of good corporate governance practice, the Company has declared the Audited results for<br />
the 9-month period ending Dec. 2003. The Company intends to carry this process further and begin<br />
declaring quarterly audited results beginning next quarter.<br />
<strong>Tata</strong> <strong>Motors</strong> achieved Net Revenues of Rs 34 bn in <strong>3Q</strong> <strong>FY04</strong>, up 55% YoY on the back of strong<br />
volume growth of 53%.<br />
The Company posted a Net Profit of Rs 2.1 bn during the quarter compared to Rs 757 mn last year,<br />
up 179% YoY.<br />
Profit before Tax (PBT) stood at Rs 3.6 bn; up 176% YoY.<br />
<strong>3Q</strong> EBITDA saw a growth of 71% to Rs 4.9 bn. EBITDA margin expanded by 134 bps to reach 14.4%<br />
for the quarter.<br />
In line with the commitment to pursue higher dividend payout to shareholders as a means of<br />
utilisation of strong Free Cash Flow, the Company has declared an Interim Dividend of 40%.<br />
While rising commodity prices and change in revenue mix has had some impact on the Company’s<br />
performance, the Company has been able to mitigate the pressures through its ongoing cost reduction<br />
efforts and operating leverage.<br />
Table 1: Volume Summary<br />
<strong>3Q</strong> <strong>FY04</strong> <strong>3Q</strong> FY03 Change Apr-Dec’03 Apr-Dec’02 Change<br />
Commercial Vehicles 40,485 27,692 46% 104,616 72,612 44%<br />
Passenger Vehicles 30,244 21,903 38% 97,217 68,428 42%<br />
Total Domestic Sales 70,729 49,595 43% 201,833 141,040 43%<br />
Exports 7,651 1,553 393% 15,068 5,982 152%<br />
Total Volumes 78,380 51,148 53% 216,901 147,022 48%<br />
The volumes in <strong>3Q</strong> saw a sharp growth on the back of<br />
• market share gains in CVs as well as PVs<br />
• consolidation of recently launched products (207 DI, Indigo)<br />
• increase in exports volumes<br />
• improved performance of the economy<br />
During the quarter, the Company improved its market share in CVs to 59.3% (+140 bps) and in PVs<br />
to 14.1% (+70 bps). YTD, the Company’s market shares stand at 58.8% (+340 bps) in CVs and<br />
15.5% (+180 bps) in PVs.<br />
The Company’s revenue from non-cyclical business has increased to 15% of Net Revenue during Apr-<br />
Dec 2003 compared to 13% for the full fiscal 2003.<br />
The key subsidiaries posted a combined Profit before Tax of Rs 272 mn during the quarter compared<br />
to a loss of Rs 68 mn last year.
Economic Scenario<br />
The GDP growth of 8.4% in 2Q <strong>FY04</strong> exceeded expectations, driven by a strong performance in agriculture<br />
(+7.4%) and continued buoyancy in industry (+6.3%) and services (+9.9%). This has strengthened the<br />
prospects of over 7% growth in GDP in the current fiscal.<br />
The recovery witnessed by the industrial economy was sustained (+6.2%) during Apr-Nov. 2003 on the<br />
back of 6.8% growth in the Manufacturing sector.<br />
Table 2: Macro Economic Indicators<br />
Growth (%) Categories Apr -Nov’03 Apr -Nov'02<br />
IIP General 6.2% 5.4%<br />
Sectoral Mining 3.9% 5.8%<br />
Mfg. 6.8% 5.6%<br />
Electricity 3.1% 4.0%<br />
Use-based Basic 4.5% 4.8%<br />
Capital 8.9% 10.4%<br />
Intermediate 5.2% 2.6%<br />
Consumer 8.0% 7.5%<br />
Consumer Durables 7.7% -6.0%<br />
Consumer Non-Durables 8.2% 12.9%<br />
Source: CSO<br />
National Highway Development Project (NHDP)<br />
The implementation of Phase-I of the NHDP (Golden Quadrilateral project (GQ) - 5,846 km) is on<br />
schedule. Around 2,400 km (41% of the total length under GQ) has been completed by end-Dec. 2003.<br />
With the recent approval of the funding plan, Phase II of the NHDP - NSEW corridor (7,300 km) and other<br />
projects - should see a pick up in the award of contracts in the coming months.<br />
Table 3: Status of the NHDP Project as on Dec. 31, 2003<br />
Total length Date of Completed Under Balance to<br />
(In kms) completion Implementation be awarded<br />
GQ 5,846 Dec-04 41% 58% 1%<br />
NSEW 7,300 Dec-07 8% 6% 86%<br />
Port Connectivity & Others 1,016 Dec-07 21% 27% 52%<br />
Total 14,162 22% 29% 49%<br />
Key positives for the economy in <strong>FY04</strong><br />
• Upturn in agriculture; multiplier effect on the economy<br />
• Sustained growth in industry and services, with inflation under control<br />
• Infrastructure development on track<br />
• Continuation of soft interest rate regime<br />
• Buoyancy in Capital Goods - domestic production (+8.9%) as well as imports (+23%) - an<br />
indicator of pickup in economic activity<br />
• Strong Consumer demand (+8.0%)<br />
• Expansion in Non-Food Credit by over 16% (by end-Nov 2003)<br />
• Forex reserves of over US$100 bn to provide cushion against external shocks<br />
Areas of concern<br />
• Steep increase in input prices (Steel, Rubber, etc)<br />
• Rise in domestic fuel prices by around 13% in last six months
Outlook<br />
‣ Sustained economic growth has fuelled demand in the current fiscal. The Company has been able to<br />
capture the benefits of the strong growth and improve its market share by introducing products to<br />
match the needs of the customers in high volume segments.<br />
‣ However, going forward, the following factors can have an impact on demand:<br />
• Economic growth not keeping pace with expansion in CV fleet size.<br />
• Further increases in fuel prices, which are nearly at the peak levels of Mar. 2003.<br />
• Political uncertainty due to the advancement of elections.<br />
‣ Input prices (especially Steel, Rubber) have seen a sharp rise in the current fiscal and continue to be<br />
a cause for concern. Consequently, the Company has recently increased prices of some of its products<br />
in Jan. 2004. The Company is exploring opportunities for further reduction in costs and is working<br />
jointly with its vendors to counter the impact of these cost pressures.<br />
‣ Increasing proportion of exports in revenues, going forward, may also have some impact on operating<br />
margins.<br />
‣ <strong>Tata</strong> <strong>Motors</strong> has entered into a Memorandum of Understanding with Daewoo Commercial Vehicle Co.<br />
Ltd, Korea (DWCV) for acquisition of the company. The due diligence process is currently under way.
Commercial Vehicles<br />
Domestic volume growth of 46% in <strong>3Q</strong> <strong>FY04</strong><br />
Strong growth in both, haulage and passenger segments<br />
Market share in <strong>3Q</strong> <strong>FY04</strong> at 59%; gain of 140 bps<br />
Significant gain in LCV market share in <strong>3Q</strong> <strong>FY04</strong> (+490 bps)<br />
Exports volumes expand 170% during the quarter<br />
CV Domestic Business<br />
The Company registered domestic CV sales of 40,485 units during the quarter with volume increases in<br />
both M/HCV & LCV segments.<br />
Table 4: CV Domestic Sales Volumes<br />
<strong>3Q</strong> <strong>FY04</strong> <strong>3Q</strong> FY03 Change Apr-Dec’03 Apr-Dec’02 Change<br />
M/HCV 27,995 19,394 44% 70,481 50,064 41%<br />
LCV 12,490 8,298 51% 34,135 22,548 51%<br />
Total CV 40,485 27,692 46% 104,616 72,612 44%<br />
Table 5: CV Market Shares<br />
<strong>3Q</strong> <strong>FY04</strong> <strong>3Q</strong> FY03<br />
Apr-Dec’03 Apr-Dec’02<br />
M/HCV 66% 67% 65% 65%<br />
LCV 49% 44% 50% 42%<br />
Total CV 59% 58% 59% 55%<br />
‣ M/HCV truck growth was sustained in <strong>3Q</strong> (+50% YoY). The key growth drivers were<br />
consistent improvement in the economy, strong performance in agriculture, low cost retail<br />
finance and continued spending on infrastructure. Apart from these factors, replacement of<br />
old vehicles to meet emission norms in certain markets also contributed to higher truck<br />
demand.<br />
−<br />
The buoyancy in HCV truck sales continued during the quarter, with a volume growth of<br />
60% YoY<br />
− MCV truck sales grew by 44% YoY while ICV truck volumes were up 48% YoY in <strong>3Q</strong>.<br />
‣ While the average diesel price in <strong>3Q</strong> increased by 2.4% sequentially, the Company’s<br />
benchmark freight rate index was up 3%. With a further hike in Jan. 2004, fuel prices are<br />
back to the high of Mar. 2003. This may have an adverse impact on transporters’ profitability.<br />
However, availability of freight (led by strong performance in agriculture and industry) and<br />
low cost finance continue to be key positives for the transporters.<br />
‣ The M/HCV bus segment witnessed a modest growth of 15% in <strong>3Q</strong>. Backed by growth in the<br />
STU as well as private segment, YTD sales are up 33%, translating into a market share of<br />
52% (+260 bps).<br />
‣ In the LCV segment, the Company consolidated its position during the quarter with a market<br />
share of 49% (+490 bps) while registering gains in all the segments.<br />
− In the Pick-up segment (the fastest growing segment among LCVs), the 207DI registered<br />
a market share of 34% in <strong>3Q</strong> <strong>FY04</strong>.<br />
−<br />
−<br />
In the rest of the LCV truck market, the Company’s volumes grew by 21%. The market<br />
share expanded from 66% to 68% during the quarter. Following the recent launch of the<br />
407 EX truck offering higher fuel efficiency and payload, the Company expects to further<br />
consolidate its position in the coming months.<br />
The Company’s volumes in the LCV Bus segment were up 28% against industry growth of<br />
6% during the quarter. The success of the City Ride Bus (4T Fully Built bus launched end-<br />
FY03) helped the Company improve its market share to 39% (+680 bps) during <strong>3Q</strong>.<br />
‣ The Company plans to introduce a new range of fully-built buses (12-60 seater) with<br />
contemporary design and technology, improved fuel efficiency and driving comfort by the end<br />
of the current fiscal.<br />
‣ The Company has also developed comprehensive transport solutions for various industry<br />
sectors such as cement.
CV International Business<br />
The Company’s CV exports grew by 170% to 2,969 units during the quarter.<br />
Table 6: CV Exports Volumes<br />
<strong>3Q</strong> <strong>FY04</strong> <strong>3Q</strong> FY03 Change Apr-Dec’03 Apr-Dec’02 Change<br />
M/HCV 1,248 446 180% 3,092 1,878 65%<br />
LCV 1,721 655 163% 4,215 2,517 67%<br />
Total CV 2,969 1,101 170% 7,307 4,395 66%<br />
‣ <strong>Tata</strong> <strong>Motors</strong> has entered into a Memorandum of Understanding with Daewoo Commercial<br />
Vehicle Co. Ltd, Korea for acquiring the company. The due diligence process is in process.<br />
‣ The Company is also exploring opportunities in markets like China, CIS countries, and SE Asia<br />
for its CVs.<br />
‣ During the quarter, exports of Pickups were up on the back of increased shipments to<br />
European and SE Asian markets
Passenger Vehicles<br />
<strong>Tata</strong> <strong>Motors</strong> domestic volumes up 38% against industry growth of 31%<br />
Market share improved to 14% during the quarter from 13% last year. YTD market share of 15.5%<br />
Indigo - market leader in its segment in CY03. Cumulative sales cross the 25,000 mark<br />
Strong domestic sales growth in MUVs (+41% YoY) and market share gain during <strong>3Q</strong> <strong>FY04</strong><br />
Exports of City Rover to UK commenced in <strong>3Q</strong> <strong>FY04</strong><br />
PV Domestic Business<br />
The Company retained its position as the second largest player in the PV market with a sale of 30,244<br />
units during the quarter.<br />
Table 7: PV Domestic Sales Volumes<br />
<strong>3Q</strong> <strong>FY04</strong> <strong>3Q</strong> FY03 Change Apr-Dec’03 Apr-Dec’02 Change<br />
Passenger Car 23,097 16,837 37% 76,216 51,842 47%<br />
MUV 7,147 5,066 41% 21,001 16,586 27%<br />
Total PV 30,244 21,903 38% 97,217 68,428 42%<br />
Table 8: PV Market Shares<br />
<strong>3Q</strong> <strong>FY04</strong> <strong>3Q</strong> FY03 Apr-Dec’03 Apr-Dec’02<br />
Passenger Car 14% 14% 16% 13%<br />
Compact Car 20% 24% 22% 24%<br />
Entry-level Mid-size Car 25% 3% 26% 1%<br />
MUV 20% 19% 21% 21%<br />
Total PV 14% 13% 16% 14%<br />
‣ The Company’s <strong>3Q</strong> <strong>FY04</strong> PV volumes were up 38% YoY, outperforming the industry growth of<br />
31%. The Company’s market share improved to 14% (+70 bps) in <strong>3Q</strong> <strong>FY04</strong> compared to last<br />
year.<br />
‣ In the passenger car segment, the Company registered growth of 37% on the back of robust<br />
sales of Indigo for <strong>3Q</strong> <strong>FY04</strong>. Indigo achieved a market share of 25% in the entry-level C<br />
segment to maintain its position among the leading brands in its segment.<br />
‣ Due to the product mix changes, higher exports and efforts undertaken to ramp up<br />
production at the Car plant in <strong>3Q</strong>, Indica volume growth was marginal during the quarter.<br />
‣ Indica continues to be among the top two brands in the compact car segment. The popularity<br />
of the Indica is reflected in the NFO Automotive - Total Customer Satisfaction Study 2003,<br />
where it was adjudged the Best Diesel Small Car.<br />
The Indica Diesel also retained its top ranking at the NFO Automotive Cost of Ownership<br />
Study 2003 with an operating cost of Rs 2 per km against the next best figure of Rs 2.31 per<br />
km.<br />
Indica DLX won the “Best car award” in the Rs.3 lakh - Rs.5 lakh category at the BBC World’s<br />
"Wheels 2003".<br />
‣ With the launch of the new Indica V2 in January 2004, the Company expects to consolidate its<br />
position in the Compact Car segment.<br />
‣ The Company also recently unveiled a station wagon, Indigo Marina.<br />
‣ Reduction in excise duty, low cost finance and better agri-economy have boosted MUV sales<br />
in the current fiscal. The Company’s MUV sales were up 41% YoY in <strong>3Q</strong>, exceeding the<br />
industry growth of 30% due to increased consumer acceptance of new variants. The<br />
Company’s market share in the MUV segment improved to 20% (+160 bps) during the<br />
quarter.<br />
Safari, which has registered a strong volume growth this fiscal, was ranked highest in the<br />
MUV-SUV category in the JD Power APEAL Study 2003.
PV International Business<br />
The Company’s PV exports during the quarter surged 936% YoY to 4,682 units.<br />
Table 9: PV Exports Volumes<br />
<strong>3Q</strong> <strong>FY04</strong> <strong>3Q</strong> FY03<br />
Change Apr -Dec’03 Apr-Dec’02 Change<br />
Passenger Car 4,382 403 987% 6,132 1,251 390%<br />
MUV 300 49 512% 1,629 336 385%<br />
Total PV 4,682 452 936% 7,761 1,587 389%<br />
‣ The shipments of Passenger Cars to MG Rover commenced in <strong>3Q</strong> <strong>FY04</strong> with over 4,000 cars<br />
being exported during the quarter.<br />
‣ Safari exports continued to register strong growth on account of increased shipments to<br />
European countries.
Finance<br />
‣ In its drive to adopt good corporate governance practices, the Company has released the Audited<br />
results for the 9-month period ending Dec. 2003. The Company will continue this process further by<br />
announcing Audited quarterly results beginning next quarter.<br />
‣ Gross Interest cost has been brought down by 33% to Rs 527 mn through restructuring of the debt<br />
portfolio, benefit of lower interest rates and strong operating cash flows.<br />
‣ The Company divested its holding in <strong>Tata</strong> Infomedia during the quarter. The profit of Rs 41 mn from<br />
this divestment is included in <strong>3Q</strong> <strong>FY04</strong> Other Income. Rest of the Other Income during the quarter<br />
pertains to dividend income.<br />
‣ The Company continues to pay Minimum Alternate Tax (MAT) due to tax shields available from the<br />
past operations.<br />
‣ The Company’s balance sheet stood at Rs 50.7 bn as on Dec. 31, 2003 compared to Rs 41.6 bn as on<br />
Mar 31, 2003. This increase is primarily on account of surplus investible funds of around Rs 12.4 bn as<br />
on Dec. 31, 2003.<br />
‣ The Company retired expensive debt worth Rs 2.1 bn during <strong>3Q</strong>. With this, the total debt repaid in the<br />
current fiscal stood at Rs 6 bn.<br />
‣ The gross total debt (inc. FCCBs) was Rs 14.1 bn as on Dec. 31, 2003. Net Debt of the Company (Net<br />
of the surplus investible funds) was Rs 1.7 bn. Net Debt : Equity stood at 0.05 as on Dec. 31, 2003.<br />
‣ Continued focus on management of inventory and receivables has helped the Company maintain a<br />
negative Net Working Capital position.<br />
Table 10: Working Capital<br />
No. of Days Dec. 31, 2003 March 31, 2003 Dec. 31, 2002<br />
Inventory 35 39 40<br />
Receivables (non-HP) 14 18 19<br />
‣ The Company has incurred capital expenditure (including product development) of around Rs 1.8 bn<br />
during Apr-Dec 2003.<br />
‣ The Company had raised US$ 100 mn by way of FCCBs in the international markets in 2Q <strong>FY04</strong>.<br />
Around 38% of the outstanding FCCBs have been converted into GDSs till end-Dec. 2003 at a<br />
premium of Rs 240.745 per share, resulting in an increase of 7 mn in the Company’s outstanding<br />
equity shares in the current fiscal.<br />
‣ During its Rights Issue in FY02, the Company had issued 25.5 mn warrants. Since the opening of the<br />
conversion period in June 2003, around 3.5 mn of these warrants have been converted at a premium<br />
of Rs 110 per share.<br />
Key Subsidiary Companies – Performance<br />
Table 11: Key Subsidiary Financials<br />
Subsidiary Net Turnover (Rs mn) PBT (Rs mn)<br />
<strong>3Q</strong> <strong>FY04</strong> <strong>3Q</strong> FY03 <strong>3Q</strong> <strong>FY04</strong> <strong>3Q</strong> FY03<br />
Telco Construction Equipment Co. Ltd (Telcon) 1628 1187 104 (79)<br />
<strong>Tata</strong> Technologies Ltd (TTL) 350 249 13 52<br />
HV Transmissions Ltd (HVTL) 277 194 86 17<br />
HV Axles Ltd (HVAL) 304 236 123 32<br />
TAL Mfg Solutions Ltd (TAL) 89 161 (54) (89)<br />
‣ The combined turnover of the key subsidiaries during the quarter was up 31% YoY to Rs 2.6bn.<br />
‣ These subsidiaries posted a combined Profit before Tax of Rs 272 mn in <strong>3Q</strong> compared to a loss of Rs<br />
68 mn last year.
‣ The combined debt of the subsidiaries as on Dec 31, 2003 stood at Rs 2.8 bn, down from Rs 4 bn as<br />
on Mar 31, 2003.<br />
‣ The combined Capital Employed has been brought down by 16% during the fiscal.<br />
Shareholding Pattern<br />
Table 12: Shareholding Pattern as on 31 st December, 2003<br />
%<br />
<strong>Tata</strong> Group 31%<br />
Daimler Chrysler 8%<br />
Indian Financial Institutions / M Fs / Banks 15%<br />
GDR Holders / Foreign holders –DR status 7%<br />
Foreign Institutional Investors 22%<br />
Others 17%<br />
Total 100%<br />
In Jan. 2004, the Company received the approval of its shareholders to raise the limits for investment by<br />
Foreign Institutional Investors from 24% to 35% of the paid-up capital of the Company.<br />
Investor Relations Contacts<br />
Dharmendra Grover<br />
Radhika Koppikar<br />
3 rd Floor, Nanavati Mahalaya, 3 rd Floor, Nanavati Mahalaya,<br />
Homi Mody Street,<br />
Homi Mody Street,<br />
Fort,<br />
Fort,<br />
Mumbai – 400 001 Mumbai – 400 001<br />
India<br />
India<br />
Phone: 91-22-5665 7237 Phone: 91-22-5665 7230<br />
Fax: 91-22-5665 7788 Fax: 91-22-5665 7788<br />
Email: dgrover@tatamotors.com<br />
Email: rvk@tatamotors.com<br />
Disclaimer<br />
Statements in this presentation describing the Company’s objectives, projections, estimates, expectations<br />
may be “forward looking statements” within the meaning of applicable securities laws and regulations.<br />
Actual results could differ materially from those expressed or implied. Important factors that could make a<br />
difference to the Company’s operations include, among others, economic conditions affecting demand /<br />
supply and price conditions in the domestic and overseas markets in which the Company operates,<br />
changes in Government regulations, tax laws and other statutes and incidental factors.