Linearization of the Bradford Protein Assay Increases Its Sensitivity ...
Linearization of the Bradford Protein Assay Increases Its Sensitivity ...
Linearization of the Bradford Protein Assay Increases Its Sensitivity ...

Create successful ePaper yourself
Turn your PDF publications into a flip-book with our unique Google optimized e-Paper software.
ANALYTICAL BIOCHEMISTRY 236, 302–308 (1996)<br />
ARTICLE NO. 0171<br />
<strong>Linearization</strong> <strong>of</strong> <strong>the</strong> <strong>Bradford</strong> <strong>Protein</strong> <strong>Assay</strong> <strong>Increases</strong> <strong>Its</strong><br />
<strong>Sensitivity</strong>: Theoretical and Experimental Studies<br />
Tsaffrir Zor and Zvi Selinger 1<br />
Department <strong>of</strong> Biological Chemistry and <strong>the</strong> Kuhne Minerva Center for Studies <strong>of</strong> Visual Transduction,<br />
The Hebrew University <strong>of</strong> Jerusalem, Jerusalem 91904, Israel<br />
Received November 20, 1995<br />
struction <strong>of</strong> <strong>the</strong> calibration graph. This nonlinearity<br />
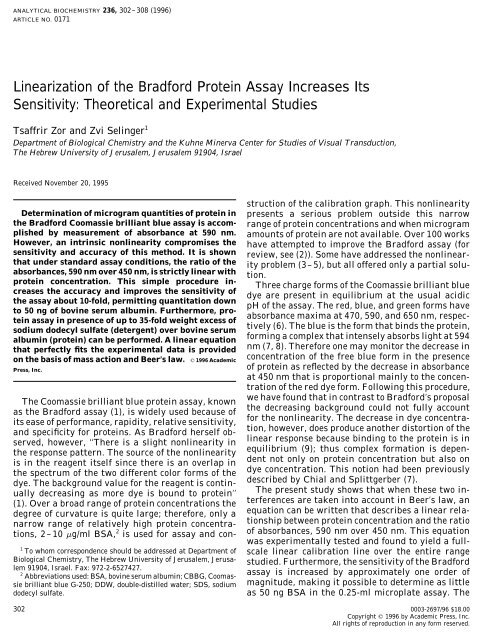
Determination <strong>of</strong> microgram quantities <strong>of</strong> protein in presents a serious problem outside this narrow<br />
<strong>the</strong> <strong>Bradford</strong> Coomassie brilliant blue assay is accom- range <strong>of</strong> protein concentrations and when microgram<br />
plished by measurement <strong>of</strong> absorbance at 590 nm. amounts <strong>of</strong> protein are not available. Over 100 works<br />
However, an intrinsic nonlinearity compromises <strong>the</strong> have attempted to improve <strong>the</strong> <strong>Bradford</strong> assay (for<br />
sensitivity and accuracy <strong>of</strong> this method. It is shown review, see (2)). Some have addressed <strong>the</strong> nonlinearthat<br />
under standard assay conditions, <strong>the</strong> ratio <strong>of</strong> <strong>the</strong> ity problem (3–5), but all <strong>of</strong>fered only a partial soluabsorbances,<br />
590 nm over 450 nm, is strictly linear with tion.<br />
protein concentration. This simple procedure in-<br />
Three charge forms <strong>of</strong> <strong>the</strong> Coomassie brilliant blue<br />
creases <strong>the</strong> accuracy and improves <strong>the</strong> sensitivity <strong>of</strong><br />
dye are present in equilibrium at <strong>the</strong> usual acidic<br />
<strong>the</strong> assay about 10-fold, permitting quantitation down pH <strong>of</strong> <strong>the</strong> assay. The red, blue, and green forms have<br />
to 50 ng <strong>of</strong> bovine serum albumin. Fur<strong>the</strong>rmore, proabsorbance<br />
maxima at 470, 590, and 650 nm, respectein<br />
assay in presence <strong>of</strong> up to 35-fold weight excess <strong>of</strong><br />
sodium dodecyl sulfate (detergent) over bovine serum<br />
tively (6). The blue is <strong>the</strong> form that binds <strong>the</strong> protein,<br />
albumin (protein) can be performed. A linear equation forming a complex that intensely absorbs light at 594<br />
that perfectly fits <strong>the</strong> experimental data is provided nm (7, 8). Therefore one may monitor <strong>the</strong> decrease in<br />
on <strong>the</strong> basis <strong>of</strong> mass action and Beer’s law. 1996 Academic concentration <strong>of</strong> <strong>the</strong> free blue form in <strong>the</strong> presence<br />
Press, Inc.<br />
<strong>of</strong> protein as reflected by <strong>the</strong> decrease in absorbance<br />
at 450 nm that is proportional mainly to <strong>the</strong> concentration<br />
<strong>of</strong> <strong>the</strong> red dye form. Following this procedure,<br />
The Coomassie brilliant blue protein assay, known<br />
we have found that in contrast to <strong>Bradford</strong>’s proposal<br />
as <strong>the</strong> <strong>Bradford</strong> assay (1), is widely used because <strong>of</strong><br />
<strong>the</strong> decreasing background could not fully account<br />
its ease <strong>of</strong> performance, rapidity, relative sensitivity,<br />
for <strong>the</strong> nonlinearity. The decrease in dye concentra-<br />
and specificity for proteins. As <strong>Bradford</strong> herself oblinear<br />
response because binding to <strong>the</strong> protein is in<br />
tion, however, does produce ano<strong>the</strong>r distortion <strong>of</strong> <strong>the</strong><br />
served, however, ‘‘There is a slight nonlinearity in<br />
<strong>the</strong> response pattern. The source <strong>of</strong> <strong>the</strong> nonlinearity<br />
equilibrium (9); thus complex formation is depen-<br />
is in <strong>the</strong> reagent itself since <strong>the</strong>re is an overlap in<br />
dent not only on protein concentration but also on<br />
<strong>the</strong> spectrum <strong>of</strong> <strong>the</strong> two different color forms <strong>of</strong> <strong>the</strong><br />
dye concentration. This notion had been previously<br />
dye. The background value for <strong>the</strong> reagent is contindescribed<br />
by Chial and Splittgerber (7).<br />
ually decreasing as more dye is bound to protein’’ The present study shows that when <strong>the</strong>se two in-<br />
(1). Over a broad range <strong>of</strong> protein concentrations <strong>the</strong> terferences are taken into account in Beer’s law, an<br />
degree <strong>of</strong> curvature is quite large; <strong>the</strong>refore, only a equation can be written that describes a linear rela-<br />
narrow range <strong>of</strong> relatively high protein concentra<strong>of</strong><br />
absorbances, 590 nm over 450 nm. This equation<br />
tionship between protein concentration and <strong>the</strong> ratio<br />
tions, 2–10 mg/ml BSA, 2 is used for assay and conwas<br />
experimentally tested and found to yield a fullscale<br />
linear calibration line over <strong>the</strong> entire range<br />
1 To whom correspondence should be addressed at Department <strong>of</strong><br />
Biological Chemistry, The Hebrew University <strong>of</strong> Jerusalem, Jerusa- studied. Fur<strong>the</strong>rmore, <strong>the</strong> sensitivity <strong>of</strong> <strong>the</strong> <strong>Bradford</strong><br />
lem 91904, Israel. Fax: 972-2-6527427.<br />
assay is increased by approximately one order <strong>of</strong><br />
2 Abbreviations used: BSA, bovine serum albumin; CBBG, Coomasmagnitude,<br />
making it possible to determine as little<br />
sie brilliant blue G-250; DDW, double-distilled water; SDS, sodium<br />
dodecyl sulfate.<br />
as 50 ng BSA in <strong>the</strong> 0.25-ml microplate assay. The<br />
302 0003-2697/96 $18.00<br />
Copyright 1996 by Academic Press, Inc.<br />
All rights <strong>of</strong> reproduction in any form reserved.
improved sensitivity results also in reduced interference<br />
by detergents.<br />
MATERIALS AND METHODS<br />
Reagents<br />
Coomassie brilliant blue G-250 (CBBG) was obtained<br />
from Merck. Crystallized bovine serum albumin was<br />
purchased from Schwarz/Mann (Spring Valley, NY). a-<br />
Chymotrypsin (C-3142) was obtained from Sigma. All<br />
reagents were <strong>of</strong> <strong>the</strong> highest available grade. Deionized,<br />
double-distilled water (DDW) was used. <strong>Protein</strong>s<br />
were dissolved in DDW.<br />
LINEARIZATION OF BRADFORD PROTEIN ASSAY 303<br />
Dye Reagent<br />
Dye reagent was prepared according to <strong>Bradford</strong> (1).<br />
Coomassie brilliant blue G-250 (100 mg) was dissolved<br />
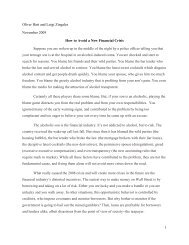
in 50 ml 95% ethanol. A volume <strong>of</strong> 100 ml phosphoric FIG. 1. Spectra <strong>of</strong> <strong>the</strong> dye–protein complex (A) and <strong>the</strong> dye (CBBG)<br />
acid (85% w/v) was added and <strong>the</strong> solution was diluted alone (B) were obtained by addition <strong>of</strong> 0.8 ml dye reagent to 0.2 ml<br />
to 1 liter with DDW and immediately filtered twice. <strong>of</strong> 5 mg/ml BSA (A) or to 0.2 ml DDW (B). The length <strong>of</strong> <strong>the</strong> optical<br />
The dye reagent was stored at 4C, protected from light. path is 0.1 cm in A and 1 cm in B. The arrows point at <strong>the</strong> absorbance<br />
maxima <strong>of</strong> 594 and 466 nm.<br />
Only when specifically mentioned in <strong>the</strong> text or figure<br />
legend, dye reagent from Bio-Rad was used.<br />
with <strong>the</strong> protein, and <strong>the</strong> green form that peaks at 650<br />
<strong>Protein</strong> Determination<br />
nm but absorbs significantly at 590 nm, <strong>the</strong> l max <strong>of</strong> <strong>the</strong><br />
1-ml assay. <strong>Protein</strong> determination was performed dye–protein complex (6). Since <strong>the</strong> dye–protein comwith<br />
a slight modification to <strong>the</strong> original assay (1). A plex does not absorb at 466 nm, it was possible to test<br />
volume <strong>of</strong> 0.8 ml dye reagent was added to duplicate <strong>Bradford</strong>’s suggestion (1) that <strong>the</strong> nonlinearity <strong>of</strong> <strong>the</strong><br />
0.2-ml protein samples in disposable plastic cuvettes, protein calibration curve is due to a decrease in <strong>the</strong><br />
<strong>the</strong> tube content was thoroughly mixed, and ab<strong>the</strong><br />
protein when protein concentrations are increased.<br />
background value <strong>of</strong> <strong>the</strong> reagent as more dye binds to<br />
sorbance was measured after 5–60 min against DDW<br />
as blank. All protein concentrations shown correspond Beer’s law states that A Å ecl, where A is <strong>the</strong> ab-<br />
to <strong>the</strong> final assay volume.<br />
sorbance at any wavelength, e is <strong>the</strong> molar absorption<br />
0.25 ml microplate assay. The procedure was percentration<br />
<strong>of</strong> <strong>the</strong> chromophore, and l is length <strong>of</strong> <strong>the</strong><br />
coefficient at <strong>the</strong> same wavelength, c is <strong>the</strong> molar conformed<br />
as described for <strong>the</strong> 1-ml assay, reducing all<br />
volumes to 1 optical path in centimeters. Using Beer’s law, <strong>the</strong> ex-<br />
4.<br />
pression for <strong>the</strong> concentration-corrected blank is <strong>the</strong><br />
noncorrected blank (A 594 without protein) multiplied by<br />
Equipment<br />
<strong>the</strong> ratio <strong>of</strong> absorbances at 466 nm with and without<br />
A Varian Cary 1E UV/VIS spectrophotometer was protein. We found that subtraction <strong>of</strong> a corrected blank<br />
used for <strong>the</strong> 1-ml assay. Microplate autoreader EL309 from A 594 obtained in <strong>the</strong> presence <strong>of</strong> 0–20 mg/ml BSA<br />
<strong>of</strong> BIO-TEK Instruments was used for <strong>the</strong> 0.25-ml does not fully linearize <strong>the</strong> response curve, indicating<br />
assay.<br />
an additional cause for <strong>the</strong> nonlinearity (results not<br />
shown).<br />
Since dye–protein complex formation is not limited<br />
RESULTS AND DISCUSSION<br />
by <strong>the</strong> amount <strong>of</strong> protein, yet <strong>the</strong> dye is not in a large<br />
Theoretical Considerations<br />
excess (10), we concluded that <strong>the</strong> formation <strong>of</strong> <strong>the</strong> dye–<br />
The spectrum (Fig. 1A) <strong>of</strong> <strong>the</strong> dye–protein complex protein complex will not be proportional to protein con-<br />
(l max Å 594 nm) was obtained by addition <strong>of</strong> <strong>the</strong> dye centration and will be dependent on dye concentration<br />
reagent to a large molar excess <strong>of</strong> protein. Under this and on <strong>the</strong> coefficient <strong>of</strong> <strong>the</strong> equilibrium reaction<br />
condition, <strong>the</strong>re are practically no free dye molecules,<br />
as demonstrated by <strong>the</strong> complete disappearance <strong>of</strong> <strong>the</strong> D / P } K DP [1]<br />
red dye form that absorbs at l max Å 466 nm (Fig. 1B).<br />
The free dye exists as <strong>the</strong> acid–base equilibrium <strong>of</strong> <strong>the</strong> in which P is <strong>the</strong> protein and D is <strong>the</strong> dye. The equilibrium<br />
constant is defined red (l max Å 466 nm) form, <strong>the</strong> blue form that reacts<br />
as
304<br />
ZOR AND SELINGER<br />
K Å<br />
[DP]<br />
[nP] 1 [D] 1 f b<br />
[2]<br />
compatible with <strong>the</strong> microplate autoreader instrument.<br />
It should be pointed out that e D , at both 590 and 450<br />
nm, is a weighted average <strong>of</strong> <strong>the</strong> molar absorption coefficients<br />
<strong>of</strong> <strong>the</strong> three dye forms. The addition <strong>of</strong> protein<br />
does not change <strong>the</strong> combined e D since <strong>the</strong> fraction <strong>of</strong><br />
each dye form depends only on pH and not on total<br />
concentration or consumption <strong>of</strong> one dye form. The substitution<br />
<strong>of</strong> Eq. [7] into Eq. [6] results in<br />
where f b , <strong>the</strong> fraction <strong>of</strong> <strong>the</strong> reactive blue dye form,<br />
equals 0.053 under assay conditions (6) and n is <strong>the</strong><br />
number <strong>of</strong> binding sites on a protein molecule, being<br />
primarily arginine residues (8). For simplicity <strong>the</strong> bind-<br />
ing sites are assumed to be homogeneous and noninteracting,<br />
although binding has some unclear dependence<br />
on macromolecular structure (8). Substituting <strong>the</strong> conservation<br />
equation <strong>of</strong> protein binding sites, [nP] t Å [nP]<br />
/ [DP], where t indicates total, into Eq. [2] and rearrangement<br />
yields<br />
[DP] Å<br />
K 1 f b 1 [D]<br />
1 / K 1 f b 1 [D] 1 [nP] t. [3]<br />
Fur<strong>the</strong>r rearrangement gives <strong>the</strong> following expression<br />
for <strong>the</strong> complex concentration:<br />
[DP] Å<br />
1<br />
<br />
1<br />
K 1 f b 1 [D] / 1 1 [nP] t. [4]<br />
A 590 Å e DP<br />
590 1 l 1 [DP] / e D 590 1 l 1 [D], [5]<br />
where <strong>the</strong> superscript <strong>of</strong> e defines <strong>the</strong> compound and<br />
<strong>the</strong> subscript refers to <strong>the</strong> wavelength.<br />
Substitution <strong>of</strong> Eq. [4] into Eq. [5] leads to<br />
A 590 Å<br />
A 590 Å<br />
e DP<br />
590 1 l<br />
<br />
e D 450 1 l<br />
K 1 f b 1 A 450<br />
/ 1<br />
which is rearranged to become<br />
A 590<br />
A 450<br />
Å<br />
e DP<br />
1 [nP] t / e D 590 1 l<br />
e D 450 1 l 1 A 450 [8]<br />
590 1 l<br />
<br />
D<br />
e 450 1 l<br />
/ A<br />
K 1 f b<br />
450 1 [nP] t / e 590<br />
D . [9]<br />
e 450<br />
D<br />
The absorbance at 590 nm, composed <strong>of</strong> <strong>the</strong> indepen-<br />
dent absorbances <strong>of</strong> both <strong>the</strong> dye–protein complex and<br />
<strong>the</strong> free dye, is given by<br />
To reach a linear equation, in which protein concentration<br />
is <strong>the</strong> X variable, <strong>the</strong> following assumption is<br />
made<br />
e D 450 1 l<br />
K 1 f b<br />
A 450 . [10]<br />
Substitution <strong>of</strong> Eqs. [2] and [7] into Expression [10]<br />
and rearrangement gives<br />
[nP]<br />
1. [11]<br />
[DP]<br />
e DP<br />
590 1 l<br />
<br />
1<br />
K 1 f b 1 [D] / 1 The critical assumption given by Expressions [10]<br />
and [11] was verified by <strong>the</strong> elegant experiments <strong>of</strong><br />
Splittgerber and colleagues (6, 9). According to <strong>the</strong>se<br />
1 [nP] t / e D 590 1 l 1 [D]. [6] experiments, <strong>the</strong> ratio [nP]/[DP] equals approximately<br />
4 when considering only high-affinity binding sites. In<br />
this case, <strong>the</strong> value <strong>of</strong> <strong>the</strong> expression preceding [nP] t<br />
in Eq. [9] changes by less than 5% over <strong>the</strong> protein<br />
concentrations range assayed. Fur<strong>the</strong>rmore, when con-<br />
sidering low-affinity binding sites, <strong>the</strong> ratio [nP]/[DP]<br />
is indeed far larger than 1 as assumed in Expression<br />
[11] and <strong>the</strong> value <strong>of</strong> <strong>the</strong> expression preceding [nP] t<br />
in Eq. [9] is practically constant. Since under assay<br />
conditions a substantial part <strong>of</strong> <strong>the</strong> absorbance is contributed<br />
by low-affinity binding sites (9), it can be con-<br />
A 450 Å e 450 D 1 l 1 [D]. [7] cluded that <strong>the</strong> assumption given by Expressions [10]<br />
and [11] is fully justified.<br />
According to Eq. [6], both components <strong>of</strong> A 590 depend<br />
upon free dye concentration. Thus <strong>the</strong> correction for<br />
<strong>the</strong> absorbance <strong>of</strong> <strong>the</strong> free dye alone will not lead to<br />
linear dependence between A 590 and protein concentration.<br />
Because <strong>the</strong> dye–protein complex has no contribution<br />
to <strong>the</strong> absorbance at 450 nm, [D] can be calculated<br />
as follows:<br />
This wavelength, like 590 nm, was chosen ra<strong>the</strong>r Therefore, when assuming relationship [10], Expresthan<br />
<strong>the</strong> l max (466 and 594 nm) to make <strong>the</strong> assay sion [9] becomes
A 590<br />
Å e 590 DP 1 K 1 f b 1 n<br />
1 [P]<br />
A 450 e 450<br />
D t / e 590<br />
D . [12]<br />
e 450<br />
D<br />
LINEARIZATION OF BRADFORD PROTEIN ASSAY 305<br />
Equation [12] predicts a linear relationship between<br />
<strong>the</strong> ratio A 590 /A 450 and total protein concentration, [P] t ,<br />
when <strong>the</strong> binding is far from saturation (Expression [11]).<br />
As explained above, for simplicity <strong>the</strong> binding sites<br />
were assumed to be homogeneous and noninteracting.<br />
Under assay conditions, however, binding to a heterogeneous<br />
population <strong>of</strong> binding sites occurs (9). Yet, we<br />
found that <strong>the</strong> same form <strong>of</strong> linear equation (Eq. [12])<br />
is obtained. The slope <strong>of</strong> this equation includes <strong>the</strong> parameters<br />
<strong>of</strong> all different binding sites: equilibrium constants<br />
(K) and number <strong>of</strong> binding sites on a protein<br />
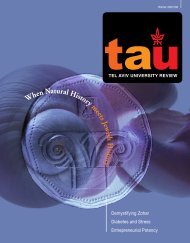
molecule (n). FIG. 3. Plots for <strong>the</strong> free CBBG dye at 450 nm (l) and at 590 nm<br />
() under <strong>the</strong> usual assay conditions.<br />
Experimental Support <strong>of</strong> <strong>the</strong> Theory<br />
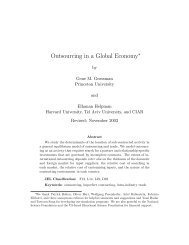
The following observations are consistent with <strong>the</strong> shows a straight line obtained upon plotting A 590 /A 450<br />
linear Eq. [12]:<br />
as a function <strong>of</strong> BSA concentration.<br />
(a) While <strong>the</strong> regular <strong>Bradford</strong> calibration graph<br />
(Fig. 2A) markedly deviates from linearity, Fig. 2B<br />
(b) The <strong>the</strong>oretical equation predicts that <strong>the</strong> linear<br />
curve will intercept <strong>the</strong> Y axis at a value that equals<br />
<strong>the</strong> ratio <strong>of</strong> <strong>the</strong> dye’s molar absorption coefficient at<br />
590 nm over that at 450 nm. These constants were<br />
determined and found to be 5200 and 11,300 M 01 cm 01 ,<br />
respectively (Fig. 3). The ratio <strong>of</strong> <strong>the</strong> molar absorption<br />
coefficients is 0.46 { 0.01. This value is in excellent<br />
agreement with <strong>the</strong> experimental data <strong>of</strong> <strong>the</strong> calibration<br />
graph which is 0.48 { 0.02 (average <strong>of</strong> 15 independent<br />
determinations, cf. Figs. 2B, 4, 5, and 6)<br />
Calibration Graph<br />
The regular <strong>Bradford</strong> calibration graph (Fig. 2A)<br />
shows distinct curvature in <strong>the</strong> range <strong>of</strong> 0–20 mg/ml<br />
FIG. 2. Calibration graphs <strong>of</strong> 0–20 mg/ml BSA. (A) The conventional<br />
<strong>Bradford</strong> calibration graph. The linear regression line was<br />
calculated for <strong>the</strong> narrow range <strong>of</strong> 2–10 mg/ml BSA (). (B) Linearized<br />
<strong>Bradford</strong> calibration graph. The same set <strong>of</strong> samples was used<br />
for both plots.<br />
FIG. 4. <strong>Linearization</strong> <strong>of</strong> <strong>the</strong> <strong>Bradford</strong> calibration graph in <strong>the</strong> 0.25-<br />
ml microplate assay. The straight line was produced by <strong>the</strong> values<br />
derived <strong>of</strong> 7 points using 0–4 mg BSA. Only <strong>the</strong> range <strong>of</strong> 0–100 ng<br />
BSA is shown for <strong>the</strong> demonstration <strong>of</strong> sensitivity. The slope <strong>of</strong> <strong>the</strong><br />
graph is smaller than that <strong>of</strong> Fig. 2B by approximately 250 due to<br />
<strong>the</strong> 4-fold smaller protein quantities and <strong>the</strong> 3 orders <strong>of</strong> magnitude<br />
difference in X-axis units.
306<br />
ZOR AND SELINGER<br />
The procedure described can be applied to any standard<br />
protein, as shown in Fig. 5. Linear curves were<br />
obtained for both a-chymotrypsin and BSA, while <strong>the</strong><br />
response <strong>of</strong> BSA is 2.8-fold higher than <strong>the</strong> response <strong>of</strong><br />
a-chymotrypsin, a value that is in very good agreement<br />
with previous reports (11, 12). For both proteins <strong>the</strong><br />
regular calibration graph was nonlinear (results not<br />
shown). It should be kept in mind that protein determination<br />
is always relative to <strong>the</strong> standard and not absolute.<br />
BSA is a commonly used standard in <strong>the</strong> <strong>Bradford</strong><br />
assay because <strong>of</strong> its high color yield and availability<br />
while o<strong>the</strong>r standards may more closely resemble <strong>the</strong><br />
proteins under determination (Fig. 5 and Ref. (13)).<br />
FIG. 5. <strong>Linearization</strong> <strong>of</strong> <strong>the</strong> <strong>Bradford</strong> calibration graph using a- Determination <strong>of</strong> Unknown <strong>Protein</strong> Samples<br />
chymotrypsin (l) and BSA (). The linear equations are Y Å 0.053X<br />
/ 0.474 with R 2 Å 0.998 for a-chymotrypsin and Y Å 0.146X / 0.457 Although Fig. 4 shows that 0.2 mg/ml BSA can be<br />
with R 2 Å 0.999 for BSA.<br />
accurately determined, <strong>the</strong> limits <strong>of</strong> detection <strong>of</strong> an unknown<br />
protein sample must also be established. To this<br />
end, rabbit serum was diluted to give 3–110 nl per<br />
BSA. However, in a curved graph, a semilinear relationship<br />
can be seen over a narrow range <strong>of</strong> points. The<br />
‘‘close to linear’’ range <strong>of</strong> <strong>the</strong> <strong>Bradford</strong> calibration graph<br />
is considered to be 2–10 mg/ml BSA since smaller protein<br />
concentrations are characterized by a small signal<br />
to noise ratio and <strong>the</strong>refore cannot be accurately determined<br />
from a nonlinear graph. It is important to note<br />
that <strong>the</strong> linear regression in Fig. 2A was calculated<br />
using only 5 points (shown as squares) within <strong>the</strong> ‘‘linear<br />
range.’’ Figure 2B shows that a linear correlation<br />
exists between A 590 /A 450 and BSA concentration in <strong>the</strong><br />
range <strong>of</strong> 0–20 mg/ml, for <strong>the</strong> same set <strong>of</strong> samples used<br />
in plotting <strong>the</strong> nonlinear Fig. 2A. Statistical analysis<br />
gives standard deviations <strong>of</strong> 1.2 and 0.9% <strong>of</strong> error in<br />
<strong>the</strong> narrow range <strong>of</strong> 2–10 mg/ml BSA, for <strong>the</strong> regular<br />
and corrected calibration curves, respectively. The correlation<br />
parameter, R 2 , is increased from 0.976 in Fig.<br />
2A to 0.999 in Fig. 2B. The difference is even more<br />
obvious in <strong>the</strong> full-scale graphs, where <strong>the</strong> standard<br />
deviation is decreased from 3.9% error for <strong>the</strong> regular<br />
calibration curve to 1.2% error for <strong>the</strong> corrected calibration<br />
curve. The statistical analysis proves <strong>the</strong> improvement<br />
in linearity over <strong>the</strong> standard concentrations<br />
range and demonstrates <strong>the</strong> linear relationship between<br />
A 590 /A 450 ratio and protein concentration over<br />
<strong>the</strong> entire range, 0–20 mg/ml.<br />
In order to determine <strong>the</strong> limits <strong>of</strong> sensitivity, an<br />
extended range <strong>of</strong> protein concentrations was tested. A<br />
quantity <strong>of</strong> 0.2 mg BSA can be accurately determined<br />
in <strong>the</strong> 1-ml assay while Fig. 4 shows that an amount<br />
as low as 50 ng BSA is accurately determined in <strong>the</strong> FIG. 6. Calibration graphs in <strong>the</strong> absence () or presence (l) <strong>of</strong><br />
0.25-ml microplate assay. The linear relationship exto<br />
0.002% SDS. A volume <strong>of</strong> 0.8 ml dye reagent from Bio-Rad was added<br />
0.2 ml protein sample without () or with (l) SDS. (A) Conven-<br />
ists up to 20 mg BSA in <strong>the</strong> 1-ml assay and up to 4 mg<br />
tional <strong>Bradford</strong> calibration graph. (B) Linearized <strong>Bradford</strong> calibra-<br />
BSA in <strong>the</strong> microplate assay. It can be concluded that<br />
<strong>the</strong> procedure presented here produces a full-scale linear<br />
graph.<br />
tion graph. The same set <strong>of</strong> samples was used for both plots. The<br />
linear equations are Y Å 0.205X / 0.457 with R 2 Å 1.000 () and Y<br />
Å 0.070X / 0.452 with R 2 Å 0.999 (l).
LINEARIZATION OF BRADFORD PROTEIN ASSAY 307<br />
TABLE 1<br />
Determination <strong>of</strong> Serum <strong>Protein</strong> a<br />
Serum protein c<br />
SD percentage f<br />
mg/ml in <strong>the</strong> serum e<br />
No. Serum (ml) A 590 /A 450<br />
b<br />
mg in assay d By one point By slope e By one point By slope e<br />
1 0 0.462<br />
2 0.003 0.480 0.17 51.0 53.0 7.3 4.8<br />
3 0.010 0.530 0.57 61.5 62.8 5.7 7.3<br />
4 0.014 0.547 0.80 54.9 57.3 2.4 0.6<br />
5 0.070 0.898 3.98 57.0 57.1 0.1 0.2<br />
6 0.110 1.144 6.26 56.8 56.9 0.1 0<br />
a<br />
1-ml assay.<br />
b Average <strong>of</strong> duplicate samples.<br />
c<br />
Equation <strong>of</strong> <strong>the</strong> BSA standard curve: Y Å 0.109X / 0.463.<br />
d The concentration used for <strong>the</strong> calculation is 56.9 mg/ml, determined by <strong>the</strong> ratio <strong>of</strong> <strong>the</strong> slopes.<br />
e The slope was determined by <strong>the</strong> curve <strong>of</strong> samples 1–N (N Å 2–6).<br />
f Standard deviation <strong>of</strong> <strong>the</strong> concentration from 56.9 mg/ml.<br />
assay and <strong>the</strong>se were determined in parallel to BSA in <strong>of</strong> detergents from <strong>the</strong> sample (15). The interference<br />
a standard calibration curve. The linear equations <strong>of</strong> becomes evident when final SDS concentration exceeds<br />
BSA and serum are Y Å 0.109X / 0.463 and Y Å 6.20X 0.002% (15). Diluting <strong>the</strong> solubilized protein sample in<br />
/ 0.463, respectively, with correlation parameters R 2 order to reach noninterfering detergent concentration<br />
<strong>of</strong> 0.996 and 0.999, respectively. The Y values are A 590 / frequently results in protein content that is below <strong>the</strong><br />
A 450 and <strong>the</strong> X values are micrograms <strong>of</strong> BSA or microliters<br />
threshold <strong>of</strong> detection. Figures 6A and 6B show <strong>the</strong><br />
<strong>of</strong> serum. In general, <strong>the</strong> most accurate method regular and corrected calibration graphs, respectively,<br />
to determine protein concentration in an unknown in presence <strong>of</strong> 0.002% SDS. A linear relationship exists<br />
sample is to divide <strong>the</strong> slope <strong>of</strong> several sample dilutions between <strong>the</strong> ratio A 590 /A 450 and protein quantity in<br />
by <strong>the</strong> slope <strong>of</strong> <strong>the</strong> calibration curve. The product representing<br />
both <strong>the</strong> absence and presence <strong>of</strong> 0.002% SDS. It is<br />
concentration units is <strong>the</strong> protein concentra- <strong>the</strong>refore possible to determine as little as 0.3 mg/ml<br />
tion <strong>of</strong> <strong>the</strong> unknown sample before dilution. Table 1 <strong>of</strong> protein solubilized by 1% SDS. The response to pro-<br />
shows <strong>the</strong> results <strong>of</strong> <strong>the</strong>se calculations. The error is tein is reduced by <strong>the</strong> detergent, while <strong>the</strong> background<br />
increasing gradually from 0.1% for 6.26 mg up to 7.3% is constant. However, <strong>the</strong> slope <strong>of</strong> <strong>the</strong> A 590 /A 450 curve<br />
for <strong>the</strong> sample containing only 0.17 mg in <strong>the</strong> 1-ml in presence <strong>of</strong> 0.002% SDS is about equal to <strong>the</strong> slope<br />
assay. The error is markedly reduced when <strong>the</strong> concentration<br />
<strong>of</strong> <strong>the</strong> A 590 curve in <strong>the</strong> absence <strong>of</strong> detergents (compare<br />
is calculated by <strong>the</strong> slope <strong>of</strong> <strong>the</strong> unknown sam- Figs. 2A, 2B, and 6B). Higher SDS concentrations con-<br />
ple curve made <strong>of</strong> 2–6 points, including <strong>the</strong> blank. Table<br />
siderably reduce <strong>the</strong> response to protein and increase<br />
1 shows that it suffices to determine <strong>the</strong> slope <strong>the</strong> background. Therefore, final SDS concentration<br />
between one point <strong>of</strong> protein concentration and <strong>the</strong> that exceeds 0.002% does not allow protein determina-<br />
blank value at zero protein concentration, to signifi- tion. These findings and Eq. [12] are consistent with<br />
cantly improve <strong>the</strong> accuracy (Table 1, line 2). Usually, previous suggestion (16) that a high SDS concentration<br />
above 1 mg protein, calculation by one point is accurate interferes with <strong>the</strong> <strong>Bradford</strong> assay by stabilizing <strong>the</strong><br />
enough and a slope is not needed. Similar results were green dye form while a low SDS concentration inter-<br />
obtained in <strong>the</strong> microplate assay, testing 42–1560 ng feres by competing with <strong>the</strong> dye on binding to <strong>the</strong> protein.<br />
protein <strong>of</strong> rabbit serum, although <strong>the</strong> errors were somewhat<br />
As shown in Fig. 6B, <strong>the</strong> latter interference can<br />
higher, due to instrumental optical limitations. be eliminated by measurement <strong>of</strong> A 590 /A 450 in <strong>the</strong> presence<br />
<strong>of</strong> <strong>the</strong> detergent for both <strong>the</strong> standard and <strong>the</strong><br />
Interference by Detergents<br />
unknown sample.<br />
Detergents are known to interfere with <strong>the</strong> <strong>Bradford</strong><br />
assay (1). <strong>Protein</strong> determination <strong>of</strong> solubilized proteins<br />
CONCLUSIONS<br />
by <strong>Bradford</strong> assay can be carried out when glucopyra- The purpose <strong>of</strong> <strong>the</strong> present study was to evaluate <strong>the</strong><br />
noside detergents are used (14) or following exclusion reasons for <strong>the</strong> nonlinearity <strong>of</strong> <strong>the</strong> <strong>Bradford</strong> assay in
308<br />
ZOR AND SELINGER<br />
order to develop a procedure that would yield a linear considerations. We hope that <strong>the</strong> improved accuracy<br />
relationship between absorbance and protein concenence<br />
and sensitivity and <strong>the</strong> partial elimination <strong>of</strong> interfer-<br />
tration. We have found that <strong>the</strong> nonlinearity is due to<br />
by detergents will promote a more widespread use<br />
two factors; both <strong>of</strong> <strong>the</strong>m originate from <strong>the</strong> fact that <strong>of</strong> <strong>the</strong> assay.<br />
<strong>the</strong> free dye concentration is decreased by protein addition.<br />
The outcome is a continuous decrease in <strong>the</strong> absorbance<br />
ACKNOWLEDGMENTS<br />
contributed by <strong>the</strong> free reagent on <strong>the</strong> one We thank Dr. M. Schramm, Dr. S. Brawn, Dr. O. Heichal, and M.<br />
hand and a reduced dye–protein complex formation on Danin for helpful comments on <strong>the</strong> manuscript. The author’s research<br />
<strong>the</strong> o<strong>the</strong>r hand. An equation describing absorbance at<br />
was supported by grants from <strong>the</strong> National Institute <strong>of</strong> Health<br />
590 nm, taking into account <strong>the</strong>se two factors, demontion.<br />
(Ey-03529) and <strong>the</strong> United States–Israel Binational Science Foundastrates<br />
a linear relationship between <strong>the</strong> ratio <strong>of</strong> absorbances<br />
at 590 nm over 450 nm and total protein<br />
concentration. The applicability <strong>of</strong> this equation for <strong>the</strong> REFERENCES<br />
<strong>Bradford</strong> assay was established by demonstration <strong>of</strong> an 1. <strong>Bradford</strong>, M. M. (1976) Anal. Biochem. 72, 248–254.<br />
extended linear range between 0.2 and 20 mg/ml BSA, 2. Gasparov, V. S., and Degtyar, V. G. (1994) Biochemistry (Mos-<br />
cow) 59, 563–572.<br />
indicating an improvement <strong>of</strong> sensitivity <strong>of</strong> <strong>the</strong> assay<br />
3. Bearden, J. C. (1978) Biochim. Biophys. Acta 533, 525–529.<br />
by one order <strong>of</strong> magnitude. The modified calibration<br />
4. Stoscheck, C. M. (1990) Anal. Biochem. 184, 111–116.<br />
graph makes it possible to accurately determine 50 ng<br />
5. Splittgerber, A. G., and Sohl, J. (1989) Anal. Biochem. 179, 198–<br />
BSA in <strong>the</strong> 0.25-ml microplate assay or 0.2 mg BSA in 201.<br />
<strong>the</strong> 1-ml assay. 6. Chial, H. J., Thompson, H. B., and Splittgerber, A. G. (1993)<br />
<strong>Protein</strong> determination by measuring A 590 /A 450 ratio Anal. Biochem. 209, 258–266.<br />
is more accurate than a single measurement <strong>of</strong> A 590 not 7. Chial, H. J., and Splittgerber, A. G. (1993) Anal. Biochem. 213,<br />
only due to <strong>the</strong> transformation from nonlinearity to 362–369.<br />
linearity, but also due to <strong>the</strong> higher slope <strong>of</strong> <strong>the</strong> re- 8. Compton, S. J., and Gones, C. G. (1985) Anal. Biochem. 151,<br />
369–374.<br />
sulting calibration curve obtained. In <strong>the</strong> conventional<br />
9. Congdon, R. W., Muth, G. W., and Splittgerber, A. G. (1993)<br />
curve <strong>the</strong> slope within <strong>the</strong> concentration range assayed Anal. Biochem. 213, 407–413.<br />
(2–10 mg/ml) is lower than <strong>the</strong> actual slope which 10. Read, S. M., and Northcote, D. H. (1981) Anal. Biochem. 116,<br />
should be measured close to <strong>the</strong> Y axis since <strong>the</strong> slope 53–64.<br />
is continuously decreasing with increasing protein con- 11. Bio-Rad <strong>Protein</strong> <strong>Assay</strong> (1994) Bio-Rad Laboratories, Richmond,<br />
centrations. Moreover, as A 590 is increasing and A 450 is CA.<br />
decreasing with higher protein quantities, <strong>the</strong> ratio 12. Davis, E. M. (1988) Am. Biotech. Lab. 6, 28–37.<br />
A 13. Tal, M., Silberstein, A., and Nusser, E. (1985) J. Biol. Chem.<br />
590 /A 450 is more sensitive to changes in protein concen-<br />
260, 9976–9980.<br />
tration than ei<strong>the</strong>r <strong>of</strong> <strong>the</strong> absorbances alone. This is<br />
14. Fanger, B. O. (1987) Anal. Biochem. 162, 11–17.<br />
expressed in <strong>the</strong> slope <strong>of</strong> <strong>the</strong> calibration curve.<br />
15. Pande, S. V., and Murthy, M. S. (1994) Anal. Biochem. 220, 424–<br />
In conclusion, <strong>the</strong> experimental demonstration <strong>of</strong> a 426.<br />
linearized <strong>Bradford</strong> calibration graph that intercepts 16. Gupta, M., and Nainawatee, H. S. (1988) Indian J. Exp. Biol.<br />
<strong>the</strong> Y axis at e 590 /e 450 strongly supports our <strong>the</strong>oretical 26, 140–141.