Active Trader User Guide - TD Waterhouse
Active Trader User Guide - TD Waterhouse
Active Trader User Guide - TD Waterhouse

You also want an ePaper? Increase the reach of your titles
YUMPU automatically turns print PDFs into web optimized ePapers that Google loves.
ORDER ENTRY GUIDELINES FOR RETAIL DIRECT MARKET ACCESS CLIENTS................... 4<br />
BACKGROUND: THE UNIVERSAL MARKET INTEGRITY RULES ................................................................ 4<br />
GENERAL ORDER ENTRY REQUIREMENTS: PROHIBITION ON ABUSIVE TRADING ................................. 4<br />
1. ACTIVE TRADER INSTALLATION..................................................................................................... 6<br />
SYSTEM REQUIREMENTS OVERVIEW........................................................................................................ 6<br />
INSTALLING FROM THE WEB ..................................................................................................................... 7<br />
ACTIVE TRADER UPDATE UTILITY ............................................................................................................ 8<br />
STARTING ACTIVE TRADER AND LOGGING IN .......................................................................................... 9<br />
2. MENUS, TOOL BARS, AND ICONS................................................................................................. 10<br />
BASIC NAVIGATION IN ACTIVE TRADER ................................................................................................. 10<br />
FILE MENU............................................................................................................................................... 11<br />
SETTINGS................................................................................................................................................. 12<br />
Colours section of the Settings window .............................................................................................. 13<br />
General Setup section of the Settings window ....................................................................................14<br />
Highlighted ECN’s.............................................................................................................................. 15<br />
Options section of the Setting window ................................................................................................ 15<br />
Orders section of the Settings window................................................................................................ 16<br />
Quotes section of the Settings window................................................................................................ 18<br />
HELP MENU ............................................................................................................................................. 20<br />
NAVIGATOR TOOL BAR........................................................................................................................... 21<br />
QUICK START TOOL BAR........................................................................................................................ 22<br />
WINDOW MENU ....................................................................................................................................... 23<br />
3. QUOTES AND NEWS.......................................................................................................................... 24<br />
ENTERING A SYMBOL.............................................................................................................................. 24<br />
LEVEL I DATA .......................................................................................................................................... 25<br />
LEVEL II DATA......................................................................................................................................... 26<br />
TIME AND SALES PRINTS ........................................................................................................................ 27<br />
THE BOOK BOX....................................................................................................................................... 28<br />
OPTION BOX............................................................................................................................................ 29<br />
THE OPTION MONTAGE........................................................................................................................... 30<br />
OPTION “GREEKS” ................................................................................................................................. 31<br />
MARKET VIEW ......................................................................................................................................... 32<br />
INDEX VIEW.............................................................................................................................................. 34<br />
TOP PERFORMER LIST ............................................................................................................................ 35<br />
SYMBOL LOOKUP.................................................................................................................................... 36<br />
NEWS WINDOW ....................................................................................................................................... 37<br />
4. ORDER EXECUTION BOX ................................................................................................................. 38<br />
PLACING A STOCK ORDER...................................................................................................................... 39<br />
Market Restrictions............................................................................................................................. 42<br />
PLACING AN OPTION ORDER .................................................................................................................. 43<br />
5. THE ACCOUNT BOX........................................................................................................................... 45<br />
ACCOUNT BOX OVERVIEW...................................................................................................................... 45<br />
ACCOUNT ACTIVITY - OPEN POSITIONS ................................................................................................. 46<br />
ACCOUNT ACTIVITY - CLOSED POSITIONS ............................................................................................. 47<br />
ACCOUNT HISTORY - ORDER HISTORY .................................................................................................. 48<br />
INTERACTING WITH OPEN ORDERS......................................................................................................... 49<br />
MESSAGE WINDOW OVERVIEW ............................................................................................................... 50<br />
MULTI-ACCOUNT MANAGEMENT ............................................................................................................ 51<br />
OPEN ORDER WINDOW OVERVIEW ........................................................................................................ 52<br />
Understanding Margin Excess and Buy Power .................................................................................. 52<br />
2
SETTING ALERTS ON OPEN POSITIONS.................................................................................................. 54<br />
SYSTEM STATUS LIGHTS ........................................................................................................................ 55<br />
6. CHARTS AND STUDIES..................................................................................................................... 56<br />
WORKING WITH ACTIVE TRADER CHARTS ............................................................................................. 56<br />
BASIC CHART SETTINGS......................................................................................................................... 58<br />
DRAWING TREND LINES AND SUPPORT LINES....................................................................................... 61<br />
STUDIES – AVERAGE DIRECTIONAL INDEX (ADX)................................................................................. 63<br />
STUDIES - BOLLINGER BAND (BB)......................................................................................................... 64<br />
STUDIES – MOVING AVERAGE CONVERGENCE DIVERGENCE (MACD)................................................ 65<br />
STUDIES - MOMENTUM (MOM)............................................................................................................... 66<br />
STUDIES - MOVING AVERAGES (MA) ..................................................................................................... 67<br />
STUDIES - RATE OF CHANGE (ROC)...................................................................................................... 68<br />
STUDIES - RELATIVE STRENGTH (RSI) .................................................................................................. 69<br />
STUDIES – STOCHASTICS........................................................................................................................ 70<br />
STUDIES – TRIPLE EXPONENTIAL SMOOTHING OSCILLATOR (TRIX) ................................................... 71<br />
STUDIES – TRUE STRENGTH INDEX (TSI) .............................................................................................. 72<br />
3
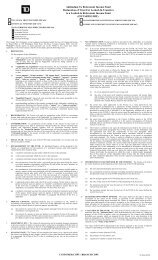
Order Entry <strong>Guide</strong>lines for Retail Direct Market Access Clients<br />
Background: The Universal Market Integrity Rules<br />
The Universal Market Integrity Rules (UMIR) were created to provide a common set of equity<br />
trading rules for the marketplaces that are regulated by Market Regulation Services Inc., including<br />
the Toronto Stock Exchange and the TSX Venture Exchange. These rules exist outside the<br />
rulebooks of the individual exchanges and are primarily designed to regulate or prohibit various<br />
trading practices, including manipulative or deceptive methods of trading, short selling, frontrunning,<br />
best execution obligations, order entry and order exposure, as well as trading halts,<br />
delays and suspensions.<br />
The UMIR were drafted to apply to the “Participating Organizations” (Exchange Members or<br />
Dealers) and “Access Persons” (subscribers to Alternative Trading Systems) and primarily govern<br />
the handling and trading of client and principal orders. Under UMIR and the rules of the various<br />
exchanges, Participating Organizations are considered “gatekeepers” and are entirely<br />
responsible for all orders and trades bearing their dealer number. This is true regardless of<br />
whether the orders were handled by the PO’s trade desk staff or entered directly by a client.<br />
Consequently it is important that Direct Market Access Clients be aware of the general provisions<br />
of UMIR relating to the entry of orders so that they may assist <strong>TD</strong> <strong>Waterhouse</strong> in meeting its<br />
regulatory obligations.<br />
General Order Entry Requirements: Prohibition on Abusive Trading<br />
Section 2 of the Universal Market Integrity Rules deals with Abusive Trading. In particular, UMIR<br />
2.2 contains a general prohibition on manipulative and deceptive activities. The rules forbid the<br />
entry of orders or the execution of trades in situations where it is “known or ought reasonably to<br />
be known” that the orders or trades might create a false or misleading appearance of trading<br />
activity or interest in the security, an artificial ask price, bid price, or sale price. There are three<br />
main regulatory concerns addressed by UMIR 2.2: trades that create artificial volume because<br />
they do not represent a real change of beneficial ownership, trades that create artificial prices<br />
because they do not represent real demand, and orders that are entered without the intention of<br />
effecting a trade.<br />
As noted above, while the Participating Organization is ultimately responsible for compliance with<br />
the UMIR requirements, it is our expectation that clients who have been given Direct Market<br />
Access will respect these rules and policies. UMIR Policy 2.2 provides some examples of order<br />
and trading activity that by their very nature are considered manipulative and deceptive.<br />
Specifically:<br />
• Making a fictitious trade;<br />
• Entering a trade which involves no change in beneficial or economic ownership;<br />
• Effecting trades with the intent of limiting the supply of the security available for<br />
settlement of trades made by others;<br />
• Entering an order with the knowledge that an order or orders of substantially the<br />
same size, time, and price will be entered in the opposite direction (also known as a<br />
“set up” trade);<br />
• Making purchases / bids at successively higher prices or sales / offers at<br />
successively lower prices;<br />
• Establishing a predetermined price or quotation;<br />
• Effecting a high or low closing price or quotation;<br />
• Maintaining the trading price, bid or offer within a pre-determined range;<br />
• Entering an order or a series of orders that are not intended to be executed;<br />
4
• Establishing an artificial price i.e. one not justified by real supply & demand.<br />
A bid price, ask price or sale price for a security may be considered artificial depending on a<br />
variety of factors, including the price of preceding and succeeding trades, recent liquidity in the<br />
security, the time the order is entered, and whether the account for which the order or trade was<br />
entered has any motivation to establish an artificial price. For example, a 100 share buy order in a<br />
security for an account that owns a large quantity of that particular security that is entered very<br />
late in the day would be highly suspicious, particularly if the order betters the bid or results in a<br />
trade that raises the last sale price.<br />
Some additional examples of activities that will be considered suspect are:<br />
• Entering orders for the same account that have the potential to trade against each<br />
other (e.g. entering a market buy order for a security while having a sell order on the<br />
offering side of the market).<br />
• Entering orders, without the intention of trading, in an effort to induce others to trade<br />
(e.g. entering a large bid for a stock just below the current market price that causes<br />
others to believe that there is large buying interest in the stock).<br />
• Purchasing shares so as to be able to create a downtick for the purpose of making a<br />
short sale (Short sales on Canadian markets do not have to be on an “uptick”, merely<br />
the last sale price or better).<br />
• Entering orders that manipulate the Calculated Opening Price of a security in the preopening<br />
and then canceling or altering them just before the opening.<br />
Generally speaking, if you conduct your activities professionally, avoid trading against your own<br />
orders and do not unduly influence the price of a stock you will not be considered to be engaging<br />
in manipulative and deceptive activities. The rules are not meant to inhibit legitimate trading<br />
activity, but rather to ensure that market participants are not creating an unfair market. Any <strong>Active</strong><br />
<strong>Trader</strong> client who has questions about these or any other requirements of the UMIR should<br />
contact a customer service representative.<br />
In addition to the real time monitoring of trading by Market Regulation Services Inc., <strong>TD</strong><br />
<strong>Waterhouse</strong> and its affiliates also conduct regular surveillance of all trading activity. Any client<br />
found to have engaged in any manipulative or deceptive trading activity will have access to ATP<br />
and other EBS systems revoked. The full text of the Universal Market Integrity Rules and the<br />
accompanying policies can be found at Regulation Services’ website. It is recommended that<br />
<strong>Active</strong> <strong>Trader</strong> clients read and understand the provisions relating to Abusive Trading before<br />
entering orders on their own.<br />
http://www.rs.ca/en/mktpol/umir01.asp?printVersion=no&loc1=mktPol&loc2=umir&loc3=01<br />
5
1. <strong>Active</strong> <strong>Trader</strong> Installation<br />
System Requirements Overview<br />
Before installing <strong>Active</strong> <strong>Trader</strong>, be sure your system meets these minimum requirements:<br />
Computer Requirements Recommended Minimum<br />
Operating System Windows XP Windows XP<br />
CPU Pentium IV or higher Pentium III 1 GHz<br />
Memory 1 GB or higher 512 MB<br />
Video Card 32 MB or higher 32 MB<br />
<strong>Active</strong> <strong>Trader</strong> is designed to work with the following Internet connections: DSL, cable modem, or<br />
an alternate high bandwidth solution.<br />
NOTE:<br />
Attempting to operate <strong>Active</strong> <strong>Trader</strong> on a PC which does not meet the minimum requirements<br />
above will result in system instability. Such symptoms as freezing, loss of Internet connectivity,<br />
increased lag times in the delivery of market data, and other negative consequences may be<br />
experienced.<br />
6
Installing from the Web<br />
You can easily install <strong>Active</strong> <strong>Trader</strong> over your internet connection. To install <strong>Active</strong> <strong>Trader</strong> over<br />
the internet, perform the following:<br />
4. Please visit www.tdwaterhouse.ca/activetrader and select the <strong>Active</strong> <strong>Trader</strong> program under<br />
the Download Centre.<br />
5. When prompted, select “Save file to disk”, and select an easy-to-find location for the file (such<br />
as your desktop).<br />
6. After saving the file, double-click on <strong>Active</strong><strong>Trader</strong>.exe to launch the installer.<br />
7. Accept the license agreement, and follow the instructions to complete the installation. By<br />
default, the program will be installed in: “C:\Program Files\<strong>TD</strong> <strong>Waterhouse</strong>\<strong>Active</strong> <strong>Trader</strong>”.<br />
The location can be altered during the installation if desired.<br />
Once the install is complete, the <strong>Active</strong> <strong>Trader</strong> shortcut icon will appear on your desktop, and in<br />
your Windows Start Menu.<br />
7
<strong>Active</strong> <strong>Trader</strong> Update Utility<br />
When a new version or update to <strong>Active</strong> <strong>Trader</strong> is available, a notice will appear when you log<br />
into the system. If this occurs, you will need to run the <strong>Active</strong> <strong>Trader</strong> Update utility to download<br />
the latest version of <strong>Active</strong> <strong>Trader</strong>.<br />
Perform the following to update <strong>Active</strong> <strong>Trader</strong>:<br />
1. If <strong>Active</strong> <strong>Trader</strong> is currently running, close the application by selecting File > Quit from<br />
the main menu. WARNING: <strong>Active</strong> <strong>Trader</strong> must be shut down to properly update to a<br />
new version.<br />
2. From the Windows task-bar (usually located at the bottom of your screen) select Start ><br />
Programs > Nexa > Update <strong>Active</strong> <strong>Trader</strong>. A dialog box asking if you want to update<br />
<strong>Active</strong> <strong>Trader</strong> to the latest version appears.<br />
3. From the confirmation dialog window, click Yes. The Update dialog appears indicating the<br />
download status of the update.<br />
NOTES:<br />
• This process can take a few minutes depending<br />
on the size of the update and the speed of your<br />
internet connection.<br />
• You can abort the update download process by<br />
clicking Cancel.<br />
4. The Update Completed dialog appears when the download is complete. Click OK to close<br />
this window.<br />
5. You can now start the new version of <strong>Active</strong> <strong>Trader</strong>.<br />
8
Starting <strong>Active</strong> <strong>Trader</strong> and Logging In<br />
To start <strong>Active</strong> <strong>Trader</strong>, perform the following:<br />
1. You can start <strong>Active</strong> <strong>Trader</strong> from two locations, perform one of the following:<br />
• To start <strong>Active</strong> <strong>Trader</strong> from the Windows Start menu, select Start > Programs > <strong>TD</strong><br />
<strong>Waterhouse</strong> > <strong>Active</strong> <strong>Trader</strong><br />
• To start <strong>Active</strong> <strong>Trader</strong> from the desktop, locate the <strong>Active</strong> <strong>Trader</strong> shortcut and<br />
double-click it.<br />
2. The <strong>Active</strong> <strong>Trader</strong> login window appears.<br />
3. In the Connect ID field, type your Connect ID.<br />
4. In the Password field, type your password.<br />
5. Click the Options button if you want to change the network or news server address,<br />
proxy server settings, language, or the look and feel scheme (skin). The Login window<br />
expands to display additional options.<br />
NOTES:<br />
• Type or select new options from the dropdown<br />
lists, as necessary.<br />
• Accept the “Live” server address contained in<br />
the Connect drop-down window unless<br />
instructed otherwise. If a new address is<br />
required, click on the network button and type<br />
it into the field as instructed by technical<br />
support. Select “Demo” if you wish to login.<br />
• Select the desired interface language from the<br />
Language drop-down. When you change the<br />
language option, you will need to restart<br />
<strong>Active</strong> <strong>Trader</strong>.<br />
• Select the preferred colour scheme setting from the Skin drop-down field. When you<br />
change the Skin option, you will need to restart <strong>Active</strong> <strong>Trader</strong>.<br />
• To stop the login process while it is attempting to communicate to the server, click<br />
[Cancel].<br />
• To close the login window and abandon the process altogether, click the [X] in the<br />
upper right corner of the box.<br />
6. Click OK to log into the system. <strong>Active</strong> <strong>Trader</strong> will appear.<br />
9
2. Menus, Tool bars, and Icons<br />
Basic Navigation in <strong>Active</strong> <strong>Trader</strong><br />
There are three main methods of navigation in <strong>Active</strong> <strong>Trader</strong>:<br />
• Window Controls<br />
• Drag & Drop Functionality<br />
• Right-Click menus<br />
Window Controls: Each <strong>Active</strong> <strong>Trader</strong> window (also referred to as a "module" or "box") uses<br />
standard window controls. These controls include the Minimize, Maximize/Restore, and Exit<br />
buttons located in the upper right-corner of each window. You can also resize each window by<br />
clicking and dragging on its edges or corners. The entire window can be moved by clicking and<br />
dragging on its title bar.<br />
Drag & Drop Functionality: Stock symbols may be “dragged and dropped” from one module to<br />
another throughout <strong>Active</strong> <strong>Trader</strong>. For example, you can drag a symbol from a list in the Market<br />
View window and drop it onto the Stock Box to get a Level II quote for that symbol. You can also<br />
drag a symbol from the Open Positions tab in the Account Box into a Stock Box in order to<br />
trade on the position. In general a stock symbol can be dragged and dropped from any <strong>Active</strong><br />
<strong>Trader</strong> module to any other module which permits a stock symbol to be entered.<br />
Right-Click Capabilities: The right mouse button is used in every module to display a contextsensitive<br />
menu of operations. Some of the right-click menus are brief, while others are complex.<br />
Right-click menus for each window change to reflect the options specific to the selected window<br />
(for example in the Open Orders screen versus the Open Positions screen within the Account<br />
Box).<br />
Modules that display lists of information (such as the Market View or Positions Tab in the<br />
Account Box, etc.) include the following standard right-click menu choices:<br />
• Columns: this will display a Columns dialog box allowing for each of<br />
the columns within the module to be toggled on or off, as well as the<br />
column order to be determined.<br />
• Print: prints the contents of the window<br />
• Export: exports the contents of the list module to a Comma<br />
Separated Value (CSV) file. This type of file can be opened directly<br />
with Microsoft Excel and other spreadsheet programs.<br />
• Smart Width: this option will resize the columns in the module so<br />
that each column width is equal to the maximum data width and all<br />
the values can be seen.<br />
10
File Menu<br />
You can use the File menu, located at the top of <strong>Active</strong> <strong>Trader</strong>, to perform some of following<br />
tasks:<br />
• Login: This option will display the Login window. You can use the Login window to log<br />
into additional accounts simultaneously.<br />
• Settings: This option launches the Settings window. You can<br />
use the Settings window to customize the appearance of<br />
<strong>Active</strong> <strong>Trader</strong>, as well as the default values for many settings.<br />
• Font: Select this option to choose the default font, font style<br />
and font size for <strong>Active</strong> <strong>Trader</strong>.<br />
• Save Settings: This option saves the current settings for the<br />
current user. The saved settings include the size and location<br />
of all active modules, the stock symbols in each module, the<br />
setting values for all application variables, and additional<br />
settings.<br />
NOTE: Different settings files are kept for each Connect ID on a local PC. If a user is<br />
logged into multiple accounts, then the settings are saved under the first Connect ID (the<br />
account on the left-most tab in the Account Box).<br />
• Quit: Select this option to exit <strong>Active</strong> <strong>Trader</strong>. If any settings have changed since they<br />
were last saved, then a Save Settings window asking whether you want to save the new<br />
settings appears.<br />
11
Settings<br />
You can use the Settings window to change global settings for the overall appearance and<br />
operation of <strong>Active</strong> <strong>Trader</strong>.<br />
When changing settings, click the OK or Apply button to save the current settings, or click<br />
Cancel to exit without saving the new settings.<br />
NOTE: Clicking the OK or Apply buttons can make changes to the current appearance of <strong>Active</strong><br />
<strong>Trader</strong>. <strong>Active</strong> <strong>Trader</strong> may flicker momentarily when applying the new settings.<br />
12
The setting categories contained in the Settings window are explained in detail in the following<br />
section:<br />
Colours section of the Settings window<br />
Colours: You can use this section to define the colour options for individual components of<br />
<strong>Active</strong> <strong>Trader</strong>. To change a colour, click the colour next to the component you want to change.<br />
The Select Colour window appears. In the Select Colour window, select the Basic or Custom<br />
colour to use and then click the OK button.<br />
The colour settings are grouped in the following categories:<br />
• Default Colours: The basic background, text, and shading colours in all modules.<br />
• Market View: The background and text colours within the Market View and Index View<br />
modules.<br />
• Option in the Money: the colour used to highlight “in the money” option contracts within<br />
the Option Box window.<br />
• Stock Box: background colours in the Level I and Level II areas of the Stock Boxes, as<br />
well as the colours of each pricing tier in the Level II panel.<br />
• Time & Sales (T&S): the colour of each time and sales print determined by its relation to<br />
current Bid/Ask prices.<br />
13
General Setup section of the Settings window<br />
General Setup is used to set the general functionality of <strong>Active</strong> <strong>Trader</strong>:<br />
• Account Summary Currencies: Account Summary Currencies allows you to display<br />
Buy Power /Maintenance Excess in primary, secondary, or both currencies.<br />
• Display Net P&L: When checked off net profit loss for positions closed during the day<br />
will be displayed in both the account header of the Account Box and will also appear<br />
under the Stats tab within the Account box.<br />
• Labels on navigation buttons: When this option is enabled, text labels are displayed<br />
below the buttons on the Quick Start tool bar and the module icons on the Navigator<br />
tool bar.<br />
• Set Symbol Upon Edit: When enabled this option allows you to double click on a<br />
security symbol within the Market or Index view to populate a stock, option or chart box.<br />
If not checked, double clicking on the symbol will allow you to only edit the symbol and<br />
you will have to double click on another field such as last price to perform the same<br />
action.<br />
• Symbols on navigation buttons: When this option is enabled it displays the relevant<br />
stock symbol below each of the Chart, Stock Box, and Option Box icons on the<br />
Navigator Tool Bar.<br />
14
Highlighted ECN’s<br />
You can highlight a specific ECN so that it will be more visible in the Level 2 section of the each<br />
Stock Box. You can select as many as 6 ECNs to highlight and choose the color in which to<br />
highlight them.<br />
Options section of the Setting window<br />
• Risk Free Interest Rate – Use this setting to change the interest rate used in the<br />
computation of the option price analytic Greek values. Refer to the section on Option<br />
“Greeks” for additional information.<br />
15
Orders section of the Settings window<br />
Orders - Use this section to manage settings related to Order Entry and default order settings in<br />
<strong>Active</strong> <strong>Trader</strong>:<br />
• Auto adjust order size: This<br />
field determines whether the<br />
system will automatically adjust<br />
order size when CLOSING a<br />
position. If checked, an order to<br />
close a position which exceeds<br />
the share size of the open<br />
position will have its share size<br />
automatically changed to match<br />
the open shares available. If not<br />
checked such an order will be<br />
rejected as exceeding the<br />
available share size.<br />
• Auto Limit Buy Delta: Use this<br />
field to enter the dollar amount<br />
to use when setting the price of<br />
an Auto Delta Limit Buy. This<br />
amount will be added to the<br />
current Best Ask to determine<br />
the Limit Buy price.<br />
• Auto Limit Sell Delta: Use this<br />
field to enter the dollar amount<br />
to use when setting the price of<br />
an Auto Delta Limit Sell. This<br />
amount will be subtracted from<br />
the current Best Bid to<br />
determine the Limit Sell price.<br />
• Auto Limit Short Delta: Use<br />
this field to enter the dollar<br />
amount to use when setting the<br />
price of an Auto Delta Limit<br />
Short. This amount will be<br />
subtracted from the current Best<br />
Bid to determine the Limit Short<br />
price.<br />
• Confirm “Cancel All”: When enabled, this option will display a confirmation window when<br />
canceling all open orders. You must then confirm the order before it is sent to the servers for<br />
execution.<br />
• Confirm Cancel Order: When enabled, this option will display a confirmation window when<br />
canceling an order. You must then confirm the order before it is sent to the servers for<br />
execution.<br />
16
• Confirm Equity Orders: When enabled, this option will display a pop-up window when<br />
placing equity orders. You must then confirm the order before it is sent to the servers for<br />
execution.<br />
• Confirm Option Orders: When enabled, this option will display a pop-up window when<br />
placing option orders. You must then confirm the order before it is sent to the servers for<br />
execution.<br />
• Default Debenture Contract Size: Not Applicable<br />
• Default equity size: Use this field to set the default share size that will populate an order<br />
ticket for an equity symbol.<br />
• Default Listed ECN: Use this field to set the default ECN which will appear within the order<br />
route field for all listed US equities. ECN fees may be applicable when selecting an ECN as<br />
opposed to the default AUTO route setting.<br />
• Default Non Listed ECN: Use this field to set the default ECN for over the counter (Nasdaq,<br />
OTCBB) US equities. ECN fees may be applicable when selecting an ECN as opposed to<br />
the default AUTO route setting.<br />
• Default option contract size: This field contains the default contract size that will populate<br />
an order ticket for an options contract.<br />
• Default Options ECN: Not Applicable<br />
• Default Order Type: This allows you to set the default order type within the Stock and Option<br />
Boxes. The choices are Day, Good ‘Til Cancel, and Market order.<br />
• Display 24 hour time on orders: This option determines whether to display the time-stamp<br />
on order messages in 12 or 24 hour time format. The time-stamp messages are located in<br />
the <strong>Active</strong> <strong>Trader</strong> log and the Order History window.<br />
• Display date on orders: This option determines whether to show the date stamp on order<br />
messages displayed in the <strong>Active</strong> <strong>Trader</strong> log.<br />
• Fill size when dragging: Use this option to enable the population of the share size of an<br />
order ticket by dragging a position from the Positions window in the Account Box to a<br />
Stock Box. For example, if the default equity size is 100 and you have an open position for<br />
500 shares of CSCO, when they drag the CSCO symbol from their positions to a Stock Box<br />
(presumably to close the position), the share size will be changed to match the open number<br />
of shares. If not selected, then the share size would remain at the default setting (100 in the<br />
example).<br />
• Save individual size: This option determines whether <strong>Active</strong> <strong>Trader</strong> should remember the<br />
share size used for each specific symbol entered in an order ticket, regardless of which<br />
Stock Box is used. This “memory” persists as long as <strong>Active</strong> <strong>Trader</strong> is running, but is erased<br />
when the application is shut down.<br />
• Save size always: This option determines whether the share size in the Stock Box stays the<br />
same when you change symbols. For example, when this option is enabled and Stock Box 1<br />
has a share size of 500 and Stock Box 2 is set to 1000 shares, these sizes will remain<br />
consistent no matter which symbol is entered.<br />
17
NOTE: The share size will still vary between Equities and Options even when Save Size<br />
Always is checked. The share size will be preserved within all like instruments (e.g. 200 for<br />
Equities and 10 for Options).<br />
Quotes section of the Settings window<br />
Quotes – You can use this section to control global settings related to how market data is<br />
displayed in <strong>Active</strong> <strong>Trader</strong>:<br />
• Change is from open: By default,<br />
the “Change” value displayed in<br />
Level I data (in the Market View,<br />
Stock Box, etc) is calculated vs. the<br />
previous close price. Click this<br />
setting so that a check mark<br />
appears to see the change<br />
calculated against this morning’s<br />
open price instead.<br />
• Display Quote Time: Enable this<br />
option to add the time of every<br />
quoted price into the Level II Quote<br />
display for all Stock Boxes.<br />
• Display T&S Time: Enable this<br />
option to display the timestamp on<br />
each print as it scrolls by in the<br />
Time & Sales area of each Stock<br />
Box.<br />
• Divide book size by 100: Enable<br />
this option to display the share size<br />
of Bid/Ask quotes and T&S prints<br />
divided by 100 for Book quotes<br />
(INET Book, etc.). For example,<br />
when enabled, 1000 shares will<br />
appear as 10 shares.<br />
• Divide equities size by 100: For quotes from exchanges, you can enable this option to<br />
display the share size of Bid/Ask quotes and T&S prints divided by 100. For example, when<br />
enabled, 1000 shares will appear as 10 shares.<br />
• Divide TSX/V securities based on board lot: Enable this option to display the share size of<br />
Bid/Ask quotes and T&S prints from the TSX and TSX/V divided as follows: (previous close<br />
under 10 cents = 1,000 shares, 10 to 99 cents = 500 shares, $1.00 and over = 100 shares)<br />
• Flash line on price change – Enable this setting to highlight price changes within the Market<br />
and Index modules. The entire line containing the security will flash either green (increase)<br />
or red (decrease) in response to price changes.<br />
• Hide L2 non-local currency marks: Enable this setting to hide currency symbols (I.e. USD)<br />
when viewing a foreign-currency symbol in the Stock Box.<br />
18
• L1 non-local currency marks on Last only: Enable this setting so that the currency symbol<br />
currency symbol (I.e. USD) will ONLY be displayed on the “Last Price” when viewing a<br />
foreign-currency symbol in any Level 1 quote display (such as the Market View or the<br />
Account Box).<br />
• Maximum decimal digits: Use this field to type the maximum number of decimal places to<br />
display on all price values in all modules.<br />
• Minimum decimal digits: Use this field to type the minimum number of decimal places to<br />
display on all price values in all modules (the default value for this field is 2). The minimum<br />
number of decimal places will always be displayed, whereas decimal places above the<br />
minimum and up to the maximum are only displayed as necessary.<br />
• T&S from top: Instructs <strong>Active</strong> <strong>Trader</strong> to show T&S prints from the top of the T&S window<br />
within each Stock Box. This is the default settings. Clear this checkbox if new T&S prints<br />
should appear from the bottom instead.<br />
19
Help Menu<br />
Selecting Help > About from the main <strong>Active</strong> <strong>Trader</strong> toolbar will<br />
display the current software version of <strong>Active</strong> <strong>Trader</strong>. Use this feature<br />
to determine your software version when asked by technical support.<br />
Version Number window<br />
20
Navigator Tool Bar<br />
The Navigator tool bar contains buttons to access each active module in <strong>Active</strong> <strong>Trader</strong>.<br />
There are two methods to view the Navigator Tool Bar. To display the Navigator Tool Bar,<br />
perform one of the following:<br />
• From the <strong>Active</strong> <strong>Trader</strong> main menu, select Window > Navigator Tool Bar.<br />
• Right-click the Navigator Tool Bar and click Navigator.<br />
You can use the Settings window - General section to toggle the text labels on or off. Similarly,<br />
the stock symbols may be activated or deactivated below the icons representing the Option Box<br />
(chain link icon), Chart window (bar graph icon), and Stock Box (book icon). You can also hover<br />
the cursor over a button to display a description of its function.<br />
The entire Navigator tool bar may be positioned by clicking and dragging the far left edge, where<br />
the ridges are located.<br />
21
Quick Start Tool Bar<br />
The Quick Start tool bar contains buttons to access active modules in <strong>Active</strong> <strong>Trader</strong>.<br />
There are two methods to view the Quick Start Tool Bar. To display the Quick Start Tool Bar,<br />
perform one of the following:<br />
• From the <strong>Active</strong> <strong>Trader</strong> main menu, select Window > Quick Start Tool Bar.<br />
• Right-click the Navigator Tool Bar and click Quick Start.<br />
You can use the Settings window - General section to toggle the text labels on or off. Similarly,<br />
the stock symbols may be activated or deactivated below the icons representing the Account<br />
box, Market View window, and Index View window. You can also hover the cursor over a button<br />
to display a description of its function.<br />
The entire Quick Start Tool Bar may be positioned by clicking and dragging the far left edge,<br />
where the ridges are located.<br />
22
Window Menu<br />
The Window menu is used to control the presence or absence of <strong>Active</strong> <strong>Trader</strong> modules and Tool<br />
Bars, as well as special layout management features.<br />
Modules – the top section of the menu lists individual <strong>Active</strong><br />
<strong>Trader</strong> modules, and allows the user to toggle them on and off. A<br />
check box to the left of a module indicates that it is active and<br />
visible within the application (although it may be hidden beneath<br />
other modules). Because there are multiple instances of the<br />
Option Box, Stock Box, and Chart modules, each of these<br />
objects has a sub-menu to the right that allows the specific<br />
numbered instance to be toggled on or off.<br />
Tool Bars – the middle section of the Window menu contains the<br />
two <strong>Active</strong> <strong>Trader</strong> Tool Bars: Navigator and Quick Start. These<br />
choices toggle on and off these tool bars within the header area of<br />
the application.<br />
Layout Management – the four selections in the bottom section<br />
of the menu provide different types of layout control:<br />
• Tile: this selection will arrange all open modules by assigning<br />
each module roughly equal screen space. All modules will be<br />
visible but their size will not necessarily make sense relative<br />
to their function.<br />
• Cascade: this choice will take all open modules and arrange<br />
them one on top of the other, so that the title bar for each is<br />
visible. This layout does not make sense for usability, but it<br />
can be a useful starting point to see all of the open modules so that they can then be<br />
manually moved and arranged.<br />
• Smart Layout: using elements of both Tile and Cascade, with more intelligence, this feature<br />
arranges the open modules in a way that tries to increase their usability. The modules are<br />
each sized and placed according to use and importance. Additionally, if more Charts or<br />
Stock Boxes are active than can reasonably de displayed simultaneously, <strong>Active</strong> <strong>Trader</strong> will<br />
Cascade the Charts and Stock Boxes within a specific area, while Tiling other modules.<br />
• Snap Grid: this feature toggles on and off, and helps the user line up the corners and edges<br />
of the various modules. When Snap Grid is active, and a module is resized, or dragged and<br />
dropped, it will snap into a position relative to the edges and corners of the surrounding<br />
windows.<br />
23
3. Quotes and News<br />
Entering a Symbol<br />
There are three ways to enter a symbol into a Stock Box:<br />
• Type the symbol into the<br />
desired Stock Box and hit<br />
[ENTER].<br />
• Drag and Drop a symbol<br />
from another module<br />
(Market View, Index<br />
View, Account Box,<br />
Symbol Lookup, etc.) into<br />
a Stock Box.<br />
• Double-click on a symbol<br />
in another module to<br />
populate the symbol into<br />
the last active Stock Box.<br />
Once a valid equity symbol is entered, the quote data will instantly appear, and Time & Sales<br />
“prints” will begin to appear as transactions for the stock are executed. Additionally, the title bar of<br />
the Stock Box will display the Stock Box number, followed by the market where the symbol<br />
trades, and the company name (e.g. “1:TSX:NORTEL NETWORKS CORPORATION” in the<br />
figure above).<br />
24
Level I Data<br />
Level I quote area of a Stock Box<br />
The upper portion of the Stock<br />
Box contains basic Level I<br />
quote data. To the right of the<br />
Symbol field is the Tick<br />
Indicator.<br />
The nine values in the Level I section are statically positioned; they can neither be turned on or<br />
off, nor resorted.<br />
To re-size the columns: Right-click in this section and select “Smart Width” to automatically<br />
size the columns according to the data in each. Alternatively, hover over the indentations in the<br />
header bar just above the columns until the double-arrow pointer icon appears. Then click and<br />
drag the column border to the position desired.<br />
Explanation of data fields:<br />
• Close: previous day’s closing price – the last official print during market hours (post-market<br />
trading is not included).<br />
• Open: today’s opening price – the first official print at the open of market hours (pre-market<br />
trading is not included).<br />
• Chg: the change in price. By default this is calculated by comparing the “Last” price to the<br />
“Close”. However, the “Chg” calculation can be set to compare “Last” against the “Open”<br />
price in the Setup Utility.<br />
• High: the highest intraday price (extended hours trading is not included).<br />
• Low: the lowest intraday price (extended hours trading is not included).<br />
• Vol: the volume of share traded in this symbol (this does typically include extended hours<br />
trading).<br />
• Bid: the current Best Bid.<br />
• Ask: the current Best Ask.<br />
• Last: the most recent price to print in Time & Sales.<br />
25
Level II Data<br />
Level I quote area of a Stock Box<br />
Unlike Level I quotes, which show only the single current transaction price, Level II quotes show<br />
all current parties (Market Makers and ECN’s for NASDAQ stocks, or the various exchanges for<br />
NYSE stocks) participating in the buying and selling of a stock, and the various price levels at<br />
which they are offering to buy or sell.<br />
The Bids are shown in the left column, and the Asks on the right. Each price level is indicated by<br />
a colour stripe within each column. The colours do not mean anything in an objective sense, but<br />
serve only to differentiate the price levels as the market moves. Colour preferences and decimal<br />
place settings can be set via the Setup utility, under “Quotes”, as can the convention of dividing<br />
the share size by 100 or the applicable board lot size for Canadian equities.<br />
26
Time and Sales Prints<br />
Every completed transaction for the selected equity symbol will appear in the “Time&Sales”<br />
window to the right of the Level II “Ask” column. In order for the prints to convey useful<br />
information they are colour-coded at the instant of the print as it relates to the Bid and Ask prices<br />
at that moment. The colour used for each type of print is described below, and can be customized<br />
via the Colours section in the Setup Utility. The default print colours denote the following:<br />
• Green – transaction price is at the Ask.<br />
• Red – transaction price is at the Bid.<br />
• White – transaction price between the Bid and Ask.<br />
• Purple – transaction price is below Bid.<br />
• Gold – transaction price above Ask.<br />
• Teal (Cyan) – the transaction print occurs in a “Crossed”<br />
or “Locked” market. A “Crossed” market indicates that the<br />
best Bid price is greater than the best Ask price, while<br />
“Locked” denotes that the best Bid and Ask prices are the<br />
same.<br />
• Royal Blue – the relationship between the transaction<br />
price and the Bid/Ask levels is unknown.<br />
It is important to note that the colour of the print is relative to the<br />
Bid and Ask price levels, which are changing constantly.<br />
Therefore, multiple prints of the same colour can easily be at<br />
different prices. If all the prints are red and/or purple, chances are<br />
the price of the prints is gradually decreasing. Conversely, if all the<br />
prints are green and/or yellow, the price is probably increasing. If<br />
the colours are equally mixed, the prices are probably not moving<br />
very much as buy and sell pressure are roughly the same.<br />
The Up/Down Tick Indicator in the Level I quote display changes in accordance with the Level II<br />
quotes and the rules of determining uptick and downtick vary with each market.<br />
• For the NYSE and AMEX, an uptick is determined by the last transaction print. If the last<br />
print is at or above the best ask, then the stock is in an uptick. If the last print is at or<br />
below the best bid then, the stock is in a downtick. Any print in between the best ask and<br />
best bid will leave the stock tick unchanged.<br />
• For NASDAQ securities, an uptick is created when the best bid is increased. A down<br />
trend is present when the best bid is lower than the last best bid.<br />
27
The Book Box<br />
The Book Box is used to display depth of market within a specific ECN and is activated via the<br />
Window Menu > Stock Box > Book Box. It displays a Level II quote in two columns for the<br />
ECN selected in the drop-down to the right of the symbol field. However, the Book Box is a<br />
detailed representation of the order and price activity within the selected ECN only.<br />
NOTE:<br />
The best Bid and Ask from the INET Book will show up within the standard NASDAQ Level II<br />
quote with a Market Maker ID of “CINN” because all Island quotes for NASDAQ equities are<br />
routed through the Cincinnati Stock Exchange (as of Oct. 2002).<br />
The best Bid and Ask from the ARCA Book will show up within the standard NASDAQ Level II<br />
quote with a Market Maker ID of “ARCA”.<br />
The best Bid and Ask from the BRUT Book will show up within the standard NASDAQ Level II<br />
quote with a Market Maker ID of “BRUT”.<br />
To view the INET, ARCA, or BRUT Book for a particular stock, the symbol can be typed directly<br />
into the Book Box module, or it can be dragged and dropped in, just as with the Stock Boxes.<br />
28
Option Box<br />
The <strong>Active</strong> <strong>Trader</strong> Option Box presents detailed real-time option chains in an easy-to-use format.<br />
Two Option Box modules may be active simultaneously, and a new instance of the Option Box<br />
is opened via the Window Menu > Option Box selection, or via the New Option Box button on<br />
the Quick Start Tool Bar.<br />
As seen in the figure above, the Option Box consists of a header area with Level I quote<br />
information of the underlying stock, if an option is chosen, the Level I quote for the option symbol<br />
and a drop down to chose the strike month for the option montage below.<br />
The Option Box Header contains two symbol fields in the upper left corner – one for the<br />
underlying and one for the specific contract. By entering the underlying symbol in the first field<br />
(“CSCO” in the figure above); the corresponding option chain will be displayed in the tabbed area<br />
below, with Call contracts on the first tab and Put contracts on the second. The Bid, Ask, and Last<br />
price for the underlying equity are also displayed to the right of the top symbol field.<br />
Click on one of the Calls or Puts in order to load the contract symbol in the second field<br />
(“VYCAW” in the figure above) and activate the corresponding quote feed. This will populate the<br />
Bid, Ask and Last prices for the contract in the Level I area to the right of the contract symbol, will<br />
make the depth of book data visible in the Montage on the third tab, and place the option symbol<br />
in the Order Execution Box to trade.<br />
To place an options order, or use the montage feature, a specific contract (Call or Put) MUST be<br />
selected and visible in the second symbol field.<br />
The Contract Month drop-down is visible in the top right corner of the Option Box. This field<br />
allows a specific month to be selected, beginning with the current month, for which the option<br />
chain will be displayed. Or choose “ALL” from the drop-down to display all Option Chain data for<br />
all available months, organized into monthly folders.<br />
29
The Option Montage<br />
The Montage presents depth-of-book data for the selected option contract. This consists of the<br />
best Bid and Ask currently quoted on each of the different exchanges, presented in a Level II<br />
style format, along with the Time and Sales prints as they occur. When the order ticket is<br />
enabled, double-click on any of the exchange IDs in the Montage to automatically set the order<br />
sub-route to that exchange.<br />
NOTE:<br />
The Montage window will be blank unless a specific contract (Call or Put) is selected and visible<br />
in the second symbol field.<br />
30
Option “Greeks”<br />
The option chain area of the option box contains columns displaying the option price analytic<br />
Greek values.<br />
These values are defined as follows:<br />
Column Name Example Description<br />
• Delta .657 Delta is a measure of the sensitivity the calculated option<br />
value has to small changes in the underlying equity price.<br />
• Gamma .012 Gamma is a measure of the calculated delta's sensitivity<br />
to small changes in share price.<br />
• Vega .479 The amount that the price of an option changes<br />
compared to a 1% change in volatility.<br />
• Theta -.279 Theta measures the calculated option value’s sensitivity to<br />
small changes in time till maturity.<br />
• Rho .206 Rho measures the sensitivity of an option or options<br />
portfolio to a change in interest rate.<br />
• I-Vol 23.42 Implied Volatility in percentage.<br />
These values are computed based on the Black-Scholes Price Model (1973).<br />
The following assumptions are taken into account when computing them:<br />
• The stock pays no dividends during the option’s life<br />
• European exercise terms are used<br />
• Markets are efficient<br />
• No commissions are charged<br />
• Interest rates remain constant and known<br />
• Returns are lognormally distributed<br />
31
Market View<br />
The <strong>Active</strong> <strong>Trader</strong> Market View module provides streaming Level I data on hundreds of userdefined<br />
symbols. It allows for the symbols to be organized into manageable tabs so that market<br />
sectors or favourite traded symbols can be monitored together at a glance.<br />
• Adding Symbols: to add symbols right-click in the main body of the desired tab and choose<br />
“Add”. Type a valid symbol into the highlighted entry field, and press [ENTER] to move to the<br />
next line for entering multiple symbols.<br />
• Deleting Symbols: right-click on the desired symbol and click “Delete”.<br />
• Alerts: alerts can be set on symbols in the Market View as follows:<br />
• Right-click on the symbol to be monitored and select “Alert”.<br />
• In the Alert Setup box check any combination of the twenty different<br />
available alerts.<br />
• Click OK to save the settings and note that a red alert arrow will<br />
appear next to the symbol on which the alert has been activated.<br />
• When the monitored event occurs (i.e. the symbol makes a new high<br />
or new low or is crossed/locked) a detailed alert box will pop-up and a<br />
tone will sound. The symbol which generated the alert will flash red in<br />
the Market View window.<br />
• To remove and disable the alert, right-click on the symbol and select<br />
“Delete Alert”.<br />
• To reset the alert after it is triggered, so that the symbol stops<br />
flashing and the next event can be detected, right-click on the symbol<br />
and choose “Reset Alert”.<br />
NOTE: Alerts will function for any selected symbol, whether the tab<br />
that contains the symbol is currently visible or not.<br />
• News: select news to display the News window and view only stories<br />
pertaining to the selected symbol<br />
• New List: adds a new tab to the module and asks the user to enter the<br />
tab name.<br />
• Columns: the Market View right-click menu includes both a “Columns” choices and a “Smart<br />
Width” feature, which function exactly as in all other modules. Use “Columns” to determine<br />
which columns are visible and in what order, and use “Smart Width” to space the visible<br />
columns efficiently.<br />
32
• Quick Launch Buttons – Use the Quick Launch buttons to quickly access a Chart,<br />
Stock Box (Level II), News Box, or Option Box (option chain) for the chosen symbol in<br />
one click.<br />
• Tabs: Right-click in the header area of the<br />
Market View module to manage the userdefined<br />
tabs.<br />
• New List – adds a new tab to the<br />
module and asks the user to enter the<br />
tab name.<br />
• Rename List – allows the user to enter<br />
a new name for the selected tab.<br />
• Delete List – removes the specific tab and all of its contents.<br />
Note:<br />
• The maximum number of tabs is 10<br />
• The maximum symbols per tab is 45 (for a total of 450)<br />
• The maximum number of alerts is 15<br />
33
Index View<br />
The Index View module offers the same basic functionality as the Market View, but is designed<br />
so that the user may track indices.<br />
The Index View supports up to eight simultaneous symbols, but does not offer a tabbed interface<br />
like the Market View. Symbols are entered and deleted just as they are in Market View, and the<br />
column manipulation is identical as well. Alerts can also be set on the symbols in this module,<br />
and are managed through the same interface.<br />
The right-click menu available in the Index View offers six Index<br />
Shortcuts. Select “Add Dow” to insert the Dow Jones Industrials symbol,<br />
“Add Nasdaq” to insert the NASDAQ Composite Index, etc. Add any<br />
other desired symbols through the normal “Add” selection.<br />
The Index View will support valid Equity symbols as well as Index<br />
instruments.<br />
34
Top Performer List<br />
The Top Performer List displays the Top Ten<br />
Most <strong>Active</strong>s, Percent Gainers, Percent<br />
Losers, Dollar Gainers, or Dollar Losers for<br />
each major North American equity and option<br />
exchange (TSX, AMEX, NASDAQ, NYSE, TSX-<br />
Venture, CBOE, and Montreal) as well as the Dow<br />
30 and S&P500 benchmark indices. Simply select<br />
the type of list and the exhange/index from the<br />
dropdown menus. You can customize the<br />
columns to display the data you are interested in<br />
by right-clicking and selecting “Columns”.<br />
35
Symbol Lookup<br />
The <strong>Active</strong> <strong>Trader</strong> Symbol Lookup allows a user to find a specific equity or index symbol by<br />
name. It also allows an option contract symbol to be entered, and returns the corresponding root<br />
equity symbol.<br />
As shown in the figure above, when the “Company Name” radio button is selected any part of the<br />
company name may be entered in the “Name” field, and a specific exchange may be selected<br />
from the “Exchange” drop-down (or it may be set to “Any”). The search will return the top 50<br />
symbols whose company names contain the search string – use more of the company name or a<br />
specific exchange to further refine the search.<br />
Once the desired symbol is located it can be dragged and dropped into any Stock Box, Chart, or<br />
Market View tab.<br />
If a user knows a specific option symbol – either a Call or a Put – they may use the Symbol<br />
Lookup to find the underlying, or “root”, equity symbol. When the “Option Root Lookup” radio<br />
button is selected, a specific options contract is entered in the “Name” field and <strong>Active</strong> <strong>Trader</strong><br />
returns the corresponding root symbol (as shown above). The “Exchange” drop-down is disabled<br />
as it is not relevant when using this function. The root symbol can then be dragged and dropped<br />
into an Option Box in order to display the entire option chain.<br />
36
News Window<br />
You can use the News window to view a list of real-time news and stories related to the market<br />
as they happen. You can also select whether to monitor all headlines as they are published or<br />
you can type a symbol into the Search tab to display stories for specific securities.<br />
37
4. Order Execution Box<br />
Stock Order Execution Box<br />
Options Order Execution Box<br />
1 2 18<br />
3 4<br />
5 6 7<br />
8<br />
9<br />
10 11<br />
12<br />
13 14 15<br />
16 17<br />
19<br />
1. Symbol: symbol of stock/option you wish to send an order for.<br />
2. Account Number: account number you are placing the trade for.<br />
3. Quantity: amount of shares/contracts.<br />
4. Price: limit price you wish to send order at.<br />
5. GTC Check Box: will select GTC (good ‘til cancel) time order.<br />
6. Market Check Box: will send a market order.<br />
7. Route: execution venue you wish the order to go to.<br />
8. Stop Check Box: will send order as a stop order (On Stop).<br />
9. VTSO Check Box: will create a VTSO (virtual trailing stop order). See Step 6 of ‘Placing a<br />
Stock Order’ for a detailed description.<br />
10. Stop Trigger price: Enter the Stop Trigger Price in this field for Stop Orders (the price at<br />
which when printed will trigger the Market or Limit order) or the Delta for VTSO orders (the<br />
amount the trigger price will trail the market price).<br />
11. MPID: sub route from an execution venue. Not applicable at this time.<br />
12. Quote: Displays best bid and ask<br />
13. Buy: button used to buy.<br />
14. Sell: button used to sell.<br />
15. Short: button used to send a short sell order (short sell equity orders are restricted to Day<br />
only). This button will be displayed as ‘sell to open’ when an option symbol is entered in the<br />
symbol field.<br />
16. Cancel: button will cancel all orders of the symbol in the symbol field.<br />
17. Cancel All: button will cancel all outstanding orders.<br />
18. Bracket Order Button: Toggles on/off the bracket order entry ticket<br />
19. Cover Options Check Box: will send option as a covered order if selected.<br />
38
Placing a Stock Order<br />
To place an order for a stock, follow the directions below:<br />
Step 1:<br />
Select a Stock Box to trade from. Do this by clicking on the stock box with the desired symbol or<br />
by clicking on the down arrow next to the symbol field in the Order Execution Box then choosing<br />
the desired symbol. If the symbol is not on any of the stock boxes simply add the symbol. You will<br />
notice that once a Stock Box is selected the symbol of that stock box will auto populate in the<br />
symbol field of the Order Execution Box.<br />
Step 2:<br />
Choose the account you will trade in by clicking on<br />
the down arrow next to the account field.<br />
Step 3:<br />
Enter in the amount of shares in the quantity field.<br />
Step 4:<br />
Choose your route:<br />
Route (Execution Venue): by default this is set to<br />
“AUTO”, which instructs the <strong>Active</strong> <strong>Trader</strong> Plus<br />
servers to direct the order to the proper Execution<br />
Venue based on the settings contained in the order<br />
route table (as set by the brokerage). The default “AUTO” settings are specific to the exchange<br />
and order type, but when a user wants to direct an order to a location other than the default, this<br />
drop-down is used. Available venues include:<br />
• ARCA – ArcaEx (the Archipelago Exchange) – accepts Limit and Market orders for Listed<br />
and NASDAQ securities.<br />
• INET – INET ATS (formerly known as Island) – provides varying degrees of liquidity in an<br />
electronic matching and display environment; allows NASDAQ and listed orders; does NOT<br />
accept market orders.<br />
39
Step 5:<br />
Choose your price: If market is chosen the price field will gray out.<br />
Step 6:<br />
Select order type:<br />
• Day – Good For Day – (Default Order Type) this limit order will remain in effect until the end<br />
of the official market hours. A ‘Day’ order placed at or after 8am is good until 4pm. A special<br />
circumstance applies to TSX Day orders where if the limit price happens to match the TSX<br />
last sale price determined at 4:10pm EST, the order will automatically be placed in the TSX<br />
Last Trade session until 5pm EST unless cancelled prior to 4:15 PM EST.<br />
• GTC: A Good ‘Til Cancel order will remain in effect until you cancel the order for US orders or<br />
90 calendar days for Canadian orders. If not selected, the order will be a DAY order.<br />
• GTEM: Good Through Extended Market - this limit order will remain in effect until the end of<br />
the extended market day, which includes after hours trading. This order type is also used<br />
when entering a pre-market US order which will remain in effect for the entire trading day,<br />
including the after hours session. Orders intended to participate in the US pre-market<br />
session can only be sent once the pre market trading session has begun at 8:00 AM EST.<br />
• Stop: (On Stop) An order that is placed with a trigger price below the current market price for<br />
a sell order, or above the current market price for a buy order. If selected, the stop trigger<br />
price field will change to white allowing you to enter a trigger price. Choose to send either a<br />
market order (check off the market order check box) or limit order (enter a price in the price<br />
field) once the stop price has been reached. The default duration is a DAY order, select GTC<br />
to enter a Good ‘til Cancel order.<br />
• VTSO: (Virtual Trailing Stop Order) A complex Stop order in which the stop price is set at<br />
fixed amount below the market price if you are selling and above if you are buying. When<br />
you are selling and the market price rises, the stop price rises proportionately, but if the stock<br />
price falls, the stop price doesn't change. The reverse is true for buy VTSO orders. The<br />
reasoning behind this kind of order is that it allows an investor to set a limit on the maximum<br />
possible loss without setting a limit on the maximum possible gain, without having to<br />
constantly readjust your trigger price. If selected the stop target price field will change to<br />
white allowing you to enter a delta. The order remains virtualized on the <strong>Active</strong> <strong>Trader</strong><br />
servers until the order is triggered, at which time a market order is sent to the exchange. The<br />
default duration is a DAY order, select GTC to enter a Good ‘til Cancel order. The cancel<br />
replace function is not supported for this type of order.<br />
• Bracket: Select the Bracket button to enable this feature which will permit two buy orders or<br />
two sell orders to be placed simultaneously for the same position allowing you to “bracket” an<br />
existing position with a Limit order and an On-Stop order. Both orders are virtualized on our<br />
servers and are not sent to the exchange until one of the orders is triggered, at which point<br />
the other order is cancelled. As an example: Stock XYZ is trading at $60. You can place a<br />
Limit sell order at $70 and a sell On-Stop order at $55. One of them will be triggered when<br />
the price of XYZ goes below $55 or above $70. The other order will then be cancelled.<br />
40
There are certain conditions a bracket order has to fulfill:<br />
• Minimum price is $3.00<br />
• Minimum price difference between the Limit price and the On-Stop price is 10% for<br />
security prices between $3.00 and $5.00, and 5% for security prices above $5.00<br />
• For an order to be triggered, at least 2 executed trades must be reported at the order<br />
price<br />
• In order to prevent triggering of an order upon a spurious trade report (“bad print”) the<br />
order will be triggered only if the order price is within a 10% range of the current<br />
Bid/Ask quote<br />
Step 7:<br />
Once finished click on buy, sell, short or send (for bracket orders) to send the order. If you have<br />
Confirm Equity orders checked in your settings you will see a window pop-up with your order<br />
make sure everything is correct one last time before you send the order to the market.<br />
Step 8:<br />
There are three ways to cancel an order:<br />
1. Use the Cancel or Cancel All buttons on the<br />
Order Execution Box.<br />
• Cancel will cancel all open orders for the<br />
symbol in the symbol field<br />
• Cancel All will cancel all open orders<br />
regardless of symbol.<br />
2. Use the Cancel All button on the Account<br />
Manager Window.<br />
3. Select an order by right-clicking on the order to<br />
use the Pop-up Menu.<br />
• Cancel will only cancel that open order.<br />
• Cancel All will cancel all open orders.<br />
41
Market Restrictions<br />
(Subject to Change)<br />
TSX/TSX Venture – Orders placed between 9:27 AM and 9:32 AM EST can be refused by the<br />
exchange to facilitate an orderly opening of the market as the calculated opening price (COP) is<br />
being determined. Rejected orders during this time will have a status of ‘ECN rejected’ and can<br />
be re-entered until they are accepted by the exchange.<br />
TSX Last Trade Session (LSTS) – New orders entered after the regular market close intended<br />
for the TSX last trade session can be placed at 4:15 PM EST using GTEM and a limit price equal<br />
to the last trade price (as of 4:10 PM EST). The last sale trading price is determined as of 4:10<br />
PM and the TSX only accepts cancel requests between 4:10 PM and 4:15 PM EST.<br />
TSX Venture – The TSX-V imposes an “offer +/- penny” fail-safe on market orders that sweep<br />
the current inside BID/ASK quantity and leaves a portion of the order open. This fail-safe is<br />
added (on Buys – deducted on Sells) to protect both the client and market integrity.<br />
US Equity After Hours Trading - After hours trading (AHT) is available on <strong>Active</strong> <strong>Trader</strong> until<br />
5:30 PM EST. If you wish to participate in AHT between 5:30 PM and 7:00 PM EST you may do<br />
so by calling a representative at the <strong>Active</strong> <strong>Trader</strong> Desk, however you will be charged the full<br />
agent rate.<br />
GTEM – A GTEM order placed on or after 8 AM EST is good until 5:30 PM EST for US equity<br />
orders and 5:00 PM for Canadian orders (provided that the limit price matches the TSX Last<br />
Trading price). Orders intended to participate in the US pre-market session can only be entered<br />
beginning at 8:00 AM and will be valid for the entire trading day including the after hours trading<br />
session until 5:30pm.<br />
GTC – GTC Orders on the TSX will be cancelled after 90 days. GTC orders on the Montreal<br />
Exchange will be cancelled after 63 days. The order will have a status of “cancelled by force”.<br />
DAY - A DAY order is good until 4:00 pm EST. A special circumstance applies to TSX Day<br />
orders where if the limit price happens to match the TSX last sale price determined at 4:10 PM<br />
EST, the order will automatically be placed in the TSX Last Trade session until 5:00 PM EST.<br />
DAY Orders played after 5:00 pm EST will queue for the following day business day.<br />
MARKET – All MARKET orders sent after regular market hours (4:00 PM EST) using the AUTO<br />
route will be executed at 9:30 AM EST at the opening on the following trading day. The primary<br />
route must be changed to ARCA if you wish to send a market order during the US extending<br />
trading session (pre-market and after hours).<br />
SHORT – Restricted to DAY orders only (equities). Overbuying a short position will not make it a<br />
long position. Only the specific quantity of shares that you are short should be entered as the<br />
system will not allow you to sell any additional shares bought in excess of your short position.<br />
VTSO – VTSO Orders can be triggered by erroneous trade prints (“bad ticks”) that are reported<br />
by the exchange. These trades are not reflected in the high and low of the day. A fill occurring in<br />
this situation would be valid and not disputable.<br />
42
Placing an Option Order<br />
To place an order for an Option, follow the directions below:<br />
Step 1:<br />
Select an Option Box to trade from. Do this by clicking on the Option Box with the desired<br />
symbol or by clicking on the down arrow next to the symbol field in the Order Execution Box<br />
then choosing the desired symbol. If the symbol is not on any of the option boxes simply add the<br />
underlying symbol to an Option Box and pick from the symbols in the option chain. You will<br />
notice that once an Option Box is selected the symbol of that Option Box will auto-populate in<br />
the symbol field of the Order Execution Box.<br />
Step 2:<br />
Choose the account you will trade out of by<br />
clicking on the down arrow next to the<br />
account field.<br />
Step 3:<br />
Enter in the amount of shares in the quantity<br />
field.<br />
Step 4:<br />
Choose your price:<br />
If market is chosen the price field will gray out.<br />
43
Step 5:<br />
Select order type:<br />
• GTC: Good ‘til Cancel will keep the order active until you decide to cancel the order. If not<br />
selected order will be a DAY order. Canadian GTC option orders placed on the Montreal<br />
Exchange will be cancelled after 63 days. The order will have a status of “cancelled by<br />
force”.<br />
• Stop: This type of order is not available for Option orders.<br />
• VTSO: (Virtual Trailing Stop Order) This type of order is not available for Option orders.<br />
Step 6:<br />
Select the covered check box if the option order is<br />
to be covered or unchecked the box to send the<br />
order out as uncovered.<br />
Step 7:<br />
Once finished click on buy, sell, or short to send the<br />
order. If you have Confirm Option orders checked in<br />
your settings you will see a window pop-up with<br />
your order make sure everything is correct one last<br />
time before you send the order to the market.<br />
Step 8:<br />
To cancel an order:<br />
There are three ways to cancel an order:<br />
1. Use the cancel or cancel all buttons on the Order Execution Box.<br />
• Cancel will cancel all open orders for the symbol in the symbol field.<br />
• Cancel All will cancel all open orders regardless of symbol.<br />
2. Use the Cancel All button on the Account Manager Window.<br />
3. Select an order by right-clicking on the order to use the Pop-up Menu.<br />
• Cancel will only cancel that open order.<br />
• Cancel All will cancel all open orders.<br />
44
5. The Account Box<br />
Account Box Overview<br />
The <strong>Active</strong> <strong>Trader</strong> Account Box is divided into three sub-sections:<br />
• Open Order Window<br />
• Messages Window<br />
• Account Activity Window<br />
When a user is logged into multiple accounts, a new tabbed instance of the Account Box is<br />
created for each account. Each account-specific tab within the Account Box includes an Open<br />
Orders Window and Account Activity Window. The Message Window is independent of the<br />
account, and contains all messages received by the <strong>Active</strong> <strong>Trader</strong> terminal during the current<br />
session.<br />
45
Account Activity - Open Positions<br />
The Open Tab shows all open positions – regardless of when they were opened. These positions<br />
are currently held in the selected account and their values are fluctuating in real-time as the<br />
market prices move. All of the positions on this tab contribute to the Open P&L calculation shown<br />
in the Account Box Header.<br />
As positions are closed (i.e. sold or covered) they will automatically fall off of this screen and<br />
appear on the Closed Position tab.<br />
Each column shows the following:<br />
• Symbol: the stock/option symbol.<br />
• Size: the number of shares/contracts owned.<br />
• Price: the price per share at which the position was opened.<br />
• PL/Share: the present profit or loss calculated per individual share. Updated in near<br />
real-time on a tick-by-tick basis.<br />
• PL: the overall profit or loss for the total position. Updated in near real-time on a tick-bytick<br />
basis.<br />
• PL (Daily): the daily profit and loss calculated by subtracting the open price from the<br />
current price and multiplying by the total quantity.<br />
• Time: the time at which the position was opened.<br />
• ECN: the execution system that filled the order opening the position.<br />
• Open ID: the identification number of the position-opening order.<br />
The Open Tab P&L does NOT take into account commission charges from the opening of the<br />
positions. The P&L calculation is derived purely from the stock price and may therefore<br />
understate a loss or overstate a profit by the amounts of the commissions incurred.<br />
46
Account Activity - Closed Positions<br />
The Closed tab displays positions that have been closed during the current trading day. The<br />
positions detailed on this tab make up the Closed P&L calculations in the Account Header<br />
section. The columns contained in this section include:<br />
• Symbol: the stock/option symbol.<br />
• Size: the number of shares transacted.<br />
• Bought: the price per share when the shares were purchased.<br />
• Sold: the price per share when the shares were sold.<br />
• PL/Share: the profit or loss calculated per individual share.<br />
• PL: the overall profit or loss for the total position.<br />
• Time: the time at which the position was opened.<br />
• ECN: the execution system that filled the order opening the position.<br />
• Open ID: the identification number of the position-opening order.<br />
• Closed ID: the identification number of the position-closing order.<br />
Closed tab in the Account Activity window<br />
Right-clicking in the Closed tab will produce a pop-up menu with the standard<br />
Columns/Export/Print/Smart Width features. No additional operations can be performed on a<br />
closed position.<br />
47
Account History - Order History<br />
The Order History Tab (see figure below) presents a record of all orders sent to the markets<br />
during the current day, regardless of whether they were eventually filled, rejected, or cancelled.<br />
• Id: the identification number assigned to the order.<br />
• Time: the time the order was entered (not the time of execution or cancellation).<br />
• Action: the type of order (Buy, Sell, or Short)<br />
• Symbol: states the name of the equity.<br />
• Size: is the number of shares in the order.<br />
• Price: the order price for Limit Orders, or “Market” for Market Orders.<br />
• Status: the current status of the order (Pending, Cancelled, Executed, etc).<br />
• Reason: an explanation of the Status, if necessary (for orders labeled as Rejected or<br />
Canceled).<br />
• ECN: the execution venue to which the order was sent.<br />
Order History tab in the Account Activity window<br />
48
Interacting with Open Orders<br />
Open orders are displayed in a tabular format. The columns present the order details as follows:<br />
• Symbol: the stock/option symbol.<br />
• Action: the type of transaction (Buy, Sell, Short).<br />
• Price: the price-per-share for a Limit order, or “Market” for a Market order.<br />
• Size: the number of shares in the original order<br />
• Status: the current condition of the order (Accepted, Cancel Sent, etc)<br />
• Reason: explanation of the status under certain conditions.<br />
• Id: the numeric ID of the order. It is important to reference this number whenever<br />
contacting the <strong>Active</strong> <strong>Trader</strong> Desk regarding a specific order.<br />
• ECN: the execution network where the order has been sent. This is determined by the<br />
type of order (Market or Limit), the specific security (NASDAQ vs. NYSE, for instance),<br />
and other factors such as price or liquidity.<br />
• Type: Time In Force information if applicable.<br />
• Stop: the Stop Trigger Price when applicable.<br />
The right-click menu available in the Open Orders Window presents the following Options:<br />
• Cancel: to cancel an order, right-click on the specific order and choose<br />
Cancel.<br />
• Cancel All: will send a Cancel Request for ALL open orders (same<br />
function as the “Cancel All” button).<br />
• Modify Order: Click to modify a live order.<br />
• Columns: will launch the column layout utility – allows the user to hide<br />
or show particular columns and change column order.<br />
• Print: sends the contents of the window to the printer.<br />
• Export: exports the contents of the window to a CSV file – pops a “Save As…” dialog box.<br />
• Smart Width: adjusts the widths of the columns to display all values.<br />
49
Message window Overview<br />
The Message Window displays important messages primarily regarding system status and order<br />
activity. Messages are presented in a colour-coded format to assist in quick identification of<br />
important content.<br />
• Opening LONG positions are confirmed by green-letter messages.<br />
• Opening of SHORT positions are confirmed by red-letter messages.<br />
• Closing of profitable positions are confirmed by green-letter messages.<br />
• Closing of money-losing positions are confirmed by red-letter messages.<br />
• System problems are indicated by red-highlighted message lines.<br />
• Resolutions of system problems are indicated by green-highlighted message lines.<br />
• Basic order flow confirmations are shown in white-letter messages.<br />
Message window with order and position activity<br />
All messages are maintained throughout the login session, and the Message Window scrolls so<br />
that earlier messages can be reviewed.<br />
50
Multi-Account Management<br />
<strong>Active</strong> <strong>Trader</strong> allows a user to be logged-in to multiple accounts simultaneously.<br />
If you have multiple <strong>TD</strong> <strong>Waterhouse</strong> <strong>Active</strong> <strong>Trader</strong> accounts, the account that was last used will<br />
be preserved upon exiting the application and reentering it.<br />
The settings file is saved under the first account’s Connect ID. In order to maintain a consistent<br />
set of layout parameters and application settings, login first using the same primary account every<br />
time, and then login to additional accounts as necessary and in any order desired.<br />
To login to additional accounts, use the File Menu > Login option or right-click in the Account<br />
Box header area and select Login from the pop-up menu (see figure below). In order to minimize<br />
performance impacts, it is best to avoid logging into more accounts than can be effectively<br />
managed simultaneously, and to logout of accounts as they are no longer needed.<br />
Right-click in the Account Box header area to display the Login<br />
shortcut menu.<br />
51
Open Order Window Overview<br />
Immediately below the account number tabs is the Open Orders Window. Included in the subsection<br />
of the Account Box is the “Cancel All” button, the Account Header, and the Orders<br />
Screen.<br />
The “Cancel All” button is used to send cancel request messages for ALL open orders displayed<br />
in the selected account. When clicked, each open order will generate a cancel request, and the<br />
status will change to “Canceling”. Once a “UR-Out” is received from the execution venue the<br />
order status will change to “Canceled” and the order will fall off of the Open Order screen.<br />
Alternatively, some orders may be “too late to cancel” in which case the Cancel request will be<br />
rejected and an execution will be returned instead.<br />
To the right of the “Cancel All” button is the Account Header, which displays the Buy Power<br />
and P&L information for the selected account (as shown in the previous figure):<br />
Understanding Margin Excess and Buy Power<br />
• Buy Power (BP): Cash and Registered accounts display Buy Power which represents<br />
the cash available for purchases. The Buy Power figure displayed will update in real-time<br />
by deducting cash for open buy orders and crediting cash for filled sell orders. Cash and<br />
Registered accounts are always cash up front on the <strong>Active</strong> <strong>Trader</strong> Platform, meaning<br />
that the system will only allow you to utilize the cash currently in the account and will not<br />
recognize money market as buying power. Please contact the <strong>Active</strong> <strong>Trader</strong> Desk if you<br />
wish to have your buying power adjusted for the day to reflect a money market position in<br />
your account.<br />
• Margin Excess (ME) Margin accounts display Margin Excess which represents the total<br />
amount of extra capital available if you wish to use it. It is the sum of the loan values<br />
generated for all securities, less any amounts already borrowed, plus any available credit<br />
balances. Please note that inter-listed stocks use the Canadian closing prices for margin.<br />
Note: ME and BP will not reflect intraday deposits and withdrawals made on WebBroker<br />
until the following business day. Please contact the <strong>Active</strong> <strong>Trader</strong> Desk if you wish to<br />
have your buy power or margin excess adjusted for the trading day to reflect any intraday<br />
transfers of cash or securities.<br />
52
• Open P&L (O/PL): represents the total profit or loss of the positions presently held in the<br />
account. If the number is in green, then the total open positions are worth more than their<br />
opening price. If red, then the open positions are worth less than their opening value. The<br />
Open P&L changes just as quickly as the values of the open positions change with the<br />
market conditions. The Open P&L does NOT take into account commission charges from<br />
the opening of the positions. The P&L calculation is derived purely from the stock price<br />
and may therefore understate a loss or overstate a profit by the amounts of the<br />
commissions incurred.<br />
• Closed P&L (C/PL): indicates the total Profit or Loss realized from the closing of<br />
positions during the current day. If the number is displayed in green then the account has<br />
a profit from the closing of the positions. If red, then the account has incurred a loss on<br />
the closing of positions today.<br />
NOTE: The Closed P&L does NOT take into account past commission charges from the opening<br />
of the positions, nor the commission costs associated with closing the positions. The P&L<br />
calculation is derived purely from the stock price and may therefore understate a loss or overstate<br />
a profit by the amounts of the commissions incurred.<br />
53
Setting Alerts on Open Positions<br />
The right-click menu within the Open Positions tab presents Alert Options in addition to the<br />
standard Columns/Print/Export features. Open Position Alerts are set based on P&L per share,<br />
and will alert the user when a particular position has exceeded a P&L/share limit (either above or<br />
below a threshold).<br />
To set a Position Alert: right-click on the position and<br />
select “Alert” from the menu. In the Alert Setup box,<br />
select whether to be alerted when the P&L drops below<br />
a certain value (PL/Share =), or both. Enter<br />
the value for the Alert Items checked as a dollar amount<br />
with decimal places (enter a negative number to be<br />
alerted for negative P&L values).<br />
Once the alert is set, the red arrow icon will appear next to the Symbol. The alert is saved as part<br />
of the user settings and will remain in effect until the user deletes it, or until the position is closed.<br />
When the alert is triggered, three indications are given –<br />
a sound is played, a pop-up is displayed, and a red<br />
flashing highlight appears in the Open Positions tab.<br />
After the alert is triggered, use the “Reset Alert” option on<br />
the right-click menu to remove the red highlighting on the<br />
symbol and to prepare the alert to fire again when the<br />
parameters are next exceeded.<br />
Flashing red highlight indicates that<br />
the position triggered its alert.<br />
54
System Status Lights<br />
<strong>Active</strong> <strong>Trader</strong> provides the user with constant real-time system status via the three “lights” at the<br />
bottom of the Account Box module. The colour of each box reveals the current condition of the<br />
connections to the system servers, and the status of the systems. All three boxes can display<br />
Green, Yellow, or Red status indications. Green indicates solid performance, and that all systems<br />
are operational. A Yellow indicator means that performance might be poorer than usual, or that<br />
some systems might be non-operational. Red boxes mean that a critical system component is not<br />
functioning.<br />
Additionally, hovering the mouse pointer over each status light activates a pop-up text box that<br />
provides more detailed status information.<br />
• Network: indicates the state of the Internet connection to the system servers. This light turns<br />
yellow when data delays exceed 500ms, and red when connectivity is lost. Hovering over this<br />
box provides statistics on both data delay (measured in milliseconds) and bandwidth<br />
(measured in bits per second).<br />
• Quotes: denotes the status of the <strong>Active</strong> <strong>Trader</strong> quote data providers. Yellow indicates that<br />
one or more data stream is not available, and red corresponds with a loss of all quote data.<br />
Hovering over this box will produce a list of data providers with an “Up” or “Down” status for<br />
each.<br />
• Trading: similar to Quotes, this indicates the status of the various execution venues to which<br />
<strong>Active</strong> <strong>Trader</strong> sends orders. Yellow indicates that one or more execution venues are<br />
unavailable, while red means that no orders can be currently placed. Hovering over this box<br />
will produce a list of execution venues with an “Up” or “Down” status for each.<br />
55
6. Charts and Studies<br />
Working with <strong>Active</strong> <strong>Trader</strong> Charts<br />
<strong>Active</strong> <strong>Trader</strong> can display up to four charts simultaneously, and each separate chart is numbered.<br />
New charts are added via either the Window > Chart menu, or the “New Chart” button on the<br />
Quick Launch tool bar.<br />
The basic elements of each chart include:<br />
• The Chart Symbol – the text field in the upper right. This works like the symbol field on each<br />
Stock Box. A stock, index or option symbol can be typed in, or can be dragged and dropped<br />
from other modules.<br />
• The Chart Header – with the company or index name in the title bar, and the Duration,<br />
Interval, and active studies settings in the upper left (see example above).<br />
• Main Chart Area – displays the chart data in candlestick, bar, or line format. Studies are<br />
also displayed in this area – either below the chart price data, or overlaid with the pricing<br />
data.<br />
• Volume – below the main chart area the trading volume is displayed in bar or line format. To<br />
resize the volume area, hover over the horizontal bar which separates volume from the main<br />
chart area until a double-arrow icon appears. Then click and drag the bar to the desired<br />
location.<br />
• Horizontal Scroll Bar – use the scroll bar at the bottom of the chart to move along the time<br />
axis.<br />
56
• Stay to the Right Button - this button to the immediate right of the horizontal scroll bar<br />
toggles on and off and determines whether the chart automatically stays focused on the right<br />
edge (auto-scrolling as new data is displayed). If toggled off the chart will stay focused<br />
wherever it is manually set along its horizontal axis.<br />
• After Hours Button – toggle this clock-icon button on to display chart activity which occurred<br />
outside of normal market hours.<br />
• Displaying Tick Details – click and hold the left mouse button in the<br />
main chart area to pop-up a details window (see the figure below). The<br />
details in this window correspond to the specific interval under the<br />
mouse pointer, and will change dynamically as the mouse is moved<br />
across the chart with the mouse button depressed. For each interval<br />
the display includes the Open, Close, High, and Low price data points,<br />
as well as the trading volume, time and date stamp, and the data<br />
values for any active studies within the interval.<br />
• Correcting a “Bad Tick” – although the <strong>Active</strong> <strong>Trader</strong><br />
servers filter for late or misleading tick data, occasionally<br />
some pricing data will be included in a chart that causes<br />
the chart to be skewed. When this occurs the user may<br />
correct the bad tick by double-clicking on the incorrect<br />
candlestick on the chart to pop-up the edit utility (see<br />
figure below). Enter the correct Open, Close, High, Low,<br />
or Volume value in the appropriate field, and click Save<br />
to refresh the chart and write the correction to the local<br />
disk. <strong>Active</strong> <strong>Trader</strong> will retain the last 100 chart<br />
corrections on the local system so that refreshing a chart from the server does not cause the<br />
bad tick to reappear.<br />
57
Basic Chart Settings<br />
Each <strong>Active</strong> <strong>Trader</strong> chart can have its own unique settings and parameters. Right-click within a<br />
chart to configure the Interval, Duration, or to select the Chart Settings window that corresponds<br />
to the selected chart. As shown in the figure, switching between Intraday, Daily, and Weekly<br />
presentations is accomplished within the right-click menu. Additionally, the specific intervals in an<br />
intraday chart are selected from the intraday sub-menu, as are the number of days (1 to 5) that<br />
the minute chart will cover. When any of these menu choices are selected, the chart is instantly<br />
refreshed to the new settings.<br />
58
Choose “Settings” from the right-click menu to display the Chart Settings dialog box. The first<br />
section in this window is labeled “Chart” and controls all of the basic chart characteristics except<br />
for studies’ parameters.<br />
Each element controls chart<br />
behavior as follows:<br />
• After Hours Colour – sets the<br />
background colour for chart data<br />
which occurs outside of normal<br />
market hours.<br />
• Background Colour – set the<br />
background colour for chart<br />
activity during standard market<br />
hours.<br />
• Chart Bar/Candlestick/Line –<br />
select the display type for price<br />
data within the main chart area.<br />
Expand any of these three<br />
selections (via the “+” button) to<br />
reveal further choices to control<br />
the display variables for each<br />
type of chart:<br />
• Width: sets the width of the<br />
interval in terms of horizontal<br />
pixels.<br />
• Colour: select a custom colour<br />
for a bar or line element.<br />
• “Use Up/Down Colours”:<br />
<strong>Active</strong> <strong>Trader</strong> will paint the chart<br />
bars/lines in the standard Up<br />
and Down price colours (green<br />
and red by default), based on a<br />
comparison of the Open and<br />
Close prices for the interval,<br />
indicating whether the interval<br />
was up or down.<br />
• Days in Day Chart – the total number of days to display when Daily is selected for the chart<br />
interval via the right-click menu.<br />
• Display Cross Hairs – check this box so display persistent cross hairs whenever the mouse<br />
pointer hovers over the chart.<br />
• Grid/Scale Colour – select a custom colour for grid lines and scale label font.<br />
• Line Thickness – set the width of the line used to draw a line chart (has no effect in Bar or<br />
Candlestick charts).<br />
59
• Link to Stock Box – by default, each chart is linked to the Stock Box of the corresponding<br />
number. This link allows the chart to update automatically when the symbol is changes in the<br />
corresponding stock box. To change the linkage enter the Stock Box number to which the<br />
chart should be linked – or enter a 0 (zero) if the chart should be independent of any<br />
linkages.<br />
• Overlay Colour: when an overlay symbol is added to the chart, its line and price scale will<br />
appear in this colour.<br />
• Overlay Symbol: type the symbol to be overlaid on the chart. In the figure above the<br />
NASDAQ Composite (^COMPX) is overlaid on the chart.<br />
• Support Line Default Colour: define the default colour for a horizontal line placed at a<br />
specific price point.<br />
• Support Line Thickness: specifies the thickness of a support line.<br />
• Time Scale Interval – this parameter determines how tight or wide the spacing is between<br />
the time scale values on the horizontal axis. A smaller number will condense the time periods<br />
into a smaller width, and a larger number will spread them out.<br />
Note: The Time Scale Interval may also be adjusted “on the fly” without using the settings<br />
dialog box. To change the horizontal scale of an active chart, place the mouse icon directly in<br />
the time scale area, and then click and drag to the left to condense the spacing, or click and<br />
drag to the right to expand the spacing. The Scale Interval number in the settings window will<br />
be set automatically.<br />
• Trend Line Default Colour: define the initial default colour for a user-defined trend line.<br />
• Trend Line Thickness: specifies the thickness of a user-defined trend line.<br />
• Volume – select whether to display volume as a Bar or Line graph, and choose the colours<br />
and widths as desired. Or select “None” to hide the volume section of the chart completely.<br />
• Weeks in Week Chart – the total number of weeks to display when Weekly is selected for<br />
the chart interval via the right-click menu.<br />
60
Drawing Trend Lines and Support Lines<br />
Each <strong>Active</strong> <strong>Trader</strong> chart can display up to six trend lines and three support lines simultaneously.<br />
Trend lines are user-drawn diagonal lines used to plot a price trend in order to more easily<br />
identify when a stock breaks through that specific trend. Support lines are horizontal lines which<br />
are typically used to define a support-resistance price range within which a stock is moving, also<br />
to help identify break-out events.<br />
Using Trend Lines:<br />
• Adding Trend Lines: Hold down on the [Shift] key and then click and drag with the left<br />
mouse button to draw the line. The trend line will appear in the default colour specified within<br />
the Chart Settings.<br />
• Adjusting a Trend Line: position the mouse pointer over either end of the trend line until a<br />
4-arrow pointer appears. Then click and drag the end of the line as desired to change its<br />
angle and location.<br />
• Changing Colour: position the mouse pointer over either end of the trend line until a 4-arrow<br />
pointer appears. Right-click and select “Colour” from the pop-up menu. Choose the desired<br />
colour from the custom colour box and click [OK].<br />
• Deleting Trend Lines: position the mouse pointer over either end of the trend line until a 4-<br />
arrow pointer appears. Right-click and select “Delete” from the pop-up menu to delete the<br />
selected line. Or select “Delete All” from the pop-up menu to delete ALL of the trend lines on<br />
the selected chart (other charts will not be affected).<br />
Trend lines are treated separately within the Intraday, Daily, and Weekly charts. Trend lines<br />
placed on a Daily chart will NOT show up on the Weekly chart in the same Chart box. However,<br />
the maximum of six trend lines applies to the entire chart module – Intraday, Daily, and Weekly<br />
combined. When the maximum of six trend lines is reached, adding a seventh line will<br />
automatically delete the first.<br />
61
Using Support Lines:<br />
• Adding Support Lines: Hold down on the [Control] key and then click the left mouse button<br />
to insert the horizontal line. The support line will appear in the default colour specified within<br />
the Chart Settings.<br />
• Adjusting a Support Line: position the mouse pointer over the support line until a 2-arrow<br />
pointer appears. Then click and drag the line up or down as desired to change its location.<br />
• Changing Colour: position the mouse pointer over the support line until a 2-arrow pointer<br />
appears. Right-click and select “Colour” from the pop-up menu. Choose the desired colour<br />
from the custom colour box and click [OK].<br />
• Deleting Support Lines: position the mouse pointer over the support line until a 2-arrow<br />
pointer appears. Right-click and select “Delete” from the pop-up menu to delete the selected<br />
line. Or select “Delete All” from the pop-up menu to delete ALL of the support lines on the<br />
selected chart (other charts will not be affected).<br />
Support lines placed within a chart box are displayed on all three of the chart types within that<br />
box. Support lines placed on a Daily chart WILL show up on the Weekly and Intraday chart in the<br />
same Chart box. When the maximum of three support lines is reached, adding a fourth support<br />
line will automatically delete the first.<br />
62
Studies – Average Directional Index (ADX)<br />
To activate the ADX study:<br />
• Check the box next to the study title.<br />
• Expand the study (click the “+”) to set the specific parameters.<br />
• Choose the colours for the three lines (ADX, DMI-, and DMI+).<br />
• Choose the number of intervals for ADX Period and DMI Period.<br />
• Select the “Overlay” option to display the study lines within the area as the pricing data, or<br />
leave this clear to display the study below the chart with a separate vertical scale.<br />
63
Studies - Bollinger Band (BB)<br />
To activate the Bollinger Band study:<br />
• Check the box next to the study title.<br />
• Expand the study (click the “+”) to set the specific parameters.<br />
• Choose the colours for the three lines (BB Avg, BB-, and BB+)<br />
• Choose the number of intervals for the BB Period and the number of Standard Deviations.<br />
• The Bollinger Band is always displayed as an overlay.<br />
64
Studies – Moving Average Convergence Divergence (MACD)<br />
To activate the MACD study:<br />
• Check the box next to the study title.<br />
• Expand the study (click the “+”) to set the specific parameters.<br />
• Choose the colours for the two lines (MACD, and Trigger).<br />
• Choose the number of intervals for Period 1, Period 2, and Trigger Period.<br />
• Select the “Overlay” option to display the study lines within the area as the pricing data, or<br />
leave this clear to display the study below the chart with a separate vertical scale.<br />
65
Studies - Momentum (MOM)<br />
To activate the Momentum Study:<br />
• Check the box next to the study title.<br />
• Expand the study (click the “+”) to set the specific parameters.<br />
• Choose the colour for the line.<br />
• Choose the number of intervals for the Momentum Period.<br />
• Select the “Overlay” option to display the study lines within the area as the pricing data, or<br />
leave this clear to display the study below the chart with a separate vertical scale.<br />
66
Studies - Moving Averages (MA)<br />
To activate the Moving Average studies:<br />
• Check the box next to the study titles.<br />
• Expand the studies (click the “+”) to set the specific parameters.<br />
• Choose the colours for the lines.<br />
• Choose the number of intervals for the MA Period.<br />
• Moving Averages are always overlaid, so the “Overlay” option is not available.<br />
67
Studies - Rate of Change (ROC)<br />
To activate the ROC study:<br />
• Check the box next to the study title.<br />
• Expand the study (click the “+”) to set the specific parameters.<br />
• Choose the colours for the ROC line.<br />
• Choose the number of intervals for the ROC Period.<br />
• Select the “Overlay” option to display the study lines within the area as the pricing data, or<br />
leave this clear to display the study below the chart with a separate vertical scale.<br />
68
Studies - Relative Strength (RSI)<br />
To activate the RSI studies:<br />
• Check the box next to the study titles.<br />
• Expand the studies (click the “+”) to set the specific parameters.<br />
• Choose the colours for the each RSI line.<br />
• Choose the number of intervals for the RSI Period(s).<br />
• Select the “Overlay” option to display the study lines within the area as the pricing data, or<br />
leave this clear to display the study below the chart with a separate vertical scale.<br />
69
Studies – Stochastics<br />
To activate the Stochastics study:<br />
• Check the box next to the study title.<br />
• Expand the study (click the “+”) to set the specific parameters.<br />
• Choose the colours for the three lines (%D Fast, %D Slow, and %K)<br />
• Choose the number of intervals for the %D Fast Period, %D Slow Period, %K Period, and<br />
%K Slow Period.<br />
• Select the “Overlay” option to display the study lines within the area as the pricing data, or<br />
leave this clear to display the study below the chart with a separate vertical scale.<br />
70
Studies – Triple Exponential Smoothing Oscillator (TRIX)<br />
To activate the TRIX study:<br />
• Check the box next to the study title.<br />
• Expand the study (click the “+”) to set the specific parameters.<br />
• Choose the colours for the two lines (TRIX, and Trigger)<br />
• Choose the number of intervals for the TRIX Period and Trigger Period.<br />
• Select the “Overlay” option to display the study lines within the area as the pricing data, or<br />
leave this clear to display the study below the chart with a separate vertical scale.<br />
71
Studies – True Strength Index (TSI)<br />
To activate the True Strength Indicator (TSI) study:<br />
• Check the box next to the study title.<br />
• Expand the study (click the “+”) to set the specific parameters.<br />
• Choose the colour for the TSI line<br />
• Choose the number of intervals for MA Period 1, MA Period 2, and the Momentum Period.<br />
• Select the “Overlay” option to display the study lines within the area as the pricing data, or<br />
leave this clear to display the study below the chart with a separate vertical scale.<br />
72