Development of Standard Test Procedures for ... - Toolpoint
Development of Standard Test Procedures for ... - Toolpoint
Development of Standard Test Procedures for ... - Toolpoint

You also want an ePaper? Increase the reach of your titles
YUMPU automatically turns print PDFs into web optimized ePapers that Google loves.
ARTICLE IN PRESS<br />
Original Report<br />
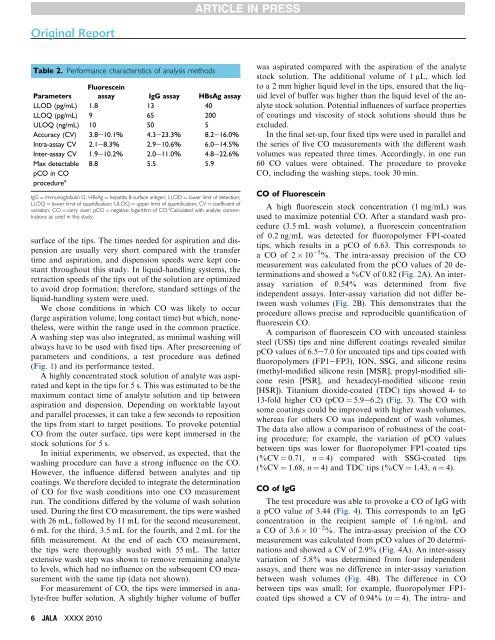
Table 2. Per<strong>for</strong>mance characteristics <strong>of</strong> analysis methods<br />
Parameters<br />
Fluorescein<br />
assay IgG assay HBsAg assay<br />
LLOD (pg/mL) 1.8 13 40<br />
LLOQ (pg/mL) 9 65 200<br />
ULOQ (ng/mL) 10 50 5<br />
Accuracy (CV) 3.8e10.1% 4.3e23.3% 8.2e16.0%<br />
Intra-assay CV 2.1e8.3% 2.9e10.6% 6.0e14.5%<br />
Inter-assay CV 1.9e10.2% 2.0e11.0% 4.8e22.6%<br />
Max detectable<br />
pCO in CO<br />
procedure a 8.8 5.5 5.9<br />
IgG ¼ immunoglobulin G; HBsAg ¼ hepatitis B surface antigen; LLOD ¼ lower limit <strong>of</strong> detection;<br />
LLOQ ¼ lower limit <strong>of</strong> quantification; ULOQ ¼ upper limit <strong>of</strong> quantification; CV ¼ coefficient <strong>of</strong><br />
variation; CO ¼ carry over; pCO ¼ negative logarithm <strong>of</strong> CO. a Calculated with analyte concentrations<br />
as used in this study.<br />
surface <strong>of</strong> the tips. The times needed <strong>for</strong> aspiration and dispension<br />
are usually very short compared with the transfer<br />
time and aspiration, and dispension speeds were kept constant<br />
throughout this study. In liquid-handling systems, the<br />
retraction speeds <strong>of</strong> the tips out <strong>of</strong> the solution are optimized<br />
to avoid drop <strong>for</strong>mation; there<strong>for</strong>e, standard settings <strong>of</strong> the<br />
liquid-handling system were used.<br />
We chose conditions in which CO was likely to occur<br />
(large aspiration volume, long contact time) but which, nonetheless,<br />
were within the range used in the common practice.<br />
A washing step was also integrated, as minimal washing will<br />
always have to be used with fixed tips. After prescreening <strong>of</strong><br />
parameters and conditions, a test procedure was defined<br />
(Fig. 1) and its per<strong>for</strong>mance tested.<br />
A highly concentrated stock solution <strong>of</strong> analyte was aspirated<br />
and kept in the tips <strong>for</strong> 5 s. This was estimated to be the<br />
maximum contact time <strong>of</strong> analyte solution and tip between<br />
aspiration and dispension. Depending on worktable layout<br />
and parallel processes, it can take a few seconds to reposition<br />
the tips from start to target positions. To provoke potential<br />
CO from the outer surface, tips were kept immersed in the<br />
stock solutions <strong>for</strong> 5 s.<br />
In initial experiments, we observed, as expected, that the<br />
washing procedure can have a strong influence on the CO.<br />
However, the influence differed between analytes and tip<br />
coatings. We there<strong>for</strong>e decided to integrate the determination<br />
<strong>of</strong> CO <strong>for</strong> five wash conditions into one CO measurement<br />
run. The conditions differed by the volume <strong>of</strong> wash solution<br />
used. During the first CO measurement, the tips were washed<br />
with 26 mL, followed by 11 mL <strong>for</strong> the second measurement,<br />
6 mL <strong>for</strong> the third, 3.5 mL <strong>for</strong> the fourth, and 2 mL <strong>for</strong> the<br />
fifth measurement. At the end <strong>of</strong> each CO measurement,<br />
the tips were thoroughly washed with 55 mL. The latter<br />
extensive wash step was shown to remove remaining analyte<br />
to levels, which had no influence on the subsequent CO measurement<br />
with the same tip (data not shown).<br />
For measurement <strong>of</strong> CO, the tips were immersed in analyte-free<br />
buffer solution. A slightly higher volume <strong>of</strong> buffer<br />
was aspirated compared with the aspiration <strong>of</strong> the analyte<br />
stock solution. The additional volume <strong>of</strong> 1 mL, which led<br />
to a 2 mm higher liquid level in the tips, ensured that the liquid<br />
level <strong>of</strong> buffer was higher than the liquid level <strong>of</strong> the analyte<br />
stock solution. Potential influences <strong>of</strong> surface properties<br />
<strong>of</strong> coatings and viscosity <strong>of</strong> stock solutions should thus be<br />
excluded.<br />
In the final set-up, four fixed tips were used in parallel and<br />
the series <strong>of</strong> five CO measurements with the different wash<br />
volumes was repeated three times. Accordingly, in one run<br />
60 CO values were obtained. The procedure to provoke<br />
CO, including the washing steps, took 30 min.<br />
CO <strong>of</strong> Fluorescein<br />
A high fluorescein stock concentration (1 mg/mL) was<br />
used to maximize potential CO. After a standard wash procedure<br />
(3.5 mL wash volume), a fluorescein concentration<br />
<strong>of</strong> 0.2 ng/mL was detected <strong>for</strong> fluoropolymer FP1-coated<br />
tips, which results in a pCO <strong>of</strong> 6.63. This corresponds to<br />
aCO<strong>of</strong>2 10 5 %. The intra-assay precision <strong>of</strong> the CO<br />
measurement was calculated from the pCO values <strong>of</strong> 20 determinations<br />
and showed a %CV <strong>of</strong> 0.82 (Fig. 2A). An interassay<br />
variation <strong>of</strong> 0.54% was determined from five<br />
independent assays. Inter-assay variation did not differ between<br />
wash volumes (Fig. 2B). This demonstrates that the<br />
procedure allows precise and reproducible quantification <strong>of</strong><br />
fluorescein CO.<br />
A comparison <strong>of</strong> fluorescein CO with uncoated stainless<br />
steel (USS) tips and nine different coatings revealed similar<br />
pCO values <strong>of</strong> 6.5e7.0 <strong>for</strong> uncoated tips and tips coated with<br />
fluoropolymers (FP1eFP3), ION, SSG, and silicone resins<br />
(methyl-modified silicone resin [MSR], propyl-modified silicone<br />
resin [PSR], and hexadecyl-modified silicone resin<br />
[HSR]). Titanium dioxide-coated (TDC) tips showed 4- to<br />
13-fold higher CO (pCO ¼ 5.9e6.2) (Fig. 3). The CO with<br />
some coatings could be improved with higher wash volumes,<br />
whereas <strong>for</strong> others CO was independent <strong>of</strong> wash volumes.<br />
The data also allow a comparison <strong>of</strong> robustness <strong>of</strong> the coating<br />
procedure; <strong>for</strong> example, the variation <strong>of</strong> pCO values<br />
between tips was lower <strong>for</strong> fluoropolymer FP1-coated tips<br />
(%CV ¼ 0.71, n ¼ 4) compared with SSG-coated tips<br />
(%CV ¼ 1.68, n ¼ 4) and TDC tips (%CV ¼ 1.43, n ¼ 4).<br />
CO <strong>of</strong> IgG<br />
The test procedure was able to provoke a CO <strong>of</strong> IgG with<br />
a pCO value <strong>of</strong> 3.44 (Fig. 4). This corresponds to an IgG<br />
concentration in the recipient sample <strong>of</strong> 1.6 ng/mL and<br />
a CO <strong>of</strong> 3.6 10 2 %. The intra-assay precision <strong>of</strong> the CO<br />
measurement was calculated from pCO values <strong>of</strong> 20 determinations<br />
and showed a CV <strong>of</strong> 2.9% (Fig. 4A). An inter-assay<br />
variation <strong>of</strong> 5.8% was determined from four independent<br />
assays, and there was no difference in inter-assay variation<br />
between wash volumes (Fig. 4B). The difference in CO<br />
between tips was small; <strong>for</strong> example, fluoropolymer FP1-<br />
coated tips showed a CV <strong>of</strong> 0.94% (n ¼ 4). The intra- and<br />
6 JALA XXXX 2010