o_1924omaf816ru1qj871317su170na.pdf

You also want an ePaper? Increase the reach of your titles
YUMPU automatically turns print PDFs into web optimized ePapers that Google loves.
Correlated response in some lifetime traits in Holstein cows<br />
combines three very important traits like age at first<br />
calving, first lactation yield and first calving interval [15].<br />
The trait was calculated by dividing the first lactation yield<br />
by the age at second calving reckoned as the total of the<br />
age at first calving and first calving interval. Forage were<br />
fed as part of the base ration. A more detailed description<br />
on feed intake and its measurement was given by Al-<br />
Anbari and Al-Samarai [16]<br />
Statistical analysis<br />
Statistical analysis included 944 records was carried out<br />
using SAS [17]. Expected correlated response in lifetime<br />
traits as a result of selection cows with different selection<br />
intensity according the indicator traits was estimated by<br />
using the following equation (Bourdon, 1997):<br />
BVy , x t = rBVx , BVy hx hy ix Py/ L<br />
Where BVy , x t = the rate of genetic change in trait Y<br />
per unit of time (t) due to phenotypic selection for trait X,<br />
rBVx , BVy = the genetic correlation between traits x and<br />
y,<br />
hx = the square root of heritability for trait x,<br />
hy = the square root of heritability for trait y,<br />
ix = selection intensity for trait x,<br />
Py = phenotypic variation for trait y,<br />
L = generation interval (5 years)<br />
Because there is a clear point of truncation, selection in<br />
this case is termed truncation selection, and a short method<br />
for calculating selection intensity is the number of cows<br />
chosen to be parents as a proportion of the number of<br />
potential parents or the proportion saved. The proportion<br />
selection intensity can then read from a certain table [14].<br />
We assumed that the selection included 123 cows out of<br />
944 cows which mean a proportion selection 13% and the<br />
corresponding selection intensity 1.64 and the selection of<br />
246 and 368 cows with a proportion selection 26, 39% and<br />
selection intensity 1.25 and 0.98 respectively. To<br />
determine whether selecting for an indicator trait is more<br />
effective than selecting directly for a trait of interest, we<br />
estimated response from both types of selection and<br />
expressed the results as a ratio by using the following<br />
equation [14]:<br />
BVy , x / BVy = r BVx , BVy hx ix / hy iy<br />
All notations in the equation are the same to notations of<br />
equation 1 except iy which denote to selection intensity<br />
in trait y.<br />
All genetic and phenotypic parameters were taken from<br />
[16, 18].<br />
two researches for the same data<br />
Several notions are using in this research and the meaning<br />
of each of them as following:<br />
AVMSC = average milk yield per day of age at second<br />
calving, PL = productive life NL = number of lactations,<br />
FMY = first lactation milk yield, AVMPL = average milk<br />
yield per day of productive life, AVML = average milk<br />
yield per day of lifetime milk yield, LTMY = lifetime milk<br />
yield, PL = productive life, NL = number of lactations.<br />
RESULTS & DISCUSSION<br />
Tables 1 and 2 show the genetic parameters used in this<br />
research, whereas table 3 show the expected correlated<br />
response in productive life at different intensities of<br />
selection 1.64, 1.25 and 0.98 which represent 123, 246<br />
and 368 cows out of 944 cows respectively, due to<br />
selection according to average milk yield per day of age at<br />
second calving at the the different selection intensities<br />
mentioned above, the expectation of correlated response in<br />
PL are 0.20, 0.15 and 0.12 month/year respectively. The<br />
corresponding estimates for number of lactations are<br />
0.022, 0.017 and 0.013 lactation/year.<br />
Concerning other life time traits, table 4 show the<br />
expected correlated response at selection intensity 1.64,<br />
1.25 and 0.98 of cows were 0.15, 0.12 and 0.10 (kg/year)<br />
for average milk yield per day of productive life, 0.09,<br />
0.07 and 0.05 (kg/year) for average milk yield per day of<br />
lifetime and 278.58, 212.33 and 166.47 (kg/year) for<br />
lifetime milk yield respectively. One way to determine<br />
whether selecting for an indicator trait is more effective<br />
than selection directly for a trait of interest is to estimate<br />
response from both types of selection and express the<br />
result as a ratio [14]. Its obvious from table 5 that most<br />
traits were dominated in response by selection for an<br />
indicator trait compared with directly selection. In view of<br />
the present results we support using an indicator trait<br />
because it will reduce the generation interval and increase<br />
the annual gain and profitability of dairy project. Similar<br />
conclusions were reported by Pryce et al., [19] who pointed<br />
to the importance of using indicator traits in selection<br />
indexes for improve function traits. It should be clear that<br />
the rate of genetic change in a population depends to a<br />
large degree on accuracy of selection or, more precisely,<br />
accuracy of breeding value prediction.<br />
Some traits had low estimate of heritability such as fitness<br />
traits (lifetime traits) and the information on these traits<br />
only becomes available when animals are already culled<br />
which means longer generation interval and low rate of<br />
genetic change, some else traits such as threshold traits<br />
which were defined as polygenetic traits that are not<br />
continuous in their expression, tend to have small selection<br />
intensity and then low rate of genetic change. One<br />
important alternative way to improve these traits is using<br />
indicator traits to selection for these traits particularly,<br />
when an indicator trait has a high heritability and can<br />
measured at early age.<br />
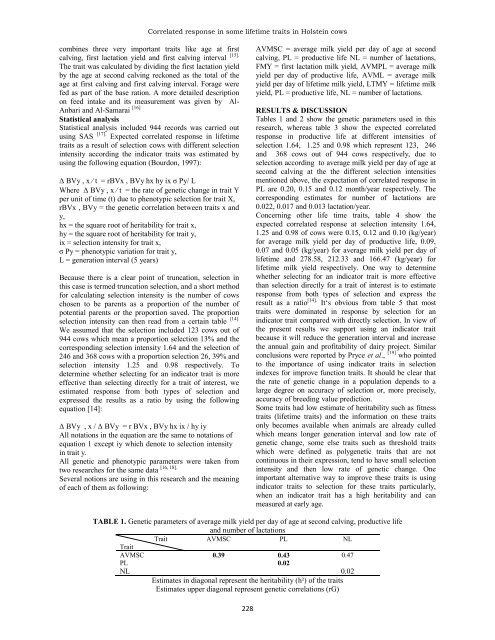
TABLE 1. Genetic parameters of average milk yield per day of age at second calving, productive life<br />
and number of lactations<br />
Trait<br />
AVMSC PL NL<br />
Trait<br />
AVMSC 0.39 0.43 0.47<br />
PL 0.02<br />
NL 0.02<br />
Estimates in diagonal represent the heritability (h²) of the traits<br />
Estimates upper diagonal represent genetic correlations (rG)<br />
228