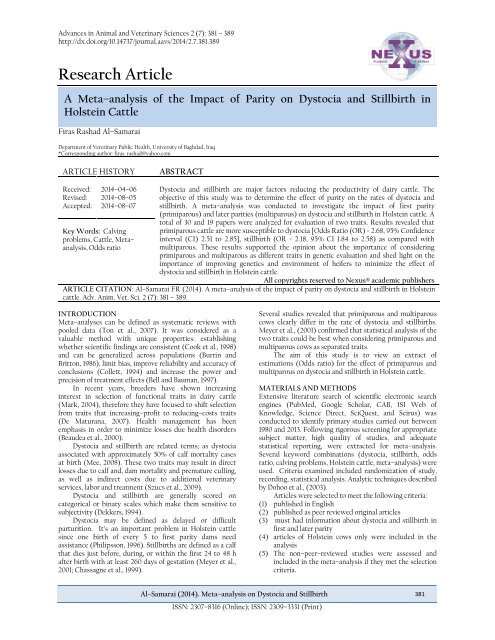
Research Article

Create successful ePaper yourself
Turn your PDF publications into a flip-book with our unique Google optimized e-Paper software.
Advances in Animal and Veterinary Sciences 2 (7): 381 – 389<br />
http://dx.doi.org/10.14737/journal.aavs/2014/2.7.381.389<br />
<strong>Research</strong> <strong>Article</strong><br />
A Meta–analysis of the Impact of Parity on Dystocia and Stillbirth in<br />
Holstein Cattle<br />
Firas Rashad Al–Samarai<br />
Department of Veterinary Public Health, University of Baghdad, Iraq<br />
*Corresponding author: firas_rashad@yahoo.com<br />
ARTICLE HISTORY<br />
ABSTRACT<br />
Received:<br />
Revised:<br />
Accepted:<br />
2014–04–06<br />
2014–08–05<br />
2014–08–07<br />
Key Words: Calving<br />
problems, Cattle, Meta–<br />
analysis, Odds ratio<br />
Dystocia and stillbirth are major factors reducing the productivity of dairy cattle. The<br />
objective of this study was to determine the effect of parity on the rates of dystocia and<br />
stillbirth. A meta–analysis was conducted to investigate the impact of first parity<br />
(primiparous) and later parities (multiparous) on dystocia and stillbirth in Holstein cattle. A<br />
total of 30 and 19 papers were analyzed for evaluation of two traits. Results revealed that<br />
primiparous cattle are more susceptible to dystocia [Odds Ratio (OR) = 2.68, 95% Confidence<br />
interval (CI) 2.51 to 2.85], stillbirth (OR = 2.18, 95% CI 1.84 to 2.58) as compared with<br />
multiparous. These results supported the opinion about the importance of considering<br />
primiparous and multiparous as different traits in genetic evaluation and shed light on the<br />
importance of improving genetics and environment of heifers to minimize the effect of<br />
dystocia and stillbirth in Holstein cattle.<br />
All copyrights reserved to Nexus® academic publishers<br />
ARTICLE CITATION: Al–Samarai FR (2014). A meta–analysis of the impact of parity on dystocia and stillbirth in Holstein<br />
cattle. Adv. Anim. Vet. Sci. 2 (7): 381 – 389.<br />
INTRODUCTION<br />
Meta–analyses can be defined as systematic reviews with<br />
pooled data (Ton et al., 2007). It was considered as a<br />
valuable method with unique properties: establishing<br />
whether scientific findings are consistent (Cook et al., 1998)<br />
and can be generalized across populations (Burrin and<br />
Britton, 1986), limit bias, improve reliability and accuracy of<br />
conclusions (Collett, 1994) and increase the power and<br />
precision of treatment effects (Bell and Bauman, 1997).<br />
In recent years, breeders have shown increasing<br />
interest in selection of functional traits in dairy cattle<br />
(Mark, 2004), therefore they have focused to shift selection<br />
from traits that increasing–profit to reducing–costs traits<br />
(De Maturana, 2007). Health management has been<br />
emphasis in order to minimize losses due health disorders<br />
(Beaudea et al., 2000).<br />
Dystocia and stillbirth are related terms; as dystocia<br />
associated with approximately 50% of calf mortality cases<br />
at birth (Mee, 2008). These two traits may result in direct<br />
losses due to calf and, dam mortality and premature culling,<br />
as well as indirect costs due to additional veterinary<br />
services, labor and treatment (Szucs et al., 2009).<br />
Dystocia and stillbirth are generally scored on<br />
categorical or binary scales which make them sensitive to<br />
subjectivity (Dekkers, 1994).<br />
Dystocia may be defined as delayed or difficult<br />
parturition. It’s an important problem in Holstein cattle<br />
since one birth of every 5 to first parity dams need<br />
assistance (Philipsson, 1996). Stillbirths are defined as a calf<br />
that dies just before, during, or within the first 24 to 48 h<br />
after birth with at least 260 days of gestation (Meyer et al.,<br />
2001; Chassagne et al., 1999).<br />
Several studies revealed that primiparous and multiparous<br />
cows clearly differ in the rate of dystocia and stillbirths.<br />
Meyer et al., (2001) confirmed that statistical analysis of the<br />
two traits could be best when considering primiparous and<br />
multiparous cows as separated traits.<br />
The aim of this study is to view an extract of<br />
estimations (Odds ratio) for the effect of primiparous and<br />
multiparous on dystocia and stillbirth in Holstein cattle.<br />
MATERIALS AND METHODS<br />
Extensive literature search of scientific electronic search<br />
engines (PubMed, Google Scholar, CAB, ISI Web of<br />
Knowledge, Science Direct, SciQuest, and Scirus) was<br />
conducted to identify primary studies carried out between<br />
1980 and 2013. Following rigorous screening for appropriate<br />
subject matter, high quality of studies, and adequate<br />
statistical reporting, were extracted for meta–analysis.<br />
Several keyword combinations (dystocia, stillbirth, odds<br />
ratio, calving problems, Holstein cattle, meta–analysis) were<br />
used. Criteria examined included randomization of study,<br />
recording, statistical analysis. Analytic techniques described<br />
by Dohoo et al., (2003).<br />
<strong>Article</strong>s were selected to meet the following criteria:<br />
(1) published in English<br />
(2) published as peer reviewed original articles<br />
(3) must had information about dystocia and stillbirth in<br />
first and later parity<br />
(4) articles of Holstein cows only were included in the<br />
analysis<br />
(5) The non–peer–reviewed studies were assessed and<br />
included in the meta–analysis if they met the selection<br />
criteria.<br />
Al–Samarai (2014). Meta–analysis on Dystocia and Stillbirth 381<br />
ISSN: 2307–8316 (Online); ISSN: 2309–3331 (Print)
Table 1: Classification of dystocia studies<br />
according to scores of dystocia<br />
Advances in Animal and Veterinary Sciences 2 (7): 381 – 389<br />
http://nexusacademicpublishers.com/journal/4<br />
The articles selected were generally American or<br />
European as shown in Table 2 and 3.<br />
Thirty papers were used to evaluate the impact of<br />
primiparous and multiparous cows on dystocia and<br />
nineteen papers for stillbirth. The scoring of dystocia was<br />
not constant in all papers, whereas stillbirth was recorded<br />
as dichotomous. The definition of dystocia was not<br />
standardized across studies (Table 1). Most studies<br />
classified dystocia within 5 categories including unassisted,<br />
easy, moderate, difficult, and very difficult. Some studies<br />
were recorded dystocia with four categories: = easy (non–<br />
assisted), 2 = moderate assistance (veterinarian called as<br />
precaution), 3 = difficult, 4 = very difficult with veterinary<br />
assistance. Some else recorded dystocia with three<br />
categories: no assist, easy and hard or two categories:<br />
unassisted and assisted.<br />
Study name No. of category Study name No. of category<br />
Cady and Burnside (1982) 3 Ansari-Lari (2007) 4<br />
Martinez et al., (1983) 5 Lombard et al., (2007) 4<br />
Djemali et al., (1987) A 5 de Maturana et al., (2007) 5<br />
Djemali et al., (1987) B 5 Gonzalez–Recio et al., (2007) 4<br />
Weller et al., (1988) 2 Lopez et al., (2007) 5<br />
Lin et al., (1989) 2 Wall et al., (2008) 5<br />
Berger (1994) 5 Wiggans et al., (2008) 5<br />
Dematawewa and Berger (1997) 5 Fiedlerova et al., (2008) 3<br />
Meyer et al., (2001) 5 Olson et al., (2009) 5<br />
Johanson and Berger(2003) 5 Van Plet et al., (2009) 6<br />
Steinbock et al.,(2003) 2 Gevrekci et al., (2011) 4<br />
van Tassell et al.,(2003) 5 Hébert et al., (2011) 4<br />
Adamec et al.,(2006) 5 Eaglen et al., (2012) 4<br />
Heins et al., (2006) 5 Atashi et al., (2012a) 5<br />
Steinbock (2006) 2 Dhakal et al., (2013) 5<br />
Table 2: A summary of dystocia studies<br />
Study name<br />
Primiparous Primiparous Multiparous Multiparous<br />
Events<br />
Total–N Events<br />
Total–N<br />
Country<br />
Cady and Burnside (1982) 1851 7845 1833 21661 Canada<br />
Martinez et al., (1983) 8033 29130 10964 107645 USA<br />
Djemali et al., (1987) A 20979 83919 38756 387565 USA<br />
Djemali et al., (1987) B 2126 11189 7828 130466 USA<br />
Weller et al., (1988) 8594 106751 4292 146973 Israel<br />
Lin et al., (1989) 292 1722 240 3186 USA<br />
Berger (1994) 15298 907915 9347 2732741 USA<br />
Dematawewa and Berger (1997) 13628 71618 3490 51096 USA<br />
Meyer et al.,(2001) 31820 167472 29932 498869 USA<br />
Johanson and Berger (2003) 586 1558 325 2775 USA<br />
Steinbock et al., (2003) 34146 411409 12653 281193 Sweden<br />
van Tassell et al., (2003) 588838 2612288 756380 7582809 USA<br />
Admec et al., (2006) 9982 47615 12504 170568 USA<br />
Heins et al., (2006) 61 371 26 303 USA<br />
Steinbock (2006) 28954 804268 16829 673150 Sweden<br />
Ansari-Lari (2007) 147 815 135 1861 Iran<br />
Lombard et al., (2007) 486 2574 359 5214 USA<br />
de la Calle (2007) 1008 29567 419 22660 Spain<br />
Gonzalez–Rico et al., (2007) 3212 62134 1717 71547 Spain<br />
Lopez et al., (2007) 887 25810 482 27543 Spain<br />
Wall et al., (2008) 7117 37261 2343 23265 UK<br />
Wiggans et al., (2008) 647529 4035953 766362 11101267 USA<br />
Fiedlerova et al., (2008) 14047 158192 10364 251063 Czech<br />
Olson et al., (2009) 31 86 18 155 USA<br />
Van Plet et al.,(2009) 4813 42968 3746 114913 Netherlands<br />
Gevrekci et al.,(2011) 833 4495 1169 14944 Turkey<br />
Hébert et al., (2011) 1801 138538 2087 279845 Canada<br />
Eaglen et al.,(2012) 8680 30640 9241 54744 UK<br />
Atashi et al.,(2012a) 6265 63041 1987 37587 Iran<br />
Dhakal et al.,(2013) 11 51 10 139 USA<br />
Al–Samarai (2014). Meta–analysis on Dystocia and Stillbirth 382<br />
ISSN: 2307–8316 (Online); ISSN: 2309–3331 (Print)
Standard Error<br />
Table 3: A summary of stillbirth studies<br />
Advances in Animal and Veterinary Sciences 2 (7): 381 – 389<br />
http://nexusacademicpublishers.com/journal/4<br />
Study name<br />
Primiparous Primiparous Multiparous Multiparous<br />
Events Total–N Events Total–N Country<br />
Weller et al., (1988) 8177 106751 5600 146973 Israel<br />
Harber ( 1992) 119489 1048145 147075 2779295 Netherlands<br />
Meyer et al., (2001) 18417 167472 28242 498869 USA<br />
Johanson and Berger(2003) 195 1558 127 2775 USA<br />
Steinbock et al., (2003) 29210 411409 7592 281193 Sweden<br />
Bar (2005) 437 6570 406 11178 Israel<br />
Adamec et al.,(2006) 3399 28862 2841 45915 USA<br />
Heins et al., (2006) 56 371 37 303 USA<br />
Steinbock (2006) 32171 804268 12790 673150 Sweden<br />
Bicahlo et al.,(2007) 566 5288 330 8320 USA<br />
Lombard et al., (2007) 324 2574 318 5214 USA<br />
Cole et al., (2007) 108897 1773099 258957 5247452 USA<br />
Wall et al., (2008) 4583 37261 1402 23265 UK<br />
Wiggans et al., (2008) 223792 1965653 251176 5375384 USA<br />
Olson et al., (2009) 18 86 8 157 USA<br />
Atashi (2011) 415 5205 318 7078 Iran<br />
Atashi et al., (2012b) 6805 126017 4500 179040 Iran<br />
Eaglen et al.,(2012) 3354 30640 2354 54744 UK<br />
Dhakal et al.,(2013) 8 51 18 139 USA<br />
0.0<br />
Funnel Plot of Standard Error by Log odds ratio<br />
0.1<br />
Figure 1: A funnel plot<br />
for detection bias of<br />
OR in dystocia<br />
0.2<br />
0.3<br />
0.4<br />
0.5<br />
-2.0 -1.5 -1.0 -0.5 0.0 0.5 1.0 1.5 2.0<br />
Log odds ratio<br />
Meta–analyses were conducted on dystocia and stillbirth<br />
using Comprehensive Meta–Analysis.V.2 software (2013),<br />
whereas forest plot was carried out by using MedCalc V.6<br />
(2013). Guidelines for conducting appropriate meta–<br />
analysis were largely based on meta–<br />
Data Analysis<br />
Analysis of Potential Publication Bias<br />
A funnel plot: two modes were available, one which plots a<br />
study’s effect size against its standard error and another<br />
which plots effect size against precision.<br />
In the absence of bias the plot would be symmetric<br />
about the summary effect (Duval andTweedie2000):<br />
Test the rank correlation (Kendall’s tau) between the<br />
standardized effect size and the variances (or standard<br />
errors) of these effects (Begg and Mazumdar, 1994).<br />
Test the standardized effect (the regression of effect<br />
size divided by standard error on precision (inverse of<br />
standard error).<br />
Analysis of Heterogeneity<br />
Heterogeneity of the estimated OR was assessed using the<br />
Cochran’s Q statistic chi square test (Egger et al., 2001). If<br />
there was evidence of heterogeneity, then a random model<br />
(inverse variance) is preferred. The degree of heterogeneity<br />
was assessed by the I 2 (I squared) statistic. This describes<br />
the percentage of the variability in effect estimates that is<br />
due to heterogeneity rather than sampling error (chance)<br />
(Higgins et al., 2003).<br />
RESULTS AND DISCUSSION<br />
Effect of Primiparous and Multiparous on Dystocia<br />
Results shows that I 2 = 99.72, and P = 0.000. An I 2 value >50<br />
may be considered indicative of substantial heterogeneity.<br />
In such case a random model is considered more suitable<br />
than fixed model (Rabiee et al., 2012). Estimated OR with a<br />
random model for dystocia is OR = 2.68, 95% CI 2.51 to 2.85<br />
and the corresponding estimates in a fixed model is OR =<br />
2.61, 95% CI 2.60 to 2.61 (Table 4).<br />
It's obvious from Figure (1) the presence of bias as the<br />
OR values were distributed asymmetrically. Pooled OR was<br />
Al–Samarai (2014). Meta–analysis on Dystocia and Stillbirth 383<br />
ISSN: 2307–8316 (Online); ISSN: 2309–3331 (Print)
Log odds ratio<br />
Figure 2: Illustrate the heterogeneity as a<br />
regression of dystocia categories<br />
(classification according to scores of<br />
dystocia) on logarithms of OR by using fixed<br />
effect regression<br />
Advances in Animal and Veterinary Sciences 2 (7): 381 – 389<br />
http://nexusacademicpublishers.com/journal/4<br />
Table 4: Odds ratio of dystocia for different studies<br />
Study name<br />
Odds Lower<br />
ratio limit<br />
Cady and Burnside (1982) 3.340 3.112<br />
Martinez et al., (1983)<br />
3.358 3.251<br />
Djemali et al., (1987) A<br />
3.000 2.944<br />
Djemali et al., (1987) B<br />
3.675 3.487<br />
Weller et al., (1988)<br />
2.911 2.803<br />
Lin et al., (1989)<br />
2.507 2.089<br />
Berger (1994)<br />
4.994 4.866<br />
Dematawewa and Berger<br />
(1997)<br />
3.206 3.083<br />
Meyer et al.,(2001)<br />
3.675 3.613<br />
Johanson and Berger (2003) 4.545 3.894<br />
Steinbock et al., (2003)<br />
1.921 1.881<br />
van Tassell et al., (2003) 2.626 2.617<br />
Admec et al., (2006)<br />
3.353 3.258<br />
Heins et al., (2006)<br />
2.096 1.288<br />
Steinbock (2006)<br />
1.456 1.429<br />
Ansari-Lari (2007)<br />
2.814 2.191<br />
Lombard et al., (2007)<br />
3.148 2.721<br />
de la Calle (2007)<br />
1.874 1.670<br />
Gonzalez–Rico et al., (2007) 2.217 2.089<br />
Lopez et al., (2007)<br />
1.998 1.786<br />
Wall et al., (2008)<br />
2.108 2.006<br />
Wiggans et al., (2008)<br />
2.577 2.568<br />
Fiedlerova et al., (2008)<br />
2.263 2.205<br />
Olson et al., (2009)<br />
4.290 2.218<br />
Van Plet et al.,(2009)<br />
3.743 3.581<br />
Gevrekci et al.,(2011)<br />
2.680 2.435<br />
Hébert et al., (2011)<br />
1.753 1.645<br />
Eaglen et al.,(2012)<br />
1.946 1.882<br />
Atashi et al.,(2012a)<br />
1.977 1.877<br />
Dhakal et al.,(2013)<br />
3.548 1.404<br />
Fixed<br />
2.610 2.604<br />
Random<br />
2.680 2.518<br />
Upper<br />
limit<br />
3.585<br />
3.468<br />
3.057<br />
3.873<br />
3.022<br />
3.007<br />
5.124<br />
3.333<br />
3.738<br />
5.305<br />
1.962<br />
2.636<br />
3.450<br />
3.411<br />
1.485<br />
3.613<br />
3.642<br />
2.102<br />
2.353<br />
2.235<br />
2.216<br />
2.586<br />
2.323<br />
8.298<br />
3.913<br />
2.951<br />
1.868<br />
2.012<br />
2.083<br />
8.964<br />
2.617<br />
2.851<br />
Z–<br />
Value<br />
33.412<br />
73.248<br />
114.395<br />
48.621<br />
55.802<br />
9.891<br />
121.969<br />
58.380<br />
150.955<br />
19.196<br />
60.956<br />
504.658<br />
82.887<br />
2.980<br />
38.221<br />
8.106<br />
15.423<br />
10.675<br />
26.177<br />
12.088<br />
29.294<br />
525.841<br />
61.090<br />
4.326<br />
58.455<br />
20.120<br />
17.361<br />
39.042<br />
25.605<br />
2.677<br />
781.897<br />
31.157<br />
P<br />
0.00<br />
0.00<br />
0.00<br />
0.00<br />
0.00<br />
0.00<br />
0.00<br />
0.00<br />
0.00<br />
0.00<br />
0.00<br />
0.00<br />
0.00<br />
0.00<br />
3<br />
0.00<br />
0.00<br />
0.00<br />
0.00<br />
0.00<br />
0.00<br />
0.00<br />
0.00<br />
0.00<br />
0.00<br />
0.00<br />
0.00<br />
0.00<br />
0.00<br />
0.00<br />
0.00<br />
7<br />
Weight<br />
(Fixed)<br />
0.12<br />
0.55<br />
1.63<br />
0.21<br />
0.41<br />
0.02<br />
0.87<br />
0.38<br />
2.03<br />
0.02<br />
1.31<br />
41.13<br />
0.71<br />
0.00<br />
1.56<br />
0.01<br />
0.03<br />
0.04<br />
0.16<br />
0.05<br />
0.23<br />
46.46<br />
0.84<br />
0.00<br />
0.30<br />
0.06<br />
0.14<br />
0.52<br />
0.21<br />
0.00<br />
Weight<br />
(Random)<br />
3.67<br />
3.81<br />
3.84<br />
3.75<br />
3.80<br />
2.89<br />
3.83<br />
3.79<br />
3.84<br />
3.11<br />
3.83<br />
3.85<br />
3.82<br />
1.14<br />
3.84<br />
2.37<br />
3.18<br />
3.40<br />
3.72<br />
3.42<br />
3.76<br />
3.85<br />
3.83<br />
0.72<br />
3.78<br />
3.53<br />
3.70<br />
3.81<br />
3.75<br />
0.39<br />
Regression of category on Log odds ratio<br />
2.00<br />
1.80<br />
1.60<br />
1.40<br />
1.20<br />
1.00<br />
0.80<br />
0.60<br />
0.40<br />
0.20<br />
0.00<br />
1.60 2.08 2.56 3.04 3.52 4.00 4.48 4.96 5.44 5.92 6.40<br />
category<br />
corrected according to fill and trim method "Durval and<br />
Tweedie".<br />
Sex studies accounting for gender were needed in<br />
dystocia to be symmetrically distributed. The observed OR<br />
value of random effect was 2.68, 95% CI (2.51, 2.85), Q value<br />
Al–Samarai (2014). Meta–analysis on Dystocia and Stillbirth 384<br />
ISSN: 2307–8316 (Online); ISSN: 2309–3331 (Print)
Figure 3: Illustrate that the heterogeneity<br />
attributed to dystocia categories by using mixed<br />
effect regression (unrestricted maximum<br />
likelihood)<br />
Log odds ratio<br />
Log odds ratio<br />
Figure 4: Studies represented by a circle<br />
proportional to their weight in the analysis.<br />
(Studies with five categories have more impact<br />
on slope)<br />
Advances in Animal and Veterinary Sciences 2 (7): 381 – 389<br />
http://nexusacademicpublishers.com/journal/4<br />
10615.92 whereas the adjusted OR was 2.42, 95% CI (2.26,<br />
2.60), 13133.952.<br />
Egger’s linear regression method, quantifies the bias<br />
captured by the funnel plot. Egger’s method uses the actual<br />
values of the effect sizes and their precision. The rank<br />
correlation test of Begg and Mazumdar (1994) showed that<br />
there was no significant correlation between effect and<br />
study size (P = 0.39). This was also confirmed by the<br />
regression test of Egger et al. (1997), which showed no<br />
significant association between study size and effect<br />
(intercept = 1.45, P = 0.36).<br />
Heterogeneity in studies could be belonging to many<br />
reasons such as: studies conducted by different people, in<br />
different areas, with different definitions and at different<br />
times, which create a heterogeneous population of studies.<br />
Differences between studies in terms of the definition or<br />
measurement of outcomes, may lead to differences in<br />
observed effects (Lean et al., 2009). As I 2 (I square) was<br />
significant (99.72), hence the sources of heterogeneity of<br />
response were investigated by meta–regression.<br />
In our research, heterogeneity could be attributed to<br />
differences in definition of dystocia (categories). To<br />
investigate the validity of using this factor as predictor<br />
factor, data were analyzed using ANOVA. T–test was<br />
confirmed the significant (P < 0.05) differences between OR<br />
estimates. Hence, data were subjected to meta–regression.<br />
Two types of regression were used: fixed effect regression<br />
which shows that the slope is 0.13, 95%CI (0.12, 0.13), P =<br />
0.000 with intercept 0.32, 95%CI (0.30, 0.34), P = 0.000<br />
(Figure 2) and mixed effect regression which shows that the<br />
slope is 0.11, 95%CI (0.02, 0.20), P = 0.000 with intercept<br />
0.52, 95%CI (0.12, 0.91), P = 0.000 (Figure 3). The significant<br />
effects of two regressions confirmed the effect of dystocia<br />
categories on the value of log OR. It was shown from the<br />
two Figures (2, 3) that the OR increased as category<br />
increasing.<br />
Figure (4) illustrate each study represented by a circle<br />
proportional to its weight in the analysis. This view<br />
identifies which studies have the greatest impact on the<br />
slope of the regression line. Studies with five categories have<br />
more impact on slope.<br />
Regression of category on Log odds ratio<br />
2.00<br />
1.80<br />
1.60<br />
1.40<br />
1.20<br />
1.00<br />
0.80<br />
0.60<br />
0.40<br />
0.20<br />
0.00<br />
1.60 2.08 2.56 3.04 3.52 4.00 4.48 4.96 5.44 5.92 6.40<br />
category<br />
Regression of category on Log odds ratio<br />
2.00<br />
1.80<br />
1.60<br />
1.40<br />
1.20<br />
1.00<br />
0.80<br />
0.60<br />
0.40<br />
0.20<br />
0.00<br />
1.60 2.08 2.56 3.04 3.52 4.00 4.48 4.96 5.44 5.92 6.40<br />
category<br />
Al–Samarai (2014). Meta–analysis on Dystocia and Stillbirth 385<br />
ISSN: 2307–8316 (Online); ISSN: 2309–3331 (Print)
Advances in Animal and Veterinary Sciences 2 (7): 381 – 389<br />
http://nexusacademicpublishers.com/journal/4<br />
Forest plots were used to provide illustration of the<br />
calculated OR per study as well as the overall pooled effect<br />
of all studies in the plot. The forest plot is a graphical<br />
presentation of the results that displays the point estimate<br />
and confidence interval of the effect observed in each study,<br />
along with the summary estimate and its confidence interval<br />
(Dohoo et al., 2003).<br />
A forest plot of the studies of dystocia was shown in<br />
Figure (5).<br />
Meta-analysis<br />
Cady (1982)<br />
Martinez (1983)<br />
Djemali (1987) A<br />
Djemali (1987) B<br />
Weller (1988)<br />
Lin (1989)<br />
Berger (1994)<br />
Dematawewa (1997)<br />
Meyer (2001)<br />
Johanson (2003)<br />
Steinbock (2003)<br />
v an Tassell (2003)<br />
Admec (2006)<br />
Heins (2006)<br />
Steinbock (2006)<br />
Ansari (2007)<br />
Lombard (2007)<br />
de la Calle (2007)<br />
Gonzalez (2007)<br />
Lopez (2007)<br />
Wall (2008)<br />
Wiggans (2008)<br />
Fiedlerov a (2008)<br />
Olson (2009)<br />
Van Plet (2009)<br />
Gev rekci (2011)<br />
Hébert (2011)<br />
Eaglen (2012)<br />
Atashi (2012)b<br />
Dhakal (2013)<br />
Total (fixed effects)<br />
Total (random effects)<br />
0.1 1<br />
Odds ratio<br />
Figure 5: Forest plots of dystocia studies<br />
Table 5: Odds ratio of stillbirth for different studies<br />
Study name<br />
Odds Lower Upper<br />
Weight Weight<br />
Z–Value P<br />
ratio limit limit<br />
(Random) (Fixed)<br />
Weller et al., (1988) 2.09 2.02 2.17 41.44 0.00 5.81 1.14<br />
Harber et al.,( 1992) 2.30 2.28 2.32 204.57 0.00 5.83 21.80<br />
Meyer et al., (2001) 2.06 2.02 2.10 72.75 0.00 5.82 3.68<br />
Johanson and Berger(2003) 2.98 2.36 3.77 9.20 0.00 5.24 0.03<br />
Steinbock et al., (2003) 2.75 2.68 2.83 77.20 0.00 5.82 2.10<br />
Bar and Ezra (2005) 1.89 1.65 2.17 9.00 0.00 5.60 0.07<br />
Adamec et al.,(2006) 2.02 1.92 2.13 26.48 0.00 5.80 0.51<br />
Heins et al., (2006) 1.28 0.82 2.00 1.08 0.00 4.12 0.01<br />
Steinbock (2006) 2.15 2.11 2.20 72.36 0.00 5.82 3.23<br />
Bicahlo et al.,(2007) 2.90 2.52 3.34 14.87 0.00 5.60 0.07<br />
Lombard et al., (2007) 2.22 1.88 2.61 9.60 0.00 5.53 0.05<br />
Cole et al., (2007) 1.26 1.25 1.27 62.22 0.00 5.83 26.17<br />
Wall et al., (2008) 2.19 2.06 2.33 24.65 0.00 5.78 0.36<br />
Wiggans et al., (2008) 2.62 2.61 2.64 317.36 0.00 5.83 39.31<br />
Olson et al., (2009) 4.93 2.04 11.90 3.55 0.00 2.23 0.00<br />
Atashi (2011) 1.84 1.58 2.14 7.94 0.00 5.57 0.06<br />
Atashi et al(2012b) 2.21 2.13 2.30 40.60 0.00 5.81 0.95<br />
Eaglen et al., (2012) 2.74 2.59 2.89 36.06 0.00 5.79 0.47<br />
Dhakal et al., (2013) 1.25 0.51 3.08 0.49 0.00 2.16 0.00<br />
Fixed 2.06 2.05 2.07 379.89 0.00<br />
Random 2.18 1.84 2.58 9.11 0.00<br />
Al–Samarai (2014). Meta–analysis on Dystocia and Stillbirth 386<br />
ISSN: 2307–8316 (Online); ISSN: 2309–3331 (Print)
Standard Error<br />
Advances in Animal and Veterinary Sciences 2 (7): 381 – 389<br />
http://nexusacademicpublishers.com/journal/4<br />
Effect of Primiparous and Multiparous on Stillbirth<br />
Results shows that I 2 = 99.92, and P = 0.000. Estimated OR<br />
with random model for stillbirth is OR = 2.18, 95% CI 1.84 to<br />
2.58 and the corresponding estimates in fixed model is OR =<br />
2.06, 95% CI 2.05 to 2.07 (Table 5).<br />
Duval and Tweedie (2000) reported that: when there<br />
was no missing study in the funnel plot, the observed and<br />
adjusted OR is identical.<br />
Figure (6) shows that there was no bias as the studies were<br />
distributed symmetrically. The estimate of observed and<br />
adjusted OR are identical. (OR = 2.18, 95% CI 1.84 to 2.58).<br />
Egger’s linear regression method was applied and<br />
results shows that the intercept (β0) is 1.76, 95% CI (21.70,<br />
25.24), with t = 0.158, df = 17. The one–tailed p–value is 0.43,<br />
and the two–tailed p–value is 0.87. Begg and Masumdar<br />
rank correlation was used also and the Tau value was –0.29,<br />
P (one tailed) = 0.04 and P (two tailed) = 0.08.<br />
0.0<br />
0.1<br />
0.2<br />
Funnel Plot of Standard Error by Log odds ratio<br />
Figure 6: A funnel plot of<br />
studies effect size<br />
against their standard<br />
error for stillbirth<br />
0.3<br />
0.4<br />
0.5<br />
-2.0 -1.5 -1.0 -0.5 0.0 0.5 1.0 1.5 2.0<br />
Log odds ratio<br />
Meta-analysis<br />
Weller (1988)<br />
Harber ( 1992)<br />
Meyer (2001)<br />
Johanson (2003)<br />
Steinbock (2003)<br />
Bar (2005)<br />
Adamec (2006)<br />
Heins (2006)<br />
Steinbock (2006)<br />
Bicahlo (2007)<br />
Lombard (2007)<br />
Cole (2007)<br />
Wall (2008)<br />
Wiggans (2008)<br />
Olson (2009)<br />
Atashi (2011)<br />
Atashi (2012) a<br />
Eaglen (2012)<br />
Dhakal (2013)<br />
Total (fixed effects)<br />
Total (random effects)<br />
0.01 0.1 1 10<br />
Odds ratio<br />
Figure 7: Forest plots of the stillbirth studies<br />
Al–Samarai (2014). Meta–analysis on Dystocia and Stillbirth 387<br />
ISSN: 2307–8316 (Online); ISSN: 2309–3331 (Print)
Advances in Animal and Veterinary Sciences 2 (7): 381 – 389<br />
http://nexusacademicpublishers.com/journal/4<br />
It's obvious that the heterogeneity is detected in stillbirth<br />
but when there is heterogeneity that cannot readily be<br />
explained, one analytical approach is to incorporate it into a<br />
random effects model. In such case, we were unable to<br />
define the causing factors and then unable to apply meta–<br />
regression. A Forest plot for stillbirth was shown in Figure<br />
(7).<br />
Results revealed that the test of heterogeneity<br />
confirmed the existance of a substantial heterogeneity in<br />
dystocia and stillbirth. So the estimation of OR by random<br />
model is more accurate in two mentioned traits. The OR of<br />
dystocia (2.68) is higher than stillbirth (2.18) which means<br />
that heifers is more likely to have dystocia as compared with<br />
stillbirth. Although the studies in dystocia were more as<br />
compared with stillbirth, results show that bias associated<br />
with estimation of OR was present in dystocia only. The<br />
current study confirmed that primiparous cows were most<br />
likely to have dystocia and stillbirth as compared with<br />
multiparous cows. Results also indicate that differentiation<br />
can be made among primiparous and multiparous cows in<br />
the risk of having dystocia and stillbirth. These differences<br />
among cows could be useful to aid the better management<br />
to minimize their harmful effects in the dairy herds;<br />
particularly both traits have a low heritability (Lin et al.,<br />
1989).<br />
REFERENCES<br />
Adamec V, Cassell BG, Smith EP, Pearson RE (2006). Effects of inbreeding in<br />
the dam on dystocia and stillbirths in US Holsteins. J. Dairy Sci. 89: 307<br />
– 314.<br />
Ansari–Lari M (2007).Study of perinatal mortality and dystocia in dairy cows<br />
in Fars province, south Iran. Inter. J. Dairy Sci. 2: 85 – 89.<br />
Atashi H (2011). Factors affecting stillbirth and effects of stillbirth on<br />
subsequent lactation performance in a Holstein dairy herd in Isfahan.<br />
Iranian J. Vet. Res. Shiraz Uni. 12: 24 – 30.<br />
Atashi H, Abdolmohammadi AR, Asaadi A, Akhlaghi A, Dadpasand M,<br />
Ahangari YJ (2012a). Using an incomplete gamma function to quantify<br />
the effect of dystocia on the lactation performance of Holstein dairy<br />
cows in Iran. J. Dairy Sci. 95:2718–2722. doi.org/ 10.3168/ jds. 2011–<br />
4954.<br />
Atashi H, Zamiri MJ, Sayadnejad MB (2012b). The effect of maternal<br />
inbreeding on incidence of twinning, dystocia and stillbirth in Holstein<br />
cows of Iran. Iranian J. Vet. Res. Shiraz Uni. 13: 93–99.<br />
Bar D, Ezra E (2005).Effects of common calving diseases on milk production<br />
in high yielding dairy cows. Israel J Vet Med. 60: 106 – 111.<br />
Beaudea F, Seegers H, Ducrocq V, Fourichon C (2000). Effect of health<br />
disorders on culling in dairy cows: a review and critical discussion.<br />
Ann. Zootech. 49: 293 – 311.<br />
Bell AW, Bauman DE (1997). Adaptations of glucose metabolism during<br />
pregnancy and lactation. J. Mamm. Biol. 2: 265 – 278.<br />
Begg CB, Mazumdar M (1994). Operating characteristics of a rank correlation<br />
test for publication bias. Biometrics. 50: 1088 – 1101.<br />
Bergen W, Bates D (1984). Ionophores: Their effect on production efficiency<br />
and mode of action. J. Anim. Sci. 58: 1465 – 1483.<br />
Berger PJ (1994). Genetic prediction for calving ease in the United States:<br />
data, models, and use by the dairy industry. J Dairy Sci. 77: 1146 – 1153.<br />
Bicalho RC, Galvao KN, Cheong SH, Gilbert RO, Warnick LD, Guard CL<br />
(2007). Effect of stillbirth on dam’s survival and reproduction<br />
performance in Holstein dairy cows. J. Dairy Sci. 90: 2797 – 2803.<br />
doi:10.3168/jds.2006–504<br />
Burrin D, Britton R (1986). Response to monensin in cattle during subacute<br />
acidosis. J. Anim. Sci. 63: 888 – 893.<br />
Cady RA, Burnside EB (1982).Evaluation of dairy bulls in Ontario for calving<br />
ease of offspring. J. Dairy. Sci. 65: 2150 – 2156.<br />
Chassagne M, Barnouin J, Chacornac JP (1999). Risk factors for stillbirth in<br />
Holstein heifers under field conditions in France: A prospective survey.<br />
Theriogenology. 51: 1477 – 1488<br />
Cleophas TJ, Zwinderman AH (2007). Meta–analysis. Circulation. 115: 2870 –<br />
2875. http://circ.ahajournals.org/content/115/22/2870. doi:<br />
10.1161/CIRCULATIONAHA.105.594960<br />
Cole JB, Wiggans GR, Van Raden PM (2007). Genetic evaluation of stillbirth<br />
in United States Holsteins using a sire maternal grand sire threshold<br />
model. J. Dairy Sci. 90: 2480 – 2488. doi:10.3168/jds.2006–435<br />
Collett D (1994).Modelling Survival Data in Medical <strong>Research</strong>. Chapman and<br />
Hall, London, UK.<br />
Cook DJ, Mulrow CD, Haynes RB (1998). Systematic reviews: synthesis of<br />
the bestevidence for clinical decisions. Ann. Intern. Med. 317: 339 – 342.<br />
Dakal K, Maltecca C, Cassady JP, Baloche G, Williams CM, and Washburn<br />
SP.(2013). Calf birth weight, gestation length, calving ease, and<br />
neonatal calf mortality in Holstein, Jersey, and crossbred cows in a<br />
pasture system. J. Dairy Sci. 96: 690 – 698. doi.org/ 10.3168/jds.2012–<br />
5817.<br />
De La, Calle LML (2007). Integral study of calving ease in Spanish Holstein<br />
population. A thesis, Univ. of Zaragoza, Spain.<br />
Dematawewa CMB, Berger PJ (1997). Effect of dystocia on yield, fertility, and<br />
cow losses and an economic evaluation of dystocia scores for Holsteins.<br />
J. Dairy Sci. 80: 754 – 761.<br />
de Maturana, LE, Ugarte E, Gonza lez–Recio O (2007). Impact of calving ease<br />
on functional longevity and herd amortization costs in Basque<br />
Holsteins using survival analysis. J. Dairy Sci. 90: 4451 – 4457.<br />
Djemali M, Freeman AE, Berger PJ (1987). Reporting of dystocia scores and<br />
effects of dystocia on production, days open, and days dry from dairy<br />
herd improvement data. J. Dairy Sci.70: 2127 – 2131.<br />
Dohoo I, Martin W, Stryhn H (2003). Meta–Analysis. Page 706 in Veterinary<br />
Epidemiologic <strong>Research</strong>. AVC Inc., Charlotte town, PEI, Canada.<br />
Duval S, Tweedie R (2000). Trim and fill: A simple funnel–plot–based<br />
method of testing and adjusting for publication bias in meta–<br />
analysis.Biometrics,56:455–63.<br />
Eaglen SE, Coffey MP, Woolliams JA, Wall E (2012). Evaluating alternate<br />
models to estimate genetic parameters of calving traits in United<br />
Kingdom Holstein–Friesian dairy cattle. Genetics Selection Evolution.<br />
44: 1 – 13. http://www.gsejournal.org/content/44/1/23.<br />
Egger M, Davey SG, Schneider M, Minder C (1997). Bias in meta–analysis<br />
detected by a simple graphical test. BMJ. 315: 629 – 634.<br />
Egger M, Smith GD, Altman D (2001). Systematic reviews in health care:<br />
Meta–analysis in context. 2nd ed. BMJ Books, London, UK.<br />
Fiedlerova M, Rehak D, Vacek M, Volek J, Fiedler J, Simecek P, Masata O,<br />
Jilek F (2008).Analysis of non–genetic factors affecting calving<br />
difficulty in the Czech Holstein population. Czech J. Anim. Sci. 53: 284<br />
– 291.<br />
Gevrekci Y, Akbas Y, Kizilkaya K (2011). Comparison of different models in<br />
genetic analysis of dystocia. Kafkas Univ Vet Fak Derg.17: 387 – 392.<br />
Gonzalez–Recio O, Lopez E, de Maturana, Gutierrez JP (2007). Inbreeding<br />
depression on female fertility and calving ease in Spanish dairy cattle. J.<br />
Dairy Sci. 90: 5744 – 5752. doi:10.3168/jds.2007–0203<br />
Heins J, Hansen LB, Seykora AJ (2006).Calving difficulty and stillbirths of<br />
pure Holsteins versus crossbreds of Holstein with Normande,<br />
Montbeliarde, and Scandinavian Red. J. Dairy Sci. 89: 2805 – 2810.<br />
Higgins J, Thompson S, Deeks J, Altman D (2003). Measuring inconsistency<br />
in meta–analyses. Br. Med. J. 327: 557 – 560.<br />
Johanson JM, Berger PJ (2003). Birth weight as a predictor of calving ease and<br />
perinatal mortality in Holstein cattle. J. Dairy Sci. 86: 3745 – 3755.<br />
Lean IJ, Rabiee AR, Duffield TF, Dohoo IR (2009).Invited review: Use of meta–<br />
analysis in animal health and reproduction:Methods and applications.<br />
J. Dairy Sci. 92: 3545 – 3565.<br />
Lin HK, Oitenacu PA, Van Vleck D, Ers HN, Smith RD (1989). Heritabilities<br />
of and genetic correlations among six health problems in Holstein<br />
cows. J. Dairy Sci. 72: 180 – 186.<br />
Lombard JE, Garry FB, Tomlinson SM, Garber LP (2007). Impacts of dystocia<br />
on health and survival of dairy calves. J. Dairy Sci. 90: 1751 – 1760.<br />
doi:10.3168/jds.2006–295.<br />
Lopez ME, Legarra A, Varona L, Ugarte E (2007). Analysis of Fertility and<br />
Dystocia in Holsteins Using Recursive Models to Handle Censored and<br />
Categorical Data. J. Dairy Sci. 90: 2012 – 2024<br />
Mark T (2004). Applied genetic evaluations for production and functional<br />
traits in dairy cattle. J. Dairy Sci. 87: 2641 – 2652.<br />
Martinez ML, Freeman AE, Berger PJ (1983). Genetic relationship between<br />
calf livability and calving difficulty of Holsteins. J. Dairy Sci. 66: 1494 –<br />
1502.<br />
Mee JF (2008). Newborn dairy calf management. Vet Clin North Am Food Anim<br />
Pract. 24(1): 1 – 17.<br />
Meyer CL, Berger PJ, Koehler KJ, Thompson JR, Sattler CG (2001).<br />
Phenotypic trends in incidence of stillbirth for Holsteins in the United<br />
States. J. Dairy Sci., 84, 515– 523.<br />
Olson KM, Cassell BG, McAllister AJ, Washburn SP (2009). Dystocia,<br />
stillbirth, gestation length, and birth weight in Holstein, Jersey, and<br />
reciprocal crosses from a planned experiment J. Dairy Sci. 92: 6167 –<br />
6175. doi: 10.3168/jds.2009–2260<br />
Philipsson J (1996). Strategies to reduce problems in calving performance and<br />
stillbirths by selection and differential use of bulls. In: Proc. Int.<br />
Workshop Genet. Improvement of Functional Traits in Cattle.<br />
Gembloux, Belgium, Interbull Bulletin. p. 12: 65 – 71.<br />
Rabiee AR, Breinhild K, Scott W, Golder HM, Block E, Lean IJ (2012).<br />
Effect of fat additions to diets of dairy cattle on milk production and<br />
Al–Samarai (2014). Meta–analysis on Dystocia and Stillbirth 388<br />
ISSN: 2307–8316 (Online); ISSN: 2309–3331 (Print)
Advances in Animal and Veterinary Sciences 2 (7): 381 – 389<br />
http://nexusacademicpublishers.com/journal/4<br />
components: A meta–analysis and meta–regression. J. Dairy Sci. 95:<br />
3225 – 3247.<br />
Steinbock L (2006). Comparative aspects on genetics of stillbirth and calving<br />
difficulty in Swedish dairy cattle breeds. Licentiate thesis, Swedish<br />
University of Agricultural Sciences, Uppsala. pub. epsilon. slu.se /1082/<br />
1/ SammanläggningLenaS.pdf<br />
Steinbock L, Nasholm A, Berglund B, Johansson K, Philipsson J (2003).<br />
Genetic effects on stillbirth and calving difficulty in Swedish Holsteins<br />
at first and second calving. J. Dairy Sci. 86: 2228 – 2235.<br />
Szucs E, Gulyas L, Cziszter LT, Demirkan I (2009).Stillbirth in dairy cattle:<br />
review. Zootehnieşi Biotehnologii. 42: 622 – 636.<br />
Van Plet ML, de Jong GE, Roelfzma JE (2009). Analysis of calving traits<br />
with a multitrait animal model with a correlated direct and maternal<br />
effect and reciprocal crosses from a planned experiment. J. Dairy Sci.<br />
92: 6167 – 6175.<br />
Van Tassell CP, Wiggans GR, Misztal I (2003). Implementation of a sire–<br />
maternal grandsire model for evaluation of calving ease in the United<br />
States. J. Dairy Sci. 86: 3366 – 3373.<br />
Wall E, Coffey M, Mrode R, Krzyzelewski T, Banos G (2008). Feasibility of<br />
producing calving ease evaluations for UK dairy cattle. Project funded<br />
by the Milk Development Council. www.<br />
dairyco.org.uknon...download.aspx<br />
Weller JI, Misztal I, Gianola D (1988).Genetic analysis of dystocia and calf<br />
mortality in Israeli–Holsteins by threshold and linear models. J. Dairy<br />
Sci. 71: 2491 – 2501.<br />
Wiggans GR, Cole JB, Thornton LLM (2008). Multiparity evaluation of<br />
calving ease and stillbirth with separate genetic effects by parity. J.<br />
Dairy Sci. 91: 3173 – 3178. doi:10.3168/jds.2007–09.<br />
Al–Samarai (2014). Meta–analysis on Dystocia and Stillbirth 389<br />
ISSN: 2307–8316 (Online); ISSN: 2309–3331 (Print)