Brett Bylsma Presentation - Tourism Western Australia
Brett Bylsma Presentation - Tourism Western Australia
Brett Bylsma Presentation - Tourism Western Australia

You also want an ePaper? Increase the reach of your titles
YUMPU automatically turns print PDFs into web optimized ePapers that Google loves.
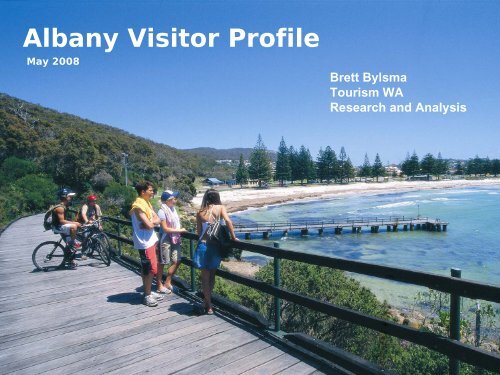
Albany Visitor Profile<br />
May 2008<br />
<strong>Brett</strong> <strong>Bylsma</strong><br />
<strong>Tourism</strong> WA<br />
Research and Analysis
5 year annual average – YE Dec 2003 – YE Dec 2007<br />
Visitors to Albany<br />
All Purpose of Visit – Overnight Visitors<br />
• Intrastate Visitors 253,000<br />
• Interstate Visitors 68,000<br />
• International Visitors 46,200<br />
______________<br />
TOTAL: 367,200<br />
SPEND<br />
$117 million<br />
$105 a night
5 year annual average – YE Dec 2003 – YE Dec 2007<br />
Visitors to Albany<br />
Holiday Visitors – Overnight (percentage of overall Albany market)<br />
• Intrastate Visitors 120,000 (47%)<br />
• Interstate Visitors 46,000 (68%)<br />
• International Visitors 42,200 (91%)<br />
______________<br />
TOTAL: 208,200
5 year annual average – YE Dec 2003 – YE Dec 2007<br />
Top 5 Regional Holiday Destinations in WA<br />
Overnight Intrastate Holiday Visitors<br />
Busselton 373,000<br />
Augusta/Margaret River 273,000<br />
Albany 120,000<br />
Manjimup 105,000<br />
Northampton 89,000
5 year annual average – YE Dec 2003 – YE Dec 2007<br />
Top 5 Regional Holiday Destinations in WA<br />
Overnight Interstate Holiday Visitors<br />
Augusta/Margaret River 73,000<br />
Broome 55,000<br />
Albany 46,000<br />
Busselton 28,000<br />
Manjimup 28,000
5 year annual average – YE Dec 2003 – YE Dec 2007<br />
Top 5 Regional Holiday Destinations in WA<br />
Overnight International Holiday Visitors<br />
Augusta/Margaret River 53,300<br />
Albany 47,200<br />
Shark Bay 37,500<br />
Broome 35,400<br />
Carnarvon 29,400
Albany is one of the most popular holiday<br />
destinations in regional WA
Intrastate<br />
Snapshot
5 year annual average – YE Dec 2003 – YE Dec 2007<br />
Origin of Visitors<br />
Visitors<br />
Average Nights<br />
Experience Perth 86,000 4.1<br />
<strong>Australia</strong>’s South West 23,000 2.7<br />
Other WA 11,000 5.3<br />
Other WA,<br />
12%<br />
South West,<br />
13%<br />
Experience<br />
Perth, 74%<br />
% of Nights in Albany
5 year annual average – YE Dec 2003 – YE Dec 2007<br />
Age of Visitors<br />
Visitors Average Nights<br />
15-24 14,000 2.6<br />
25-44 39,000 3.7<br />
45-64 47,000 3.6<br />
65+ 20,000 6.4<br />
65+<br />
27%<br />
15-24<br />
8%<br />
25-44<br />
30%<br />
45-64<br />
35%<br />
% of Nights in Albany
5 year annual average – YE Dec 2003 – YE Dec 2007<br />
Accommodation of Visitors<br />
Visitors Average Nights<br />
Hotel/Motel/Serviced Apartment 38,000 2.7<br />
Commercial Caravan Park/Camping 24,000 5.4<br />
Rented House/Apartment 20,000 5.0<br />
Friends/Relatives House 19,000 3.8<br />
Other 21,000 3.3<br />
Other<br />
15%<br />
Hotel<br />
22%<br />
Friends<br />
House<br />
15%<br />
Rented<br />
House<br />
21%<br />
Caravan<br />
27%<br />
% of Nights in Albany
Interstate<br />
Snapshot
5 year annual average – YE Dec 2003 – YE Dec 2007<br />
Origin of Visitors<br />
Visitors Average Nights<br />
New South Wales 18,000 1.9<br />
Victoria 13,000 2.0<br />
Queensland 9,000 1.9<br />
Other 6,000 2.8<br />
Other, 18%<br />
NSW, 37%<br />
QLD, 18%<br />
VIC, 28%<br />
% of Nights in Albany
5 year annual average – YE Dec 2003 – YE Dec 2007<br />
Age of Visitors<br />
Visitors Average Nights<br />
15-24 1,000 1.0<br />
25-44 7,000 1.9<br />
45-64 23,000 2.0<br />
65+ 15,000 2.1<br />
15-24<br />
1%<br />
25-44<br />
14%<br />
65+<br />
33%<br />
45-64<br />
52%<br />
% of Nights in Albany
5 year annual average – YE Dec 2003 – YE Dec 2007<br />
Accommodation of Visitors<br />
Visitors Average Nights<br />
Hotel/Motel/Serviced Apartment 26,000 1.7<br />
Commercial Caravan Park/Camping 12,000 2.5<br />
Other 8,000 2.5<br />
Other<br />
22%<br />
Hotel<br />
46%<br />
Caravan<br />
32%<br />
% of Nights in Albany
International<br />
Snapshot
5 year annual average – YE Dec 2003 – YE Dec 2007<br />
Origin of Visitors – Top 5<br />
Visitors Average Nights<br />
United Kingdom 11,100 3.4<br />
Germany 4,700 1.8<br />
Singapore 3,700 2.0<br />
New Zealand 3,100 1.7<br />
Netherlands 3,000 2.2
5 year annual average – YE Dec 2003 – YE Dec 2007<br />
Age of Visitors<br />
Visitors Average Nights<br />
15-24 6,000 5.8<br />
25-44 16,500 2.2<br />
45-64 14,300 2.3<br />
65+ 5,300 2.4<br />
65+<br />
11%<br />
15-24<br />
29%<br />
45-64<br />
28%<br />
25-44<br />
32%<br />
% of Nights in Albany
5 year annual average – YE Dec 2003 – YE Dec 2007<br />
Accommodation of Visitors<br />
Visitors Average Nights<br />
Hotel/Motel/Serviced Apartment 17,600 1.8<br />
Commercial Caravan Park/Camping 11,200 2.5<br />
Backpackers/Hostel 8,000 2.5<br />
Other 5,500 7.1<br />
Other<br />
33% Hotel<br />
27%<br />
Backpack<br />
23%<br />
Caravan<br />
17%<br />
% of Nights in Albany
Albany – A Summary<br />
• Over 365,000 visitors to the area each year<br />
• Around 3/5 come for holiday<br />
• One of the most popular holiday destinations in regional WA<br />
• Around 60% of holiday visitation is from Intrastate<br />
• Generally short stays across all markets
Trends and Issues<br />
There has been a downward trend in regional travel in WA<br />
• Long term decline in Domestic travel
Source: <strong>Tourism</strong> Research <strong>Australia</strong> - An Assessment<br />
of the <strong>Australia</strong>n Domestic <strong>Tourism</strong> Market<br />
The Past<br />
Between 1985 and 2005….<br />
The average number of annual trips taken by <strong>Australia</strong>n’s fell from 5.0 to 4.3<br />
Holiday nights declined at an annual rate of -0.5%<br />
Domestic <strong>Tourism</strong> is <strong>Australia</strong>’s biggest market, and despite growth in<br />
population, has declined over the long term
Source: ABS –<strong>Australia</strong>n Labour Force (Time Series)<br />
Source: ABS –<strong>Australia</strong>n Labour Force (Time Series)<br />
Source: <strong>Tourism</strong> <strong>Australia</strong> – No Leave No Life Program<br />
Changing Work Patterns<br />
More people working longer hours…or not enough<br />
• From 1980 to 2005, the proportion of the <strong>Australia</strong>n workforce working over<br />
40 hours a week has increased by 25%<br />
• Increasing “casualisation” of the workplace means a reduction in leave<br />
entitlements for many workers
Average Working Week 1980 v 2005<br />
Number of Hours a Week<br />
50+<br />
41-49<br />
35-40<br />
2005<br />
1980<br />
16-34<br />
1-15<br />
0% 10% 20% 30% 40% 50%<br />
Percentage of Workforce<br />
Source: ABS –<strong>Australia</strong>n Labour Force (Time Series)
Stockpiling of Annual Leave<br />
<strong>Australia</strong>ns are also not taking their Annual Leave<br />
• Only 42% of employees took all their annual leave in the past 12 months<br />
• In any given year, between 25% and 33% of all <strong>Australia</strong>n’s do not take any<br />
annual leave<br />
• According to AC Nielsen, <strong>Australia</strong>ns have stockpiled more then 70<br />
million days of annual leave – equal to 14.8 million working weeks or<br />
$11billion in wages. This figure is increasing by 4.4% every 6 months<br />
Source: <strong>Tourism</strong> <strong>Australia</strong> – No Leave No Life Program
WA – Short Term Resident Departures<br />
Rolling 12 months – Long Term - Yearly<br />
1,000,000<br />
994,000 Outbound by YE<br />
June 2016<br />
750,000<br />
500,000<br />
250,000<br />
0<br />
June 1987<br />
June 1989<br />
June 1991<br />
June 1993<br />
June 1995<br />
June 1997<br />
June 1999<br />
June 2001<br />
June 2003<br />
June 2005<br />
June 2007<br />
June 2009<br />
June 2011<br />
June 2013<br />
June 2015<br />
Source: DIAC – Passenger Card Data<br />
<strong>Tourism</strong> Forecasting Committee – Oct 2007
For Further Info…<br />
http://www.tra.australia.com<br />
2006 - An Assessment of the <strong>Australia</strong>n Domestic <strong>Tourism</strong> Market<br />
2007 - Changing consumer behaviour (Domesticate Research)<br />
2008 - Through the looking glass: The future of Domestic tourism in <strong>Australia</strong>
esearch@westernaustralia.com
![Annual Report 2002 - 2003 [pdf ] - Tourism Western Australia](https://img.yumpu.com/27124309/1/186x260/annual-report-2002-2003-pdf-tourism-western-australia.jpg?quality=85)

![Our Direction in China 2012 - 2015 [pdf ] - Tourism Western Australia](https://img.yumpu.com/27124271/1/184x260/our-direction-in-china-2012-2015-pdf-tourism-western-australia.jpg?quality=85)
![Naturebank Program 2011 [pdf ] - Tourism Western Australia](https://img.yumpu.com/27124244/1/184x260/naturebank-program-2011-pdf-tourism-western-australia.jpg?quality=85)