Polyether Based Thermoplastic Polyurethane Melt Blown Nonwovens
Polyether Based Thermoplastic Polyurethane Melt Blown Nonwovens
Polyether Based Thermoplastic Polyurethane Melt Blown Nonwovens

You also want an ePaper? Increase the reach of your titles
YUMPU automatically turns print PDFs into web optimized ePapers that Google loves.
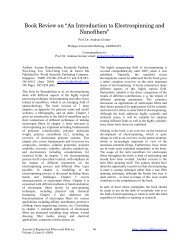
microns. The distributions are nearly identical for all of the webs made in this study. This data is<br />
comparable with fiber diameter distributions obtained for melt blown fabrics made with more<br />
conventional polymers [34].<br />
50<br />
40<br />
Frequency<br />
30<br />
20<br />
10<br />
0<br />
0 5 10 15 20<br />
Diameter (μm)<br />
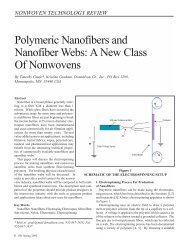
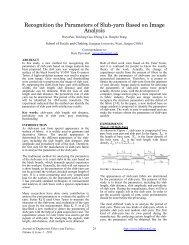
Figure 1. Structure of polyether based<br />
thermoplastic polyurethane melt blown<br />
substrate (Courtesy of BASF).<br />
Figure 2. Fiber diameter distribution functions<br />
for melt blown webs. Black symbols are for<br />
webs made with polymer 80A, red symbols<br />
are made with polymer 90A and blue symbols<br />
are made with polymer 98A. Squares are for<br />
webs made at a DCD of 14 cm, diamonds for<br />
DCD = 20.3 cm, and circles for DCD = 30.5<br />
cm.<br />
Fiber Orientation Distribution Function (ODF) of <strong>Melt</strong> <strong>Blown</strong> Samples: The fiber orientation<br />
distribution function histograms were obtained for all samples made in this series. The cosine<br />
squared anisotropy ratio, H t , varied from -0.038 to -0.14, indicating slightly higher frequency of<br />
fibers oriented in machine direction. H t did not correlate with polymer type, die-to-collector<br />
distance or basis weight (collector belt speed). Thus, the fibers are slightly oriented in the<br />
machine direction as expected for melt blown webs.<br />
Tensile Testing: As discussed previously, the tensile data could not be obtained with the<br />
conventional strip test, since all specimens broke at the grips. Thus a "dog bone" specimen was<br />
used. To convert the displacement of the grips to elongation of the narrow section of the dog<br />
bone specimen, a conversion equation was developed by graphing the distance between two<br />
marks on the narrow section of the dog bone vs. the testing machine displacement. A straight line<br />
with a slope of 1.17 was found to account for this difference for all polymer grades and for the<br />
range of displacements used in these experiments (data not shown). Thus, the elongation of the<br />
narrow tested area of the specimen was 1.17 times the instrumental elongation.<br />
Fabric tensile strength and elongation in the machine and cross directions were obtained for all<br />
melt blown nonwoven samples. The tensile strength and elongation for several 90A polymer<br />
grade melt blown specimen at a DCD of 14 cm could not be measured because the instrument<br />
Journal of Engineered Fibers and Fabrics<br />
Volume 1, Issue 1 (2006)<br />
67<br />
http//www.jeffjjournal.org