Ensemble Laser Diffraction for Online Measurement of Fiber ...
Ensemble Laser Diffraction for Online Measurement of Fiber ...
Ensemble Laser Diffraction for Online Measurement of Fiber ...

You also want an ePaper? Increase the reach of your titles
YUMPU automatically turns print PDFs into web optimized ePapers that Google loves.
ORIGINAL PAPER/PEER-REVIEWED<br />
<strong>Ensemble</strong> <strong>Laser</strong> <strong>Diffraction</strong> <strong>for</strong><br />
<strong>Online</strong> <strong>Measurement</strong> <strong>of</strong> <strong>Fiber</strong><br />
Diameter Distribution During<br />
the Melt Blowing Process<br />
By Eric M. Moore, Robert. L. Shambaugh*, and Dimitrios V. Papavassiliou<br />
Abstract<br />
<strong>Online</strong> measurements <strong>of</strong> the fiber diameter distribution<br />
during a melt blowing process were taken using a new laser<br />
diffraction technique. This technique measured both the<br />
attenuation <strong>of</strong> the fibers as well as entanglement <strong>of</strong> the fibers<br />
into bundles at large distances from the die. A pilot scale unit<br />
with a 20.3 cm (8 inch) slot die was used <strong>for</strong> the studies.<br />
Commercial polypropylene polymer was used. Both the spinline<br />
attenuation and fiber bundling were measured as a function<br />
<strong>of</strong> position both below and across the die face.<br />
Keywords<br />
melt blowing, fiber spinning, nonwovens, fiber diameter<br />
distribution, ensemble laser diffraction<br />
Introduction<br />
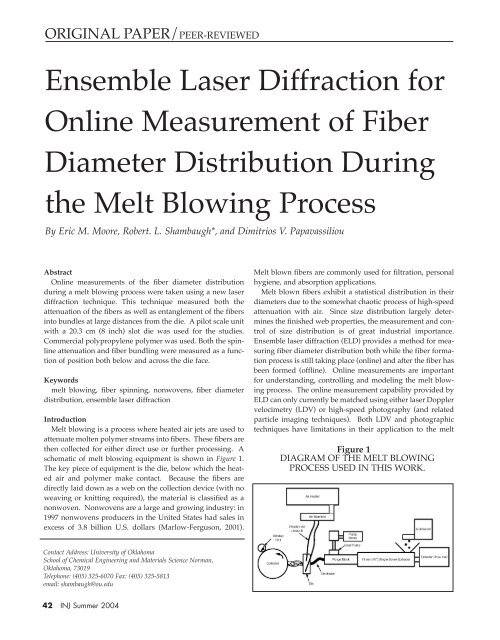
Melt blowing is a process where heated air jets are used to<br />
attenuate molten polymer streams into fibers. These fibers are<br />
then collected <strong>for</strong> either direct use or further processing. A<br />
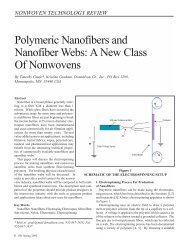
schematic <strong>of</strong> melt blowing equipment is shown in Figure 1.<br />
The key piece <strong>of</strong> equipment is the die, below which the heated<br />
air and polymer make contact. Because the fibers are<br />
directly laid down as a web on the collection device (with no<br />
weaving or knitting required), the material is classified as a<br />
nonwoven. Nonwovens are a large and growing industry: in<br />
1997 nonwovens producers in the United States had sales in<br />
excess <strong>of</strong> 3.8 billion U.S. dollars (Marlow-Ferguson, 2001).<br />
Melt blown fibers are commonly used <strong>for</strong> filtration, personal<br />
hygiene, and absorption applications.<br />
Melt blown fibers exhibit a statistical distribution in their<br />
diameters due to the somewhat chaotic process <strong>of</strong> high-speed<br />
attenuation with air. Since size distribution largely determines<br />
the finished web properties, the measurement and control<br />
<strong>of</strong> size distribution is <strong>of</strong> great industrial importance.<br />
<strong>Ensemble</strong> laser diffraction (ELD) provides a method <strong>for</strong> measuring<br />
fiber diameter distribution both while the fiber <strong>for</strong>mation<br />
process is still taking place (online) and after the fiber has<br />
been <strong>for</strong>med (<strong>of</strong>fline). <strong>Online</strong> measurements are important<br />
<strong>for</strong> understanding, controlling and modeling the melt blowing<br />
process. The online measurement capability provided by<br />
ELD can only currently be matched using either laser Doppler<br />
velocimetry (LDV) or high-speed photography (and related<br />
particle imaging techniques). Both LDV and photographic<br />
techniques have limitations in their application to the melt<br />
Figure 1<br />
DIAGRAM OF THE MELT BLOWING<br />
PROCESS USED IN THIS WORK.<br />
Contact Address: University <strong>of</strong> Oklahoma<br />
School <strong>of</strong> Chemical Engineering and Materials Science Norman,<br />
Oklahoma, 73019<br />
Telephone: (405) 325-6070 Fax: (405) 325-5813<br />
email: shambaugh@ou.edu<br />
42 INJ Summer 2004
lowing process. In LDV, the measuring volumes, which are<br />
typically 1 mm in diameter, are difficult to effectively target on<br />
a rapidly vibrating fiber stream. Since LDV only measures the<br />
velocity <strong>of</strong> the fiber, diameter data must be acquired through<br />
mass balances. These mass balance calculations require a<br />
model <strong>for</strong> the polymer density that makes the use <strong>of</strong> LDV a<br />
somewhat empirical technique <strong>for</strong> analyzing multi-hole melt<br />
blowing. The work <strong>of</strong> Bansal and Shambaugh (1996)<br />
describes the process <strong>of</strong> determining polymer density <strong>of</strong> a filament<br />
during the fiber <strong>for</strong>mation process. High-speed photography<br />
has its own limitations that include (a) proper illumination<br />
by flash, lasers, or other means; (b) obtaining correct<br />
depth <strong>of</strong> field; and (c) resolving the small diameter fibers from<br />
either chemical or digital photographs. Yin et al. (1999) used<br />
a high-powered pulse laser to provide the necessary illumination<br />
<strong>for</strong> digital imaging. However, even with this sophisticated<br />
equipment, online diameter determination was only possible<br />
very near the die.<br />
The work described herein applies ELD to the online measurement<br />
<strong>of</strong> fiber diameter during the melt blowing process.<br />
This ELD method provides data that are difficult to obtain<br />
through other methods. Furthermore, ELD provides fiber distributions<br />
in near real-time, without interfering with the fiber<br />
<strong>for</strong>mation process.<br />
EXPERIMENTAL METHODS<br />
<strong>Ensemble</strong> <strong>Laser</strong> <strong>Diffraction</strong><br />
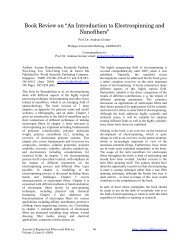
<strong>Ensemble</strong> laser diffraction (ELD) works by passing a collimated<br />
laser beam through a group <strong>of</strong> fibers and measuring the<br />
scattering <strong>of</strong> the transmitted light. The radial scattering pr<strong>of</strong>ile<br />
is directly related to the diameter distribution <strong>of</strong> the fibers<br />
present within the sampling volume. The sampling volume<br />
<strong>for</strong> the FibrSizr unit (Powerscope, Inc., Minneapolis, MN) is a<br />
cylinder that is 12 millimeters in diameter and up to 200 millimeters<br />
in length. The sample, either a fiber mat or fiber<br />
stream, can lie in almost any orientation relative to the sampling<br />
volume. Figure 2 illustrates the use <strong>of</strong> the FibrSizr unit.<br />
The scattering <strong>of</strong> the light is measured using a central sensor<br />
Figure 2<br />
THE FIBRSIZR UNIT:<br />
A) OVERALL DIAGRAM OF THE UNIT;<br />
B) DETECTOR ARRAY<br />
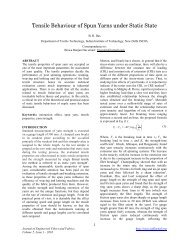
Figure 3<br />
THE CALCULATION SCHEME USED FOR<br />
DETERMINING FIBER DIAMETER<br />
DISTRIBUTIONS<br />
and a series <strong>of</strong> concentric sensor arcs. Primarily based on the<br />
Mie scattering model (Mie, 1908), the <strong>for</strong>ward scattering <strong>of</strong> the<br />
light is used to measure the fiber diameter distribution <strong>of</strong> a<br />
given sample. Similar technology has already been applied to<br />
particle sizing applications (Black et al., 1996). The calculation<br />
scheme based on the scattering data is iterative; this iterative<br />
process is depicted in Figure 3. The raw scattering data are<br />
taken at the detector, and then the data are sent to a computer<br />
<strong>for</strong> analysis. A multiple regression technique is used to compute<br />
what fiber diameter distribution would produce the<br />
observed laser scattering. Since this method is based on the<br />
accuracy <strong>of</strong> the scattering model, calibration is necessary. The<br />
manufacturer <strong>of</strong> the unit conducted an extensive calibration <strong>of</strong><br />
the scattering model wherein the ELD measurements were<br />
verified by both scanning electron microscopy (SEM) and<br />
optical microscopy; see Fandrey and Naqwi (2003). These<br />
researchers found that the laser scattering technique gave very<br />
good agreement with both SEM and optical measurements.<br />
Die and Extruder Unit<br />
The experiments were conducted on a pilot scale melt blowing<br />
line at the 3M Nonwovens Technology Center in St. Paul,<br />
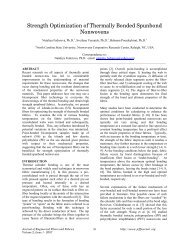
Minnesota. An eight-inch wide slot die <strong>of</strong> drilled design was<br />
used in this line; see Figure 4. The die was oriented horizontally<br />
such that the fiber curtain was parallel to the ground.<br />
(The fiber curtain is the assembly <strong>of</strong> fibers that travel between<br />
the die and the collector.) The die had 101 capillaries spread<br />
evenly across the central 4 inches <strong>of</strong> the die; air flowed<br />
through the entire 8 inches <strong>of</strong> the die width. Electrical heating<br />
was used to control the die temperature. Each polymer capillary<br />
had a diameter <strong>of</strong> 0.015 inches. Compressed air <strong>for</strong> blowing<br />
was routed first through an electric heater, and then<br />
through a four hose manifold, and finally to the die itself.<br />
Airflow was measured using Pitot sensors in the air lines, and<br />
airflow was controlled with a pressure regulator. Polymer<br />
pellets were melted and pressurized using a 19 mm (3/4 inch)<br />
Brabender ® extruder. The molten polymer was then fed to a<br />
43 INJ Summer 2004
Figure 4<br />
VIEW OF THE FACE OF THE MELT<br />
BLOWING DIE. THE +Z DIRECTION IS<br />
PERPENDICULAR TO THE FACE, AND THE<br />
ORIGIN OF THE COORDINATE SYSTEM IS AT<br />
THE CENTER OF THE DIE FACE<br />
gear pump that provided accurate polymer flow control.<br />
Polymer flow was measured by timed collection and weighing<br />
<strong>of</strong> fibers from the die. <strong>Fiber</strong>s were collected on a solid<br />
drum collector that was placed 1 meter from the die face. The<br />
polymer used <strong>for</strong> the experiments was Fina Dypro ® 3860 isotactic<br />
polypropylene with a nominal melt flow index <strong>of</strong> 100.<br />
Operating Conditions<br />
Line operating conditions were chosen to be representative<br />
<strong>of</strong> normal melt blowing. The polymer rates used were 1.13,<br />
2.27, and 4.54 kg/hr (2.5, 5, and 10 lb/hr). Airflow rates used<br />
were 2500 and 3900 standard liters per minute (SLPM.) The<br />
die temperature was held at 300°C, while the air heater was<br />
set to 420°C. There were significant air temperature losses in<br />
the air lines leading to the die. The air heater temperature was<br />
set such that the air temperature at the die was approximately<br />
300°C. The die configuration did not allow <strong>for</strong> direct measurements<br />
<strong>of</strong> the air temperature inside the die. However,<br />
measurements were taken <strong>of</strong> the air temperature <strong>of</strong> the jets at<br />
the die discharge; this temperature was 300°C.<br />
<strong>Fiber</strong> Diameter <strong>Measurement</strong>s<br />
The laser scattering unit used <strong>for</strong> the ELD measurements in<br />
our experiments was the Powerscope Fibrsizr. The unit consisted<br />
<strong>of</strong> a laser and a detector attached to a “U” frame and<br />
mounted on a movable stand; see Figure 5. Raw scattering<br />
data were transferred to a computer <strong>for</strong> analysis through a<br />
USB interface. Scattering data fitting and analysis were per<strong>for</strong>med<br />
using included proprietary s<strong>of</strong>tware. The instrument<br />
was located such that the detector head was as close as possible<br />
to the fiber stream without interfering with the process.<br />
The distance between the detector and the fibers is the working<br />
distance. This working distance (measured in the y direction<br />
in Figures 4 and 5) must be kept as small as possible in<br />
order to improve the accuracy <strong>of</strong> the measurements. Since the<br />
distance between the detector and the emitter is about 1 meter,<br />
there are not any clearance problems associated with the emitter<br />
interfering with the fibers. At large working distances, the<br />
ELD technique will not resolve fibers <strong>of</strong> the smallest diameters.<br />
However, when only large diameter fibers are present in<br />
the sample, the working distance can be increased. At large<br />
distances from the die (large +z positions as shown in Figures<br />
4 and 5), the working distance used was approximately 7.6 cm<br />
(3 inches). This working distance was small enough to resolve<br />
fiber diameters down to the instrument’s lower limit <strong>of</strong> 1.5<br />
microns. Due to physical clearance issues around the die,<br />
when the distance from the die (z position) was less than 8.9<br />
cm (3.5 inches), the working distance was increased to approximately<br />
20 cm (8 inches), which was just sufficient to clear the<br />
die; see the dotted lines in Figure 5. With the increased working<br />
distance, measurements were taken as close as 0.64 cm<br />
(0.25 inches) from the die (z position); the die face itself interfered<br />
with closer measurements. <strong>Measurement</strong>s taken at z =<br />
8.9 cm (3.5 inches) from the die – using both 7.6 and 20 cm<br />
working distances – showed no difference due to using a larger<br />
working distance. The compensating factor is that, near the<br />
die, the fibers have larger diameters, and, hence, there is no<br />
need to measure smaller diameters.<br />
<strong>Measurement</strong>s were taken in two directions. First, the fiber<br />
diameter pr<strong>of</strong>ile was measured by moving the ELD assembly<br />
in the z direction while keeping the assembly in the x=0 plane<br />
(i.e., the center <strong>of</strong> both the die face and the fiber curtain).<br />
These data provided both a measure <strong>of</strong> fiber attenuation and<br />
an approximation <strong>of</strong> fiber bundling. Second, measurements<br />
were taken across the width <strong>of</strong> the die (in the x direction) in<br />
order to determine the uni<strong>for</strong>mity <strong>of</strong> the fiber diameter pr<strong>of</strong>iles<br />
across the width <strong>of</strong> the die.<br />
Figure 5<br />
ORIENTATION OF FIBRSIZR UNIT RELA-<br />
TIVE TO THE MELT BLOWING PROCESS<br />
THE DISTANCE BETWEEN THE EMITTER AND COL-<br />
LECTOR IS ABOUT 1 METER, AND THE WORKING DIS-<br />
TANCE IS OPTIMALLY ABOUT 7.6 CM. HOWEVER,<br />
NEAR THE DIE FACE, THE WORKING DISTANCE MUST<br />
BE INCREASED TO ABOUT 20 CM BECAUSE OF CLEAR-<br />
ANCE PROBLEMS (THE DOTTED LINES SHOW THE<br />
FIBRSIZR UNIT IN THIS SITUATION).<br />
44 INJ Summer 2004
Figure 6<br />
MEAN DIAMETER PROFILES OBTAINED<br />
FROM TWO SUCCESSIVE RUNS AT 2.27<br />
KG/HR (5 LB/HR) POLYMER FLOW, 300°C DIE<br />
TEMPERATURE, AND 2500 SLPM AIRFLOW<br />
RESULTS AND DISCUSSION<br />
Reproducibility Test<br />
The first set <strong>of</strong> experiments was designed to evaluate the<br />
repeatability <strong>of</strong> the ELD (ensemble laser diffraction) method.<br />
Process flows were held constant at 2.27 kg/hr (5 lb/hr) <strong>of</strong><br />
polymer and 2500 SLPM <strong>of</strong> air. <strong>Measurement</strong>s were taken at<br />
increasing distances (z positions) from the die face and at the<br />
center (x=0 plane) <strong>of</strong> the fiber curtain. The mean diameter<br />
pr<strong>of</strong>iles determined by two typical replicate measurements<br />
<strong>for</strong> these process conditions are shown in Figure 6, and the<br />
standard deviations are shown in Figure 7. The standard deviation<br />
is an output <strong>of</strong> the ELD instrument. The standard deviation<br />
represents the width <strong>of</strong> the distribution <strong>of</strong> all fibers contained<br />
in the ELD measuring volume. As Figure 6 illustrates,<br />
the mean diameter data were highly reproducible from measurement<br />
to measurement, with typical differences being less<br />
than two microns. Figure 7 shows that the standard deviation<br />
is also reproducible from run to run (but not to the same<br />
degree as mean diameter). One important feature <strong>of</strong> Figure 6<br />
is the apparent increase in mean diameter at distances (z positions)<br />
farther than 2.5 inches (6.3 cm) from the die. Since melt<br />
blown fibers are always expected to attenuate (have diameter<br />
reduction) and then reach constant diameter as the distance<br />
from the die increases, the increase shown on Figure 6 is attributed<br />
to bundling <strong>of</strong> fibers as they progress away from the die.<br />
In comparing Figure 6 with typical fiber attenuation pr<strong>of</strong>iles<br />
(e.g., see Bansal and Shambaugh, 1996), it appears that fiber<br />
attenuation has ceased at about z = 2.5 inches. Then, in our<br />
multi-hole system, fiber bundling begins to cause the mean<br />
diameter to increase. Of course, if bundling begins to take<br />
place at z values where attenuation is still occurring, then<br />
bundling may compete with fiber attenuation to cause a shift<br />
Figure 7<br />
PROFILES OF DIAMETER STANDARD<br />
DEVIATION OBTAINED FROM TWO<br />
SUCCESSIVE RUNS AT 2.27 KG/HR (5<br />
LB/HR) POLYMER FLOW, 300°C DIE<br />
TEMPERATURE, AND 2500 SLPM AIRFLOW<br />
(to a smaller z value) in the minimum diameter shown on<br />
Figure 6. <strong>Fiber</strong> bundling is a well-known occurrence in the<br />
melt blowing process (Yin et al., 1999). While the ELD technique<br />
does detect the bundling <strong>of</strong> fibers, the technique does<br />
not provide a quantitative measurement <strong>for</strong> the amount <strong>of</strong><br />
bundling. In Figure 7 it appears that the normalized standard<br />
deviation <strong>of</strong> the fiber distribution approaches an asymptote at<br />
approximately 10 inches (25 cm) from the die face. However,<br />
even through the normalized standard distribution is constant,<br />
the mean diameter is still increasing with further<br />
bundling as shown in Figure 6.<br />
Variations across the Die Face<br />
<strong>Measurement</strong>s were taken across the width <strong>of</strong> the fiber curtain<br />
in order to gauge the uni<strong>for</strong>mity <strong>of</strong> fiber distribution.<br />
End effects play an important role in the <strong>for</strong>mation <strong>of</strong> melt<br />
blown products, and controlling the depth <strong>of</strong> the end effect is<br />
an important part <strong>of</strong> engineering a melt blowing process. The<br />
air flow patterns near the ends <strong>of</strong> the air slots are different<br />
from the air flow patterns near the center <strong>of</strong> the slots. These<br />
differences are collectively referred to as jet end effects.<br />
<strong>Measurement</strong>s across the width <strong>of</strong> the die (in the x direction)<br />
were taken at four different distances (z positions) from the<br />
die. These results are shown in Figures 8 and 9 <strong>for</strong> mean diameter<br />
and standard deviation, respectively. Observe that the<br />
fiber size is nearly constant across the die face. This suggests<br />
that the air end effects do not penetrate far enough from the<br />
ends <strong>of</strong> the air slots to affect the fiber attenuation. Thus, having<br />
two inches <strong>of</strong> fallow space (die length with air slots but no<br />
polymer holes) at either end <strong>of</strong> the die was sufficient to prevent<br />
air jet end effects from affecting the fiber attenuation.<br />
Without this fallow space, the polymer exiting the holes at the<br />
45 INJ Summer 2004
Figure 8<br />
VARIATION OF FIBER DIAMETER IN THE X<br />
DIRECTION FOR DIFFERENT Z LEVELS AND<br />
Y= 0. THE RUN CONDITIONS WERE 2.27<br />
KG/HR (5 LB/HR) POLYMER FLOW, 300°C DIE<br />
TEMPERATURE, AND 2500 SLPM AIRFLOW<br />
Spinline Pr<strong>of</strong>iles<br />
To gauge the sensitivity <strong>of</strong> the ELD instrument to process<br />
changes, three measurements <strong>of</strong> the center fiber diameter pr<strong>of</strong>ile<br />
(measurements along the z axis at x=0 and y=0) were<br />
taken at different polymer flow rates and air flow rates. The<br />
three tested polymer flow rates (2.5 lb/hr, 5 lb/hr, and 10<br />
lb/hr) cover most <strong>of</strong> the operating range <strong>of</strong> this die at 300°C<br />
and 2500 SLPM airflow using Fina Dypro 3860 isotactic<br />
polypropylene. The mean diameter is shown in Figure 10, and<br />
the standard deviation is shown in Figure 11. The lower the<br />
polymer flowrate, the smaller the fiber diameter, as is expected.<br />
All three cases also show the mean diameter growth due<br />
to bundling.<br />
Figure 11, the standard deviation graph, shows that, at large<br />
distances from the die face, the normalized standard deviation<br />
approaches an asymptotic value. The standard deviation<br />
becomes approximately 60% <strong>of</strong> the measured mean fiber<br />
Figure 10<br />
MEAN DIAMETER PROFILES AS A FUNC-<br />
TION OF Z AND FOR VARYING POLYMER<br />
FLOW RATES. THE DIE TEMPERATURE WAS<br />
300°C AND THE AIRFLOW WAS 2500 SLPM<br />
Figure 9<br />
DIAMETER STANDARD DEVIATION<br />
VARIATION IN THE X DIRECTION FOR<br />
DIFFERENT Z LEVELS AND Y = 0. THE RUN<br />
CONDITIONS WERE 2.27 KG/HR (5 LB/HR)<br />
POLYMER FLOW, 300°C DIE TEMPERATURE,<br />
AND 2500 SLPM AIRFLOW.<br />
ends <strong>of</strong> the die would have been exposed to a different air<br />
field than the polymer exiting the holes that are nearer to the<br />
die center. Since the air field is what makes melt blowing<br />
work, then a different air field would produce different fiber<br />
attenuation, different bundling, etc. (<strong>Fiber</strong> uni<strong>for</strong>mity would<br />
decrease.)<br />
Figure 11<br />
DIAMETER STANDARD DEVIATION<br />
VARIATION AS A FUNCTION OF Z AND<br />
FOR VARYING POLYMER FLOW RATES. THE<br />
DIE TEMPERATURE WAS 300°C AND THE<br />
AIRFLOW WAS 2500 SLPM<br />
46 INJ Summer 2004
diameter, regardless <strong>of</strong> the polymer flow rate.<br />
Figure 12 shows the mean diameter pr<strong>of</strong>iles <strong>for</strong> two different<br />
airflow rates. As is typical in melt blowing processes, the<br />
higher airflow rate produces finer fibers. Also, the distance at<br />
which attenuation is complete is shorter <strong>for</strong> higher airflow<br />
rates. As <strong>for</strong> the bundling effect at high z values, both airflow<br />
rates produce about the same percent increase in fiber size<br />
(versus the minimum fiber diameter at the flow rate in question).<br />
Conclusion<br />
<strong>Ensemble</strong> laser diffraction, or ELD, is a new technology <strong>for</strong><br />
measuring fiber diameter distributions. This technique provides<br />
quick distribution measurements <strong>for</strong> both on-line and<br />
<strong>of</strong>f-line operation. However, the ELD technique is based on a<br />
semi-empirical model <strong>for</strong> light diffraction though multiple<br />
fibers. This semi-empirical nature <strong>of</strong> this model may require<br />
calibration and verification <strong>for</strong> new applications. For the melt<br />
blowing application discussed in this paper, the ELD technique<br />
was calibrated against microscopic (<strong>of</strong>f-line) measurements<br />
<strong>of</strong> fiber diameter and bundle size. The chief advantages<br />
<strong>of</strong> ELD include (a) the large sampling volume compared<br />
to conventional LDV, (b) the nearly instantaneous response<br />
time, and (c) the ability to measure both moving and stationary<br />
fibers (i.e., on-line and <strong>of</strong>f-line capability).<br />
The mean fiber diameter showed a minimum along the<br />
spinline length. This minimum separates the attenuation<br />
region <strong>of</strong> the spinline from the bundling region. Also, the 8<br />
inch die - with a center 4 inch zone <strong>for</strong> the fibers – had minimal<br />
variation <strong>of</strong> fiber attenuation rate across the width <strong>of</strong> the<br />
fiber curtain.<br />
Figure 12<br />
MEAN DIAMETER PROFILES FOR TWO<br />
DIFFERENT AIRFLOW RATES. THE POLY-<br />
MER FLOW RATE WAS 2.27 KG/HR (5 LB/HR)<br />
AND THE DIE TEMPERATURE WAS 300°C<br />
Mie, G., “Beiträge zur Optik trüber Medien, speziell kolloidaler<br />
Metallösungen”, Ann. Physik, 1908, 25, 377-452.<br />
Yin, H.; Yan, Z.; Bresee, R.R. “Experimental Study <strong>of</strong> the Melt<br />
Blowing Process”, Int. Nonwovens J., 1999, 8(1), 60-65. — INJ<br />
Acknowlegments<br />
This work was sponsored through an NSF GOALI Grant<br />
(DMII-0245324). The work was conducted while one <strong>of</strong> the<br />
authors (Eric M. Moore) was a guest at the 3M Center in St.<br />
Paul, MN. A great deal <strong>of</strong> support <strong>for</strong> this work was provided<br />
by the staff at 3M; in particular, we wish to thank David L.<br />
Nelson and Anne de Rovere <strong>for</strong> their guidance and encouragement.<br />
References<br />
Bansal, V.; Shambaugh R.L. “On-Line Determination <strong>of</strong><br />
Density and Crystallinity During Melt Spinning”, Polym. Eng.<br />
Sci., 1996, 36(22), 2785-2798.<br />
Black, D.L.; McQuay, M.Q.; Bonin, M.P. “<strong>Laser</strong>-based<br />
Techniques <strong>for</strong> Particle-size <strong>Measurement</strong>: A Review <strong>of</strong> Sizing<br />
Methods and Their Industrial Applications”, Prog. Energy<br />
Combust. Sci., 1996, 22(3), 267-306.<br />
Fandrey, C.W.; Naqwi, A.A. “<strong>Ensemble</strong> <strong>Diffraction</strong> <strong>for</strong> onand<br />
<strong>of</strong>f-line Sizing <strong>of</strong> Nonwoven <strong>Fiber</strong>s”, International<br />
Nonwovens Technical Conference (INTC) 2003 Meeting,<br />
Renaissance Harbor Place Hotel, Baltimore, MD, September<br />
15-18, 2003.<br />
Marlow-Ferguson, R., ed. “Nonwoven Fabrics” in<br />
Encyclopedia <strong>of</strong> American Industries, 3rd ed., vol. 2, The Gale<br />
Group, Detroit, 2001, 192.<br />
47 INJ Summer 2004