Are most published research findings actually false ... - TPR World
Are most published research findings actually false ... - TPR World
Are most published research findings actually false ... - TPR World

You also want an ePaper? Increase the reach of your titles
YUMPU automatically turns print PDFs into web optimized ePapers that Google loves.
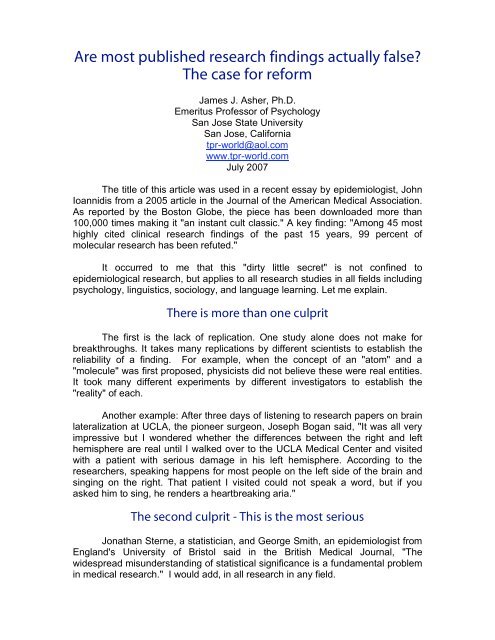
<strong>Are</strong> <strong>most</strong> <strong>published</strong> <strong>research</strong> <strong>findings</strong> <strong>actually</strong> <strong>false</strong>?<br />
The case for reform<br />
James J. Asher, Ph.D.<br />
Emeritus Professor of Psychology<br />
San Jose State University<br />
San Jose, California<br />
tpr-world@aol.com<br />
www.tpr-world.com<br />
July 2007<br />
The title of this article was used in a recent essay by epidemiologist, John<br />
Ioannidis from a 2005 article in the Journal of the American Medical Association.<br />
As reported by the Boston Globe, the piece has been downloaded more than<br />
100,000 times making it "an instant cult classic." A key finding: "Among 45 <strong>most</strong><br />
highly cited clinical <strong>research</strong> <strong>findings</strong> of the past 15 years, 99 percent of<br />
molecular <strong>research</strong> has been refuted."<br />
It occurred to me that this "dirty little secret" is not confined to<br />
epidemiological <strong>research</strong>, but applies to all <strong>research</strong> studies in all fields including<br />
psychology, linguistics, sociology, and language learning. Let me explain.<br />
There is more than one culprit<br />
The first is the lack of replication. One study alone does not make for<br />
breakthroughs. It takes many replications by different scientists to establish the<br />
reliability of a finding. For example, when the concept of an "atom" and a<br />
"molecule" was first proposed, physicists did not believe these were real entities.<br />
It took many different experiments by different investigators to establish the<br />
"reality" of each.<br />
Another example: After three days of listening to <strong>research</strong> papers on brain<br />
lateralization at UCLA, the pioneer surgeon, Joseph Bogan said, "It was all very<br />
impressive but I wondered whether the differences between the right and left<br />
hemisphere are real until I walked over to the UCLA Medical Center and visited<br />
with a patient with serious damage in his left hemisphere. According to the<br />
<strong>research</strong>ers, speaking happens for <strong>most</strong> people on the left side of the brain and<br />
singing on the right. That patient I visited could not speak a word, but if you<br />
asked him to sing, he renders a heartbreaking aria."<br />
The second culprit - This is the <strong>most</strong> serious<br />
Jonathan Sterne, a statistician, and George Smith, an epidemiologist from<br />
England's University of Bristol said in the British Medical Journal, "The<br />
widespread misunderstanding of statistical significance is a fundamental problem<br />
in medical <strong>research</strong>." I would add, in all <strong>research</strong> in any field.
When is a "significant difference" not significant?<br />
The answer is: Always. Hey, that does not make sense. Throughout our<br />
undergraduate and graduate training, we read that this study and that study<br />
showed a "significant difference." When is a significant difference not significant?<br />
The explanation, for which <strong>most</strong> investigators seem to have amnesia, is<br />
this: When a statistical procedure such as the t test, chi-square or analysis of<br />
variance reports a significant difference, it does not literally mean "significant<br />
difference." All it says is that with a certain degree of confidence, the <strong>research</strong>er<br />
believes that there is a real difference in the means (or averages) in the<br />
"populations" from which the samples were drawn. "Real" means that the<br />
difference is not due to chance but to the independent variable. Remember, any<br />
sample of anything represents some larger group called a population.<br />
A sample can be only one case<br />
A sample is not necessarily an aggregate, but can be one case only. For<br />
instance, your physician draws a sample of your blood, but that sample is only<br />
important because it represents all the blood in your body which is the<br />
“population." Information from the sample can be generalized to the blood<br />
chemistry in your entire body.<br />
Why a significant difference is a stingy piece of information<br />
Telling practitioners in any field that, for example, "There is a significant<br />
difference in cholesterol for adults who take statins compared with those who do<br />
not," is not much information to make clinical decisions. The alert practitioner will<br />
want to know the magnitude of the difference. If the difference is tiny, I may not<br />
recommend statins for my patients because nobody wants to take pills if they<br />
don't have to, and then too, there may be side effects. But if the difference is<br />
medium or large, I will give the information serious consideration. This may be<br />
worthwhile for my patients.<br />
Notice that only a few studies in any field report the magnitude<br />
of the difference<br />
Researchers forget what "significant difference" is all about, but they like<br />
the sound of the word "significant" because, I believe, it implies something<br />
important or worthwhile. Consumers of the <strong>research</strong> and editors of the journals<br />
seem to be content, so why change? Further, senior colleagues who will review<br />
the work of a junior scientist for promotion seem to be content. Isn't that good<br />
enough? No it isn't.
Here is what I recommend<br />
First, as I advise my students, if a statistic is "significant," calculate the<br />
effect size and feature this information in your report. As a "rule of thumb," Jacob<br />
Cohen’s classic book, Statistical Power Analysis in the Behavioral Sciences<br />
(1988) recommends: For studies with human subjects, ES of 02 is small, .12 is<br />
medium and .25 is large.<br />
But, what does effect size mean?<br />
Let's start with a fundamental idea that applies to any study in any field:<br />
The scores for samples being compared such as the cholesterol for adults taking<br />
statins and those who do not - those scores will vary from person to person.<br />
That variation can be decomposed into two parts: The variation within groups<br />
and the variation between groups. This principle holds true for all studies in any<br />
field.<br />
The variation within samples<br />
The variation within samples is the result of "chance." Chance is kind of a<br />
"wastebasket" term that includes reasons why one person has a different<br />
cholesterol reading from someone else. The reasons are many, such as<br />
genetics, gender, diet, physical fitness, and age. Put them all into one bundle and<br />
we call it "chance."<br />
The variation between samples is important to us because this is the<br />
result of the "independent variable," which is the statins in my example. So, the<br />
total variation in any study is the result of only two factors: variation within the<br />
samples, which we call "chance," and variation between samples which we call<br />
the "independent variable." In the game of science, we are always playing<br />
against our opponent, chance. We are always trying to beat chance.<br />
If the variation between samples is about the same as the variation within<br />
the samples, we conclude that the statins performed no better than chance and<br />
therefore, the results are "non-significant." If, however, the statins perform better<br />
than chance, we won the game and announce, "Statins produced a significant<br />
difference in cholesterol, (which is called the "dependent variable").<br />
How journal editors can help in the reform<br />
Journal editors and reviewers can help by insisting that <strong>research</strong>ers<br />
follow-up significant statistical differences by reporting the effect size. This is<br />
especially important in review articles that examine and integrate <strong>findings</strong> from<br />
many different studies and many different investigators. The reason: It is difficult<br />
to compare results from the t test, chi-square, correlation, and analysis of<br />
variance. This is like comparing apples, oranges, pears and pineapples.
When the investigator converts "significant" <strong>findings</strong> into effect size we now have<br />
a common metric for sensible comparisons.<br />
A final note<br />
Eighty years ago, the statisticians, Peters and Van Voorihs, said<br />
something like this that seems to make perfect sense: "Our colleagues continue<br />
to apply different statistics in different studies which makes comparisons between<br />
studies ambiguous. This is puzzling when one can by-pass this problem by<br />
directly finding the variability within and between samples, and then the ratio of<br />
between divided by within variance - a ratio (which is the effect size) that tells the<br />
whole story. If you want to know how to do this, see my book, "A Simplified Guide<br />
to Statistics for Non-Mathematicians." Have fun! There is nothing more exciting<br />
than discovering something no one else in the world knows.<br />
R E F E R E N C E S<br />
To order the Asher books online, go to www.tpr-world.com<br />
Asher, James J. Learning Another Language Through Actions (6th edition).<br />
Los Gatos, CA., Sky Oaks Productions, Inc.<br />
Asher, James J. Brainswitching: Learning on the right side of the brain.<br />
Los Gatos, CA., Sky Oaks Productions, Inc.<br />
Asher, James J. The Super School: Teaching on the right side of the brain.<br />
Los Gatos, CA., Sky Oaks Productions, Inc.<br />
Asher, James J. The Weird and Wonderful <strong>World</strong> of Mathematical Mysteries:<br />
Conversations with famous scientists and mathematicians.<br />
Los Gatos, CA., Sky Oaks Productions, Inc.<br />
Asher, James J. A Simplified Guide to Statistics for Non-Mathematicians.<br />
Los Gatos, CA., Sky Oaks Productions, Inc.<br />
Asher, James J. Prize-winning <strong>TPR</strong> Research.<br />
Los Gatos, CA., Sky Oaks Productions, Inc.<br />
Cohen, Jacob. Statistical Power Analysis in the Behavioral Sciences, 1988<br />
New York: Academic Press.<br />
Peters, Charles C. and Walter R. Van Vorhis Statistical Procedures and their<br />
Mathematical Bases, 1940.<br />
New York: McGraw-Hill.<br />
Send your comments or questions about this article to the writer<br />
at tpr-world@aol.com