Quarterly Report: April - June 2013 - wa.gov.au
Quarterly Report: April - June 2013 - wa.gov.au
Quarterly Report: April - June 2013 - wa.gov.au
You also want an ePaper? Increase the reach of your titles
YUMPU automatically turns print PDFs into web optimized ePapers that Google loves.
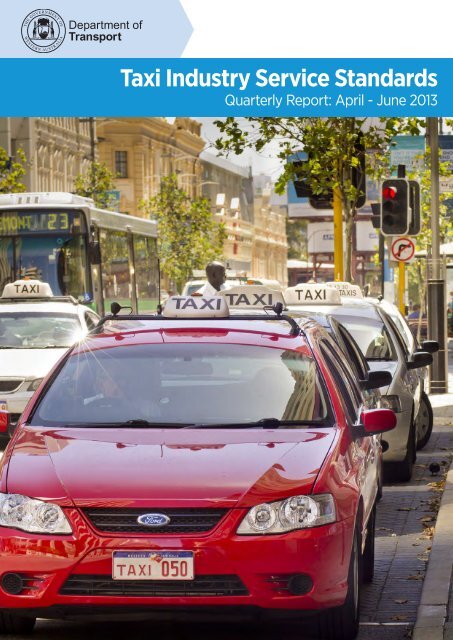
Taxi Industry Service Standards<br />
<strong>Quarterly</strong> <strong>Report</strong>: <strong>April</strong> - <strong>June</strong> <strong>2013</strong>
Contents<br />
Background<br />
Introduction and current initiatives<br />
Jobs not covered<br />
Taxi on-time<br />
Driver and passenger safety<br />
Complaints handling perception survey<br />
Telephone answered promptly<br />
Industry viability<br />
1<br />
2<br />
3<br />
4<br />
5<br />
6<br />
7<br />
8<br />
Background<br />
Taxi Types<br />
Taxi Type Number Definition<br />
Standard Taxis<br />
Conventional taxi 1,605 Covers standard (non wheelchair) jobs at all hours<br />
Area restricted taxi 75 Operate within designated metropolitan areas<br />
Peak period taxi 422 Must operate on Friday and Saturday nights (5pm to 6am) and may<br />
operate:<br />
• from 4 pm on Fridays;<br />
• from 4 am to 9 am Monday to Friday; and<br />
• from 6 pm to 12 am on Sunday.<br />
Wheelchair Accessible Taxis<br />
Multi Purpose Taxi (MPT) 112 Must have capacity to seat either<br />
• Five passengers in the ‘conventional configuration’ or<br />
• Two passengers seated in wheelchairs plus two additional<br />
passengers when in the ‘wheelchair accessible’ configuration.<br />
Types of taxi request<br />
Booked Jobs<br />
Name Definition Additional information<br />
Pre-booked Job requests made at least 30<br />
minutes prior to required time<br />
ASAP All jobs requested less than 30<br />
minutes prior to the taxi being required<br />
Booked jobs include job requests made by<br />
phone call, smart phone ‘apps’ and online via<br />
a website<br />
Rank and Hail<br />
Jobs which are not made by calling a<br />
TDS, but by hailing a taxi or standing<br />
at a taxi rank<br />
As all data for this report is extracted from TDS<br />
job data, rank and hail data is not analysed at all<br />
in this report<br />
1
Introduction and current initiatives<br />
Purpose of report<br />
This report is prepared by the Department of Transport (DoT) Passenger Services Business Unit (PSBU) to present<br />
current industry data to the Minister for Transport and external stakeholders.<br />
Data is prepared on the Key Performance Indicators (KPIs); jobs not covered and taxi <strong>wa</strong>iting times, as well as safety,<br />
complaints, industry viability and telephone <strong>wa</strong>it times.<br />
Current Issues and Projects within the PSBU<br />
Mobile security patrols - extended for 3 years<br />
In <strong>April</strong> <strong>2013</strong>, following a successful 12 month trial and appointment through a tender process, DoT hired Wilson<br />
Security to provide mobile security patrols across the metropolitan area for a further 3 years.<br />
The security patrol will continue to operate with two security officers in each vehicle at the following times:<br />
• Midnight on Fridays to 6am on Saturdays<br />
• Midnight on Saturdays to 6am on Sundays.<br />
Expressions of Interest for Government Lease Plates<br />
In <strong>June</strong> <strong>2013</strong>, the DoT advertised an Expression of Interest (EOI) for taxi drivers to lease a conventional, peak period<br />
or area restricted Government taxi plate. This EOI differed from previous EOIs in that plate allocation <strong>wa</strong>s based on<br />
the performance of the drivers. Performance <strong>wa</strong>s measured between 1 <strong>June</strong> 2012 and 31 May <strong>2013</strong>. Criteria such<br />
as jobs per hour completed, jobs per hour recalled and the length of shifts were used. This <strong>wa</strong>s done to re<strong>wa</strong>rd safe<br />
behaviour and good customer service, and improve the standard of drivers in the industry.<br />
Decrease in taxi demand<br />
Taxi demand has declined when compared with the same quarter last year. This is the second quarter to see a<br />
negative growth in demand. Booked taxi demand fell by 6.94% when compared with the <strong>June</strong> quarter 2012.<br />
Recalculation of complaints data<br />
The serious complaints statistics (page 5) in the previous two quarters have been vastly different from those in<br />
previous quarters. This increase <strong>wa</strong>s investigated and a processing error <strong>wa</strong>s found to have occurred in the March,<br />
<strong>June</strong> and September quarters of 2012. The figures for these quarters have been recalculated and Table 4 in this<br />
report has been updated accordingly.<br />
2
Jobs not covered<br />
Definition: ‘Jobs not covered’ (JNC) measures the amount of standard (non MPT), Perth metropolitan, taxi jobs not<br />
covered. This includes jobs where a passenger <strong>wa</strong>s never picked up or a job where, after <strong>wa</strong>iting for 15 minutes,<br />
a passenger gave up <strong>wa</strong>iting and left the pickup point. These are calculated as a percentage of total Taxi Dispatch<br />
Service (TDS) jobs demanded in that period.<br />
Rank and hail data are not included in this measure. In calculating jobs not covered, high demand public holidays and<br />
special events data are excluded.<br />
Background and performance: From the 2012-13 financial year, the JNC for peak and off peak periods are two<br />
separate KPIs. For the purpose of measuring the JNC, peak periods are Friday and Saturday nights, from 5pm to<br />
6am. All other times are off-peak periods.<br />
Performance in this quarter did not meet the target, as is illustrated in Table 1. Graphs of historical JNC performance<br />
and JNC demand are illustrated below.<br />
Trends: Taxi demand follows a cyclical trend, and is generally lowest in the first quarter of the year, gradually<br />
increasing until it peaks in December. Demand tends to increase when compared with the same quarter in the<br />
previous year.<br />
Target Outer<br />
Suburbs<br />
Outer Suburbs<br />
Target<br />
Inner and<br />
Middle Suburbs<br />
Actual (Q4)<br />
Metro Total<br />
Off peak ≤ 0.5% 1.67% ≤ 0.5% 0.80% 0.94%<br />
Peak ≤ 2.0% 3.77% ≤ 1.0% 1.88% 2.22%<br />
Table 1: JNC Performance in Q4, 2012-13<br />
9%<br />
8%<br />
7%<br />
6%<br />
5%<br />
4%<br />
3%<br />
2%<br />
1%<br />
0%<br />
Historical JNC (%) performance Peak Off-peak<br />
Q1 Q2 Q3 Q4 Q1 Q2 Q3 Q4 Q1 Q2 Q3 Q4 Q1 Q2 Q3 Q4 Q1 Q2 Q3 Q4 Q1 Q2 Q3 Q4<br />
07/08 08/09 09/10 10/11 11/12 12/13<br />
Graph 1: JNC performance during peak and off-peak periods.<br />
600,000<br />
550,000<br />
500,000<br />
450,000<br />
400,000<br />
350,000<br />
300,000<br />
250,000<br />
200,000<br />
Historical Demand trends<br />
Peak Off-peak<br />
Q1 Q2 Q3 Q4 Q1 Q2 Q3 Q4 Q1 Q2 Q3 Q4 Q1 Q2 Q3 Q4 Q1 Q2 Q3 Q4 Q1 Q2 Q3 Q4<br />
07/08 08/09 09/10 10/11 11/12 12/13<br />
1,500,000<br />
1,400,000<br />
1,300,000<br />
1,200,000<br />
1,100,000<br />
1,000,000<br />
900,000<br />
800,000<br />
700,000<br />
Graph 2: Demand trends during peak and off peak periods<br />
3
Taxi on-time<br />
Definition: The percentage of times in which a requested taxi arrives ‘on time,’ or within a target timeframe. Rank and<br />
hail data, as well as data on private bookings made directly with a taxi driver, are not included in this measure.<br />
Background and performance: This measure includes requests made by phone call, smart phone ‘apps’ and<br />
online via a website. The <strong>wa</strong>iting time for pre-booked jobs begins at the time when the taxi is due. All requests made<br />
less than 30 minutes in advance are considered to be ‘ASAP’ jobs. The <strong>wa</strong>iting time for these jobs begins when<br />
the order is placed. The desired or ‘target’ <strong>wa</strong>iting time differs depending on the job type and time of week and is<br />
outlined in Table 2.<br />
Booking Period Target Time Target % of jobs Actual<br />
Pre-booked Peak 5 min 85% 88.1%<br />
Pre-booked Off peak 5 min 90% 91.9%<br />
ASAP Peak 20 min 90% 96.3%<br />
ASAP Off peak 15 min 90% 93.0%<br />
Overall - - 91% 93.5%<br />
Table 2: Conventional taxi <strong>wa</strong>it time targets and performance in Q4, 2012-13<br />
96%<br />
94%<br />
92%<br />
90%<br />
88%<br />
86%<br />
84%<br />
82%<br />
80%<br />
Historical Taxi On-Time<br />
Q1 Q2 Q3 Q4 Q1 Q2 Q3 Q4 Q1 Q2 Q3 Q4 Q1 Q2 Q3 Q4 Q1 Q2 Q3 Q4 Q1 Q2 Q3 Q4<br />
Graph 3: Historical taxi on-time trends<br />
Wheelchair accessible taxi data: As of the 2012-13 financial year, performance targets for MPTs have been raised to<br />
align with those for standard taxis. Notably, a taxi performing an ASAP, off peak job must come within 15 minutes and not<br />
20 to be considered ‘on time.’ This means that on average, about 15% fewer ASAP, off peak jobs are considered ‘on time’<br />
as a result of this standard change.<br />
Booking Period Target Time Target % of jobs Actual<br />
Pre-booked Peak 5 min 85% 54.5%<br />
Pre-booked Off peak 5 min 90% 56.9%<br />
ASAP Peak 20 min 90% 65.7%<br />
ASAP Off peak 15 min 90% 44.9%<br />
Table 3: Wheelchair accessible taxi <strong>wa</strong>it time targets and performance in Q4, 2012-13<br />
4
Driver and passenger safety<br />
Driver safety<br />
Measure: Represented through the number of driver security activations.<br />
Background and performance: Taxi driver safety is important both to the viability of the industry and as a social<br />
and workplace issue. Alarms which require police, ambulance or TDS intervention are reported as ‘full alarms’. If a<br />
taxi driver feels there is potential for danger they can activate a safety alert. If the safety alert escalates into police or<br />
ambulance intervention, it is reported as a full alarm.<br />
The number of security activations can be seen in Graph 4 (below). This year has seen a sharp increase in the<br />
number of safety alerts; this quarter there were 6 full alarms and 195 safety alerts. The general increase in alarms has<br />
been occurring primarily on Friday and Saturday nights and <strong>wa</strong>s expected when the security patrol <strong>wa</strong>s introduced. It<br />
is possible that with the increased likelihood of a rapid security response, drivers are more likely to use the alarm. It is<br />
therefore unclear whether the increase in alarms is due to an increase in violence or an increase in reporting, or both.<br />
300<br />
250<br />
200<br />
150<br />
100<br />
50<br />
0<br />
Number of security acvaons<br />
Safety Alert<br />
Full Alarm<br />
Q1 Q2 Q3 Q4 Q1 Q2 Q3 Q4 Q1 Q2 Q3 Q4 Q1 Q2 Q3 Q4 Q1 Q2 Q3 Q4 Q1 Q2 Q3 Q4<br />
07/08 08/09 09/10 10/11 11/12 12/13<br />
Graph 4: Historical security activations<br />
Passenger safety<br />
Measure: Represented through the number of serious complaints made by passengers<br />
Background and performance: DoT collects data on all complaints. However, whilst many complaints are dealt with<br />
by TDSs, it is a legislative requirement that complaints of a certain nature are referred to DoT for action. Two measures are<br />
reported; the number of complaints by category (see Table 4) and the internal complaints handling process (see Table 5).<br />
Please note that a processing error occurred in the March, July and October quarters in 2012 and the previously reported<br />
figures for these quarters were incorrect. The figures for these quarters have been updated in the table below to reflect<br />
the recalculation.<br />
Passenger Safety<br />
Standard<br />
Inappropriate<br />
comments and/or<br />
suggestions<br />
Un<strong>wa</strong>nted physical<br />
contact<br />
Behaving disorderly<br />
or discourteously<br />
Complaint Category<br />
Q4^<br />
2011-12<br />
Q1^<br />
2012-13<br />
Q2<br />
2012-13<br />
Q3<br />
2012-13<br />
Q4<br />
2012-13<br />
Conversations of an inappropriate nature 14 10 11 15 8<br />
Verbal abuse to<strong>wa</strong>rds a passenger or a<br />
prospective passenger<br />
Serious criminal charges and convictions while<br />
operating a taxi<br />
22 44 37 51 22<br />
0 4 6 2 4<br />
Inappropriate touching of a passenger 1 4 2 3 3<br />
Failing to behave in an orderly manner 4 24 8 8 4<br />
Behaving discourteously to<strong>wa</strong>rds passengers<br />
and potential taxi passengers<br />
78 67 83 92 73<br />
Total 119 153 147 171 114<br />
Table 4: Serious complaints made by passengers<br />
^ the figures for these quarters have been recalculated since the previous report<br />
5
Complaints handling perception survey<br />
Taxi Dispatch Service<br />
Measure: The timeliness with which TDSs respond to complaints.<br />
Background and performance: It is a requirement that the industry provides a timely response to all the complaints<br />
it receives.<br />
The performance targets are as follows:<br />
• respond to complaints within three days<br />
• make substantial progress on each complaint within 14 days<br />
• for the industry to be responsive.<br />
The standard is to meet these targets 95% of the time.<br />
Industry responsiveness is measured through a telephone survey of all complainants, who are asked to rate the<br />
responsiveness of the industry on a scale of one to five.<br />
The performance of DoT is reported together with that of the TDSs and is illustrated in Table 5 (below).<br />
Department of Transport<br />
Measure: The timeliness with which DoT responds to the serious complaints referred to them.<br />
Background and performance: Whilst many complaints are dealt with by TDSs, it is a legislative requirement that<br />
complaints of a certain nature are referred to DoT for action. The types and number of complaints are shown in Table<br />
4 (previous page). This standard <strong>wa</strong>s changed from 14 to 21 days to allow for complaints of a more serious nature to<br />
be actioned.<br />
The target of DoT is to:<br />
• respond to any complaint within three days<br />
• make “substantial progress” on each complaint within 21 days<br />
• for the industry to be responsive.<br />
The standard is to meet these targets 95% of the time.<br />
Complaints handling is reported a quarter behind to allow complaints to be reported and acted upon.<br />
The performance of DoT is reported together with that of the TDSs, as there is not enough complaints data from DoT<br />
to report figures separately.<br />
Performance in this quarter did not meet the target for any of the measures. A table of performance over the last year<br />
is illustrated in Table 5 (below).<br />
Customer service standard<br />
Q3<br />
2011-12<br />
Q4<br />
2011-12<br />
Q1<br />
2012-13<br />
Q2<br />
2012-13<br />
Q3<br />
2012-13<br />
Target<br />
Responses by 3 days 85% (77/94) 91% (95/100) 93% (98/105) 90% (74/82) 90% (51/57) 95%<br />
Substantial Progress within 14 or 21 days 65% (61/94) 60% (60/100) 64% (67/105) 68% (56/83) 60% (34/57) 95%<br />
Industry Responsiveness 57% (54/94) 48% (48/100) 45% (47/105) 42% (35/83) 53% (30/57) 95%<br />
Table 5: Serious complaints handling<br />
6
Telephone answered promptly<br />
Definition: The length of time taken to answer customer calls to book a taxi.<br />
Background and performance: Waiting times on telephone systems are a major source of customer irritation and<br />
within the scope of industry to control.<br />
The standards for telephone <strong>wa</strong>iting times are:<br />
• All calls answered before 60 seconds (97%)<br />
• Most calls answered in 15 seconds (75%)<br />
• High rate of successful connection (93%)<br />
Performance in this quarter met the target for calls answered within 15 seconds. The target of answering 97% of calls<br />
within 60 seconds <strong>wa</strong>s not met.<br />
Month % of Calls with <strong>wa</strong>iting time Calls answered Total jobs<br />
0-15 secs 16-59 secs ≥ 60 secs<br />
2011/04 68% 16% 15.8% 565,137 513,950<br />
2011/05 70% 16% 14.3% 521,542 504,018<br />
2011/06 67% 18% 15.4% 543,608 505,473<br />
2011/07 62% 19% 19.2% 587,819 551,194<br />
2011/08 63% 17% 20.1% 589,256 559,029<br />
2011/09 63% 19% 17.7% 578,936 562,411<br />
2011/10 64% 17% 19.0% 598,962 585,442<br />
2011/11 67% 19% 21.2% 623,036 607,298<br />
#2011/12 60% 19% 21.2% 684,645 659,810<br />
2012/01 72% 15% 13.1% 543,985 536,552<br />
2012/02 66% 20% 13.4% 583,170 560,826<br />
2012/03 78% 13% 8.4% 712,798 653,244<br />
2012/04 83% 11% 5.9% 613,260 580,183<br />
2012/05 90% 8% 1.9% 616,832 599,827<br />
*2012/06 84% 11% 5.0% 654,074 622,649<br />
*2012/07 85% 11% 4.6% 609,426 604,508<br />
*2012/08 82% 12% 5.3% 660,936 652,655<br />
*2012/09 81% 11% 8.1% 632,860 640,315<br />
*2012/10 83% 11% 6.3% 620,317 621,806<br />
*2012/11 82% 11% 6.7% 693,816 658,330<br />
*2012/12 77% 12% 11.7% 740,024 698,820<br />
*<strong>2013</strong>/01 84% 8% 7.2% 526,349 528,144<br />
*<strong>2013</strong>/02 541,855<br />
*<strong>2013</strong>/03 76% 14% 10.1% 622,904 639,204<br />
*<strong>2013</strong>/04 83% 12% 5.0% 531,881 554,974<br />
*<strong>2013</strong>/05 84% 12% 4.1% 539,997 570,352<br />
*<strong>2013</strong>/06 82% 13% 4.9% 527,331 552,760<br />
Peak High Standard >75%
Industry viability<br />
Definition: The number of jobs undertaken per taxi per 24 hours is reported as a measure of driver viability.<br />
Jobs are measured by examining the number of TDS jobs. The number of cars is calculated by examining the<br />
number of active taxis; that is, the number of taxis performing 5 jobs or more through a TDS in the month. By<br />
extension, jobs performed by cars doing less than 5 TDS jobs a month are not included. Rank and hail data is not<br />
included in this measure.<br />
Background: Industry viability is an important long term issue that ultimately impacts industry performance and<br />
the level of service which customers obtain. There are no standards for driver viability. The major intervention by the<br />
<strong>gov</strong>ernment to improve driver viability has been through the introduction of lease plates, which have been provided at<br />
significantly discounted rates.<br />
Performance - Standard taxis: The industry viability of standard (non MPT) taxis can be seen in Graph 5 (below).<br />
2005 2006 2007 2008 2009 2010 2011 2012<br />
Graph 5: Completed Jobs per car per 24 hours for standard taxis<br />
Performance - Wheelchair accessible taxis: Peak times for conventional jobs are typically low demand times<br />
for wheelchair accessible taxis, and only 6% of wheelchair jobs are performed in this time. Wheelchair data is<br />
not representative of wheelchair jobs as a whole. Analysis of TUSS data in 2011 indicated that less that 10% of<br />
wheelchair jobs are booked through a TDS – most are privately arranged with a preferred taxi driver.<br />
Graph 6 indicates the total jobs done by MPTs, which includes wheelchair and conventional jobs.<br />
2005 2006 2007 2008 2009 2010 2011 2012<br />
Graph 6: Completed Jobs per car per 24 hours for MPTs<br />
8
Contact<br />
Department of Transport<br />
140 William Street<br />
Perth WA 6000<br />
Telephone: (08) 6551 6000<br />
Website: www.transport.<strong>wa</strong>.<strong>gov</strong>.<strong>au</strong><br />
The information contained in this publication is provided in good faith and<br />
believed to be accurate at time of publication. The State shall in no <strong>wa</strong>y be liable<br />
for any loss sustained or incurred by anyone relying on the information. 09<strong>2013</strong><br />
9


