ARTA Annual Report 2009 - Auckland Transport
ARTA Annual Report 2009 - Auckland Transport
ARTA Annual Report 2009 - Auckland Transport

You also want an ePaper? Increase the reach of your titles
YUMPU automatically turns print PDFs into web optimized ePapers that Google loves.
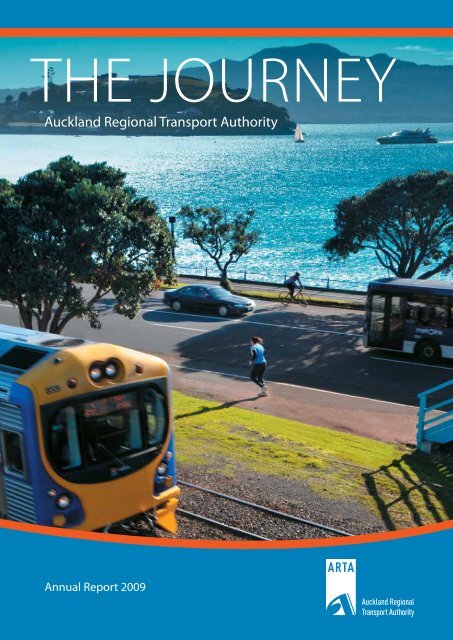
THE JOURNEY<br />
<strong>Auckland</strong> Regional <strong>Transport</strong> Authority<br />
<strong>Annual</strong> <strong>Report</strong> <strong>2009</strong>
<strong>ARTA</strong> <strong>Annual</strong> <strong>Report</strong><br />
<strong>2009</strong> – The Journey<br />
The journey<br />
1973 “Robbie’s rapid rail”, electrified rail and underground CBD rail loop proposed<br />
by Mayor Dove-Meyer Robinson<br />
1976 Plans cancelled<br />
1993 Government sells NZ Railways to private operator<br />
1993-2000 TranzRail underinvests in <strong>Auckland</strong> rail system<br />
1995 <strong>Auckland</strong> Bus Priorities Initiative launched<br />
1996 Link bus service introduced in CBD<br />
1998 First dedicated bus lanes in Sandringham and New North roads<br />
1999 Disused <strong>Auckland</strong> Railway Station converted to flats<br />
2000 Government and ARC buy back <strong>Auckland</strong> rail assets from TranzRail<br />
2003 Britomart Station opens, first refurbished trains in service<br />
2004 Connex (Veolia) contracted to run rail services, <strong>ARTA</strong> is formed to implement<br />
the <strong>Auckland</strong> Regional Land <strong>Transport</strong> Strategy<br />
2004 north Western Cycleway opened, double tracking of the Western Line begins<br />
(Project Boston)<br />
2006 upgrade of Spaghetti Junction motorway corridor complete<br />
2007 The first integrated <strong>Auckland</strong> <strong>Transport</strong> Plan<br />
2008 northern Busway opens, 40% tertiary discount fares introduced, SuperGold Card<br />
introduced for free senior travel, free public transport integrated into events and<br />
leisure tickets<br />
<strong>2009</strong> highest patronage of public transport since 1985 with rail up 97% in past five years,<br />
21 rail stations upgraded, customer satisfaction with public transport reaches 84%,<br />
SH20 extension opens, real time bus information at high priority stops
2010 New stations due to open at Newmarket and New Lynn, Kingsland Station upgraded,<br />
integrated smartcard ticketing, Central Connector completed, extra Manukau Harbour<br />
crossing completed, Newmarket Viaduct replaced<br />
2011 Rugby World Cup sees 75% of ticket-holders get to matches using public transport,<br />
taxis or on foot, Victoria Park Tunnel constructed<br />
2012 Electric trains purchased and rail lines electrified, train line to airport, completion<br />
onwards<br />
of the Western Ring Route, completion of the regional cycle network, additional<br />
Waitemata Harbour crossing built, <strong>Auckland</strong>-Manukau Eastern <strong>Transport</strong> Initiative<br />
(AMETI) completed, CBD underground loop tunnel built, extension of Northern<br />
Busway to Silverdale<br />
Crowds ascend on Britomart during<br />
the early morning commute to work
2 The smart route to commute
TABLE OF CONTENTS<br />
SUCCESS STORIES.. . . . . . . . . . . . . . . . . . . . . . . . . . . . . . . . . . . . . . . . . . . . . . . . . . . . . . . . . . . . . . . . . . 1<br />
Messages from THE Chair and CEO.. . . . . . . . . . . . . . . . . . . . . . . . . . . . . . . . . . . . . . . . . . . . . . . . 6<br />
The Royal Commission on AUCKLAND Governance.. . . . . . . . . . . . . . . . . . . . . . . . . . . . . . . . 10<br />
Our Vision – Where we are headed .. . . . . . . . . . . . . . . . . . . . . . . . . . . . . . . . . . . . . . . . . . . . . . 12<br />
Continuous improvement to services. . . . . . . . . . . . . . . . . . . . . . . . . . . . . . . . . . . . . . . . . . . . 15<br />
Developing <strong>Auckland</strong>’s transport infrastructure.. . . . . . . . . . . . . . . . . . . . . . . . . . . . . . . 23<br />
A customer-centric approach. . . . . . . . . . . . . . . . . . . . . . . . . . . . . . . . . . . . . . . . . . . . . . . . . . . 35<br />
<strong>ARTA</strong> in the Community.. . . . . . . . . . . . . . . . . . . . . . . . . . . . . . . . . . . . . . . . . . . . . . . . . . . . . . . . . 43<br />
Progress on implementing the Regional Land <strong>Transport</strong> Strategy.. . . . . . . . . . . . . . . . 53<br />
Statement of Service Performance.. . . . . . . . . . . . . . . . . . . . . . . . . . . . . . . . . . . . . . . . . . . . . . 57<br />
<strong>ARTA</strong>’s profile .. . . . . . . . . . . . . . . . . . . . . . . . . . . . . . . . . . . . . . . . . . . . . . . . . . . . . . . . . . . . . . . . . . 66<br />
Statement of Compliance and Responsibility.. . . . . . . . . . . . . . . . . . . . . . . . . . . . . . . . . . . . . 80<br />
Statement of Accounting Policies.. . . . . . . . . . . . . . . . . . . . . . . . . . . . . . . . . . . . . . . . . . . . . . . 81<br />
Financial Statements.. . . . . . . . . . . . . . . . . . . . . . . . . . . . . . . . . . . . . . . . . . . . . . . . . . . . . . . . . . . 95<br />
Notes to the Financial Statements .. . . . . . . . . . . . . . . . . . . . . . . . . . . . . . . . . . . . . . . . . . . . . 100<br />
Audit <strong>Report</strong> . . . . . . . . . . . . . . . . . . . . . . . . . . . . . . . . . . . . . . . . . . . . . . . . . . . . . . . . . . . . . . . . . 121<br />
Glossary. . . . . . . . . . . . . . . . . . . . . . . . . . . . . . . . . . . . . . . . . . . . . . . . . . . . . . . . . . . . . . . . . . . . . 124<br />
Directory.. . . . . . . . . . . . . . . . . . . . . . . . . . . . . . . . . . . . . . . . . . . . . . . . . . . . . . . . . . . . . . . . . . . . 125<br />
3
“7.7 million trips were taken on <strong>Auckland</strong>’s<br />
trains last year – the highest number since<br />
records began in 1955. Rail usage has risen<br />
by 97% over the past five years.”<br />
Ellerslie train station: Rail commuters choose the convenient<br />
and relaxing option of catching the train to work
SUCCESS STORIES<br />
<strong>ARTA</strong> is <strong>Auckland</strong>’s central transport agency and is responsible for the integrated<br />
planning, funding and implementation of transport, including arterial roads,<br />
throughout the <strong>Auckland</strong> region.<br />
Record numbers of <strong>Auckland</strong>ers get on board<br />
public transport.<br />
In <strong>2009</strong>, public transport patronage has been higher than in any year since 1985.<br />
Customers took 58.6 million trips on the region’s buses, trains and ferries, a<br />
7.7% increase in just one year.<br />
In 2004, <strong>ARTA</strong> was formed as the country’s first stand alone regional transport<br />
authority, with a mandate to solve <strong>Auckland</strong>’s transport challenges. After decades<br />
of underinvestment, our five years of planning and actions towards an effective,<br />
integrated network are bearing fruit.<br />
This year, <strong>2009</strong>, we can say with confidence that not only are we working for<br />
<strong>Auckland</strong>’s transport needs, but substantial progress has been made in getting<br />
<strong>Auckland</strong>’s transport to work for us, for all <strong>Auckland</strong>ers.<br />
Here’s more proof:<br />
Train trips<br />
7.7 million trips were taken on <strong>Auckland</strong>’s trains last year – the highest number since records<br />
began in 1955. Rail usage has risen by 97% over the past five years.<br />
Reasons:<br />
• More trains, more often. With the double tracking of the Western Line almost complete, trains<br />
run every 15 minutes at peak times, and five to six trains run an hour at peak times on the<br />
Southern and Eastern lines. Services increased from 635 per week in 2005 to 1,475 in <strong>2009</strong>,<br />
with 49 carriages added to the network.<br />
• More punctual. In March 2005 only 76.6% of trains arrived on time. This figure steadied at over<br />
85% for most of <strong>2009</strong>.<br />
• Better stations, better trains. 21 of the 41 stations on the network have been upgraded over<br />
five years. Six train carriages have been fitted this year with new seating, carpet and upgraded<br />
air conditioning.<br />
1
BUS trips<br />
The Northern Express bus service last year carried 1.5 million customers on the new dedicated busway,<br />
which is 55.8% more customers than the year before, and a phenomenal 138% growth in two years. At<br />
peak times, services run every three minutes, which is the best frequency ever in <strong>Auckland</strong>. The Northern<br />
Express success is only one of the reasons bus patronage has grown 10.2% in five years.<br />
Other reasons:<br />
• 40% tertiary discount fares. After the discount fare was introduced, student travel on public transport<br />
rose 75.5% over the previous year.<br />
• Free travel for senior citizens. The SuperGold Card was introduced in October 2008 for senior citizens<br />
to travel free after 9am on weekdays, all weekend and on public holidays. In just six months, 2.3 million<br />
trips were taken.<br />
• Redesigned Botany/Manukau/Howick services. Simplified routes within these areas and to the CBD have<br />
resulted in a 60% increase in patronage – for just a 1.4% increased investment.<br />
• New services to Sylvia Park. Patronage is up 31%.<br />
• Airport Airbus changes. A simpler route and cheaper fares, more services, integrated ticketing with the<br />
Northern Express, plus a new service from Manukau to the airport, have increased patronage by 13.5%.<br />
2<br />
Improvements to the Botany, Manukau and Howick bus services<br />
in February <strong>2009</strong> have resulted in 60% patronage growth
FERRY tripS<br />
Pine Harbour and West Harbour ferry trips increased in the past year by 20% and 24% respectively.<br />
Reasons:<br />
• Subsidies from <strong>ARTA</strong> enabled the operators of these routes to purchase new ferries and increase services<br />
during weekdays.<br />
• Bus services feeding into ferry timetables were also promoted.<br />
Customer satisfaction<br />
Customer satisfaction with public transport has risen from 71% in 2005 to 84% in <strong>2009</strong>.<br />
Reasons:<br />
• Customer-driven. At every step of the journey by train, bus or ferry, we’ve focused on improving<br />
customers’ experience. Longer opening hours of the MAXX Contact Centre, real time information, more<br />
ticket retail outlets and customer awareness campaigns are just a few of the many customer-centric<br />
changes we’ve implemented. (See page 35 for more details).<br />
• The MAXX Contact Centre, run by the ARC, won three prizes at the ‘Contact Centre World’ Asia Pacific<br />
finals in June <strong>2009</strong>: second in the Best Contact Centre category, first in Contact Centre Recruitment<br />
Campaigns and runner up for the Best Contact Centre Leader. The Contact Centre was the only finalist<br />
from New Zealand.<br />
More <strong>Auckland</strong>ers used ‘free’, special-event public transport to attend concerts and sports events.<br />
• The sale of tickets to high-attendance sporting and cultural events at Eden Park, Mt Smart Stadium,<br />
Vector Arena and North Harbour Stadium inclusive of transport by rail and/or bus is proving highly<br />
successful. Integrated ticketing for the 2008 Bledisloe Cup at Eden Park got 36% more fans out of their<br />
cars than in the previous year. The Super 14 series in May <strong>2009</strong> saw 13% of fans use public transport.<br />
“Customer satisfaction with public transport has<br />
risen from 71% in 2005 to 84% in <strong>2009</strong>.”<br />
3
sustainable travel<br />
More <strong>Auckland</strong>ers of all generations used more sustainable travel options.<br />
• TravelWise programmes continued to actively promote more travel choices including cycling,<br />
walking and carpooling to workplaces and tertiary institutes. There are 6,492 fewer car trips<br />
to TravelWise schools and workplaces, well ahead of the regional goal to have 16,100 fewer car<br />
trips each morning peak by 2016. See page 44.<br />
• The TravelWise Schools programme, co-ordinated by <strong>ARTA</strong>, was co-winner in the “Outstanding<br />
Community Safety and/or Injury Prevention Initiative” category at the 2008 ACC Community<br />
Safety and Injury Prevention awards.<br />
4<br />
Bledisloe Cup <strong>2009</strong> – Rugby fans Celeste, Bruce and Louise<br />
take the bus to cheer on the All Blacks at Eden Park
Total mobility<br />
Providing <strong>Auckland</strong>ers, regardless of their level of mobility, with real transport options.<br />
• <strong>ARTA</strong> led the country in implementing new national standards for the Total Mobility programme, which<br />
helps <strong>Auckland</strong>ers with disabilities to meet the cost of travel.<br />
• The number of super-low-floor buses in the <strong>Auckland</strong> fleet grew to 650, of which 527 are<br />
wheelchair-accessible. 21 of <strong>Auckland</strong>’s 41 rail stations are now fully accessible, and <strong>ARTA</strong> has prepared<br />
new guidelines to promote best practice design for accessible bus stops.<br />
Looking ahead<br />
This year, <strong>ARTA</strong> finalised the <strong>2009</strong> <strong>Auckland</strong> <strong>Transport</strong> Plan, which prioritises and coordinates all transport<br />
aspirations in the region for the next 10 years. Within that time, the Rugby World Cup will be bringing up<br />
to 70,000 international visitors to <strong>Auckland</strong>. <strong>ARTA</strong>’s major event expert is already dedicated to Rugby World<br />
Cup transport planning (see page 20).<br />
In 30 years’ time, <strong>Auckland</strong>’s population is predicted to reach two million. Improving journey times and<br />
reliability by road, through completion of the strategic roading network and improved management of<br />
<strong>Auckland</strong>’s arterial roads, will remain vital to lifting the city’s economic performance. But it is impossible to<br />
build our way out of congestion by providing more road capacity.<br />
A world-class transport system will need to carry at least 200 million passenger transport trips a year<br />
between regional centres, at high frequencies and with reliable travel times.<br />
<strong>ARTA</strong>’s strategic goal is to double the use of public transport journeys by 2016. This year, we made significant<br />
progress with our programme of action to provide more effective, efficient and integrated transport links to<br />
key business, recreation and education locations. The programme includes:<br />
• new rail stations at Newmarket, New Lynn and Grafton (see page 23)<br />
• reopening the Onehunga branch line (see page 23)<br />
• real time information at bus stops, rail stations and ferry terminals (see page 38)<br />
• planning for the CBD underground rail tunnel (see page 24)<br />
• upgrading the Downtown Ferry Terminal and wharves (see page 25)<br />
• rail electrification (see page 24) and integrated smartcard ticketing (see page 37).<br />
5
Rabin Rabindran<br />
CHAIRMAN’S FOREWORD<br />
It is my pleasure to be able to report on a very good level of patronage growth for the 2008/09 year of 7.7%,<br />
or an additional 4.2 million journeys taken on public transport in the <strong>Auckland</strong> region against the previous<br />
year. A total of 58.6 million journeys were taken in total for the year. This is a very pleasing result.<br />
In the last year, rail carried more than seven and a half million passengers and there have been 1.5 million<br />
trips on the Northern Express bus service.<br />
This growth has been achieved in no small part through the sheer hard work and commitment of <strong>ARTA</strong> staff<br />
that I am very proud of. I believe anyone would be hard pressed to find a more passionate or better group<br />
of people focused on giving <strong>Auckland</strong>ers real transport options.<br />
My thanks extend to <strong>ARTA</strong>’s Chief Executive, Mr Fergus Gammie, in leading this team of talented people<br />
and to the operators of our buses, trains and ferries with whom we have a close working relationship and<br />
cannot do without.<br />
I would also like to thank my predecessor, Mr Mark Ford, who has now moved on to head up the <strong>Auckland</strong><br />
Transition Agency.<br />
Where there has been investment in public transport, from both the region and the Government, there<br />
has been growth. Where there is growth there is economic development and the creation of jobs. We are<br />
appreciative to our funders, the <strong>Auckland</strong> Regional Council (ARC), particularly its Chairman, Mr Michael<br />
Lee, the New Zealand <strong>Transport</strong> Agency (NZTA) and the Government for their support in making our<br />
achievements possible.<br />
I must however stress the importance of maintaining the momentum that has been achieved in the transport<br />
sector in <strong>Auckland</strong>. It is integral to the creation of <strong>Auckland</strong> as a world-class city in a tourism, living and<br />
economic sense.<br />
6
<strong>ARTA</strong> is training for the Rugby World Cup 2011:<br />
Bledisloe Cup crowds at Kingsland train station<br />
With the Rugby World Cup 2011 in mind, <strong>ARTA</strong> is focused on delivering an efficient public transport system.<br />
The World Cup will be the largest global sporting event for the year, and traffic and transport management<br />
will play a crucial role. We are up to these challenges and look forward to delivering a transport solution<br />
that not only <strong>Auckland</strong>ers can be proud of, but all New Zealanders.<br />
Other focuses for <strong>ARTA</strong> moving forward include progressing the development of a single multi-modal<br />
integrated ticket, a key enabler for encouraging more people to make public transport their choice.<br />
<strong>Auckland</strong>’s ticket will be the only ticket in the country to include rail, bus and ferry. Next year, two major<br />
transport hubs will also be opened in <strong>Auckland</strong> – Newmarket train station, the second biggest train station<br />
on the network, and in the west, New Lynn train station. Both train stations will usher in an era of modern<br />
integrated stations, the like of which have not been seen before in New Zealand since the opening of<br />
Britomart.<br />
The <strong>ARTA</strong> Board and I are committed to delivering as good a transport system as we possibly can. We are<br />
very proud of the achievements that have been made to date and look forward to the exciting projects in<br />
development coming to fruition to deliver transport solutions for the region.<br />
Rabin Rabindran<br />
Chairman<br />
<strong>Auckland</strong> Regional <strong>Transport</strong> Authority<br />
7
CEO’S FOREWORD<br />
2008/09 has been a year of great results. More people<br />
have caught buses, trains and ferries than in any year<br />
since the mid 1980s.<br />
When fuel prices spiked to the highest levels ever in<br />
late 2008, <strong>Auckland</strong>ers made good use of the options<br />
Fergus Gammie<br />
now available to them to get around the city and to<br />
keep the economy moving. Since fuel prices settled again, public transport patronage has kept<br />
growing, particularly on those parts of the network where <strong>ARTA</strong> has developed, improved or<br />
redesigned services.<br />
While <strong>ARTA</strong> is focused on the development of high-capacity reliable public transport on major<br />
routes, as is befitting the development of the region towards world-class status, <strong>ARTA</strong> was<br />
established in 2004 to plan, fund and develop a successful over-arching transport system for the<br />
region. That is the development of a mixed modal solution for <strong>Auckland</strong> which includes effective<br />
roading solutions for New Zealand’s most heavily populated city.<br />
An integrated transport system across the city is crucial both for economic reasons and for livability<br />
for residents.<br />
It is worthy of note that the greatest beneficiaries of increased public transport usage are road<br />
users. Increased public transport usage frees up the road for more efficient freight movements<br />
and faster journey times by private vehicles.<br />
In respect of its roading mandate, <strong>ARTA</strong> is a partner in developing major regional roading projects<br />
such as the <strong>Auckland</strong>-Manukau Eastern <strong>Transport</strong> Initiative (AMETI) and the next Waitemata<br />
Harbour crossing and a partner in the development of a regional strategic freight network which<br />
includes highways and major regional arterials<br />
<strong>ARTA</strong> has also produced the Regional Arterial Road Plan which identifies and prioritises the<br />
region’s arterial roads for improvement, sets out an action plan for how these roads should<br />
be used and improved to ensure people and goods flow safely and efficiently, and to ensure<br />
businesses and communities are properly connected.<br />
<strong>ARTA</strong> is solely responsible for producing the three-year Regional Land <strong>Transport</strong> Programme (RLTP)<br />
which includes the prioritisation of all roading activities in the region which receive a government<br />
8
<strong>ARTA</strong> is focused on delivering an integrated<br />
transport system across the city<br />
subsidy. This includes State highway improvements including all the Roads of National Significance in<br />
<strong>Auckland</strong>. The RLTP prioritises $4.4 billion worth of transport investment, 72% of which is for roading.<br />
<strong>ARTA</strong> has also recently produced the Regional Road Safety Plan which, when implemented, will make our roads<br />
safer for people to use. The current road toll in economic terms is costing the region more than congestion and<br />
is not measurable in terms of human pain and suffering.<br />
As we look forward to the creation of one <strong>Auckland</strong> Council, some of the organisational boundaries of the<br />
past will disappear, but the skills of working together to make it happen for customers will be as important<br />
as ever. The delivery of a world-class transport system for <strong>Auckland</strong> is too important to put on hold for<br />
restructuring; <strong>ARTA</strong> remains firmly focused on building the momentum as we work towards another year<br />
of record results.<br />
Such great results come from great teamwork. I am proud to lead a team of dedicated, hardworking<br />
<strong>Auckland</strong>ers from all over the world, who understand what is good about this city and what is needed to<br />
make it great.<br />
Fergus Gammie<br />
CEO<br />
<strong>Auckland</strong> Regional <strong>Transport</strong> Authority<br />
9
the royal commission<br />
on AUCKLAND governance<br />
Two years ago, a process began to restructure the way <strong>Auckland</strong> is governed. Concerns were growing that<br />
local government arrangements in <strong>Auckland</strong> were not meeting the challenges of urban growth. A ‘super<br />
city’ was proposed. How <strong>Auckland</strong>’s transport needs are best delivered has been widely debated as part<br />
of the proposed changes.<br />
October 2007<br />
A Royal Commission on <strong>Auckland</strong> Governance was established.<br />
March <strong>2009</strong><br />
The Commission released its report, which called for bold changes to regional<br />
governance in time for the October 2010 local government elections.<br />
The report recommended establishing a single, region-wide unitary authority, called<br />
the <strong>Auckland</strong> Council, to replace the ARC and existing city/district councils. The new<br />
Council would be a two-tier model, with one mayor and 23 councillors (including three<br />
Maori representatives) and six elected local councils. The proposed Council would have<br />
one long-term council community plan, one district plan and one rating system.<br />
A new Regional <strong>Transport</strong> Authority (RTA) would replace <strong>ARTA</strong>, and become<br />
a Council-controlled Organisation reporting to the <strong>Auckland</strong> Council. It would work<br />
in partnership with the NZ <strong>Transport</strong> Agency and ONTRACK and be responsible for<br />
regional transport and arterial roads.<br />
May <strong>2009</strong><br />
On 23 May, the Local Government (Tamaki Makaurau Reorganisation) Act <strong>2009</strong> was<br />
passed. An <strong>Auckland</strong> Transition Authority (ATA) was formed to affect the changes<br />
required in time for next year’s elections. The Authority’s Chair is former <strong>ARTA</strong> Chair<br />
and Watercare CEO Mark Ford.<br />
July-August <strong>2009</strong><br />
The ATA heard submissions from the public on proposed changes to<br />
regional governance.<br />
September <strong>2009</strong><br />
The ATA, in consultation with the Government, is due to finalise details of the regional<br />
governance reorganisation, including the new Regional <strong>Transport</strong> Authority structure.<br />
10
The historic Downtown Ferry Terminal: a long-time<br />
transport hub connecting the <strong>Auckland</strong> region<br />
11
OUR VISION –<br />
WHERE WE ARE HEADED<br />
A world-class transport system that makes<br />
<strong>Auckland</strong> an even better place to live, work<br />
and play.<br />
REGIONAL STRATEGIES – How we’re going to get there<br />
Growing <strong>Auckland</strong><br />
The transport system will support regional growth and economic development strategies by<br />
linking <strong>Auckland</strong>’s main urban centres with a fast, frequent and reliable Rapid Transit Network,<br />
comprising an electrified rail system and the Northern Busway.<br />
Moving <strong>Auckland</strong>ers<br />
One ticket will take you anywhere in <strong>Auckland</strong>, on a seamless network of bus, train and<br />
ferry services. <strong>Auckland</strong>ers will be in the habit of quickly checking the options for their trip before<br />
leaving home, and will be able to choose between a quality public transport service, safe walking<br />
and cycling routes, and predictable car journey times.<br />
Sustaining Communities<br />
<strong>Auckland</strong>ers will make safe, healthy and sustainable travel choices. People who do not have<br />
access to a car will still have access to employment, education, health, commercial and<br />
recreational opportunities.<br />
12
OUR VALUES – The principles that define how we work<br />
OPEN<br />
Being honest, respectful and transparent,<br />
and communicating clearly.<br />
RESPONSIVE<br />
Being committed to delivering customer<br />
and community needs.<br />
FOCUSED<br />
Getting the right results at the right time;<br />
real and simple.<br />
COLLABORATIVE<br />
Working together in partnership,<br />
recognising and sharing success.<br />
VISIONARY<br />
Inspiring creativity and innovation<br />
through forward-looking leadership.<br />
Moving <strong>Auckland</strong>ers – the Northern Busway is a star<br />
in <strong>Auckland</strong>’s developing public transport system<br />
13
“Improvements to services and<br />
changes to fares have resulted<br />
in significant growth in the<br />
past year.”<br />
14<br />
Mission Bay: travel by Metrolink or<br />
bike on the dedicated cycleways
CONTINUOUS<br />
IMPROVEMENT TO SERVICES<br />
This year, 58.6 million trips were taken on <strong>Auckland</strong>’s buses, trains and ferries – an increase of<br />
7.7%, and the highest public transport patronage since 1985.<br />
Outcome Performance Measure 07/08 Result 08/09 Target 08/09 Result<br />
Total PT patronage growth<br />
Total PT patronage<br />
increases by 1.7%<br />
54,405,000 55,318,000 58,621,000<br />
7.7%<br />
Improvements to bus services drive growth<br />
Bus travel accounts for almost three-quarters of all public transport patronage. There has been an<br />
important shift in the nature of public transport patronage growth in the past year. Growth in the<br />
Rapid <strong>Transport</strong> Network (comprising the Northern Express bus service and the rail system) remains<br />
important but for the first time in several years bus patronage dominates overall growth.<br />
PT growth 2008/09<br />
PT growth 2007/08<br />
0 2,000,000 4,000,000<br />
Northern Express Rail All other bus services<br />
Improvements to services and changes to fares have resulted in significant growth in the<br />
past year. Patronage on the Northern Express increased 55.8%. Patronage of other services using<br />
the busway also grew. Travel on the Hibiscus Coast Express was up 27%.<br />
Service improvements boosted travel on bus services other than the Northern Express by 9.1%.<br />
Other services that experienced double digit growth were Mt Eden Road (up 56%), Routes 008<br />
and 009 to Sylvia Park (up 31%), Airbus Express (up 13.5%), the redesigned 680 and 681 Botany to<br />
CBD routes (up 47%) and redesigned routes within Botany, Howick and Manukau (up 15% within<br />
the first two months).<br />
15
Northern Express reaches capacity in one year<br />
The Northern Express has proved so popular that additional peak capacity was added in both October<br />
2008 and March <strong>2009</strong>, taking the frequency to every three minutes, with 88 buses using the busway in the<br />
morning peak.<br />
In order to manage demand, <strong>ARTA</strong> held a special promotion in March, with MAXX ambassadors at stations<br />
drawing busway customers’ attention to alternative options. Improvements to feeder services have also<br />
helped to increase patronage.<br />
The 8.4km Northern Busway along the Northern Motorway corridor – the first road in New Zealand purposebuilt<br />
for buses – has won several awards in the past year. The first stage won the Shell Bitumen Excellence<br />
Award for a Major Roading Project and the Roading New Zealand Supreme Award. The completed busway<br />
won the Construction Projects over $2 million at the Ingenium Excellence Awards.<br />
RESULT: The Northern Express carried 1.5 million customers, which is 55.8% more than<br />
the year before, and a 138% growth in two years.<br />
Botany gets better services<br />
Howick & Eastern Buses operates extensive timetabled services from the south-east to the <strong>Auckland</strong> city<br />
centre, Manukau city centre and Manurewa.<br />
<strong>ARTA</strong> and the bus company carried out extensive consultation throughout Manukau City, which resulted<br />
in simplified routes and the introduction of new Botany local and Manukau Crosstown services. The new<br />
network came into being in February <strong>2009</strong> and has 11 routes instead of the previous 20, making it easier<br />
to understand. It has improved connections to rail and local destinations including Manukau Institute of<br />
Technology, Botany Town Centre and the Highbrook employment area.<br />
The redesigned Botany to CBD routes 680 and 681 replaced Route 68.<br />
RESULT: 60% growth in bus patronage in Howick/Botany for a 1.4% higher subsidy.<br />
“I often go into Botany Town Centre to do my shopping and I like<br />
to sit and relax and look at the roads and different places along<br />
the way. When you’re driving you don’t see the surroundings so<br />
it’s lovely to be driven.” Shirley Rankin from Mission Heights.<br />
16
Service to the airport expanded<br />
In June 2008, the hard-to-miss, bright blue Airbus Express commenced a simpler route with lower fares and<br />
improved frequency from <strong>Auckland</strong> city.<br />
From September, passengers headed to the airport from the North Shore could buy an integrated ticket<br />
linking the Northern Express to the Airbus Express at Britomart.<br />
An airport to Manukau service, the ‘380 Manukau Airporter’ linking to train connections, began in October.<br />
RESULT: Patronage on the Airbus Express service has increased by 13.5%.<br />
Redesign of West <strong>Auckland</strong>, South-west Rodney and Western Bays<br />
A preliminary redesign of the local and key corridor bus service network was completed in November 2008,<br />
with Waitakere City Council and local operators. The redesign is intended to create a local, comprehensive,<br />
legible bus network that’s integrated with the rail network. A similar redesign of bus services in Western<br />
Bays went out for public consultation early in <strong>2009</strong>, following discussions with <strong>Auckland</strong> City Council<br />
and operators.<br />
Review of poor performing services<br />
<strong>ARTA</strong> has put in place a twice-yearly programme and system for regular review of patronage on existing<br />
services, with the aim of rationalising those that are underperforming.<br />
The review process is triggered by minimum patronage levels at peak and off-peak times.<br />
In the first review, 10 services were identified as having low patronage. The first set of proposed<br />
rationalisations was consulted on during March and April and changes implemented in June <strong>2009</strong>.<br />
Working in partnership: Andrew Ritchie (Director, Ritchies <strong>Transport</strong>)<br />
with Mark Lambert (General Manager, Customer Services, <strong>ARTA</strong>)<br />
17
Improvements to train services<br />
Rail continues to make an important contribution to overall patronage growth, up 12.6% on last year. More<br />
than half of this growth was on the Western Line, where 15-minute services were introduced in peak times<br />
from July 2008, due to double tracking work and more carriages. Southern Line services have also increased<br />
to 10-minute peak frequencies.<br />
The rail service contract with Veolia has been extended to 2014.<br />
RESULT: 15-minute services were introduced on the Western Line from July 2008.<br />
Improvements to ferry services<br />
Ferry patronage has been in decline the past two years, largely due to fare increases on some routes. This<br />
decline has been halted by increases to Gulf Harbour services and by promotion of free travel for SuperGold<br />
Card holders. Additional evening services to and from Devonport were also added by Fullers last year.<br />
Additional services from Half Moon Bay were considered but were not affordable within the current budget.<br />
Pine Harbour and West Harbour<br />
Residents on the outer reaches of the Waitemata Harbour have the best of both worlds: tranquility and<br />
ease of travel into the city. The ferry services run by Pine Harbour and Belaire ferries take about 35 minutes.<br />
<strong>ARTA</strong> subsidises these services, which has enabled both companies to buy an additional ferry in the past<br />
year and increase the number of weekday trips.<br />
RESULT: In the past year, 20% more trips taken between Pine Harbour and <strong>Auckland</strong>,<br />
and 24% more trips between West Harbour and <strong>Auckland</strong>.<br />
“For me to drive in rush hour would take an<br />
hour at least. The ferry journey takes 32 minutes<br />
give or take. I’ve made friends, it’s a little social<br />
club really, it’s very enjoyable, very relaxing.”<br />
Jon Huxley from Beachlands.<br />
18
Reliable services drive growth<br />
<strong>ARTA</strong>’s Statement of Intent sets targets for the percentage of services on the Rapid Transit Network that are<br />
reliable and punctual (see performance measures on page 57). Service reliability is a key factor in growing<br />
patronage on the network.<br />
The Western Line has lower targets than the Southern/Eastern lines because of continued double tracking<br />
work. The ongoing rail upgrade programme, including new stations at Newmarket and New Lynn, will<br />
continue to affect the reliability of services until the work is complete. Other issues such as signalling and<br />
points failures, train mechanical faults and accidents have undermined reliability of train services, particularly<br />
in June <strong>2009</strong>.<br />
Despite this, delays due to infrastructure faults fell by May <strong>2009</strong> to their lowest level in three years and the<br />
proportion of services arriving on time or within five minutes of schedule remains above the targets set in<br />
<strong>ARTA</strong>’s Statement of Intent.<br />
The Northern Express provides an exceptionally reliable service, with 98.6% of buses arriving early or within<br />
five minutes of schedule.<br />
RAIL SERVICES OPERATING ON TIME (within 5 minutes of schedule)<br />
100%<br />
95%<br />
90%<br />
Proportion on time<br />
85%<br />
80%<br />
75%<br />
70%<br />
65%<br />
60%<br />
55%<br />
50%<br />
Jul Aug Sept Oct Nov Dec Jan Feb Mar Apr May Jun<br />
Month<br />
On time 2008-09<br />
19
Case study – Rugby World Cup<br />
With up to 70,000 international visitors coming to <strong>Auckland</strong> for the Rugby World Cup in 2011, and four<br />
billion television viewers, this event is the city’s greatest opportunity to shine.<br />
Success requires a team effort and <strong>ARTA</strong>’s position in the squad (otherwise known as the regional steering<br />
group) is to deliver on public transport and traffic needs.<br />
Most of our visitors will be expecting to use a seamless public transport system from the airport, to Eden<br />
Park matches and for sightseeing around the city. We have three main projects to finalise before then:<br />
designing plans for traffic and transport operators, introducing integrated ticketing for all public transport,<br />
and upgrading Kingsland rail station.<br />
In 2008, <strong>ARTA</strong> hired a super event expert, Bruce Barnard, to develop and deliver the detailed transport and<br />
traffic plan for the region. Fresh from similar jobs in Melbourne during both the 2006 Commonwealth Games<br />
and the 2007 World Swimming Championships, Bruce is aiming for a twin legacy in <strong>Auckland</strong>: to prove that<br />
the city is capable of staging major events and to make planning for such events easier in future.<br />
When the ref’s final whistle blows at the Rugby World Cup, 60,000 fans will be on the move. Bruce’s<br />
transport plan has a train carrying 1,000 passengers departing Kingsland Station every five minutes for 75<br />
minutes, while Morningside will cater for up to 1,500 fans. $5 million is being spent on Kingsland Station to<br />
widen and lengthen both platforms, and improve access to the northern platform by building a pedestrian<br />
underpass and extra stairs over the railway tracks.<br />
<strong>ARTA</strong>’s goal is to get at least 75% of ticket-holders to the nine matches at Eden Park by means other than<br />
private cars, freeing up our roads for diverse economic activity. That goal includes locals, not just international<br />
visitors. In 2007, only 2% of fans used public transport, taxis or walked. This year, 36% left their cars at home<br />
for the Bledisloe Cup match. Special event services provided free with match tickets have been a great incentive<br />
and will continue to be offered for major sporting and other cultural events through to the World Cup final.<br />
Bruce Barnard,<br />
Super event expert<br />
Kingsland Station<br />
20
“<strong>ARTA</strong>’s goal is to get at least 75% of ticketholders<br />
to the nine matches at Eden Park<br />
by means other than private cars, freeing up<br />
our roads for diverse economic activity.”<br />
Rugby World Cup 2011 is the largest<br />
global sporting event of 2011<br />
21
”Over the past five years, 21<br />
of the 41 rail stations on<br />
the <strong>Auckland</strong> network have<br />
been upgraded.”<br />
22<br />
Redeveloping Newmarket train station, the<br />
second busiest station on <strong>Auckland</strong>’s rail network
Developing <strong>Auckland</strong>’s<br />
transport infrastructure<br />
Target 07/08 08/09 Target 08/09 Result<br />
% of RTN customers<br />
rating stops/stations<br />
and vehicles as good,<br />
very good or excellent<br />
is improved despite<br />
major construction<br />
works<br />
82% stops and stations<br />
93% vehicles<br />
83% stops and stations<br />
94% vehicles<br />
90% stops and stations<br />
94% vehicles<br />
Train stations – new and upgraded<br />
Eight new stations are in various stages of planning and construction.<br />
• New Lynn and Newmarket (see page 26) to replace the old stations. The final detailed design<br />
for the New Lynn rail station and bus interchange is complete and cost estimates are under<br />
way.<br />
• A detailed design for a completely new station (called Grafton Station) serving <strong>Auckland</strong><br />
and AUT universities and <strong>Auckland</strong> Hospital, is complete. KiwiRail is doing piling and bridge<br />
works on site.<br />
• Locations of stations on the soon-to-be reopened Onehunga Line at Penrose, Mt Smart,<br />
Te Papapa and Onehunga were approved in October 2008. The detailed designs for Te Papapa<br />
and Penrose were completed in July <strong>2009</strong>, and the Onehunga design is progressing well.<br />
• The location of the Manukau Station has been agreed and the concept design is substantially<br />
complete. KiwiRail is undertaking piling work on the rail trench walls over winter, followed by<br />
excavation of the piled walls over summer.<br />
23
Two further stations are likely to result from planning for a CBD underground rail tunnel. The underground<br />
loop is projected to run from Britomart under Albert Street and come out on the Western Line in Mt Eden.<br />
The two new stations may be at Aotea Square and K’Road. This project was initiated by <strong>ARTA</strong>, and we<br />
are now supporting KiwiRail over the next 18 months to identify and protect the route. KiwiRail has the<br />
authority to designate changes to the District Plan that will protect the route on maps until funding is<br />
available to construct it.<br />
Over the past five years, 21 of the 41 rail stations on the <strong>Auckland</strong> network have been upgraded. In<br />
preparation for the Rugby World Cup, both Morningside and Kingsland stations are being upgraded.<br />
Detailed design of the pedestrian underpass at Kingsland Station started in June <strong>2009</strong>. The upgrade of<br />
station facilities at Morningside was completed in June. For more details on RWC preparations, see the case<br />
study on page 20.<br />
This coming year, <strong>ARTA</strong> will also begin working with KiwiRail to protect the rail route to the airport.<br />
Detailed design is also under way for Avondale Station’s upgrade and the outlined plan of works has been<br />
submitted to the <strong>Auckland</strong> City Council.<br />
Changes to THE rail electrification project<br />
<strong>Auckland</strong> has great potential to move more people and freight on its under-utilised rail corridors.<br />
The efficiency of an electrified system will enable <strong>ARTA</strong> to maximise the infrastructure that is already in<br />
place. Electric trains are not only faster and cleaner, they are quieter and cheaper to run than diesel ones.<br />
In December 2008, <strong>ARTA</strong> called for Expressions of Interest (EOI) for the supply of a new fleet of 140 electric<br />
trains for <strong>Auckland</strong>. The EOI process closed in February and four potential suppliers were short listed.<br />
In March <strong>2009</strong>, the Government cancelled plans to introduce a regional fuel tax, part of which was intended<br />
to pay for the trains. It gave an undertaking instead to pay for the $1 billion project and add the trains to<br />
KiwiRail’s fleet. The formal tender process, scheduled for May, has been delayed.<br />
24<br />
Electrification – 2013: the next step<br />
for <strong>Auckland</strong>’s rail network
Case study: PROGRESS ON FERRIES<br />
The Downtown Ferry Terminal is the hub of the <strong>Auckland</strong> region’s passenger ferry services. The terminal was<br />
built on top of wharves that are over 100 years old. Although the population of <strong>Auckland</strong> was quadrupling<br />
at the turn of the last century, there were still only about 180,000 residents. Wharf designers could not have<br />
foreseen a city in which over 4.4 million journeys each year would be taken by ferry.<br />
The undersides of these historic piers have become corroded by a combination of environmental toxins such<br />
as chlorides and sewage leaks, structural overloads and through design and construction flaws. The piers<br />
now require substantial repairs to their structural fabric. These repairs are necessary to maintain them in a<br />
safe condition and extend their working life.<br />
<strong>ARTA</strong> took over responsibility for the Downtown Ferry Terminal infrastructure in October 2007. We had a<br />
choice of making patch repairs to the wooden and concrete sub-structures, which would last for only about<br />
five years, or funding more substantial partial rebuilds. The latter option would last over 20 years.<br />
When work began on Piers 1 and 2, the extent of the damage was greater than anticipated. More funds<br />
were required. These were approved by the NZ <strong>Transport</strong> Agency and work is going ahead in three stages,<br />
through to mid-2010. Less urgent renewal works are also being carried out to the underside of the pedestrian<br />
promenade between Pier 2 and Princes Wharf. Tenders have been received for the design of renewals to<br />
Piers 3 and 4.<br />
Several improvements to passenger facilities at the Downtown Ferry Terminal were also completed last year,<br />
including a glass wall enclosure and ports operations office on Pier 1, a canopy on Pier 2 and construction<br />
of a link bridge between the two piers.<br />
Improvements were also made to the Half Moon Bay and Gulf Harbour passenger facilities.<br />
Restoring <strong>Auckland</strong>’s historic ferry wharves<br />
25
Case study – A new station for Newmarket<br />
Newmarket has a thriving retail and commercial heart. Its rail station is the city’s second busiest after<br />
Britomart and a key junction in <strong>Auckland</strong>’s rail network. As rail patronage increased rapidly, keeping<br />
the trains running smoothly through this junction became a challenge because the track layout created<br />
a bottleneck. A major redesign was required.<br />
The station closed in January 2008 to allow for both track realignment and construction of a large, modern<br />
station that will reconnect to the heart of Newmarket’s CBD.<br />
The new station design includes an entranceway on Remuera Road that serves as a focal point to attract<br />
commuters. It leads to a glass-surrounded link bridge that transports commuters to a high-roofed atriumlike<br />
main station concourse, which is covered by a ‘floating roof canopy’, supported on elegant columns.<br />
Commuters will access the two island platforms by lifts, stairs or escalators. There will be shelter, seating,<br />
lighting and signage along the entire 180 metre length of the platform.<br />
The two-year rebuild is exciting and challenging, requiring major works in a tightly confined and<br />
busy space. Work began in earnest on 20 August 2008. By Christmas, the first milestone was reached.<br />
Crews worked night and day for three weeks over the holiday period, relaying tracks and the foundations<br />
for the new Remuera Bridge. They continued work on the main concourse, the pedestrian link bridge and<br />
the Remuera Road entrance.<br />
Since then, work has progressed ahead of schedule. The eastern side has taken shape and the station’s high roof<br />
steel work has been erected. The northern side of the Remuera Road Bridge has been demolished to allow for<br />
new bridge piling. During the rebuild, passengers are using temporary stations at Newmarket West and South.<br />
The 1908 station will be relocated, possibly to Parnell as a working heritage gateway to the <strong>Auckland</strong> Museum.<br />
Fast facts:<br />
• Cost: $48 million<br />
• Partners: KiwiRail, <strong>Auckland</strong> City Council, <strong>ARTA</strong>,<br />
ARC, Newmarket Business Association<br />
• Design: Opus International Consultants<br />
• Construction: Hawkins Construction.<br />
Work carried out by KiwiRail over Christmas/New Year:<br />
» 5km of track lifted and over 7km of new track laid<br />
» More than 600 people worked around the clock<br />
» More than 50 excavators and 100 trucks were on site<br />
» Over 50,000m 3 of dirt were excavated out of the<br />
rail corridors in less than a week<br />
» 10,000m 3 of ballast were put back in<br />
» 10,000 sleepers were laid.<br />
26
Revitalising Newmarket train<br />
station: design concepts<br />
27
Bus infrastructure<br />
Central Connector work continues<br />
The Central Connector busway will provide quicker, more efficient travel between the CBD and Newmarket<br />
via key locations such as <strong>Auckland</strong> Hospital and The University of <strong>Auckland</strong>. It is crucial to linking into the<br />
Northern Busway at Britomart and connecting future bus improvement projects on Great South, Manukau<br />
and Remuera roads. It will also complement the rail network by providing a travel option to Britomart and<br />
Newmarket stations.<br />
Improved cycle and pedestrian facilities are also part of the project, which began in April 2008. An estimated<br />
2,600 bus journeys, and 65,000 passengers are expected to use the route between Newmarket and the CBD<br />
each weekday.<br />
The connector includes:<br />
• dedicated 24-hour bus lanes with safe cycle passing<br />
• new bus stops at key locations<br />
• improved traffic signals and new pedestrian crossings<br />
• improved street lighting<br />
• new and improved bus shelters and bike stands.<br />
Grafton Bridge was closed to vehicles in October 2008 to allow for strengthening work. Construction is<br />
under way in Park Road between Grafton Bridge and Khyber Pass Road, and Symonds Street between<br />
Karangahape Road and Waterloo Quadrant. The Park Road stage of the project is due to be completed in<br />
September <strong>2009</strong>.<br />
Progress on AMETI<br />
The <strong>Auckland</strong>-Manukau Eastern <strong>Transport</strong> Initiative (AMETI) aims to emulate the success of the Northern<br />
Busway, by creating a rapid transport corridor from Botany through Pakuranga to Panmure, linking up to<br />
the rail station at Panmure. <strong>ARTA</strong> is working with local councils to designate the extra land required for the<br />
route, and on road designs.<br />
Plans to extend the Northern Busway<br />
Long-term plans for the Northern Busway are to extend it north in two stages. The first stage is from<br />
Constellation to Albany; the second stage is from Albany to Silverdale. <strong>ARTA</strong> is working with the NZ <strong>Transport</strong><br />
Agency on land designation and protection until funds are available for construction.<br />
28
The Northern Busway: A North Star bus service flies past<br />
cars on a congested motorway during morning peak<br />
29
An integrated approach to transport<br />
Growth and economic challenges<br />
By 2036, <strong>Auckland</strong>’s population will swell to two million. This projected growth is one of two key drivers<br />
underlying the need for an integrated approach to transport planning in the region – one that encompasses<br />
State highways, arterial and local roads as well as public transport solutions.<br />
The second key driver is economic. We need to support and strengthen the transport links between<br />
<strong>Auckland</strong> and neighbouring regions with which we have close economic ties. By 2036, the gross domestic<br />
product (GDP) of <strong>Auckland</strong>, Northland, Waikato and the Bay of Plenty is expected to generate 60% of the<br />
country’s GDP.<br />
Finishing the work already under way on <strong>Auckland</strong> region’s State highways – such as the Western Ring Route<br />
and replacing Newmarket Viaduct – will provide a complete alternative route from south to north that<br />
bypasses central <strong>Auckland</strong> and greater capacity within the region. Together with a better integrated public<br />
transport network, this State highway work frees up our congested arterial and local roads for freight,<br />
commercial and other trips that cannot be made by public transport.<br />
The regional arterial road network plays an important role in distributing goods and services within the<br />
region. While comprising only 4% of the length of the total roading network it carries 18% of all freight and<br />
commercial journeys, and almost half of all bus trips and 15% of all peak-hour travel.<br />
Plans to prioritise solutions<br />
<strong>ARTA</strong> completed work on three integrated transport planning documents this year: the <strong>Auckland</strong> <strong>Transport</strong><br />
Plan (ATP), the Regional Land <strong>Transport</strong> Programme (RLTP) and the Regional Arterial Road Plan (RARP).<br />
The ATP, released in June <strong>2009</strong>, is a multi-mode, multi-billion dollar ‘big picture’ plan, setting out around<br />
$16 billion of work over the next ten years.<br />
The RLTP, also released in June, prioritises over 950 projects worth $4.36 billion over the next three years,<br />
compared to only around 300 projects in previous plans. For the first time, this detailed programme of action<br />
includes State highways, as a result of legislative changes. <strong>ARTA</strong> is involved with State highway projects but<br />
does not manage them.<br />
30
“The projected cost of upgrading<br />
the regional arterial network is<br />
around $4 billion.”<br />
Dominion Road, Balmoral: Higher use of public<br />
transport eases congestion for road users<br />
31
The RARP, released in February <strong>2009</strong>, defines the role of regional arterial roads, provides a framework for<br />
the integrated management of these roads and provides a robust basis for prioritising projects. Regional<br />
arterial road maintenance forms an important part of <strong>ARTA</strong>’s role.<br />
The ARLTS defines regional arterial roads as those that: “link districts or urban areas within the region and<br />
connect regionally significant facilities”, and those which “link the region to other regions or connect to<br />
strategic facilities such as the port or airport”. This definition and a set of principles were used to determine<br />
which roads are regional arterials.<br />
The projected cost of upgrading the regional arterial network is around $4 billion. This reflects the high cost<br />
of road widening.<br />
Key projects<br />
These three plans identify the following as key roading projects to integrate <strong>Auckland</strong>’s transport systems:<br />
• the multi-modal <strong>Auckland</strong>-Manukau Eastern <strong>Transport</strong> Initiative (AMETI)<br />
• completion of the Western Ring Route, connecting State Highway 1 from Manukau through Waterview<br />
and Hobsonville to Albany, as a complete alternative route from south to north<br />
• replacing Newmarket Viaduct with a new structure that will add a fourth southbound lane on the<br />
motorway between Gillies Avenue and Greenlane<br />
• construction of a northbound tunnel beneath Victoria Park to increase the capacity of the Northern<br />
Motorway between the <strong>Auckland</strong> Harbour Bridge and Wellington Street<br />
• an additional Waitemata Harbour crossing<br />
• construction of Penlink to the Whangaparaoa Peninsula<br />
• New Lynn local roads to integrate with the new transport interchange and Manurao road-rail overbridge<br />
to accommodate town centre redevelopment<br />
• 12 arterial roads in the <strong>Auckland</strong> region, on stretches of: Great North and Great South roads,<br />
Ti Rakau Drive, Lincoln Road, Neilson/Church streets, South-Eastern, Ellerslie Panmure and Albany<br />
highways; and Redoubt/Mill roads.<br />
Highway construction work is already under way on the Newmarket Viaduct, the Hobsonville deviation, the<br />
Manukau Harbour crossing and the State Highway 20 to State Highway 1 connection.<br />
32
how customers give<br />
feedback on their journey<br />
satisfaction, e.g. branded<br />
customer research, and<br />
participate in consultation on<br />
new projects and changes<br />
how customers plan<br />
their journey(s), e.g. via<br />
a branded website or a<br />
branded timetable<br />
what the customer’s<br />
experience is like, e.g.<br />
branded information<br />
about where to<br />
disembark<br />
Feedback<br />
Plan<br />
how customers start<br />
their journey, e.g. drive<br />
to station, park and<br />
ride, bus/train,<br />
walk, cycle<br />
Disembark<br />
Get<br />
AUCKLAND<br />
what the<br />
customer’s connection<br />
experience is like,<br />
e.g. simplicity of<br />
changing modes<br />
Connect<br />
PUBLIC<br />
TRANSPORT<br />
Buy<br />
how customers<br />
purchase their<br />
ticket(s) and<br />
how the ticket<br />
looks – branded<br />
value<br />
Travel<br />
Wait<br />
what the customer’s<br />
travel experience is like,<br />
e.g. cleanliness of branded<br />
vehicle, quality of<br />
ride, reliability, frequency<br />
Board<br />
what the customer’s<br />
boarding experience is like,<br />
e.g. branded information<br />
about how to board<br />
what the<br />
customer’s wait<br />
experience is like, e.g.<br />
branded directional and<br />
timetable information<br />
at station, safety and<br />
shelter from weather<br />
at station<br />
“This year, 84% of customers rated the<br />
public transport network as good, very<br />
good or excellent.”<br />
34
A CUSTOMER-CENTRIC APPROACH<br />
Customer satisfaction with the public transport network has risen from 71% to 84% in five years.<br />
<strong>ARTA</strong> and its service operators are focusing on placing the customer at the centre of the public transport<br />
journey. At every stage from planning a journey through to disembarking we listen and continue to listen<br />
to what customers want.<br />
Passengers have had to exercise more patience while the infrastructure for a more efficient network is<br />
being constructed. Despite the ongoing work, our surveys show a steady increase in satisfaction with the<br />
public transport network.<br />
In the year to May <strong>2009</strong>, 84% of customers rated the network as good, very good or excellent.<br />
Ferries were rated positively by 91% of survey respondents, trains by 82% and buses by 81% of respondents.<br />
Britomart <strong>Transport</strong> Centre: Catch the bus, train<br />
or ferry from <strong>Auckland</strong>’s main transport hub<br />
35
• Visits to the maxx.co.nz interactive journey planning website have seen<br />
a significant increase, with a peak of over 746,267 in March <strong>2009</strong>. The<br />
how customers plan<br />
their journey(s), e.g. via<br />
a branded website or a<br />
branded timetable<br />
journey planner has been promoted through a number of channels.<br />
• Opening hours of the Contact Centre were extended this year on both<br />
weekdays and weekends.<br />
Plan<br />
• MAXX is the regional public transport brand for <strong>Auckland</strong>. This year,<br />
the brand has expanded to produce MAXX News, bringing customers<br />
quarterly updates on improvements to bus, train and ferry services,<br />
travel tips, competitions, contact information and reminders about<br />
discount fares and public consultation on our plans.<br />
• Train timetables have been improved and bus routes simplified,<br />
following customer consultation.<br />
• We have ensured good communications about major infrastructure<br />
works requiring bus relocations and route diversion – on buses,<br />
posters, NZ Herald, suburban media, bus stops, websites and by<br />
having MAXX ambassadors on hand to redirect customers.<br />
36
• A link bridge was constructed between Piers 1 and 2 at the<br />
Downtown Ferry Terminal and opened in January <strong>2009</strong>.<br />
how customers start<br />
their journey, e.g. drive<br />
to station, park and<br />
ride, bus/train,<br />
walk, cycle<br />
Get<br />
• There are now over 80 retail outlets authorised to sell student<br />
discounted tickets.<br />
how customers<br />
purchase their<br />
ticket(s) and<br />
how the ticket<br />
looks – branded<br />
value<br />
Buy<br />
• There are five new Star Mart ticket agencies in the central city,<br />
and the Britomart ticket office has extended its opening hours.<br />
• Planning for an integrated smartcard ticket across the network is in<br />
progress. With integrated smartcard ticketing, customers will require<br />
only one ticket to use the range of bus, train and ferry options in the<br />
region. Electronic smartcard tickets will make it faster for passengers to<br />
get on and off.<br />
37
• The installation of 150 ‘Type 1’ real time passenger information units<br />
at high-use bus stops across the region is complete. Two prototype<br />
what the customer’s wait<br />
experience is like, e.g.<br />
branded directional and<br />
timetable information<br />
at station, safety and<br />
shelter from weather<br />
at station<br />
Wait<br />
CHS Metro-i real time, solar powered information signs were trialled<br />
at lower use bus stops and proved successful. The next step is to<br />
install up to 200 of these units throughout the region.<br />
• Plans for a multi-modal system to provide real time information<br />
at rail stations and ferry terminals are well under way.<br />
Tenders were called from suppliers of systems and equipment, the<br />
funding and approval to proceed was granted in May, and <strong>ARTA</strong> is<br />
reviewing the proposals with the Greater Wellington Council (to<br />
leverage off their similar project) with the expectation of purchasing a<br />
system in October. Real time displays will start rolling out in November,<br />
firstly at Britomart then throughout the network in 2010.<br />
• This year, PA announcements at train stations have been enhanced.<br />
During disruptions a dedicated disruption response team has been<br />
based at Britomart. We have also increased the provision of public<br />
announcement and on-board staff to inform customers about planned<br />
disruptions and engineering works.<br />
• Waiting times across the network have decreased due to an increase in<br />
scheduled services.<br />
• At bus stops, customers can text their bus number, located on the pole,<br />
to 3666 and find out when the next bus is due.<br />
• Improved safety signage has been installed on all trains. There are<br />
additional signs in carriages plus black and yellow bands on the interior<br />
and exterior of door edges to prevent passengers getting their arms<br />
caught in closing doors.<br />
• In late 2008, improvements to waiting facilities for up to 20 passengers<br />
at Half Moon Bay, in the form of a boardwalk canopy and shelter, have<br />
provided much needed protection from wind and rain.<br />
• At the Downtown Ferry Terminal a new canopy and glass wall provide<br />
similar shelter.<br />
• 21 out of 41 rail stations have been upgraded in the past five years.<br />
38
• Ritchies and NZ Bus have made a major investment in ongoing driver<br />
training programmes and vehicle safety to ensure their network delivers<br />
what the customer’s<br />
experience is like, e.g.<br />
branded information<br />
about how to<br />
board and where<br />
to get off<br />
Board<br />
& Disembark<br />
reliable, convenient and comfortable transport for customers.<br />
• The MAXX brand is being added to the exterior of all buses on the<br />
<strong>Auckland</strong> network, as buses are refurbished and replaced.<br />
• The new super-low-floor Euro 4 Manukau to airport buses have<br />
reflective lettering for night visibility.<br />
• Punctuality of rail services across all three lines averaged 86%.<br />
what the customer’s<br />
travel experience is like,<br />
e.g. cleanliness of branded<br />
vehicle, quality of<br />
ride, reliability,<br />
frequency<br />
Travel<br />
• 94% of Rapid Transit Network passengers rated vehicles as good, very<br />
good or excellent.<br />
• New Waka Pacific branded buses were introduced in Counties Manukau<br />
by NZ Bus to reflect the multi-cultural nature of the community.<br />
• New ferries are running on the Pine Harbour and West Harbour routes,<br />
as a result of increased subsidies from <strong>ARTA</strong> to operators Pine Harbour<br />
and Belaire.<br />
• The number of on-board staff and ticket collectors on trains has<br />
been increased.<br />
• Six additional carriages have been refurbished, with new carpet,<br />
seating and upgraded air conditioning. Remanufacturing of another<br />
20 carriage bodies is in progress.<br />
39
• Veolia and <strong>ARTA</strong> are conducting regular ‘Meet our Managers’ sessions<br />
with customers (see opposite page).<br />
how customers give<br />
feedback on their journey<br />
satisfaction, e.g. branded<br />
customer research, and<br />
participate in consultation<br />
on new projects and<br />
changes<br />
Feedback<br />
• A centralised customer feedback management system has been rolled<br />
out for all bus and rail operators, making it more efficient for <strong>ARTA</strong> to<br />
synthesise feedback into ongoing marketing campaigns.<br />
• The new 380 service from Manukau to <strong>Auckland</strong> Airport links with<br />
rail connections.<br />
what the<br />
customer’s<br />
connection<br />
experience is like,<br />
e.g. simplicity of<br />
changing modes<br />
Connect<br />
• Passengers headed to the airport from the North Shore can purchase<br />
an integrated ticket linking the Northern Express to the Airbus Express<br />
at Britomart.<br />
• The downtown Airbus Express stop at Britomart has been moved closer<br />
to the Downtown Ferry Terminal to link with ferry services.<br />
• Feeder bus services have increased that connect to ferry timetables and<br />
to the Northern Express.<br />
<strong>ARTA</strong> works in partnership with the following rail, bus and ferry operators.<br />
Trains:<br />
Veolia <strong>Transport</strong><br />
Buses:<br />
NZ Bus (Metrolink, North Star, GO WEST, Waka Pacific), Airbus Express, Howick & Eastern<br />
Buses, Ritchies (Northern Express), Urban Express, Tranzit, Birkenhead <strong>Transport</strong>.<br />
Ferries:<br />
Fullers, 360 Discovery, Pine Harbour Ferries, Belaire Ferries.<br />
40
Case study: Meet Our Managers<br />
<strong>ARTA</strong> contracts Veolia <strong>Transport</strong> to operate passenger rail services in <strong>Auckland</strong>. The customer is king for<br />
both organisations and, to prove it, key managers headed out to a number of train stations in the region<br />
during October 2008 and again in March/April <strong>2009</strong> to hear exactly what matters most to customers about<br />
the city’s train services.<br />
During the first set of sessions, we listened to over 250 rail passengers’ feedback about what we’re doing<br />
well and what could be improved. The sessions gave us an opportunity to explain why we do certain things<br />
in certain ways. Customer feedback also resulted in a number of improvements, such as customer service<br />
ambassadors available at Britomart and key interchange locations during times of service disruption and<br />
special events; new Star Mart ticket agencies in the central city, improved safety signage for all trains,<br />
and more ‘Meet Our Managers’ sessions.<br />
Veolia is the transport division of the global Veolia Environnement. Started in France in 1875, it now has<br />
more than 65,000 employees in 25 countries. Veolia is contracted through to 2014 to continue bringing its<br />
global experience to the development of the <strong>Auckland</strong> rail network, incorporating systems and processes<br />
that have proven successful in other cities. Veolia has also restructured its organisation to implement<br />
a customer-service-centric management approach.<br />
Marketing campaigns for new customers<br />
A Christmas campaign to encourage <strong>Auckland</strong>ers to do their shopping using public transport featured<br />
bus, print and online advertising, as well as a printed guide distributed to 140,000 household letterboxes.<br />
2,500 competition entries were received, a high number for this type of campaign.<br />
When local bus services within Botany, from Botany to the CBD, and for the Manukau Crosstown services<br />
were redesigned, an extensive marketing campaign went into action in January. Billboards, posters, brochures,<br />
timetables and flyers went out, along with ads in newspapers and MAXX ambassadors at key points in the<br />
region. The result: a 60% growth in patronage on the 11 redesigned services.<br />
From 16 February to 31 March, <strong>ARTA</strong> ran a campaign aimed at encouraging tertiary<br />
students to use the MAXX online journey planner. Print, radio and online channels<br />
(including posters, right) attracted 4,397 students to enter a competition to win<br />
supermarket vouchers. During the campaign 14,000 students visited the MAXX site,<br />
which made March the highest month in the past for visits.<br />
41
42<br />
Waitakere Primary School: Jessica Brandford from <strong>ARTA</strong> joins Waitakere<br />
students, parent helpers and a pet horse on their Walking School Bus
<strong>ARTA</strong> in the community<br />
Every segment of our population has barriers to and opportunities for using public transport,<br />
cycling or walking. Some of the barriers may be real and others are perceived. <strong>ARTA</strong> commissioned<br />
a Colmar Brunton survey in 2006 on each segment – from school children to tertiary students,<br />
to families and retirees – to identify ways we can influence a sustainable change in behaviour<br />
around public transport. The results have continued to inform our actions in the community.<br />
This section of the report outlines new initiatives this year and updates on existing programmes.<br />
“Every segment of our population has<br />
barriers to and opportunities for using<br />
public transport, cycling or walking.”<br />
43
Travelwise<br />
TravelWise is a partnership between <strong>ARTA</strong>, councils, schools, workplaces and community groups. It helps<br />
schools, universities and workplaces to develop travel plans that support viable, sustainable travel choices<br />
for students and employees.<br />
TravelWise – educating kids in schools<br />
There are 550 schools in the <strong>Auckland</strong> region. So far, 180 of those schools have, or are actively<br />
developing, a TravelWise plan and by 2014 we aim to offer every school the chance to develop<br />
a plan.<br />
In the <strong>2009</strong> school year 25 new schools joined the programme. A school travel plan resource kit for lead<br />
teachers in primary schools was prepared, and introduced to over 100 schools during Term 1 this year.<br />
In the first week of March, 70 schools participated in <strong>ARTA</strong>’s Walk to School Week promotion.<br />
This meant 28,000 primary and intermediate students being encouraged to walk to school.<br />
Nine schools won book voucher prizes for recording consistently high levels across the week, which ranged<br />
from 50% to 80% of their total school roll walking to school.<br />
Over 2,000 adult volunteers now walk more than 5,000 children on 254 Walking School Bus routes<br />
throughout the region. By volunteering one day a week, the other four days are free.<br />
A promotion called Men on the Move, held over the Father’s Day period in September 2008,<br />
encouraged more fathers to volunteer. Up to then, only one in seven volunteers were male.<br />
Callum O’Neill volunteers at Northcote Primary School and won a $500 voucher for participating:<br />
“For one it’s good exercise and also one less car at the school gates dropping off the kids.<br />
I’m working shift work myself and when time permits I love joining the Walking School Bus.”<br />
The schools’ programme is evaluated annually. This year, 36,846 students at 77 schools provided feedback.<br />
Primary schools have increased their walking and Walking School Bus participation, while secondary schools<br />
show a significant increase in walking, public transport use and carpooling.<br />
RESULT: Each year, 5,010 fewer cars are on the road each morning. This result is above<br />
the level required to reach the 2014 ARLTS target of 12,600 fewer car trips each<br />
morning peak.<br />
44
School Travel Plans<br />
Progress towards ARLTS 2014 target<br />
20,000<br />
18,000<br />
Car trips avoided each morning peak<br />
16,000<br />
14,000<br />
12,000<br />
10,000<br />
8,000<br />
6,000<br />
4,000<br />
3,240<br />
4,503<br />
5,010<br />
2,000<br />
1,983<br />
0<br />
2005/6<br />
2006/7<br />
2007/8<br />
2008/9<br />
<strong>2009</strong>/10<br />
2010/11<br />
2011/12<br />
2012/13<br />
2013/14<br />
2014/15<br />
School travel plans target<br />
School travel plans actual<br />
Walking School Bus: Children use their<br />
feet to get to school<br />
45
TravelWise – Tertiary students get on board<br />
Around 32,000 tertiary students, as well as about 8,000 staff, travel daily to and around the University of<br />
<strong>Auckland</strong>’s and AUT University’s CBD campuses. Thousands more travel to the North Shore and Tamaki.<br />
Students were already identified as committed public transport users, with over half catching buses, trains<br />
or ferries.<br />
The Universities’ Travel Plan was introduced in 2007. In March 2008, the student discount on public transport<br />
was doubled to 40%. Public transport linkages between campuses and student accommodation improved<br />
with the Northern Busway connection. The number of outlets authorised to sell discounted 10-ride tickets<br />
and the 7-Day Northern Pass increased from five to over 80.<br />
The discount has been strongly promoted to students (see page 41).<br />
The Central Connector project will further encourage public transport use by students, reducing travel<br />
times and improving bus reliability between the CBD via both universities. (See page 28 for more details.)<br />
RESULT: Sales of tertiary tickets increased 67% during the 2008 calendar year. The number<br />
of cars being driven into the CBD by students fell by 1,127.<br />
Travel to CBD Universities 2006 and 2008<br />
25,000<br />
20,000<br />
18,142<br />
19,571<br />
15,000<br />
10,000<br />
5,000<br />
4,464<br />
3,337<br />
2,879<br />
2,152<br />
5,664<br />
6,196<br />
1,146<br />
551<br />
0<br />
Car as driver<br />
Car as passenger<br />
Bus, train or ferry<br />
Walk/run/cycle<br />
Other (mainly<br />
shuttle bus)<br />
Baseline v 2006 Student travel update 2008<br />
46
Cheaper than a gym membership: Nick, Tom and Wally from North Shore<br />
City Council avoid traffic congestion and save money by kayaking to work.<br />
TravelWise – resources and advice for workplace travel plans<br />
There are 34 organisations in <strong>Auckland</strong> that have a workplace travel plan. Besides universities, these include<br />
councils, banks, hotels and other corporates. <strong>ARTA</strong> shares its knowledge and experience to get organisations<br />
on board with their travel plans.<br />
Our resource kit contains advice and tools, such as a cost/benefit calculator and a travel survey, that help<br />
organisations to develop individual travel plans to get people out of cars and onto public transport, cycling<br />
or walking.<br />
A Guaranteed Ride Home (GRH) programme has been piloted at TravelWise workplaces this past year.<br />
GRH programmes offer a taxi ride home or to other relevant destinations (e.g. schools, medical facilities)<br />
for employees that used a sustainable travel option to commute to work on the day of the emergency.<br />
Acting essentially as an insurance programme, GRH schemes overseas have proven to be an extremely<br />
cost-effective approach to both attracting new public transport customers and maintaining or increasing<br />
use of the network by existing customers.<br />
Car pooling software is being developed for the MAXX website, as a further transport option.<br />
RESULT: The 2008 annual review found that there were 355 fewer car trips to work at the<br />
five workplaces with the most advanced travel plans (including <strong>Auckland</strong> Airport), plus<br />
the 1,127 fewer trips to the CBD universities. The 2016 ARLTS goal is for 3,500 fewer car<br />
trips in the morning peak due to workplace and tertiary travel plans.<br />
47
Case study: <strong>Auckland</strong> Airport Travel Plan lifts off<br />
<strong>Auckland</strong> Airport’s innovative travel plan, called Lift,<br />
promotes carpooling, public transport and other alternatives<br />
to private cars to over 12,000 staff working at 23 companies at<br />
the airport.<br />
Begun in 2006 with just six airport-based employers, Lift’s smart<br />
programmes and fun events have attracted awards as well as new<br />
members. Lift won the <strong>Transport</strong> category of the Energy Efficiency<br />
and Conservation Authority Awards <strong>2009</strong>, sponsored by Shell New<br />
Zealand. Lift was one of three finalists and was judged the winner as<br />
Martin Fryer, Sustainability Advisor,<br />
<strong>Auckland</strong> Airport.<br />
it was seen to not only influence changes in travel behaviour but could also be a great template for other<br />
cross-industry locations.<br />
The awards are well deserved. Over 65,000 vehicles travel to and from the airport each day. Within just two<br />
years the plan has taken more than 28 of those cars off the road each day, reducing CO 2<br />
emissions by at least<br />
68 tonnes per year.<br />
One Lift travel hero is Paul Divers, who bought a Vespa scooter and can reliably plan on getting to and<br />
from his home in Titirangi to work in 40 minutes. He’s also enjoying parking closer to work than his<br />
car-driving colleagues and, when the weather’s good, he regularly cycles, making use of recently improved<br />
bike storage facilities.<br />
There are 670 registered carpoolers using <strong>ARTA</strong>-supplied, carpooling software on the airport’s website<br />
to coordinate sharing rides to work. Lift has become embedded in the culture of working at the airport.<br />
The travel plan is an integral part of its sustainability plan to improve access, reduce the effects of climate<br />
change and use fuel and energy more efficiently.<br />
“The demand for travel between the airport and the city is expected to almost double by 2015, with a<br />
sharp spike during events like the Rugby World Cup,” says the airport’s Sustainability Advisor, Martin Fryer.<br />
“By encouraging staff to think differently about getting to work, and providing practical alternatives, we’re<br />
planning ahead to reduce that pressure for staff and passengers alike, and for the country’s gateway to be<br />
a leading example of social responsibility.”<br />
RESULT: <strong>Auckland</strong> Airport’s travel plan has taken at least 28 cars off the road each day,<br />
reducing annual CO 2 emissions by more than 68 tonnes.<br />
48
Superb results from the SuperGold Card<br />
Getting senior citizens out of their cars and onto public transport during commercial hours helps free up our<br />
roads for business activity and makes good use of off-peak public transport services. Equally, it gives those<br />
who can no longer drive greater access to their local communities, reducing social isolation.<br />
From 1 October 2008, Senior Citizen Card holders became entitled to free public transport on all buses,<br />
trains and ferries after 9am on weekdays and all day on weekends and public holidays.<br />
While central government funded the off-peak initiative through the Ministry of Social Development, <strong>ARTA</strong><br />
and the ARC worked with the NZTA to get an even better deal for <strong>Auckland</strong>’s senior citizens, to include free<br />
travel during afternoon peak services. This concession was granted only in <strong>Auckland</strong>.<br />
The new SuperGold Card deal has more than doubled use of public transport by this group.<br />
RESULT: <strong>Auckland</strong>’s senior citizens took 2.3 million free trips within the first six months<br />
of the SuperGold Card being introduced.<br />
Total Mobility Scheme improves access<br />
Total Mobility (TM) is a national programme that supports people with disabilities to have greater access<br />
to their communities by taxi and public transport. There are 9,500 people registered with TM in the<br />
<strong>Auckland</strong> region.<br />
<strong>ARTA</strong> completed implementing ‘Phase 2’ recommendations for national improvements to the Total Mobility<br />
Scheme. Phase 2 has included signing of updated Total Mobility <strong>Transport</strong> Operator contracts by ‘Approved<br />
Taxi Organisations’ and specialist wheelchair hoist van operators, and the signing of updated Total Mobility<br />
Assessment Agency contracts by disability organisations.<br />
TM working group member Mary Schnackenberg says the biggest reason behind increases in registration<br />
for the scheme in <strong>Auckland</strong> is <strong>ARTA</strong>’s commitment to Phase 2. “<strong>ARTA</strong>’s placed considerable energy into<br />
training assessors and raising awareness of the scheme. They’ve led the country in signing on to the Phase<br />
2 improvements in the TM scheme.”<br />
A handbook for assessment facilitators, which provides guidance on the assessment process and eligibility<br />
criteria, has been distributed to agencies and a half-day assessment training course, to be attended by<br />
approximately 105 assessment facilitators in the <strong>Auckland</strong> region, has been developed and piloted ready<br />
for delivery in October <strong>2009</strong>.<br />
RESULT: 95% of those registered with Total Mobility rate the overall taxi service as good,<br />
very good or excellent. The areas rated highest in the June <strong>2009</strong> survey are quality and<br />
comfort, value for money, and safety and security.<br />
49
Cycle maps and seasonal campaigns<br />
During the warmer months, <strong>ARTA</strong> encouraged people to hop on their bikes and get out and about.<br />
The season of sustainable travel began in October with the re-launch of RoadSafe <strong>Auckland</strong>’s ‘Hey, we’re<br />
all the same on the road’ campaign. This campaign, supported by <strong>ARTA</strong>, aimed to promote road safety<br />
and awareness as the number of people cycling in the region began to increase with the temperatures.<br />
An evaluation of the campaign indicated strong support for future regional campaigns.<br />
In December, <strong>ARTA</strong> launched a comprehensive set of five regional cycle maps that allow cyclists to navigate<br />
their own routes around the region. The maps provide a complete inventory of dedicated cycle infrastructure<br />
along with recommendations of Cycle Action Network cyclists on the best choice of local streets for cycling.<br />
The project was sponsored by the Ministry of Health and includes a panel on the health benefits of cycling.<br />
To date, more than 47,000 of the maps have been distributed and digital versions are now available to<br />
download from maxx.co.nz. The cycle maps project is being evaluated, and a project to produce cycle maps<br />
for Waiheke Island and Orewa/Whangaparaoa is being scoped.<br />
Google cycle maps for North Shore are also available through the MAXX website. This high-tech project<br />
was developed by Cycle Action <strong>Auckland</strong>. The maps are designed to integrate cycling with public transport<br />
options, as well as detail cycle parking and safety information. <strong>ARTA</strong> will work with Cycle Action <strong>Auckland</strong><br />
to extend the Google maps throughout the region.<br />
National BikeWise Week was expanded from one week to a whole month this year, and was embraced<br />
throughout the <strong>Auckland</strong> region in February. Hundreds of local organisations competed in the national Bike<br />
Battle during the course of the month, with employees trying to collectively cycle as many kilometres as<br />
possible. In addition, local events organised by councils and cycling advocate groups included cycling lessons<br />
for beginners, kids’ bike rides and mayoral challenges.<br />
The pinnacle of the extravaganza was Go by Bike Day, on which a number of highly successful breakfast<br />
events treated over 1,500 of <strong>Auckland</strong>’s cyclists to a free breakfast. Additionally, <strong>Auckland</strong> played host to<br />
the Urgent Couriers Commuter Challenge in which celebrities took part to pit bikes against buses and cars,<br />
an event which saw the cyclist reign supreme.<br />
A further cycling-related project under way is to produce regional cycle design guidelines to standardise<br />
cycle road markings and signage throughout <strong>Auckland</strong>.<br />
50
Cycle monitoring<br />
Regional manual cycle monitoring has been carried out for the past three years, to give a ‘one-day snapshot’<br />
of cycling in the region. The cycle monitoring is conducted for <strong>ARTA</strong>, the local councils and NZTA in March.<br />
Results from the <strong>2009</strong> cycle survey are:<br />
Year No. of Sites Monitored Count <strong>Annual</strong> Change (at 63 sites<br />
in original survey)<br />
2007 63 9,019 n/a<br />
2008 69 9,274 +3%<br />
<strong>2009</strong> 83 10,054 -2%<br />
Cycling has steadily declined since the 1980s, but has remained constant over the past three years. For example,<br />
16% of school students cycled to school in 1980, while only 2% have cycled in the years from 2007-<strong>2009</strong>.<br />
Where infrastructure is of high quality, continuous and connected, substantial increases in cyclist movements<br />
have been measured. The off-road Twin Streams Cycleway, the Upper Harbour Bridge, the North Western<br />
Cycleway and the Takapuna to Devonport cycle lanes are good examples of such infrastructure. As more<br />
of the Regional Cycle Network is completed, resulting in more continuous and connected routes, cycling<br />
numbers should increase.<br />
If the cycling projects in the <strong>2009</strong>-2012 RLTP are completed, 306.2km (32.6%) of the regional cycle network<br />
will have been constructed. The target set in the ARLTS is to complete 50% of the network by 2016. The<br />
proposed network is 938km long and the cost is estimated at over $100 million. This work is the responsibility<br />
of the NZ <strong>Transport</strong> Agency and local councils.<br />
RESULT: In <strong>2009</strong>, monitoring shows no overall change in numbers of cyclists over three years,<br />
but significant increases at sites where the cycle routes are continuous and connected.<br />
<strong>ARTA</strong> employees, left to right, Brian<br />
Horspool, Paul Montague, Peter Bawden<br />
51
Finding out what stakeholders think of our plans<br />
The draft <strong>2009</strong> <strong>Auckland</strong> <strong>Transport</strong> Plan (ATP) was released for public consultation in March <strong>2009</strong>. This plan<br />
is the flagship 10-year planning document for putting into action an integrated and sustainable transport<br />
system for the region. It unites the strategies, plans, projects and packages developed by <strong>ARTA</strong>, local<br />
authorities, the NZ <strong>Transport</strong> Agency (NZTA) and KiwiRail into a single transport plan. The <strong>2009</strong> ATP builds<br />
on the 2007 ATP in establishing a multi-modal, multi-agency transport implementation plan, which outlines<br />
the priorities of land transport packages and projects over the next decade, within a long-term context.<br />
All but 23 of the 554 submission received were in support of Rodney District Council’s Penlink project, which<br />
links the Whangaparaoa peninsula with Stillwater, East Coast Road and SH1. Accepted from other submissions<br />
were the inclusion of specific and more detailed reference to matters such as transport and energy use,<br />
climate change, peak oil, public health and environmental impacts of transport, and an assurance that the<br />
plan would not be limited by an outdated Regional Land <strong>Transport</strong> Strategy from 2005, but would rather<br />
build on the strategic direction of the draft 2010 ARLTS. The final plan was released at the end of June.<br />
The draft Regional Land <strong>Transport</strong> Programme for <strong>2009</strong>-2012 (RLTP) was also released for public<br />
consultation. There were 34 submissions. A number of these submissions were made to both the<br />
ATP and RLTP. Many submitters agreed with the broad direction of the transport challenges.<br />
However, a number expressed concern that too much funding is still directed towards roading-based solutions.<br />
One submitter did wish to see the acceleration of major State highway projects and linked these to economic<br />
efficiency of the port and region. There were several requests to extend and improve the frequency of<br />
rail services and bus services and to fast-track progress of public transport and travel demand initiatives.<br />
Hearings were held in May and the final plan also released in June.<br />
52<br />
Planning for a world-class city
Progress on implementing the<br />
Regional Land <strong>Transport</strong> Strategy<br />
The <strong>Auckland</strong> Regional Land <strong>Transport</strong> Strategy (ARLTS) sets out a vision for <strong>Auckland</strong>’s transport system<br />
and a 10-year framework (from 2005-2016) for working towards this vision. There are three main elements<br />
to the strategy: roads, public transport and travel demand management.<br />
Four high–level goals<br />
The ARLTS specifies a number of goals. There are four key goals by which <strong>ARTA</strong> measures the contribution<br />
of its activities and those of other agencies to implementing the ARLTS:<br />
Targets by 2016<br />
Target by 2016 07/08 08/09<br />
49% of motorised trips into the CBD by passenger transport 1 32,076 PT trips into the<br />
CBD in the morning peak<br />
32,747 PT trips, an<br />
increase of 2.1%<br />
100 million PT boardings per annum 54.4m 58.6m<br />
20,000 fewer car trips each morning peak through travel plans 5,785 6,492<br />
6% decline in road casualties per 10,000 population, to 29.2 30.9 29.9<br />
1<br />
Dependent upon the Passenger <strong>Transport</strong> Network Plan being fully funded.<br />
Public transport trips into the CBD each morning<br />
35,000<br />
30,000<br />
25,000<br />
20.000<br />
15,000<br />
10,000<br />
5,000<br />
0<br />
1986<br />
1987<br />
1988<br />
1989<br />
1990<br />
1991<br />
1992<br />
1993<br />
1994<br />
1995<br />
1996<br />
1997<br />
1998<br />
1999<br />
2000<br />
2001<br />
2002<br />
2003<br />
2004<br />
2005<br />
2006<br />
2007<br />
2008<br />
<strong>2009</strong><br />
Motorised trips into the CBD<br />
Getting people into the CBD by public transport at peak times delivers double benefits – it removes cars from<br />
our most congested roads, and it contributes to the growth of <strong>Auckland</strong>’s economic and cultural heart.<br />
<strong>Auckland</strong>’s CBD has a finite number of parking spaces and the roads leading to it are seriously congested<br />
at peak times. During the 1980s and 1990s, the importance of <strong>Auckland</strong>’s CBD as an employment and retail<br />
centre steadily declined. This trend has now been halted; between 2002 and 2007, jobs in the CBD grew at<br />
the same rate as the rest of the region. Making it easier to catch the bus, train and ferry into town is crucial<br />
to maintaining this growth.<br />
53
100 million PT boardings per annum<br />
Each year, <strong>ARTA</strong> sets its patronage targets based on available funding and on actual performance in the<br />
past year. While patronage growth has exceeded these targets, the rate of growth is significantly slower<br />
than the rate needed to achieve 100 million trips by 2016.<br />
As shown on the graph on the right, <strong>ARTA</strong> is currently tracking slightly above the level of patronage forecast<br />
by <strong>ARTA</strong> in the Passenger <strong>Transport</strong> Network Plan, based on funding constraints. However, patronage<br />
growth is still well below the level required to achieve 100 million trips by 2016.<br />
Key initiatives that have been delayed due to lack of funding and other issues include integrated ticketing,<br />
modern electric trains and improvements to bus services in the South, West and Isthmus – all of which are<br />
needed to achieve the 100 million target.<br />
20,000 fewer car trips each morning<br />
<strong>ARTA</strong> works with local councils to deliver TravelWise – an internationally recognised programme which<br />
supports schools, tertiary institutes and workplaces to develop travel plans. A travel plan is a targeted set of<br />
actions to reduce car travel and encourage walking, cycling and public transport.<br />
As at June <strong>2009</strong>, 37% of the region’s schools, all the major tertiary institutes, and workplaces totalling over<br />
50,000 employees, have or are developing travel plans. Before-and-after surveys show that there are 6,492<br />
fewer car trips each morning to these destinations.<br />
6% decline in road casualties<br />
Road crashes are the leading cause of death in the <strong>Auckland</strong> region and account for approximately 10% of<br />
all hospitalisations. In 2008, road deaths in the region were 55, a figure which is lower than for any year on<br />
record, and casualties were also reduced. Sadly, this trend is not evident in the <strong>2009</strong> year; already by July<br />
there were more than 55 deaths on <strong>Auckland</strong>’s roads.<br />
<strong>ARTA</strong> and RoadSafe <strong>Auckland</strong> carried out extensive public consultation on the development of a Regional<br />
Road Safety Plan <strong>2009</strong>-2012 which was released in August <strong>2009</strong>. <strong>ARTA</strong> also implemented a successful<br />
high-profile ‘Share the Road’ safer cycling campaign targeting improved behaviour among cyclists and<br />
motorists. Six small community road safety projects were funded to a combined total of $27,000 and<br />
delivered initiatives targeted at improving sober driving, reducing drink driving among those who reoffend,<br />
enhancing pedestrian safety, preventing texting and driving, and improving the driving habits of young<br />
restricted drivers.Meetin<br />
54
100 MILLION PT BOARDINGS PER ANNUM<br />
100<br />
90<br />
80<br />
70<br />
60<br />
50<br />
40<br />
30<br />
20<br />
10<br />
0<br />
TRAVELWISE TARGET – 20,000 FEWER CAR TRIPS EACH MORNING PEAK<br />
20,000<br />
18,000<br />
16,000<br />
14,000<br />
12,000<br />
10,000<br />
8,000<br />
6,000<br />
4,000<br />
2,000<br />
0<br />
1,983<br />
3,240<br />
4,858<br />
6,492<br />
2005/06<br />
2006/07<br />
2007/08<br />
2008/09<br />
<strong>2009</strong>/10<br />
2010/11<br />
2011/12<br />
2012/13<br />
2013/14<br />
2014/15<br />
2015/16<br />
1990<br />
1991<br />
1992<br />
1993<br />
1994<br />
1995<br />
1996<br />
1997<br />
1998<br />
1999<br />
2000<br />
2001<br />
2002<br />
PT Boardings per annum (millions)<br />
2003<br />
2004<br />
2005<br />
2006<br />
2007<br />
2008<br />
<strong>2009</strong><br />
2010<br />
2011<br />
2012<br />
2013<br />
2014<br />
2015<br />
2016<br />
Revised target (available funding)<br />
ARLTS target<br />
Actual patronage<br />
Car trips avoided each morning peak<br />
Overall target = 20,000 by 2006<br />
Actual trip reduction – school, workplace and tertiary travel plans<br />
55
56<br />
The popular Airbus Express at<br />
<strong>Auckland</strong>’s Downtown Ferry Building
STATEMENT OF<br />
SERVICE PERFORMANCE<br />
1 PERFORMANCE TARGETS<br />
The high-level goals by which <strong>ARTA</strong> will measure the contribution of its own activities, and those<br />
of other agencies, to implementing the <strong>Auckland</strong> Regional Land <strong>Transport</strong> Strategy are:<br />
Target by 2016 07/08 Result 08/09 Result<br />
49% of motorised trips into the CBD by<br />
passenger transport 1<br />
32,076 PT trips<br />
each weekday morning<br />
32,747 PT trips<br />
each weekday morning<br />
100 million PT boardings per annum 2 54.4m 58.6m<br />
20,000 fewer car trips each morning peak<br />
through travel plans<br />
6% decline in road casualties per 10,000<br />
population, to 29.2<br />
5,785 6,492<br />
30.9 29.9<br />
1<br />
Based on annual survey counting bus, rail and ferry trips to CBD. Data on vehicle trips to CBD is not available, so<br />
percentage cannot be calculated.<br />
2<br />
Dependent upon the Passenger <strong>Transport</strong> Network Plan being fully funded.<br />
57
1.1 Patronage targets<br />
Outcome Performance Measure 07/08 Result 08/09 Target 08/09 Result<br />
Total PT<br />
patronage<br />
growth<br />
Total PT patronage increases by 1.7% 54,405,000 55,318,000 58,621,000<br />
7.7%<br />
Made up of:<br />
Performance Measure 07/08 Result 08/09 Target 08/09 Result<br />
RTN<br />
patronage<br />
growth<br />
QTN and LCN<br />
patronage<br />
growth<br />
Targeted<br />
services<br />
14% (137,000) patronage growth on the<br />
Northern Busway<br />
9% (204,000) patronage growth on the<br />
Western rail line<br />
4.7% (205,000) patronage growth on the<br />
Southern and Eastern rail lines<br />
1% (323,000) patronage growth on all other<br />
bus services<br />
0.5% (24,000) patronage growth on ferry<br />
services<br />
1% (20,000) patronage growth on school bus<br />
services<br />
963,000 1,100,000 1,500,000<br />
55.8%<br />
2,404,000 2,608,000 2,709,000<br />
12.7%<br />
4,390,000 4,595,000 4,941,000<br />
12.6%<br />
39,721,000 40,044,000 42,482,000<br />
7.0%<br />
4,380,000 4,404,000 4,374,000<br />
-0.1%<br />
2,547,000 2,567,000 2,615,000<br />
2.7%<br />
58
1.2 <strong>Transport</strong> outcome measures<br />
Strategic<br />
Challenge<br />
Performance<br />
Measure<br />
Target 07/08 Result 08/09 Target 08/09 Result<br />
Lead<br />
implementation<br />
of the <strong>Auckland</strong><br />
Regional Land<br />
<strong>Transport</strong><br />
Strategy<br />
Allocation of<br />
funds through<br />
the Regional<br />
Land <strong>Transport</strong><br />
Programme<br />
reflects ARLTS<br />
allocations<br />
(cumulative<br />
values from<br />
06/07)<br />
30% of transport<br />
expenditure is on new<br />
road construction<br />
32% of transport<br />
expenditure is on road<br />
maintenance, traffic<br />
management and road<br />
safety<br />
34% of transport<br />
expenditure is on<br />
passenger transport<br />
33.6% 30% 34.6%<br />
27.2% 32% 25.0%<br />
36.2% 34% 37.2%<br />
4% of transport<br />
expenditure is on travel<br />
demand management<br />
3.0% 4% 3.2%<br />
Strategic<br />
Challenge<br />
Performance<br />
Measure<br />
Target 07/08 Result 08/09 Target 08/09 Result<br />
To deliver the<br />
step-change<br />
in passenger<br />
transport<br />
infrastructure<br />
that will enable<br />
a world-class<br />
service offering<br />
Customer<br />
satisfaction<br />
scores for<br />
Rapid and<br />
Quality Transit<br />
Networks (RTN<br />
and QTN) stops/<br />
stations and<br />
vehicles<br />
% of RTN customers rating<br />
stops/stations and vehicles<br />
as good, very good or<br />
excellent is improved<br />
despite major construction<br />
works<br />
82% stops<br />
& stations,<br />
93% vehicles<br />
83% stops &<br />
stations,<br />
94% vehicles<br />
90% stops &<br />
stations,<br />
94% vehicles<br />
Deliver quality<br />
passenger<br />
transport<br />
services<br />
that meet<br />
<strong>Auckland</strong>ers’<br />
expectations,<br />
within available<br />
funding<br />
Overall<br />
customer<br />
satisfaction<br />
scores for RTN,<br />
QTN and Local<br />
Connector<br />
Network (LCN).<br />
Total of Good,<br />
Very good, or<br />
Excellent<br />
Maintain overall customer<br />
satisfaction above 80%<br />
RTN satisfaction above<br />
85%<br />
QTN satisfaction above<br />
80%<br />
LCN satisfaction above<br />
80%<br />
82% Above 80% 84%<br />
85.1% Above 85% 85%<br />
79% Above 80% 83%<br />
82% Above 80% 87%<br />
Customer<br />
rating of value<br />
for money<br />
of travelling<br />
by passenger<br />
transport in<br />
<strong>Auckland</strong><br />
Increase proportion of<br />
customers who rate value<br />
for money as good, very<br />
good or excellent<br />
64% 68% 70%<br />
59
1.2 <strong>Transport</strong> outcome measures continued<br />
Strategic<br />
Challenge<br />
Performance<br />
Measure<br />
Target 07/08 Result 08/09 Target 08/09 Result<br />
Improve service<br />
punctuality<br />
RTN services<br />
arrive at all<br />
stations within<br />
5 minutes of<br />
scheduled time<br />
Northern Busway services<br />
arrive at destination<br />
station within 5 minutes of<br />
scheduled time<br />
Western Line rail services<br />
arrive at destination<br />
station within 5 minutes<br />
of scheduled time<br />
99.8% 95% 98.6%<br />
80.8% 80% 87.8%<br />
Southern and Eastern<br />
Line rail services arrive at<br />
stations within 5 minutes<br />
of scheduled time<br />
82.8% 80% 84.2%<br />
QTN bus and<br />
ferry services<br />
begin their<br />
route within<br />
5 minutes of<br />
scheduled time<br />
Bus and ferry services<br />
(using real time) begin<br />
their route within 5<br />
minutes of scheduled time<br />
Real time<br />
data is not<br />
available<br />
for QTN.<br />
99% based<br />
on self<br />
reporting by<br />
operators<br />
95% (based<br />
on real time<br />
data)<br />
87.6% (based<br />
on real time<br />
data for QTN<br />
trips towards<br />
CBD)<br />
Improve<br />
responsiveness<br />
Closure rates<br />
for customer<br />
enquiries<br />
Customer enquiries to<br />
MAXX and <strong>ARTA</strong> Enquiry<br />
are resolved within<br />
timeframes<br />
11,058 cases<br />
received.<br />
64% closed<br />
within 10<br />
days<br />
Number and<br />
% resolved<br />
within<br />
timeframe<br />
15,362 cases<br />
received.<br />
84% closed<br />
within 10<br />
days<br />
Enhance<br />
efficiency<br />
by directing<br />
resources to<br />
Quality Transit<br />
Network<br />
corridors and<br />
by rationalising<br />
local bus<br />
services using<br />
the priorities<br />
set out in the PT<br />
Network Plan<br />
Cost per<br />
passenger<br />
Rail – less than $4.82 per<br />
passenger<br />
Bus – less than $2.12 per<br />
passenger<br />
Ferry – less than $1.39 per<br />
passenger<br />
$4.42 $4.82 $4.46<br />
$1.85 $2.12 $2.00<br />
$0.94 $1.39 $1.13<br />
Change<br />
<strong>Auckland</strong>ers’<br />
travel behaviour<br />
by developing,<br />
promoting<br />
and marketing<br />
attractive<br />
transport<br />
options<br />
Reduction in<br />
car trips to<br />
TravelWise<br />
schools<br />
Reduction in<br />
morning peak<br />
car trips to<br />
TravelWise<br />
workplaces/<br />
tertiary<br />
institutions<br />
12,600 fewer car trips in<br />
morning peak by 2014 =<br />
5,000 by 08/09. Measured<br />
via surveys of TravelWise<br />
schools in Term 4<br />
3,500 fewer car trips each<br />
morning peak by 2016.<br />
Target is 1,400 by 08/09.<br />
Measured by repeat<br />
surveys<br />
4,503 5,000 5,010<br />
1,282 1,400 1,482<br />
Reduction in car<br />
trips through<br />
Neighbourhood<br />
Accessibility<br />
Plans<br />
3,900 fewer car trips<br />
by 2016 through<br />
Neighbourhood<br />
Accessibility Plans<br />
implemented by local<br />
councils<br />
0 0 0<br />
60
1.2 <strong>Transport</strong> outcome measures continued<br />
Performance<br />
Measure<br />
Target 07/08 Result 08/09 Target 08/09 Result<br />
Capital projects<br />
implemented to<br />
schedule and on<br />
budget<br />
Service<br />
improvements<br />
implemented to<br />
schedule and on<br />
budget<br />
Other significant<br />
projects<br />
implemented to<br />
schedule and on<br />
budget<br />
Capital projects included in the<br />
2008/09 funding agreement<br />
are progressed to schedule and<br />
within agreed budgets<br />
Service improvements included<br />
in the 2008/09 funding<br />
agreement, are delivered<br />
within agreed budgets<br />
Other projects included in the<br />
2008/09 funding agreement are<br />
progressed to schedule within<br />
agreed budgets<br />
92% 85% 77.7% (all<br />
projects)<br />
84.3%<br />
(controllable<br />
projects)<br />
N/A Achieved Partly achieved.<br />
See detailed<br />
report on<br />
Programme of<br />
Action<br />
N/A Achieved Partly achieved.<br />
See detailed<br />
report on<br />
Programme of<br />
Action<br />
1.3 Governance Measures<br />
Strategic Challenge Performance Measure Target 07/08 Result 08/09 Result<br />
Build a customerfocused<br />
organisation<br />
with excellent<br />
leadership practices,<br />
effective teamwork<br />
and good processes<br />
Administration costs<br />
managed to budget<br />
Adherence to capital<br />
and operational<br />
funding limits<br />
Administration costs in<br />
any financial year do<br />
not exceed the amount<br />
approved by the ARC<br />
Costs in any financial<br />
year do not exceed the<br />
amounts approved by<br />
the ARC<br />
Achieved<br />
Achieved<br />
Achieved<br />
Not Achieved,<br />
due to advanced<br />
purchase of<br />
rolling stock<br />
spares<br />
Accounting policies<br />
are consistent with the<br />
ARC group and all legal<br />
and audit requirements<br />
are met<br />
100% compliance as<br />
measured by Audit NZ<br />
annual audit<br />
Achieved<br />
Achieved<br />
Policies, procedures<br />
and processes<br />
consistent with New<br />
Zealand <strong>Transport</strong><br />
Agency’s requirements<br />
100% compliance as<br />
measured by New<br />
Zealand <strong>Transport</strong><br />
Agency annual audit<br />
Achieved<br />
Achieved<br />
61
Key projects for 2008/09<br />
The following specific service improvements and projects have been agreed between the ARC and<br />
<strong>ARTA</strong> through the Long Term Council Community Plan progress. Progress towards the milestones<br />
set out below will be reported to the ARC in each Quarterly <strong>Report</strong>.<br />
Rail Programme of Action<br />
Purchase of electric trains<br />
Construct a large modern station at<br />
Newmarket (to open late <strong>2009</strong>)<br />
Construct a large modern station<br />
at New Lynn (timing dependent<br />
on the ONTRACK double tracking/<br />
under-grounding project)<br />
Construct a new station at the<br />
intersection of Khyber Pass and<br />
Park Road (near <strong>Auckland</strong> Hospital)<br />
Avondale Station upgrade<br />
A trial service from Helensville, for<br />
12 months from July 2008<br />
Four or more trains per hour at<br />
peak times across the current<br />
suburban network from July 2008<br />
Provision of two services per hour<br />
at peak times on the Onehunga<br />
branch line in <strong>2009</strong><br />
Provision of six services per hour at<br />
peak times on the Manukau rail link<br />
A new station serving Parnell and<br />
the Learning Quarter<br />
A new Drury Station<br />
Station upgrades at Baldwin<br />
Avenue, Morningside, Mt Albert,<br />
Remuera, Greenlane, Penrose,<br />
Otahuhu, Te Mahia, Takanini,<br />
Waitakere and Pukekohe<br />
Removed from programme<br />
The Government announced in March <strong>2009</strong> its intention to rescind the<br />
regional fuel tax, and its decision that ownership of any future electric<br />
rolling stock should rest with KiwiRail.<br />
Progressed to schedule<br />
Significant progress has been made on the construction of the new<br />
Newmarket Station over the past year, and the station is due to be opened<br />
in January 2010. Currently, the structure of the station and the link bridge to<br />
Remuera Road have both been completed.<br />
Progressed to schedule<br />
Detailed design has been completed and costs are being finalised, including<br />
cost allocation between <strong>ARTA</strong>, Waitakere City Council and ONTRACK.<br />
Progressed to schedule<br />
The detailed design for the new station, now named Grafton Station, has<br />
been completed and the building consent has been submitted.<br />
Progressed to schedule<br />
Detailed design is due to be completed by August <strong>2009</strong>, and the expectation<br />
is that the station upgrade will be complete in the second quarter of 2010<br />
subject to funding approvals.<br />
Achieved<br />
A trial service from and to Helensville was implemented.<br />
Achieved<br />
This level of service was achieved from 13 July 2008.<br />
Progressed to schedule<br />
<strong>ARTA</strong> has completed planning for the Onehunga Station (ITM site) and is<br />
currently preparing a building consent application for the station.<br />
Progressed to schedule<br />
The location of the Manukau Station has been agreed, and concept design<br />
is progressing. <strong>ARTA</strong> is working with Manukau City Council and KiwiRail to<br />
develop a detailed programme of works subject to NZTA funding.<br />
Progressed to schedule<br />
<strong>ARTA</strong> is working with <strong>Auckland</strong> City Council and KiwiRail to develop<br />
preliminary concepts for a new station.<br />
Removed from programme<br />
<strong>ARTA</strong>’s commitment to construct a Drury station has been reviewed in the<br />
light of KiwiRail’s decision that the southernmost station on the electrified<br />
network will be Papakura.<br />
Partly achieved, programme adjusted<br />
<strong>ARTA</strong> is continuing to work with KiwiRail and the relevant local councils to<br />
finalise the location and scope of works for these stations. Morningside rail<br />
station upgrade was completed during 2008/09.<br />
62
Bus Programme of Action<br />
Improved bus services between <strong>Auckland</strong> Airport and<br />
the <strong>Auckland</strong> CBD, and a new service from Manukau<br />
City, supported by train connections, from mid-2008<br />
Improved services to Flat Bush, Highbrook, Mt<br />
Wellington from 2008 onwards<br />
Improved southern and eastern bus services and<br />
connections with trains from late 2008<br />
Improvements to north sector bus services<br />
Improvements to isthmus bus services, and<br />
implementation of a Quality Transit Network<br />
Achieved<br />
Simpler route and improved frequency on the Airbus<br />
Express to both the CBD and Manukau commenced in<br />
June 2008.<br />
Achieved<br />
Improved services to Botany, Mission Heights and Flat<br />
Bush commenced in August 2008.<br />
First bus services introduced to Highbrook in February<br />
<strong>2009</strong>.<br />
Progressed to schedule<br />
A revised timetable to introduce bus services to<br />
Stonefields commenced in August 2008 with further<br />
improved service design for southern and eastern bus<br />
services planned for the <strong>2009</strong>/10 financial year.<br />
Achieved<br />
Additional morning Torbay to Newmarket service –<br />
July 2008.<br />
Hibiscus Coast and North Shore Express services<br />
stopping at all stations – September 2008.<br />
Integrated North Shore to Airport ticket –<br />
September 2008.<br />
Knightsbridge Village to Constellation Station trial<br />
service – October 2008.<br />
Additional peak Northern Express services<br />
(4-minute frequency) added in October 2008.<br />
Additional Northern Express peak capacity added<br />
March <strong>2009</strong>.<br />
Progressed to schedule<br />
Mt Eden Road additional services were introduced in<br />
October 2008.<br />
63
Ferry Programme of Action<br />
Improvements to passenger waiting facilities at Half<br />
Moon Bay<br />
Additional services at Half Moon Bay in 2008<br />
More frequent services to Pine Harbour from mid-2008<br />
More frequent services to West Harbour from 2008 and<br />
Gulf Harbour from <strong>2009</strong><br />
A new ferry wharf and ferry services for Beach Haven<br />
from early <strong>2009</strong><br />
More frequent evening and weekend services to<br />
Devonport from mid-2008<br />
Downtown Ferry Terminal upgrade<br />
Downtown wharf structural renewals<br />
Birkenhead ferry terminal upgrade<br />
Improved facilities at Gulf Harbour<br />
A new ferry terminal at Bayswater, to open early<br />
2010, with more frequent services to Bayswater and<br />
Birkenhead at that time<br />
Achieved<br />
Improvements to passenger waiting facilities were<br />
completed October 2008.<br />
Removed from programme<br />
The costs of additional services to Half Moon Bay have<br />
been investigated further, and they are not considered<br />
to be affordable within current budgets.<br />
Achieved<br />
Additional Pine Harbour services began operating in<br />
March 2008 with an additional vessel and two extra<br />
return journeys each weekday.<br />
Achieved<br />
Additional West Harbour services began in June 2008<br />
with an additional vessel and six extra return journeys<br />
each weekday. An average 10% fare increase was<br />
introduced to offset the increase in subsidy. Patronage<br />
on the Gulf Harbour ferry is low and the service is<br />
under review.<br />
Programme adjusted<br />
A staged option was recommended to construct the<br />
ferry terminal, and provided <strong>ARTA</strong> the option to<br />
minimise the impact on the heritage values of the<br />
existing wharf. Capital funding for the Beach Haven<br />
construction works has been included in the <strong>2009</strong>/10<br />
ARC budget.<br />
Achieved<br />
Additional evening services to Devonport were added<br />
to the Fullers commercial service offering in early 2008<br />
Progressed to schedule<br />
Several improvements to passenger facilities at the<br />
Downtown Ferry Terminal were completed in late 2008,<br />
including:<br />
• Pier 1 glass wall enclosure and ports operations office<br />
• Pier 2 canopy<br />
• Pier 1 to 2 link bridge/promenade extension and<br />
fendering.<br />
Progressed to schedule<br />
An increased scope of work for structural renewals to<br />
the downtown wharf substructures has been agreed,<br />
funding has been approved, and work is progressing as<br />
scheduled, with revised completion due mid-2010.<br />
Progressed to schedule<br />
Concrete repair works commenced in June <strong>2009</strong> with<br />
the intention to install a new hydraulic platform.<br />
The tender package for the project will be completed in<br />
September <strong>2009</strong>, with an estimated project completion<br />
date of January 2010.<br />
Achieved<br />
Improvements to passenger waiting facilities were<br />
completed in October 2008.<br />
Removed from programme<br />
Capital works at Bayswater were deferred to 2012/13<br />
in the ARC Long Term Council Community Plan. Interim<br />
improvements, including parking options and enabling<br />
bus services to terminate closer to the ferry terminal,<br />
are under investigation.<br />
64
Other Identified Projects<br />
Integrated smartcard ticketing by late 2010<br />
Real time public transport information available across<br />
the region by late 2010<br />
Offering every school in <strong>Auckland</strong> the opportunity to<br />
develop a travel plan by 2014, and increasing support for<br />
school bus services and Walking School Buses<br />
Ongoing increases in the Total Mobility scheme for<br />
people with disabilities, and in concession fares for<br />
children, students and senior citizens, in line with<br />
population growth and demographic change.<br />
Delayed<br />
Tender evaluation for the <strong>Auckland</strong> Integrated Fare<br />
Solution (AIFS) Programme was completed in October<br />
2008 and since that time various external factors,<br />
specifically related to obtaining funding approvals in<br />
Q4 2008 and NZTA’s investigation of the programme<br />
through the first half of <strong>2009</strong>, have led to project<br />
delays. Currently, the programme is in discussion with<br />
funders on funding allocations and looking at ways<br />
to deliver the programme within budget constraints.<br />
Once funding is secured, the next stage will be final<br />
negotiations with a preferred tenderer.<br />
Progressed to schedule<br />
Real time passenger information signs have been<br />
installed at 147 priority bus stops. Twelve additional<br />
sites have been added to the project, three are<br />
completed and the remaining nine are programmed<br />
for completion during the next three months. The<br />
supply and installation of a further 200 Type 2 signs,<br />
suitable for lower-use bus stops, is under way.<br />
A multi-modal real time passenger information system<br />
project is under way, which will enable real time<br />
passenger information at ferry terminals, rail stations,<br />
modal interchanges and bus stops. The project<br />
includes improvements to the underlying real time<br />
management system and associated infrastructure.<br />
Funding has been approved and a RFP for the system<br />
was released in July <strong>2009</strong>. The multi-modal system will<br />
be implemented in stages during <strong>2009</strong>/2010.<br />
Progressed to schedule<br />
180 schools have, or are developing, TravelWise plans,<br />
out of 550 total schools in the region.<br />
The 2008 annual evaluation of travel patterns at<br />
TravelWise schools has confirmed that the programme<br />
is effective at reducing car trips to school and<br />
increasing active transport and public transport. Each<br />
morning there are 5,010 fewer car trips to school as<br />
a result of the programme – just above the annual<br />
target of 5,000.<br />
Achieved<br />
In 2008/09 <strong>ARTA</strong> completed implementation of NZTA’s<br />
‘Phase 2’ recommendations for national improvements<br />
to the Total Mobility scheme and is now eligible for<br />
a higher subsidy on Total Mobility costs, offsetting<br />
the impact of continued growth in Total Mobility<br />
registrations. Changes included updating assessment<br />
agency and transport operator contracts, delivering<br />
assessment training, and redeveloping assessment<br />
resources. Approximately 80% of the 10,000 registered<br />
Total Mobility clients in the <strong>Auckland</strong> region have<br />
recently applied to renew their photo ID cards as part<br />
of the two-yearly reissue process.<br />
Free public transport for SuperGold Card holders and<br />
MAXX Senior Citizen Card holders – after 9am on<br />
weekdays and all day on weekends and public holidays<br />
– was launched on 1 October 2008 and use of bus,<br />
rail and ferry services by senior citizens has more than<br />
doubled.<br />
65
<strong>ARTA</strong>’S PROFILE<br />
<strong>ARTA</strong> was established in 2004 to plan, fund and develop <strong>Auckland</strong>’s transport<br />
system of roads, rail, buses and ferries into one that is world-class, safe,<br />
responsive and sustainable. The <strong>Auckland</strong> region requires an integrated,<br />
effective transport system to enhance its economy, maintain and improve its<br />
liveability, and provide good accessibility to the people who live, work and play in<br />
the region.<br />
Successful cities require transport systems that move people and goods in the most sustainable,<br />
efficient and effective ways. To achieve this in <strong>Auckland</strong>, <strong>ARTA</strong> is shifting the focus of transport<br />
planning from moving vehicles towards moving people and goods sustainably.<br />
<strong>ARTA</strong> is part of the ARC group, is defined as a Council-controlled Organisation and operates<br />
as a stand-alone business. Around half of the regional rates collected by the ARC go towards<br />
funding <strong>Auckland</strong>’s rail, bus and ferry services, including new trains, stations and ferry wharves.<br />
The ARC commits bulk funding to <strong>ARTA</strong> on a year-by-year basis. <strong>ARTA</strong> is then responsible for the<br />
integrated planning and project funding of transport (excluding State highways) throughout the<br />
region. It is the only regional transport authority in New Zealand, and also receives funding from<br />
the NZ <strong>Transport</strong> Agency.<br />
<strong>ARTA</strong>’s activities include:<br />
• identifying and purchasing new public transport services on buses, trains and ferries<br />
• monitoring existing public transport services<br />
• subsidising concession fares for senior citizens, school children and tertiary students<br />
• funding the Total Mobility service and other initiatives to help people with disabilities<br />
• managing school bus contracts<br />
• continuing with the refurbishment of existing trains<br />
• overseeing the introduction of more refurbished trains in the future<br />
• upgrading rail stations and monitoring public safety<br />
• maintenance of regional public wharf facilities and ferry terminals<br />
• long-term upgrades of the rail network including track improvements and additional trains<br />
66
“<strong>ARTA</strong> is shifting the focus of<br />
transport planning from moving<br />
vehicles towards moving people<br />
and goods sustainably.”<br />
Daily commuters at Henderson<br />
train station<br />
67
• developing travel plans to encourage more people to catch the train, bus or ferry, walk, cycle, rideshare,<br />
or work from home<br />
• implementing regional cycling and walking strategies<br />
• promoting and developing the Walking School Bus programme<br />
• coordinating regional road safety activities<br />
• providing information about public transport services (including timetables at stops and rail stations)<br />
• planning improvements and developments to the local roading network<br />
• developing the Regional Land <strong>Transport</strong> Programme for funding of all land transport projects in the<br />
<strong>Auckland</strong> region<br />
• planning and prioritising the ongoing development of the region’s land transport system through the<br />
<strong>Auckland</strong> <strong>Transport</strong> Plan<br />
• ensuring that the development and growth of transport activities are integrated with the land<br />
use system.<br />
<strong>ARTA</strong>’s performance is monitored by the ARC through:<br />
• providing an annual Statement of Intent<br />
• providing half-yearly and annual reports against both the ARLTS and the Statement of Intent<br />
• performance monitoring.<br />
<strong>ARTA</strong>’s Executive Team<br />
<strong>ARTA</strong>’S BOARD OF DIRECTORS<br />
From left to right – Stephen Smith, General Manager, Corporate Services – Mark Lambert, General Manager, Customer<br />
Services – Shelley Watson, General Manager, Marketing and Communications – Fergus Gammie, Chief Executive –<br />
Allen Bufton, Acting General Manager, Project Delivery – Peter Clark, General Manager, Strategy and Planning<br />
68
<strong>ARTA</strong>’s Board of Directors has overall responsibility for the functions and responsibilities of <strong>ARTA</strong>, including<br />
the integrated planning, funding and implementation of all modes of transport throughout the <strong>Auckland</strong><br />
region. All decisions relating to the operation of <strong>ARTA</strong> are made by or under the authority of the Board<br />
in accordance with the Local Government (<strong>Auckland</strong>) Amendment Act 2004 and the operative annual<br />
Statement of Intent.<br />
In 2008/09 the Board met formally each month.<br />
Standing Committee<br />
The Risk and Assurance Committee is responsible for assisting the Board in areas of risk management,<br />
financial audit and legal compliance.<br />
Board Appointments<br />
The <strong>ARTA</strong> Board was appointed in July 2004.<br />
During the 2008/09 year, five directors’ terms of office expired and one director resigned.<br />
Mark Ford resigned effective 31 May <strong>2009</strong> to take up the position of Chair of the <strong>Auckland</strong> Transition<br />
Agency. Peter Brothers, Rabin Rabindran, Gary Taylor, Mike Williams and Adrienne Young Cooper’s terms<br />
expired at 30 June <strong>2009</strong> and they have been reappointed as directors for a new term of 16 months from<br />
1 July <strong>2009</strong> to 31 October 2010. Rabin Rabindran was appointed as Chair and Adrienne Young Cooper<br />
Deputy Chair of the <strong>ARTA</strong> Board.<br />
Directors’ current terms of office are:<br />
Term<br />
Expires<br />
Peter Brothers 16 months 31 October 2010<br />
Rabin Rabindran 16 months 31 October 2010<br />
Mike Williams 16 months 31 October 2010<br />
Gary Taylor 16 months 31 October 2010<br />
Adrienne Young Cooper 16 months 31 October 2010<br />
Mark Benjamin 3 years 30 June 2010<br />
Andrew Buxton 3 years 30 June 2010<br />
Anthony Marks 3 years 30 June 2010<br />
69
Board Profiles<br />
Rabin Rabindran<br />
BOARD CHAIR<br />
Rabin Rabindran is a commercial barrister and international legal<br />
consultant specialising in infrastructure development, construction<br />
and energy. He has worked on major projects in more than<br />
25 countries acting for governments, local authorities and major<br />
corporates. He is a director of Manukau Water Ltd, Tomorrow’s<br />
Manukau Properties Ltd, TMPL (Flat Bush) Ltd and a company with<br />
interests in China. Rabin is also chairman of the Singapore Chapter<br />
of the ASEAN New Zealand Combined Business Council and<br />
a trustee of the Chinese Language Foundation. He was previously<br />
a partner at Simpson Grierson and a director of an Australian<br />
public company.<br />
Adrienne Young Cooper<br />
DEPUTY CHAIR<br />
Adrienne Young Cooper is an independent director and<br />
planning consultant. She is a founding shareholder of Hill Young<br />
Cooper Limited, a major planning and resource management<br />
consultancy based in Wellington and <strong>Auckland</strong>. She specialises in<br />
urban growth management, and the relationship between transport<br />
and land use.<br />
Adrienne was an inaugural director of <strong>Auckland</strong> Regional<br />
<strong>Transport</strong> Network Limited, and took special responsibility for the<br />
commissioning of the Britomart <strong>Transport</strong> Centre. In addition to<br />
<strong>ARTA</strong>, she currently sits on the boards of Solid Energy New Zealand<br />
Limited, Maritime New Zealand, Manukau Building Consultants<br />
Limited and the <strong>Auckland</strong> City Property Enterprise Board.<br />
Adrienne is also a trustee of several charitable organisations.<br />
70
Gary Taylor<br />
Gary Taylor is an experienced company director and environmental<br />
policy analyst. He is currently chairman of the Environmental<br />
Defence Society, the Climate Change and Business Centre and<br />
is also a director of the Hobsonville Land Company.<br />
MARK BENJAMIN<br />
Mark Benjamin is a Chartered Accountant and experienced<br />
executive in the infrastructure and agriculture industries. Prior to<br />
that he worked at Price Waterhouse internationally. In addition to<br />
his executive roles, Mark provides consulting and director services<br />
to small businesses, start-up businesses and not-for-profit entities.<br />
Professor Peter Brothers<br />
Peter Brothers is chief executive of The Manukau Institute of<br />
Technology. He was previously Dean of Engineering at the<br />
University of <strong>Auckland</strong>, holding that position for nine years. His<br />
career began with what was then the DSIR (Department of Scientific<br />
and Industrial Research), later spending 20 years in the United<br />
States in both public and private sector infrastructure roles. Peter<br />
was formerly a director of <strong>Auckland</strong> Regional <strong>Transport</strong> Network<br />
Limited and of UniServices Ltd, the University of <strong>Auckland</strong>’s<br />
intellectual property company, and is currently a director of<br />
Metrowater.<br />
71
Tony Marks<br />
Tony Marks is a director of Zespri International, House of Travel,<br />
Redwood Cellars and Polynesian Airlines as well as other companies<br />
in food, aviation and tourism.<br />
He previously worked in marketing for major food companies in<br />
England, the United States and Venezuela before coming to New<br />
Zealand in 1978. Over the next 30 years, he held senior management<br />
positions at Carter Holt Harvey, was General Manager Sales and<br />
Marketing at Air New Zealand for ten years and CEO of Zespri<br />
International for four years. Prior to retiring from corporate life<br />
in 2006, he was the inaugural CEO of Pacific Blue Airlines, the<br />
international arm of Virgin Blue Airlines.<br />
Mike Williams<br />
Mike Williams is a director of Sustainable Power Technologies<br />
Limited and a Trustee of Waitakere Enterprise. Mike is the former<br />
President of the New Zealand Labour Party and has held senior<br />
executive positions with major environment and transport-related<br />
organisations.<br />
ANDREW BUXTON<br />
Andrew Buxton is General Manager Systems, Logistics and Strategy<br />
Deployment for Warehouse Stationery. He has previously held<br />
senior executive roles in retail and consulting in NZ, Asia and the UK,<br />
and has led successful start-up companies. Currently, he is a director<br />
of a category management business (Complete Entertainment<br />
Services Ltd), a small consulting company (MH Group Ltd), a global<br />
standards organisation (GS1 NZ) and a global charity (UNICEF NZ).<br />
72
Directors’ attendance 1 July 2008 to 30 June <strong>2009</strong><br />
<strong>ARTA</strong> board meetings.......................................................14<br />
Meetings attended<br />
Mark Ford (until 31 May <strong>2009</strong>)......................................... 12<br />
Mark Benjamin.................................................................. 12<br />
Peter Brothers.................................................................... 12<br />
Andrew Buxton................................................................. 14<br />
Anthony Marks.................................................................. 13<br />
Rabin Rabindran................................................................ 13<br />
Gary Taylor......................................................................... 12<br />
Mike Williams.................................................................... 13<br />
Adrienne Young Cooper................................................... 11<br />
Risk and Assurance Committee (5 meetings)<br />
Rabin Rabindran..................................................................4<br />
Mark Ford.............................................................................4<br />
Gary Taylor...........................................................................5<br />
Mark Benjamin (from 25 February <strong>2009</strong>)..........................3<br />
Peter Brothers (from 24 June <strong>2009</strong>)...................................1<br />
73
Working at <strong>ARTA</strong><br />
Attracting and retaining talented people is one of the pivotal ways <strong>ARTA</strong> can achieve its strategic goals.<br />
<strong>ARTA</strong>’s aim is to create an environment where the employment relationship is a partnership between<br />
managers and staff, encourages team work, has a one organisation approach and a culture that respects<br />
(and encourages) diversity.<br />
<strong>ARTA</strong>’s culture is based on five key values:<br />
Visionary<br />
Inspiring creativity and innovation<br />
through forward-looking leadership<br />
Collaborative<br />
Working together in partnership,<br />
recognising and sharing success<br />
CULTURE<br />
Open<br />
Being honest, respectful, transparent<br />
and communicating clearly<br />
Focused<br />
Responsive<br />
Getting the right results<br />
at the right time, real and simple<br />
Committed to delivering<br />
customer and community needs<br />
74<br />
Angela Robinson, <strong>ARTA</strong>’s<br />
Receptionist
We have a very diverse workforce of 115, with representation from many parts of the world. The people<br />
employed by <strong>ARTA</strong> are primarily at a professional level including rolling stock engineers, planners and<br />
account managers. The rest of the organisation is made up of skilled staff across all other areas such as<br />
finance, organisational development, administration, marketing, communications and media.<br />
The common thread – a passion for<br />
<strong>Auckland</strong> and contributing to<br />
making our city a better place to<br />
live, work and play.<br />
60<br />
Employee demographics<br />
6<br />
<strong>ARTA</strong> demographics – Gender<br />
Average (in years)<br />
50<br />
40<br />
30<br />
20<br />
10<br />
0<br />
Male Female Combined Male Female Combined<br />
5<br />
4<br />
3<br />
2<br />
1<br />
0<br />
Average (in years)<br />
Age<br />
Length of service<br />
Male<br />
Female<br />
* The service history of staff who transitioned from the ARC when <strong>ARTA</strong> was formed is counted in this statistic but the low average is<br />
primarily due to <strong>ARTA</strong>’s rapid growth and its short, five-year existence.<br />
Getting on board<br />
In the past year, a new Walking and Cycling Coordinator, who has recently completed a dissertation relating<br />
to the barriers to cycling to schools, has joined the Strategy and Planning team. We have also reversed the<br />
migration trend by attracting an event expert from Australia to manage the Rugby World Cup.<br />
They, like all new employees, went through a comprehensive induction programme. The programme<br />
includes a welcome aboard booklet, a ‘buddy’ for the first week, and a network journey on different modes<br />
of public transport.<br />
75
Case study – Special Events PLANNING<br />
Shelley Simpson was a typically talented Kiwi who worked in Australia for 10 years and then wanted to<br />
come home to be closer to her family. Also on her CV was a contract in Doha, Qatar, planning the Asian<br />
Games in 2006. She approached <strong>ARTA</strong> to see if her skills matched a job vacancy.<br />
The position of Special Events Planner was being newly created as a full-time job, to lead and coordinate<br />
public transport services for sports and cultural events in <strong>Auckland</strong>. It requires Shelley to do every task from<br />
planning through to implementation and review.<br />
“There are so many passionate people working at <strong>ARTA</strong> and it’s such an interesting job. I’ve been able to<br />
bring my experience with best practice internationally for event transport planning and have this adopted<br />
here,” she says.<br />
Integrated ticketing for sports and cultural events was well established internationally but unknown in<br />
New Zealand. Since Shelley started the job, a whole range of tickets for events at North Shore Stadium,<br />
Eden Park, Mt Smart and Vector Arena has been integrated with ‘free’ public transport. The results are a<br />
big success in getting more people out of their cars.<br />
Not everything that works internationally works here, says Shelley, but her theory is that if you provide<br />
reliable, visible services and make it easy for people to use public transport, they will.<br />
Shelley discovered initially that few event organisers understood what <strong>ARTA</strong> does. The same was true for<br />
councils, traffic management teams and the Police. Becoming part of a decision-making team environment<br />
for regional events has helped educate other event planners on what <strong>ARTA</strong> can offer.<br />
“I don’t get ‘So what does <strong>ARTA</strong> do?’ anymore,” says Shelley.<br />
Shelley’s own special event for the seven months to March 2010 is the birth of her first child. She’ll be on<br />
maternity leave but her job will be in safe, experienced hands until she returns.<br />
76
Employee benefits<br />
<strong>ARTA</strong> is an Equal Opportunities Employer with an Employee Assistance Programme, a group healthcare<br />
scheme through Southern Cross for permanent employees, a wellness programme, full health checks,<br />
discount gym membership, an on-site café and social club, and strategies for enabling employees to find a<br />
good balance between work and home.<br />
The wellness programme supports involvement in corporate sports teams. <strong>ARTA</strong>, for example, has a joint<br />
team with the ARC for the annual dragonboat race.<br />
Performance and development<br />
The key performance indicators within each employee development and performance management plan<br />
are aligned throughout the organisation, right up to CEO level. This supports our one organisation policy<br />
and gives employees a real sense of how their work integrates with <strong>ARTA</strong>’s wider goals.<br />
Exceptional performance is rewarded at monthly staff forums. Run by and for staff, these mandatoryattendance<br />
forums support learning development and an understanding of our business.<br />
<strong>ARTA</strong> also allocates funding to job-specific training and career development.<br />
Left to right – Julie Bassett, Organisational Development Manager,<br />
Pat Patterson, HR Advisor, Samatha Pavis, HR Administrator<br />
77
Health and safety record<br />
<strong>ARTA</strong> holds tertiary level accreditation with the Accident Compensation Commission (ACC).<br />
This level of accreditation is only awarded following rigorous auditing against a set of key<br />
indicators. It means <strong>ARTA</strong> has in place best practice health and safety, and a culture of continuous<br />
improvement.<br />
In <strong>2009</strong>, three days were lost to workplace injury, when an employee injured a finger in a basement<br />
car park door. The door has subsequently been altered for better safety.<br />
Walking the talk<br />
Over half of <strong>ARTA</strong> employees walk, cycle or take public transport to work, compared with only<br />
12% of <strong>Auckland</strong>ers as a whole. Many also walk to and from meetings in the city. This outcome<br />
is primarily driven by the organisational culture and a strong sense of social responsibility. <strong>ARTA</strong><br />
also provides lockers and showers, plus a pool of bicycles for travel between local meetings.<br />
Walking The Talk<br />
1%<br />
3%<br />
3%<br />
69%<br />
24%<br />
69% of <strong>ARTA</strong> staff travel sustainably (cycling (4%),<br />
walking (11%), public transport (38%), carpooling<br />
(16%, this includes being a passenger or sharing a<br />
ride with a member of your household))<br />
24% drove alone<br />
3% came by motorcycle or scooter<br />
1% worked from home on these days<br />
3% other<br />
Ninety staff participated in the July <strong>2009</strong> survey on travel to work, an 80% response rate. Results show<br />
that 69% travel to work by a sustainable means (cycling, walking, public transport or carpooling).<br />
That’s a five percent increase from 2007. In 2007 only 12% of <strong>Auckland</strong>ers as a whole used sustainable<br />
means of travel. 3% fewer staff members now drive into work alone than in 2007.<br />
78
<strong>ARTA</strong> actively encourages staff to walk<br />
and cycle to meetings around the CBD<br />
79
STATEMENT OF COMPLIANCE AND<br />
RESPONSIBILITY<br />
COMPLIANCE<br />
The Board and management of the <strong>Auckland</strong> Regional <strong>Transport</strong> Authority confirm that all the statutory<br />
requirements of the Local Government Act 2002 and Local Government (<strong>Auckland</strong>) Amendment Act 2004 in<br />
relation to the <strong>Annual</strong> <strong>Report</strong> have been complied with.<br />
RESPONSIBILITY<br />
The Board and management of the <strong>Auckland</strong> Regional <strong>Transport</strong> Authority accept responsibility for the<br />
preparation of the financial statements and the judgements used in them.<br />
The Board and management of the <strong>Auckland</strong> Regional <strong>Transport</strong> Authority accept responsibility for<br />
establishing and maintaining a system of internal control designed to provide reasonable assurance as to<br />
the integrity and reliability of financial reporting.<br />
In the opinion of the Board and management of the <strong>Auckland</strong> Regional <strong>Transport</strong> Authority, the annual<br />
financial statements for the year ended 30 June <strong>2009</strong> fairly reflect the financial position and operations of<br />
the <strong>Auckland</strong> Regional <strong>Transport</strong> Authority.<br />
Rabin Rabindran<br />
Chairman<br />
September <strong>2009</strong><br />
Fergus Gammie<br />
CEO<br />
September <strong>2009</strong><br />
80
STATEMENT OF ACCOUNTING POLICIES<br />
FOR THE YEAR ENDED 30 JUNE <strong>2009</strong><br />
<strong>Report</strong>ing Entity<br />
The <strong>Auckland</strong> Regional <strong>Transport</strong> Authority (<strong>ARTA</strong>) was established on 1 July 2004 by the Local Government<br />
(<strong>Auckland</strong>) Amendment Act 2004. It is a body corporate with perpetual succession.<br />
It is also a Council-Controlled Organisation as defined by the Local Government Act 2002. The Local<br />
Government (<strong>Auckland</strong>) Amendment Act 2004 defines the <strong>Auckland</strong> Regional Council (ARC) as the sole<br />
shareholder of <strong>ARTA</strong>.<br />
The financial statements are for the year ended 30 June <strong>2009</strong> and were authorised for issue by the Board<br />
of <strong>ARTA</strong> on 26 August <strong>2009</strong>.<br />
Basis of Preparation<br />
These financial statements have been prepared in accordance with section 69(2) of the Local Government<br />
Act 2002, which requires the financial statements to comply with generally accepted accounting practice<br />
(NZ GAAP).<br />
These financial statements have been prepared in accordance with NZ GAAP. They comply with New<br />
Zealand equivalents to International Financial <strong>Report</strong>ing Standards (NZ IFRS), and other applicable Financial<br />
<strong>Report</strong>ing Standards, as appropriate for public benefit entities.<br />
<strong>ARTA</strong> is designated a Public Benefit Entity for the purposes of NZ IFRS on the basis that the primary<br />
objective of <strong>ARTA</strong> is to provide goods or services for the community or social benefit, rather than making<br />
a financial return.<br />
Changes in Accounting Policy<br />
The accounting policies set out below have been applied consistently to all periods presented in these<br />
financial statements. There have been no changes in accounting policy since 30 June 2008.<br />
81
Standards, amendments and interpretations issued that are not yet effective and have<br />
not been early adopted<br />
NZ IAS1 (International Accounting Standard) Presentation of Financial Statements (revised 2007) replaces<br />
NZ IAS 1 Presentation of Financial Statements (issued 2004) and is effective for reporting periods beginning<br />
on or after 1 January <strong>2009</strong>. The revised NZ IAS1 requires an entity to present all owner changes in equity<br />
separate from non-owner changes in equity in a Statement of Changes in Equity. All non-owner changes in<br />
equity (i.e. comprehensive income) are required to be presented in one Statement of Comprehensive Income<br />
or in two statements (an Income Statement and a Statement of Comprehensive Income). Components of<br />
comprehensive income are not permitted to be presented in the Statement of Changes in Equity. <strong>ARTA</strong><br />
intends to adopt this standard for the year ending 30 June 2010, and will prepare two statements (an<br />
Income Statement and a separate Statement of Comprehensive Income). This is not expected to have a<br />
material effect on <strong>ARTA</strong>.<br />
NZ IAS23 Borrowing Costs (revised 2007) replaces NZ IAS23 Borrowing Costs (issued 2004) and is effective for<br />
reporting periods beginning on or after 1 January <strong>2009</strong>. The revised standard requires an entity to capitalise<br />
borrowing costs directly attributable to the acquisition, construction or production of a qualifying asset<br />
(one that takes a substantial period of time to get ready for use or sale) as part of the cost of the asset.<br />
The option of immediately expensing these borrowing costs has been removed. <strong>ARTA</strong> intends to adopt this<br />
standard for the year ending 30 June 2010. It is not expected to have a material impact on <strong>ARTA</strong> as <strong>ARTA</strong>’s<br />
rules prevent it from borrowing without the written permission of the ARC.<br />
NZ IFRS8 Operating Segments is effective for annual reporting periods beginning on or after 1 July <strong>2009</strong>.<br />
NZ IFRS8 makes compliance with the standard mandatory for non-qualifying profit-oriented entities and<br />
changes how operating segments are defined and their results disclosed in notes to the financial statements.<br />
<strong>ARTA</strong> intends to take up the exemption offered to public benefit entities not to apply this standard.<br />
Measurement Base<br />
The financial statements have been prepared on an historical cost basis, modified by the revaluation<br />
of certain assets and liabilities as identified in specific policies below. The financial statements are presented<br />
in New Zealand dollars.<br />
82
Revenue Recognition<br />
Revenue is measured at the fair value of consideration received or receivable.<br />
<strong>ARTA</strong> receives revenue from three main sources:<br />
• funding from the <strong>Auckland</strong> Regional Council (ARC);<br />
• subsidies from the New Zealand <strong>Transport</strong> Agency (NZTA);<br />
• fare box recovery from public transport users.<br />
<strong>Auckland</strong> Regional Council Funding<br />
<strong>ARTA</strong> is funded by its parent, the ARC, in order to deliver the agreed annual operational and capital<br />
programmes. This funding is recognised as income when the expenditure it covers is incurred, i.e. on an<br />
accrual basis. The ARC requires <strong>ARTA</strong> to report quarterly to the council finance committee on financial and<br />
non-financial performance and to comply with ARC group policies on expenditure.<br />
New Zealand <strong>Transport</strong> Agency Grants<br />
<strong>ARTA</strong> receives government grants from NZTA, which funds administration, operational and capital<br />
expenditure. Grants distributions from NZTA are recognised as income when the expenditure they<br />
cover is incurred, i.e. on an accrual basis. Sometimes there are conditions attached to grants provided.<br />
NZTA performs a biannual audit on <strong>ARTA</strong>’s processes and if they find an anomaly then <strong>ARTA</strong> is obliged<br />
to pay the relevant funds back.<br />
Fare Income<br />
<strong>ARTA</strong> receives fare box revenue from certain bus and ferry and all rail services. This revenue is recognised<br />
when the ticket is purchased.<br />
Grant Expenditure<br />
Non-discretionary grants are those grants that are awarded if the grant application meets the specified<br />
criteria and are recognised as expenditure when an application that meets the specified criteria for the<br />
grant has been received.<br />
Discretionary grants are those grants where <strong>ARTA</strong> has no obligation to award on receipt of the grant<br />
application and are recognised as expenditure when a successful applicant has been notified of<br />
<strong>ARTA</strong>’s decision.<br />
83
Public Equity<br />
Equity is the shareholder’s interest in the organisation and is measured as the difference between total<br />
assets and total liabilities. Equity is disaggregated and classified into accumulated funds and a capital<br />
grants reserve to enable clearer identification of the specified uses that the organisation makes of its<br />
accumulated surpluses.<br />
Financial Assets<br />
<strong>ARTA</strong> classifies its financial assets into the following categories:<br />
(i)<br />
Financial assets at fair value through profit or loss<br />
This category has two sub-categories: financial assets held for trading, and those designated at fair value<br />
through profit or loss on initial recognition. A financial asset is classified in this category if acquired<br />
principally for the purpose of selling in the short term or if so designated by management. The policy<br />
of management is to designate a financial asset if there exists the possibility it will be sold in the short<br />
term and the asset is subject to frequent changes in fair value. Derivatives are also categorised as held for<br />
trading unless they are designated as hedges. Assets in this category are classified as current assets if they<br />
are either held for trading or are expected to be realised within 12 months of the balance sheet date.<br />
(ii)<br />
Loans and receivables<br />
Loans and receivables are non-derivative financial assets with fixed or determinable payments that are<br />
not quoted in an active market. They arise when <strong>ARTA</strong> provides money, goods or services directly to a<br />
debtor with no intention of selling the receivable. They are included in current assets, except for those with<br />
maturities greater than 12 months after the balance sheet date which are classified as non-current assets.<br />
(iii)<br />
Financial assets at fair value through equity<br />
Financial assets at fair value through equity, comprising principally marketable equity securities, are nonderivatives<br />
that are either designated in this category or not classified in any of the other categories.<br />
They are included in non-current assets unless management intends to dispose of the investment within<br />
12 months of the balance sheet date.<br />
Financial assets at fair value through equity and financial assets at fair value through profit and loss are<br />
subsequently carried at fair value. Loans and receivables are carried at amortised cost using the effective<br />
interest method. Realised and unrealised gains and losses arising from changes in the fair value of the<br />
financial assets at fair value through profit or loss category are included in the income statement in the<br />
period in which they arise. Unrealised gains and losses arising from changes in the fair value of financial<br />
assets at fair value through equity are recognised in equity in the financial assets at fair value through<br />
equity revaluation reserve. When securities classified as financial assets at fair value through equity are sold<br />
or impaired, the accumulated fair value adjustments are included in the income statement.<br />
84
The fair values of quoted investments are based on current bid prices. If the market for a financial asset is<br />
not active (and for unlisted securities), the organisation establishes fair value by using valuation techniques.<br />
These include reference to the fair values of recent arm’s length transactions, involving the same instruments<br />
or other instruments that are substantially the same, discounted cash flow analysis, and option pricing<br />
models refined to reflect the issuer’s specific circumstances.<br />
Impairment of Financial Assets<br />
<strong>ARTA</strong> assesses at each balance date whether there is objective evidence that a financial asset or group of<br />
financial assets is impaired. In the case of equity securities classified as financial assets at fair value through<br />
equity, a significant or prolonged decline in the fair value of a security below its cost is considered in<br />
determining whether the security is impaired. If any such evidence exists for available-for-sale financial<br />
assets, the cumulative loss – measured as the difference between the acquisition cost and the current fair<br />
value, less any impairment loss on that financial asset previously recognised in profit and loss – is removed<br />
from equity and recognised in the income statement. Impairment losses recognised in the income statement<br />
on equity instruments are not reversed through the income statement.<br />
Cash and Cash Equivalents<br />
Cash and cash equivalents includes cash on hand, deposits held at call with banks, other short-term highly<br />
liquid investments with original maturities of three months or less that are readily convertible to known<br />
amounts of cash and which are subject to an insignificant risk of changes in value, and bank overdrafts.<br />
Bank overdrafts are shown within borrowings in current liabilities on the balance sheet.<br />
Accounting for Derivative Financial Instruments and Hedging Activities<br />
<strong>ARTA</strong> uses financial instruments to hedge exposure to foreign exchange. <strong>ARTA</strong> does not hold or issue<br />
derivative financial instruments for trading purposes.<br />
Derivatives are initially recognised at fair value on the date a derivative contract is entered into and are<br />
subsequently remeasured at their fair value at each balance date.<br />
The method of recognising the resulting gain or loss depends on whether the derivative is designated as a<br />
hedging instrument, and if so, the nature of the item being hedged. <strong>ARTA</strong> designates certain derivatives<br />
as either:<br />
• hedges of the fair value of recognised assets or liabilities or a firm commitment (fair value hedge); or<br />
• hedges of highly probable forecast transactions (cash flow hedge).<br />
85
<strong>ARTA</strong> documents at the inception of the transaction the relationship between hedging instruments<br />
and hedged items, as well as its risk management objective and strategy for undertaking various hedge<br />
transactions. <strong>ARTA</strong> also documents its assessment, both at hedge inception and on an ongoing basis, of<br />
whether the derivatives that are used in hedging transactions are highly effective in offsetting changes in<br />
fair values or cash flows of hedged items.<br />
The full fair value of hedging derivatives is classified as a non-current asset if the remaining maturity of the<br />
hedged item is more than 12 months and as a current asset if the remaining maturity of the hedged item is<br />
less than 12 months.<br />
• Fair value hedge<br />
The gain or loss from remeasuring the hedging instrument at fair value, along with the changes in the<br />
fair value on the hedged item attributable to the hedged risk, is recognised in the income statement.<br />
• Cashflow hedge<br />
The portion of the gain or loss on the hedging instrument that is determined to be an effective hedge is<br />
recognised directly in equity through the statement of changes in equity and the ineffective portion of<br />
the gain or loss on the hedging instrument is recognised in the income statement.<br />
If a hedge of a forecast transaction subsequently results in the recognition of a financial asset or a financial<br />
liability, the associated gains or losses that were recognised directly in equity will be reclassified into profit<br />
or loss in the same period or periods during which the asset acquired or liability assumed affects profit<br />
or loss. However, if <strong>ARTA</strong> expects that all or a portion of a loss recognised directly in equity will not be<br />
recovered in one or more future periods, it will reclassify into profit or loss the amount that is not expected<br />
to be recovered.<br />
When a hedge of a forecast transaction subsequently results in the recognition of a non-financial asset or<br />
a non-financial liability, or a forecast transaction for a non-financial asset or non-financial liability becomes<br />
a firm commitment for which fair value hedge accounting is applied, then the associated gains and losses<br />
that were recognised directly in equity will be included in the initial cost or carrying amount of the asset<br />
or liability.<br />
For cash flow hedges other than those covered above, amounts that had been recognised directly in equity<br />
will be recognised in profit or loss in the same periods during which the hedged forecast transaction affects<br />
profit or loss (for example, when a forecast sale occurs).<br />
86
If a hedging instrument expires or is sold, terminated, exercised or revoked, or it no longer meets the criteria<br />
for hedge accounting, the cumulative gain or loss on the hedging instrument that remains recognised<br />
directly in equity from the period when the hedge was effective will remain separately recognised in equity<br />
until the forecast transaction occurs. When the forecast transaction is no longer expected to occur, any<br />
related cumulative gain or loss on the hedging instrument that remains recognised directly in equity from<br />
the period when the hedge was effective will be recognised in the income statement.<br />
Trade and other receivables<br />
Trade and other receivables are initially measured at fair value and subsequently measured at amortised<br />
cost using the effective interest method, less any provision for impairment.<br />
Trade receivables are due for settlement not more than 30 days from the date of recognition.<br />
A provision for the impairment of receivables is established when there is objective evidence that <strong>ARTA</strong> will<br />
not be able to collect all amounts due according to the original terms of receivables. The amount of the<br />
provision is the difference between the asset’s carrying amount and the present value of estimated future<br />
cash flows, discounted using the effective interest method. Debts which are known to be uncollectible are<br />
written off during the period in which they are identified.<br />
Inventories<br />
Inventories such as spare parts, stores and finished goods are stated at the lower of cost and net realisable<br />
value. Cost comprises direct materials, direct labour and an appropriate proportion of variable and fixed<br />
overhead expenditure, the latter being allocated on the basis of normal operating capacity.<br />
Costs are assigned to individual items of inventory on the basis of weighted average cost.<br />
Net realisable value is the estimated selling price in the ordinary course of business, less the estimated costs<br />
of completion (if applicable) and the estimated costs necessary to make the sale.<br />
Property, Plant and Equipment<br />
Property, plant and equipment consists of operational assets including land and improvements, rolling<br />
stock, wharves, buildings, plant and equipment, and fixtures and fittings.<br />
Property, plant and equipment is valued at cost, less accumulated depreciation and impairment losses.<br />
(a)<br />
Additions and subsequent costs<br />
The cost of an item of property, plant and equipment is recognised as an asset if, and only if, it is probable<br />
that future economic benefits or service potential associated with the item will flow to <strong>ARTA</strong> and the cost<br />
of the item can be measured reliably.<br />
87
Items of property, plant and equipment are capitalised on the basis of the costs incurred to acquire, construct<br />
and bring to use the specific physical asset. Direct costs include payments to the supplier for the acquisition<br />
or construction of an asset, employee costs and an appropriate portion of relevant overheads. Costs that<br />
are directly associated with the acquisition and/or construction of the asset controlled by <strong>ARTA</strong>, and that<br />
will generate economic benefits exceeding costs beyond one year, are recognised as property, plant and<br />
equipment. These costs are depreciated over their estimated useful lives (see below for useful lives per class<br />
of asset).<br />
Costs associated with developing or maintaining property, plant and equipment are recognised as an<br />
expense as incurred.<br />
Where a physical asset is acquired for nil or nominal consideration, the fair value of the asset received is<br />
recognised as revenue. Subsequent costs are included in the asset’s carrying amount or recognised as a<br />
separate asset, as appropriate, only when it is probable that future economic benefits associated with the<br />
item will flow to <strong>ARTA</strong> and the cost of the items can be measured reliably.<br />
It is not the organisation’s policy to revalue property, plant and equipment.<br />
(b)<br />
Depreciation<br />
Land and assets under construction (work in progress) are not depreciated. Depreciation is provided<br />
for other assets on a straight line basis to write off the cost of each asset net of residual value over its<br />
useful life.<br />
The useful lives and associated depreciation rates of major classes of assets have been estimated<br />
as follows:<br />
Rolling Stock<br />
ADK carriage 6 years (16.67%)<br />
ADL carriage 10 years (10%)<br />
SA/SD carriage exterior 15 years (6.67%)<br />
SA/SD carriage interior 7.5 years (13.33%)<br />
SX carriages 2-6 years (16.67-50%)<br />
Locomotives (leasehold improvements) 15 years (6.67%)<br />
Wharves, Piers and Associated Assets<br />
Wharves and piers 10-50 years (2-10%)<br />
Signage 3-10 years (10-33%)<br />
Fencing 2-15 years (6.67-50%)<br />
88
Railway Stations and Associated Assets<br />
Structures 20-50 years (2-5%)<br />
Signage 3-10 years (10-33%)<br />
Fencing 2-15 years (6.67-50%)<br />
Plant, Machinery and Other Equipment<br />
Cycle lockers 5 years (20%)<br />
Furniture, fixtures and other equipment 5.5-15.5 years (6.4-18.2%)<br />
Low value assets 1 year (100%)<br />
Fibre optic cable 15.5 years (6.4%)<br />
The residual values and useful lives of assets are reviewed, and adjusted if appropriate, at each balance<br />
sheet date.<br />
(c)<br />
Disposals<br />
Gains and losses on disposals are determined by comparing proceeds with the carrying amount. These are<br />
included in the income statement.<br />
(d)<br />
Assets under construction<br />
Assets under construction are not depreciated. The total cost of a project is transferred to the relevant asset<br />
class on its completion and then depreciated.<br />
Intangible Assets<br />
(i)<br />
Computer software<br />
Acquired computer software and software licences are capitalised on the basis of the costs incurred to<br />
acquire and bring to use the specific software. These costs are amortised over their estimated useful lives<br />
of three to five years.<br />
Costs associated with developing or maintaining computer software are recognised as an expense<br />
as incurred. Costs that are directly associated with the production of identifiable and unique software<br />
products controlled by <strong>ARTA</strong>, and that will generate economic benefits exceeding costs beyond one<br />
year, are recognised as intangible assets. Direct costs include the software development, employee costs<br />
and an appropriate portion of relevant overheads. Computer software development costs recognised as<br />
assets are amortised over their estimated useful lives not exceeding three years.<br />
89
ii)<br />
Operating leases – Land<br />
The operating leases on land are donated assets. They are recognised in the accounts at fair value and<br />
amortised over the life of the underlying leases.<br />
Amortisation of Intangible Assets<br />
The carrying value of an intangible asset with a finite life is amortised on a straight line basis over its<br />
useful life.<br />
Amortisation begins when the asset is available for use and ceases at the date the asset is derecognised.<br />
The amortisation charge for each period is recognised in the income statement.<br />
The useful lives and associated amortisation rate of major classes of intangible assets have been estimated<br />
as follows:<br />
Computer software 3 years (33.3%)<br />
Operational leases 63 years (1.6%)<br />
Impairment of Non-Financial Assets<br />
Assets that are subject to amortisation or depreciation are reviewed for impairment whenever events or<br />
changes in circumstances indicate that the carrying amount may not be recoverable or at each balance<br />
sheet date. An impairment loss is recognised for the amount by which the asset’s carrying amount exceeds<br />
its recoverable amount. The recoverable amount is the higher of an asset’s fair value less costs to sell and<br />
value in use. Where the future economic benefits of an asset are not primarily dependent on the asset’s<br />
ability to generate net cash inflows, and where <strong>ARTA</strong> would, if deprived of the asset, replace its remaining<br />
future economic benefits, value in use is determined as the depreciated replacement cost of the asset.<br />
For the purposes of assessing impairment, assets are grouped at the lowest levels for which there are<br />
separately identifiable cash flows.<br />
If an asset’s carrying amount exceeds its recoverable amount, the asset is impaired and the carrying<br />
amount is written down to the recoverable amount. The total impairment loss is recognised in the<br />
income statement.<br />
Assets that have an indefinite useful life are not subject to amortisation and are tested annually<br />
for impairment.<br />
90
Trade and Other Payables<br />
These amounts represent liabilities for goods and services, provided to <strong>ARTA</strong> prior to the end of the<br />
financial year, which are unpaid. The amounts are unsecured and are usually paid within 30 days<br />
of recognition.<br />
Employee Benefits<br />
(i)<br />
Short-term benefits<br />
Liabilities for wages and salaries, including non-monetary benefits, annual leave, accumulating sick leave<br />
and other benefits expected to be settled within 12 months of the reporting date are recognised and are<br />
measured at the amounts expected to be paid when the liabilities are settled.<br />
<strong>ARTA</strong> recognises a liability for sick leave to the extent that absences in the coming year are expected to<br />
be greater than the sick leave entitlements earned in the coming year. The amount is calculated based on<br />
the unused sick leave entitlement that can be carried forward at balance date, to the extent that <strong>ARTA</strong><br />
anticipates it will be used by staff to cover those future absences.<br />
<strong>ARTA</strong> recognises a liability and an expense for bonuses where contractually obliged or where there is a past<br />
practice that has created a constructive obligation.<br />
(ii)<br />
Long-term benefits<br />
Entitlements that are payable beyond 12 months, such as long service leave and gratuities, have been<br />
calculated on an actuarial basis. The calculations are based on:<br />
• likely future entitlements accruing to staff, based on years of service, years to entitlement,<br />
the likelihood that staff will reach the point of entitlement and contractual entitlements<br />
information; and<br />
• the present value of the estimated future cash flows. A discount rate of 6.85%, and an inflation<br />
factor of 3.5% were used. The discount rate is based on bank interest rates with terms to maturity<br />
similar to those of the relevant liabilities. The inflation factor is based on the expected long-term<br />
increase in remuneration for employees.<br />
91
Leases<br />
Finance Leases<br />
A finance lease is a lease that transfers to the lessee substantially all the risks and rewards incidental to<br />
ownership of an asset, whether or not title is eventually transferred.<br />
At the commencement of the lease term, <strong>ARTA</strong> recognises finance leases as assets and liabilities in<br />
the balance sheet at the lower of the fair value of the leased item or the present value of the minimum<br />
lease payments.<br />
The amount recognised as an asset is depreciated over its useful life. If there is no certainty as to whether<br />
<strong>ARTA</strong> will obtain ownership at the end of the lease term, the asset is fully depreciated over the shorter of<br />
the lease term and its useful life.<br />
Operating Leases<br />
Leases where the lessor effectively retains substantially all the risks and benefits of ownership of the leased<br />
items are classified as operating leases. Payments under these leases are charged as expenses in the periods<br />
in which they are incurred.<br />
Income Tax<br />
<strong>ARTA</strong> is a local authority for income tax purposes but does not currently derive any income from taxable<br />
sources, except for port-related activities as defined in the Income Tax Act 2007.<br />
Income tax expense comprises both current tax and deferred tax, and is calculated using tax rates that have<br />
been enacted or substantively enacted by balance date.<br />
Current tax is the amount of income tax payable based on the taxable profit for the current year, and any<br />
adjustments to income tax payable in respect of prior years.<br />
Deferred tax is the amount of income tax payable or recoverable in future periods in respect of temporary<br />
differences and unused tax losses. Temporary differences are differences between the carrying amount of<br />
assets and liabilities in the financial statements and the corresponding tax bases used in the computation<br />
of taxable profit.<br />
Deferred tax liabilities are generally recognised for all taxable temporary differences. Deferred tax assets<br />
are recognised to the extent that it is probable that taxable profits will be available against which the<br />
deductible temporary differences or tax losses can be utilised.<br />
Deferred tax is not recognised if the temporary difference arises from the initial recognition of goodwill or<br />
from the initial recognition of an asset and liability in a transaction that is not a business combination, and<br />
at the time of the transaction, affects neither accounting profit nor taxable profit.<br />
92
Deferred tax is recognised on taxable temporary differences arising on investments in subsidiaries<br />
and associates, and interests in joint ventures, except where the company can control the reversal of<br />
the temporary difference and it is probable that the temporary difference will not reverse in the<br />
foreseeable future.<br />
The measurement of deferred tax reflects the tax consequences that would follow from the manner in<br />
which the entity expects to recover or settle the carrying amount of its assets and liabilities.<br />
Income tax expense is charged or credited to profit or loss, except when it relates to items charged or<br />
credited directly to equity, in which case the tax is dealt with in equity.<br />
Goods and Services Tax (GST)<br />
All items in the financial statements are stated exclusive of GST, except for receivables and payables, which<br />
are stated on a GST inclusive basis. Where GST is not recoverable as input tax then it is recognised as part<br />
of the related asset or expense.<br />
The net amount of GST recoverable from, or payable to, the Inland Revenue Department (IRD) is included<br />
as part of receivables or payables in the statement of financial position.<br />
The net GST paid to, or received from the IRD, including the GST relating to investing and financing activities,<br />
is classified as an operating cash flow in the statement of cash flows.<br />
Commitments and contingencies are disclosed exclusive of GST.<br />
Functional and Presentation Currency and Foreign Currency Translation<br />
The financial statements are presented in New Zealand dollars and all values are rounded to the nearest<br />
thousand dollars ($’000). The functional currency of <strong>ARTA</strong> is New Zealand dollars.<br />
Foreign currency transactions are translated into the functional currency using the exchange rates<br />
prevailing at the dates of the transactions. Foreign exchange gains and losses resulting from the settlement<br />
of such transactions and from the translation at year end exchange rates of monetary assets and liabilities<br />
denominated in foreign currencies are recognised in the income statement, except when deferred in equity<br />
as qualifying cash flow hedges and qualifying net investment hedges.<br />
Translation differences on non-monetary items, such as equities held at fair value through profit or loss,<br />
are reported as part of the fair value gain or loss. Translation differences on non-monetary items, such as<br />
equities classified as available-for-sale financial assets, are included in the fair value reserve in equity.<br />
93
Provisions<br />
Provisions are recognised when <strong>ARTA</strong> has a present legal or constructive obligation as a result of past<br />
events; it is more likely than not that an outflow of resources will be required to settle the obligation; and<br />
the amount has been reliably estimated. Provisions are not recognised for future operating losses.<br />
Where there are a number of similar obligations, the likelihood that an outflow will be required in<br />
settlement is determined by considering the class of obligations as a whole. A provision is recognised even<br />
if the likelihood of an outflow with respect to any one item included in the same class of obligations may<br />
be small.<br />
Provisions are measured at the present value of the expenditures expected to be required to settle the<br />
obligation using a pre-tax discount rate that reflects current market assessments of the time value of money<br />
and the risks specific to the obligation. The increase in the provision due to the passage of time is recognised<br />
as a finance cost.<br />
Critical Accounting Estimates and Assumptions<br />
In preparing these financial statements <strong>ARTA</strong> has made estimates and assumptions concerning the future.<br />
These estimates and assumptions may differ from the subsequent actual results. Estimates and judgements<br />
are continually evaluated and are based on historical experience and other factors, including expectations<br />
or future events that are believed to be reasonable under the circumstances. The estimates and assumptions<br />
that have a significant risk of causing a material adjustment to the carrying amounts of assets and liabilities<br />
within the next financial year are discussed below:<br />
Rolling Stock Assets<br />
There are a number of assumptions and estimates used when performing an impairment review over<br />
rolling stock. These include:<br />
• the physical deterioration and condition of an asset. This risk is minimised by <strong>ARTA</strong> (or its agent)<br />
performing a combination of physical inspections and condition modelling assessments<br />
• estimating any obsolescence or surplus capacity of an asset; and<br />
• estimates are made when determining the remaining useful lives over which the asset will be depreciated.<br />
If useful lives do not reflect the actual consumption of the benefits of the asset, then <strong>ARTA</strong> could be over<br />
or under-estimating the annual depreciation charge recognised as an expense in the income statement.<br />
To minimise this risk asset inspections, deterioration and condition modelling are carried out regularly as<br />
part of <strong>ARTA</strong>’s asset management planning activities, which gives <strong>ARTA</strong> further assurance over its useful<br />
life estimates.<br />
94
FINANCIAL STATEMENTS<br />
Income Statement for the year ended 30 June <strong>2009</strong><br />
Actual Plan Actual<br />
<strong>2009</strong> <strong>2009</strong> 2008<br />
Note $000 $000 $000<br />
Income 1<br />
Operational grants 202,322 196,883 173,696<br />
Capital grants 73,880 98,375 61,859<br />
Fare revenue 22,764 22,962 20,198<br />
Other operating revenue 4,587 3,245 4,604<br />
Donated assets 0 0 72,829<br />
Total Income 303,553 321,465 333,185<br />
Expenditure 2<br />
Employee benefits 11,929 11,992 9,816<br />
Depreciation and amortisation expense 18,221 16,092 12,491<br />
Grants and subsidies 176,755 177,970 149,200<br />
Other expenditure 40,510 30,235 40,075<br />
Total Operating Expenditure 247,415 236,289 211,582<br />
Surplus before tax 56,138 85,176 121,603<br />
Income tax (expense)/benefit 20 (440) 213 193<br />
Surplus after tax attributable to the authority 55,698 85,389 121,796<br />
Note: The net surplus for the <strong>2009</strong> year primarily represents capital grants for the year offset by the annual<br />
depreciation charge. Generally Accepted Accounting Practice requires that capital grants are recognised in<br />
the year in which they are received. The capital expenditure they fund is recorded as fixed assets on the<br />
balance sheet.<br />
The 2008 surplus also included the discount on acquisition relating to a business combination (see note 18).<br />
The accounting policies on pages 81 to 94 and the notes on pages 100 to 120 form part of, and should be<br />
read in conjunction with, these financial statements.<br />
95
Statement Of Changes in Equity For the year ended 30 June<br />
<strong>2009</strong><br />
Actual Plan Actual<br />
<strong>2009</strong> <strong>2009</strong> 2008<br />
Note $000 $000 $000<br />
Equity at the beginning of the year 210,252 210,252 88,456<br />
Net surplus for the year 55,698 85,389 121,796<br />
Equity at the end of the year 3 265,950 295,641 210,252<br />
The accounting policies on pages 81 to 94 and the notes on pages 100 to 120 form part of, and should be<br />
read in conjunction with, these financial statements.<br />
96
Balance Sheet As at 30 June <strong>2009</strong><br />
Actual Plan Actual<br />
<strong>2009</strong> <strong>2009</strong> 2008<br />
Note $000 $000 $000<br />
ASSETS<br />
Current Assets<br />
Cash and cash equivalents 4 105 250 148<br />
Trade and other receivables 5 43,357 58,550 50,543<br />
Loans and receivables 9 19,819 16,251 18,802<br />
Inventories 19 5,126 3,096 3,096<br />
Total Current Assets 68,407 78,147 72,589<br />
Non-current Assets<br />
Property, plant and equipment 7 240,125 266,191 185,835<br />
Loans and receivables 9 1,152 0 8,470<br />
Intangible assets 8 22,152 22,160 22,508<br />
Total Non-current Assets 263,429 288,351 216,813<br />
TOTAL ASSETS 331,836 366,498 289,402<br />
LIABILITIES<br />
Current Liabilities<br />
Trade and other payables 6 39,540 49,884 46,943<br />
Other financial liabilities 9 19,819 16,251 18,802<br />
Total Current Liabilities 59,359 66,135 65,745<br />
Non-current Liabilities<br />
Other financial liabilities 9 1,152 0 8,470<br />
Deferred tax 20 5,375 4,722 4,935<br />
Total Non-current Liabilities 6,527 4,722 13,405<br />
TOTAL LIABILITIES 65,886 70,857 79,150<br />
Public Equity<br />
Accumulated funds 3 4,266 4,792 5,163<br />
Capital Grants Reserve 3 261,684 290,849 205,089<br />
TOTAL EQUITY 265,950 295,641 210,252<br />
TOTAL LIABILITIES AND EQUITY 331,836 366,498 289,402<br />
Rabin Rabindran<br />
Chairman<br />
<strong>Auckland</strong> Regional <strong>Transport</strong> Authority<br />
Peter Brothers<br />
Director<br />
<strong>Auckland</strong> Regional <strong>Transport</strong> Authority<br />
The accounting policies on pages 81 to 94 and the notes on pages 100 to 120 form part of, and should be<br />
read in conjunction with, these financial statements.<br />
97
Statement Of Cash Flows For the year ended 30 June <strong>2009</strong><br />
Actual Plan Actual<br />
<strong>2009</strong> <strong>2009</strong> 2008<br />
Note $000 $000 $000<br />
Cash Flows from Operating Activities 11<br />
Cash was provided from:<br />
ARC Opex Grants 101,531 89,737 66,415<br />
ARC Capex Grants 70,771 85,252 57,533<br />
ARC funding for IA grants vested in <strong>ARTA</strong> 7,711 11,021 26,545<br />
NZTA Capex Grants 4,457 12,914 5,028<br />
NZTA Opex Grants 104,750 99,501 85,402<br />
Other grants and subsidies 1,350 1,373 1,331<br />
Rail fare revenue 18,625 18,928 16,573<br />
Bus fare revenue 4,436 3,917 3,322<br />
Ferry wharf revenue 1,998 1,912 1,471<br />
Other sundry operating income 252 4 150<br />
315,881 324,557 263,770<br />
Cash was applied to:<br />
Payments to suppliers 222,913 205,243 169,636<br />
Payments to employees 12,724 11,907 10,521<br />
Payments to recipients of IA grants vested in <strong>ARTA</strong> 7,711 11,021 26,251<br />
GST 184 184 0<br />
243,532 228,355 206,408<br />
Net Cash Flows from Operating Activities 72,349 96,202 57,362<br />
Cash Flows from Investing Activities<br />
Cash was applied to:<br />
Purchase and development of property, plant & equipment 72,210 96,100 57,427<br />
Purchase and development of intangible assets 182 0 110<br />
72,392 96,100 57,537<br />
Net Cash Flows from Investing Activities (72,392) (96,100) (57,537)<br />
Net (Decrease)/Increase in Cash & Cash Equivalents Held (43) 102 (175)<br />
Cash & Cash Equivalents Balances at beginning of the year 148 148 323<br />
Cash & Cash Equivalents Balances at the end of the year 105 250 148<br />
98
Reconciliation of Net Surplus with Net Cash Flows from Operating Activities<br />
Actual Plan Actual<br />
<strong>2009</strong> <strong>2009</strong> 2008<br />
$000 $000 $000<br />
Cash was provided from:<br />
Net Surplus 55,698 85,389 121,796<br />
Adjustment for items not involving cash:<br />
Depreciation and amortisation 18,221 16,092 11,937<br />
Loss/gain on sale of assets 236 0 554<br />
Donated assets 0 0 (77,957)<br />
Deferred tax 440 (213) 4,935<br />
Movements in working capital:<br />
Decrease/(Increase) in receivables from ARC 9,587 (6,179) (17,059)<br />
Decrease/(Increase) in trade and other receivables (1,907) (1,827) (6,702)<br />
Decrease/(Increase) in inventory (2,030) 0 (3,096)<br />
Decrease/(Increase) in GST (678) (184) 807<br />
Decrease/(Increase) in grants receivable from ARC 7,711 11,021 26,545<br />
(Decrease)/Increase in trade and other payables (7,218) 3,124 21,854<br />
(Decrease)/Increase in grants payable (7,711) (11,021) (26,251)<br />
Net Cash from Operating Activities 72,349 96,202 57,362<br />
The accounting policies on pages 81 to 94 and the notes on pages 100 to 120 form part of, and should be<br />
read in conjunction with, these financial statements.<br />
99
NOTES TO THE FINANCIAL STATEMENTS<br />
1 INCOME<br />
<strong>2009</strong> 2008<br />
$000 $000<br />
ARC Opex Grants 93,164 83,474<br />
ARC Capex Grants 69,508 56,123<br />
NZTA Opex Grants 109,158 90,222<br />
NZTA Capex Grants 4,373 5,735<br />
Other grants and subsidies 2,374 2,884<br />
Rail fare revenue 18,281 16,778<br />
Bus fare revenue 4,482 3,420<br />
Ferry wharf revenue 2,009 1,568<br />
Other operating income 204 152<br />
Donated assets (discount on acquisition) 0 72,829<br />
Revenue 303,553 333,185<br />
2 EXPENDITURE<br />
<strong>2009</strong> 2008<br />
$000 $000<br />
Expenses include:<br />
Audit fees - for financial statement audit 99 89<br />
- for assurance and related services (a) 8 22<br />
Depreciation/amortisation 18,221 12,491<br />
Directors’ fees 372 357<br />
Capital expenditure grants to third parties (b) 0 5,012<br />
Employee benefit expense (see also note 17) 11,929 9,816<br />
Grants and subsidies 176,755 149,200<br />
Foreign exchange gains or losses 0 0<br />
Impairment of receivables 0 0<br />
Impairment of property, plant and equipment 0 0<br />
Rental and operating lease costs 9,450 8,388<br />
Research and development 0 0<br />
Other expenses 30,581 26,206<br />
Total operating expenses 247,415 211,582<br />
(a) The auditor completed assurance engagements over the Authority’s tender processes and consultation<br />
processes<br />
(b) This represents capital grants from <strong>ARTA</strong>’s Capex programme made by <strong>ARTA</strong> to third parties where <strong>ARTA</strong><br />
is entitled to, and recognises, the associated grant funding.<br />
100
Key Management Personnel Compensation<br />
Members of <strong>ARTA</strong>’s executive team (including the CEO and General Managers) and <strong>ARTA</strong> directors received<br />
an aggregated total of $1,759,355 in <strong>2009</strong> and $1,500,047 in 2008.<br />
ALL EMPLOYEES RECEIVING >$100,000 <strong>2009</strong> 2008<br />
$100,001 - $110,000 7 5<br />
$110,001 - $120,000 7 2<br />
$120,001 - $130,000 3 2<br />
$130,001 - $140,000 4 6<br />
$140,001 - $150,000 4 4<br />
$150,001 - $160,000 2 1<br />
$160,001 - $170,000<br />
$170,001 - $180,000 2<br />
$190,001 - $200,000 2<br />
$210,001 - $220,000 1 1<br />
$220,001 - $230,000 1 1<br />
$240,001 - $250,000 1<br />
$250,001 - $260,000<br />
$310,001 - $320,000 2 1<br />
$320,001 - $330,000<br />
$330,001 - $340,000<br />
$340,001 - $350,000<br />
$350,001 - $360,000 1<br />
<strong>2009</strong> 2008<br />
Directors’ Fees $000 $000<br />
Mark Ford (Chairman until 31 May <strong>2009</strong>) 73 80<br />
Rabin Rabindran (Deputy Chairman and Chair of Risk & Assurance Committee 53 50<br />
until 31 May <strong>2009</strong>, Chairman June <strong>2009</strong>)<br />
Adrienne Young Cooper (Deputy Chairman June <strong>2009</strong>) 36 35<br />
Peter Brothers (Chairman Risk & Assurance Committee June <strong>2009</strong>) 35 35<br />
Gary Taylor 35 35<br />
Mike Williams 35 35<br />
Mark Benjamin 35 29<br />
Andrew Buxton 35 29<br />
Anthony Marks 35 29<br />
372 357<br />
101
3 Public Equity<br />
<strong>2009</strong> <strong>2009</strong> 2008 2008<br />
$000 $000 $000 $000<br />
Retained Capital Grants Retained Capital Grants<br />
Earnings Reserve Earnings Reserve<br />
Opening balance 5,163 205,089 5,320 83,136<br />
Surplus for the year 55,698 0 121,796 0<br />
Transfers (to)/from other reserves (56,595) 56,595 (121,953) 121,953<br />
Closing balance 4,266 261,684 5,163 205,089<br />
The Capital Grants Reserve is an accounting reserve that represents capital expenditure grants that have not<br />
yet been offset by an associated depreciation charge.<br />
4 Cash and Cash Equivalents<br />
<strong>2009</strong> 2008<br />
$000 $000<br />
Cash at bank and on hand 105 148<br />
Total cash and cash equivalents 105 148<br />
The carrying value of cash and cash equivalents equals their fair value.<br />
Cash, cash equivalents and bank overdrafts include the following for the purposes of the statement of cash<br />
flows:<br />
Cash at bank and on hand 105 148<br />
Total 105 148<br />
102
5 Trade and Other Receivables<br />
<strong>2009</strong> 2008<br />
$000 $000<br />
Trade debtors 553 468<br />
Less: Provision for impairment 0 0<br />
Net trade debtors 553 468<br />
Other receivables:<br />
Receivables from related parties – ARC 28,975 38,562<br />
Accrued income 13,335 11,498<br />
Prepayments 0 15<br />
GST receivable 494 0<br />
Total trade and other receivables 43,357 50,543<br />
Debtors and other receivables are non-interest bearing and receipt is normally on 30 day terms, therefore,<br />
the carrying value approximates their fair value.<br />
<strong>2009</strong> – 93% of trade receivables are 30 days or less, 3% are 60 days, 4% are 90 days or over.<br />
2008 – 66% of trade receivables are 30 days or less, 12% are 60 days, 22% are at 90 days or over.<br />
Impaired Receivables – Trade<br />
In <strong>2009</strong> there is no impairment of trade or other receivables and as such there is no impairment provision.<br />
In 2008 there was no impairment of trade or other receivables and as such there was no impairment provision.<br />
103
Past Due But Not Impaired – Trade<br />
As at 30 June <strong>2009</strong> trade receivables of $40,000 (2008: $162,000) were past due but not impaired. These relate<br />
to a number of independent customers for whom there is no recent history of default. The Organisation<br />
took legal advice regarding the balance in 2008 that was over 90 days, and this has been collected in full<br />
during the <strong>2009</strong> year.<br />
The aging analysis of these trade receivables is as follows:<br />
<strong>2009</strong> 2008<br />
$000 $000<br />
Past due 1-3 months 22 59<br />
Past due 3-6 months 17 76<br />
Past due >6 months 1 27<br />
Total trade receivables past due but not impaired 40 162<br />
Total current trade receivables 553 468<br />
Total impaired receivables 0 0<br />
Total trade receivables 553 468<br />
<strong>ARTA</strong> holds no collateral as security or other credit enhancements over receivables that are past due.<br />
The other classes of receivables do not contain impaired or past due assets.<br />
Bad debts<br />
<strong>ARTA</strong> has not recognised a loss in respect of bad debts (2008: $0).<br />
6 Trade and Other Payables <strong>2009</strong>/2008<br />
<strong>2009</strong> 2008<br />
$000 $000<br />
Trade creditors 7,035 8,087<br />
Employee benefit liabilities (see note 17) 1,025 850<br />
Accrued expenditure 31,421 34,740<br />
Withholding tax payable 0 5<br />
Deferred income 59 3,076<br />
GST payable 0 185<br />
Total trade and other payables 39,540 46,943<br />
Trade and other payables are non-interest bearing and are normally settled on 30-day terms, therefore the<br />
carrying value of these payables approximates their fair value.<br />
104
7 Property, plant and equipment<br />
Accumulated<br />
depreciation & Carrying Transfer Carrying<br />
Cost impairment amount from Depreciation Impairment amount<br />
1/7/07 1/7/07 1/7/07 Additions Disposals WIP expense losses 30/6/08<br />
2008 $000 $000 $000 $000 $000 $000 $000 $000 $000<br />
Rolling Stock<br />
- completed capital projects 88,869 15,876 72,993 4,135 278 10,342 66,508<br />
- work in progress 5,479 5,479 35,187 4,135 36,531<br />
Railway Stations and Buildings<br />
- completed capital projects 3,897 7 3,890 18,503 495 21,898<br />
- work in progress 2,147 2,147 13,490 6,845 8,792<br />
Wharves and Wharf Structures<br />
- completed capital projects 19,709 555 19,154<br />
- work in progress 1,997 1,997<br />
Plant, Mach & Other Equip<br />
- completed capital projects 172 15 157 10,815 764 10,207<br />
- work in progress 464 464 7,646 276 2,137 5,698<br />
Land (finance lease) 15,050 15,050<br />
Total property, plant<br />
and equipment 101,028 15,898 85,130 126,532 554 13,117 12,156 0 185,835<br />
105
Accumulated<br />
depreciation & Carrying Transfer Carrying<br />
Cost impairment amount from Depreciation Impairment amount<br />
1/7/08 1/7/08 1/7/08 Additions Disposals WIP expense losses 30/6/09<br />
<strong>2009</strong> $000 $000 $000 $000 $000 $000 $000 $000 $000<br />
Rolling Stock<br />
- completed capital projects 92,726 26,218 66,508 36,467 13,713 89,263<br />
- work in progress 36,531 0 36,531 38,787 36,467 38,852<br />
Railway Stations and Buildings<br />
- completed capital projects 22,400 502 21,898 6,204 254 1,091 26,756<br />
- work in progress 8,792 0 8,792 25,993 6,204 28,581<br />
Wharves and Wharf Structures<br />
- completed capital projects 19,709 555 19,154 1,896 761 20,289<br />
- work in progress 1,997 0 1,997 4,241 1,896 4,342<br />
Plant, Mach & Other Equipment<br />
- completed capital projects 10,986 779 10,207 8,119 3 2,118 16,205<br />
- work in progress 5,698 0 5,698 3,529 8,439 788<br />
Land (finance lease) 15,050 15,050 15,050<br />
Total property, plant<br />
and equipment 213,889 28,054 185,835 125,236 257 53,006 17,683 0 240,125<br />
106
The finance leases (see Land (finance lease) above) over the Downtown Ferry Terminal waterspace and land<br />
are for an indefinite lease term until such time as <strong>ARTA</strong> does not comply with the required and permitted<br />
use clauses in the finance leases. The land subject to these leases is therefore recognised at its fair value until<br />
such time as the leases are not to be renewed in perpetuity.<br />
No classes of property, plant and equipment were revalued during the financial year (2008: $nil).<br />
No impairment losses have been recognised during the financial year (2008: $nil).<br />
There is no restricted property, plant or equipment, nor has any property, plant and equipment been<br />
pledged as security for liabilities.<br />
The net carrying amount of land held under finance lease is $15,050,000 (2008: $15,050,000).<br />
107
8 Intangible Assets<br />
Accumulated<br />
amortisation & Carrying Transfer Carrying<br />
Cost impairment amount from Amortisation Impairment amount<br />
1/7/07 1/7/07 1/7/07 Additions Disposals WIP charge losses 30/6/08<br />
2008 $000 $000 $000 $000 $000 $000 $000 $000 $000<br />
Software Development<br />
- completed capital projects 321 67 254<br />
- work in progress 211 211 110 321 0<br />
Operating Lease 0<br />
- land 22,522 268 22,254<br />
Total intangible assets 211 0 211 22,953 0 321 335 0 22,508<br />
Accumulated<br />
amortisation & Carrying Transfer Carrying<br />
Cost impairment amount from Amortisation Impairment amount<br />
1/7/08 1/7/08 1/7/08 Additions Disposals WIP charge losses 30/6/09<br />
<strong>2009</strong> $000 $000 $000 $000 $000 $000 $000 $000 $000<br />
Software Development<br />
- completed capital projects 321 67 254 147 181 220<br />
- work in progress 0 0 0 183 147 36<br />
Operating Lease<br />
- land 22,522 268 22,254 357 21,896<br />
Total intangible assets 22,843 335 22,508 330 0 147 538 0 22,152<br />
108
The operating lease intangible has been recognised at its fair value on acquisition and is being amortised<br />
over the period of the underlying lease (63 years).<br />
This lease is for the land at each of the railway station sites along the <strong>Auckland</strong> passenger rail network.<br />
There are no restrictions over the title of <strong>ARTA</strong>’s intangible assets, nor are any intangible assets pledged as<br />
security for liabilities.<br />
No impairment losses have been recognised during the financial year (2008: $nil). However, government<br />
announcements regarding a possible transfer of ownership of rolling stock may give rise to an external<br />
indicator of potential impairment. It is too early to accurately judge the impact this indicator will have on<br />
the organisation and therefore <strong>ARTA</strong> is unable to quantify any potential impact at this time.<br />
9 Financial Assets and Liabilities<br />
a) Financial assets at fair value through profit or loss.<br />
Currently, <strong>ARTA</strong> does not hold any financial assets in this category.<br />
b) Loans and receivables.<br />
This category of financial assets consists of both current and non-current grants receivable from the ARC –<br />
these represent the balance of grants receivable from the ARC assumed from Infrastructure <strong>Auckland</strong>, cash<br />
and cash equivalents and debtors and receivables.<br />
The carrying amounts of current grants receivable within one year approximate their fair value.<br />
Non-current grants receivable are not fair-valued but stated at amount payable and the difference between<br />
fair value and amount payable is immaterial.<br />
TRANSPORT GRANTS<br />
RECEIVABLE FROM THE ARC<br />
Fair values<br />
<strong>2009</strong> $000<br />
Fair values<br />
2008 $000<br />
Amt receivable<br />
<strong>2009</strong> $000<br />
Amt receivable<br />
2008 $000<br />
07/08 0 0 0 0<br />
08/09 – current 19,819 18,802 19,819 18,802<br />
09/10 – non-current 1,152 8,470 1,152 9,880<br />
10/11 – non-current 0 0 0 0<br />
There were no impairment provisions for loans and receivables. None of the grants are either past due or<br />
impaired.<br />
c) Other financial liabilities at amortised cost.<br />
This category of financial assets consists of both current and non-current grants payable under <strong>ARTA</strong>’s<br />
obligations assumed from Infrastructure <strong>Auckland</strong> and creditors and payables.<br />
The carrying amounts of current grants payable within one year approximate their fair value.<br />
Non-current grants payable are not fair-valued but stated at amount payable and the difference between<br />
fair value and amount payable is immaterial.<br />
109
TRANSPORT GRANTS<br />
PAYABLE<br />
Fair values<br />
<strong>2009</strong> $000<br />
Fair values<br />
2008 $000<br />
Amt payable<br />
<strong>2009</strong> $000<br />
Amt payable<br />
2008 $000<br />
07/08 0 0 0 0<br />
08/09 – current 19,819 18,802 19,819 18,802<br />
09/10 – non- current 1,152 8,470 1,152 9,880<br />
10/11 – non-current 0 0 0 0<br />
10 Financial Instrument Risks<br />
<strong>ARTA</strong> and the ARC have a series of policies to manage the risks associated with financial instruments. <strong>ARTA</strong><br />
is risk averse and seeks to minimise exposure from its treasury activities. <strong>ARTA</strong> outsources its treasury<br />
management to the ARC under the Support Services Agreement and has established a treasury policy. This<br />
policy does not allow any transactions that are speculative in nature to be entered into.<br />
Section 3.1 of the rules of <strong>ARTA</strong> prevent <strong>ARTA</strong> from entering into any material transaction (including any<br />
transaction that has or is likely to have the effect of <strong>ARTA</strong> acquiring rights or incurring obligations which<br />
are likely to have a material adverse effect on the financial performance or position of the ARC) without the<br />
prior written approval of the ARC.<br />
Market Risk<br />
- Interest Rate Risk<br />
Fair value interest rate risk is the risk that the value of a financial instrument will fluctuate due to changes<br />
in market interest rates.<br />
Borrowings and investments listed at fixed rates of interest expose <strong>ARTA</strong> to fair value interest rate risk.<br />
<strong>ARTA</strong> currently has no fixed rate borrowings or investments.<br />
Cash flow interest rate risk is the risk that cash flows from a financial instrument will fluctuate because of<br />
changes in market interest rates.<br />
Borrowings and investments issued at variable interest rates expose <strong>ARTA</strong> to cash flow interest rate.<br />
110
<strong>ARTA</strong> currently has no variable rate borrowings. As at the reporting date <strong>ARTA</strong> had the following variable<br />
rate cash and bank investments:<br />
Weighted Average Interest Rate 2008 Total<br />
Cash and bank investments 5% 148<br />
148<br />
Weighted Average Interest Rate <strong>2009</strong> Total<br />
Cash and bank investments 6.27% 105<br />
105<br />
- Price Risk<br />
Price risk is the risk that the fair value or future cash flows of a financial instrument will fluctuate as a result<br />
of changes in market prices.<br />
<strong>ARTA</strong> is not exposed to any significant price risk. The ARC manages group price risk by diversification of the<br />
group’s investment portfolio.<br />
- Currency Risk<br />
Currency risk is the risk that the fair value or future cash flows of a financial instrument will fluctuate due<br />
to changes in foreign exchange rates.<br />
From time to time <strong>ARTA</strong> purchases professional services and plant and equipment associated with the<br />
construction of certain infrastructural assets from overseas which require it to enter into transactions<br />
denominated in foreign currencies. As a result of these activities, exposure to currency risk may arise.<br />
It is <strong>ARTA</strong>’s policy to manage foreign currency risks arising from contractual commitments and liabilities<br />
that are above specified amounts by entering into forward foreign exchange contracts to hedge the foreign<br />
currency risk exposure. This means <strong>ARTA</strong> is able to fix the New Zealand dollar amount payable prior to<br />
delivery of the plant and equipment from overseas. These currency/treasury transactions are managed at<br />
group level by the ARC.<br />
The ARC manages <strong>ARTA</strong>’s currency risk by:<br />
• establishing a foreign currency hedging policy for each foreign currency denominated asset; and<br />
• specifying the bounds within which each Fund Manager may take on currency exposures relative to their<br />
benchmark; and<br />
• engaging one or more currency execution agents to transact the foreign currency exchange transactions,<br />
including both spot and forward transactions, at the most favourable rate.<br />
111
The instruments Fund Managers may use, and the credit worthiness of the counterparties, are detailed in the<br />
investment management agreements with respective Fund Managers. Any forward contracts entered into<br />
must be with entities that have an appropriate credit rating as determined by an international credit rating<br />
agency for counterparty risk and appropriate contractual arrangements (for example, an International<br />
Swaps and Derivatives Association (ISDA) agreement) must be in place between the currency Fund Manager<br />
and the counterparty.<br />
The ARC and <strong>ARTA</strong> have a joint treasury committee (as per the treasury policy of both organisations) who<br />
meet to discuss, transact and monitor currency risk.<br />
During the <strong>2009</strong> financial year the main currency for purchase was AUD.<br />
As at 30 June <strong>2009</strong>, <strong>ARTA</strong> has no significant risk and no sensitivity to movements in interest rates, foreign<br />
currency or price.<br />
Credit Risk<br />
Credit risk is the risk that a third party will default on its obligation to <strong>ARTA</strong>, causing <strong>ARTA</strong> to incur a loss.<br />
There are no procedures in place to monitor or report the credit quality of debtors and other receivables<br />
with reference to internal or external credit ratings. <strong>ARTA</strong> has no significant concentrations of credit risk in<br />
relation to debtors and other receivables, except for existing funding arrangements with the ARC.<br />
<strong>ARTA</strong> monitors trade receivables on a regular basis and impairment allowances are made if risks are<br />
identified, so that <strong>ARTA</strong> is not exposed to any additional default risk on trade receivables.<br />
For the purposes of section 5 of the Local Government Act 2002, the ARC is to be treated as the sole<br />
shareholder of <strong>ARTA</strong>. In addition, the ARC manages credit risk associated with cash and cash equivalents,<br />
derivative financial instruments and deposits with banks and financial institutions. Derivative counterparties<br />
and cash transactions are limited to high credit quality institutions. The Group has policies in place to limit<br />
the amount of cash exposure to any one financial institution.<br />
<strong>ARTA</strong> has no collateral or other credit enhancements for financial instruments that give rise to credit risk.<br />
<strong>ARTA</strong>’s maximum credit exposure for each class of financial instrument is as follows:<br />
<strong>2009</strong> 2008<br />
$000 $000<br />
Cash at bank and term deposits 105 148<br />
Debtors and receivables 43,357 50,543<br />
Loans 0 0<br />
Total 43,462 50,691<br />
112
Liquidity Risk<br />
Liquidity risk is the risk that <strong>ARTA</strong> will encounter difficulty raising liquid funds to meet commitments as they<br />
fall due.<br />
<strong>ARTA</strong>’s liquidity risk is managed by the ARC under the Support Services Agreement and <strong>ARTA</strong> is funded on<br />
an as needed basis by the ARC. ARC’s policy on managing liquidity risk is as follows:<br />
Prudent liquidity risk management implies maintaining sufficient cash and marketable securities, the availability<br />
of funding through an adequate amount of committed credit facilities and the ability to close out market<br />
positions. The Group aims to maintain flexibility in funding by keeping committed credit lines available.<br />
In meeting its liquidity requirements, the Group maintains a target level of investments that must mature<br />
within the next three months. To help reduce liquidity risk, the Group manages its cash requirements by<br />
forecasting and utilising flexibility in its funding facilities. The Group aims to minimise the cost of capital<br />
through effective cash management. It also has a liquidity policy which targets a minimum level of committed<br />
funding facilities to net debt.<br />
At 30 June <strong>2009</strong> the ARC advised <strong>ARTA</strong> that it had combined committed cash facilities with ANZ, BNZ and<br />
Westpac of $40m ($45m. 2008)<br />
The table below analyses <strong>ARTA</strong>’s financial liabilities into relevant maturity groupings based on the remaining<br />
period at the reporting date to the contractual maturity date.<br />
The amounts disclosed in table are the contractual undiscounted cashflows:<br />
FINANCIAL<br />
LIABILITIES<br />
– <strong>2009</strong><br />
< 6<br />
months<br />
$000<br />
6-12<br />
months<br />
$000<br />
1-2 years<br />
$000<br />
2-5 years<br />
$000<br />
> 5 years<br />
$000<br />
Total<br />
contractual<br />
cashflows<br />
$000<br />
Carrying<br />
amount of<br />
liabilities<br />
$000<br />
As at 30 June<br />
<strong>2009</strong><br />
Payables 39,540 39,540 39,540<br />
Grants payable 14,596 5,223 1,152 20,971 20,971<br />
Total 54,136 5,223 1,152 0 0 60,511 60,511<br />
FINANCIAL<br />
LIABILITIES<br />
– 2008<br />
< 6<br />
months<br />
$000<br />
6-12<br />
months<br />
$000<br />
1-2 years<br />
$000<br />
2-5 years<br />
$000<br />
> 5 years<br />
$000<br />
Total<br />
contractual<br />
cashflows<br />
$000<br />
Carrying<br />
amount of<br />
liabilities<br />
$000<br />
As at 30 June<br />
2008<br />
Payables 46,943 46,943 46,943<br />
Grants payable 18,802 9,880 28,682 27,272<br />
Total 46,943 18,802 9,880 0 0 75,625 74,215<br />
113
The table below analyses <strong>ARTA</strong>’s financial assets into relevant maturity groupings based on the remaining<br />
period at the reporting date to the contractual maturity date.<br />
The amounts disclosed in the table are the contractual undiscounted cashflows:<br />
FINANCIAL<br />
ASSETS – <strong>2009</strong> < 6<br />
months<br />
$000<br />
6-12<br />
months<br />
$000<br />
1-2 years<br />
$000<br />
2-5 years<br />
$000<br />
> 5 years<br />
$000<br />
Total<br />
contractual<br />
cashflows<br />
$000<br />
Carrying<br />
amount of<br />
liabilities<br />
$000<br />
As at 30 June<br />
<strong>2009</strong><br />
Cash/term<br />
deposits<br />
Debtors/<br />
receivables<br />
105 105 105<br />
57,914 5,263 1,152 64,328 64,328<br />
Total 58,019 5,263 1,152 0 0 64,433 64,433<br />
FINANCIAL<br />
ASSETS – 2008 < 6<br />
months<br />
$000<br />
6-12<br />
months<br />
$000<br />
1-2 years<br />
$000<br />
2-5 years<br />
$000<br />
> 5 years<br />
$000<br />
Total<br />
contractual<br />
cashflows<br />
$000<br />
Carrying<br />
amount of<br />
liabilities<br />
$000<br />
As at 30 June<br />
2008<br />
Cash/term<br />
deposits<br />
Debtors/<br />
receivables<br />
148 148 148<br />
40,560 103 9,880 50,543 0<br />
Total 40,708 103 9,880 0 0 50,691 148<br />
11 Cashflows<br />
Operating receipts and payments have been presented on a GST exclusive basis.<br />
Generally Accepted Accounting Practice prevents the netting off of monies paid and received except in the<br />
case where there is an agency relationship. Receipts and payments, representing monies paid and received<br />
on behalf of the territorial authorities (TAs), from New Zealand <strong>Transport</strong> Agency for roading and bus<br />
shelter claims have been netted off in the cashflows from Operating Activities, as such these amounts<br />
reflect the activities of the territorial authority not <strong>ARTA</strong>. The amount netted off relating to TA activities<br />
for <strong>2009</strong> was $171.0 million (2008 $178.6 million).<br />
12 Contingent Assets<br />
<strong>ARTA</strong> has no contingent assets for the year ended 30 June <strong>2009</strong>.<br />
At 30 June 2008 there were no contingent assets.<br />
114
13 Contingent Liabilities<br />
There are no contingent liabilities as at 30 June <strong>2009</strong>.<br />
As at 30 June 2008 there were claims against <strong>ARTA</strong> for damages relating to a contractual dispute which is<br />
considered resolved by <strong>ARTA</strong> in the <strong>2009</strong> year.<br />
14 Commitments and Operating Leases <strong>2009</strong> 2008<br />
<strong>2009</strong> 2008<br />
$000 $000<br />
Capital Commitments<br />
Approved and Contracted<br />
- Rolling Stock 6,965 10,334<br />
- Stations 13,740 3,257<br />
- Wharves 963 2,048<br />
- Plant, Machinery and Other Equipment 1,703 1,248<br />
23,371 16,888<br />
Non-cancellable Operating Lease Commitments<br />
Current Portion 1,738 1,743<br />
1-2 years 0 0<br />
2-5 years 0 0<br />
1,738 1,743<br />
Other Non-cancellable Operating Commitments – Rail Contracts<br />
Current Portion 2,400 2,347<br />
1-2 years 0 1,760<br />
2-5 years 0 0<br />
2,400 4,107<br />
Other Non-cancellable Operating Commitments – (Including Other <strong>Transport</strong> Contracts)<br />
Current Portion 117,469 98,948<br />
1-2 years 28,677 34,287<br />
2-5 years 2,275 3,365<br />
148,421 136,600<br />
Use of Contracted Services<br />
A significant proportion of services are contracted out to specialist providers. This is done to achieve <strong>ARTA</strong>’s<br />
objectives efficiently and effectively.<br />
Rail contracts have been extended to March 2010 only, with annual renewals available until 2014.<br />
115
15 Related Party Transactions<br />
<strong>ARTA</strong> is a wholly owned subsidiary of the ARC.<br />
ARC provides funding to <strong>ARTA</strong> for operating activities and to purchase property, plant and equipment.<br />
The values of these transactions are disclosed in Note 1. Details of current and non-current payables and<br />
receivables from related parties are disclosed in notes 5 and 9.<br />
<strong>ARTA</strong> purchases from the ARC shared services in respect of information technology, treasury management,<br />
financial processing services and facilities services. The cost of these services is $2,685,061 for <strong>2009</strong> ($2,273,452<br />
for 2008).<br />
ARC also provides funding to <strong>ARTA</strong> in order for <strong>ARTA</strong> to fulfill its responsibilities under the grants assumed<br />
from Infrastructure <strong>Auckland</strong> as at 1 July 2004.<br />
No intercompany balances have been written off in the year.<br />
Other than the above transactions and using public transport, no directors, senior management or any<br />
entities related to them have entered into transactions with the organisation, other than those on normal<br />
business terms.<br />
16 Events after balance date<br />
There are no events after balance date for the year ended 30 June <strong>2009</strong> which would require noting or<br />
adjusting in these financial statements.<br />
There were no events after balance date for the year ended 30 June 2008 which required noting or adjusting<br />
in these financial statements.<br />
116
17 Employee Benefits<br />
<strong>2009</strong> 2008<br />
$000 $000<br />
Employee Benefit Liabilities<br />
Gratuities 40 37<br />
Accrued salaries and wages 276 222<br />
Accrued annual leave 620 591<br />
Accrued Accident Compensation 89 0<br />
Total 1,025 850<br />
Employee Benefit Expenses<br />
Gratuities 3 4<br />
Employee termination benefits 0 5<br />
Salaries and wages 11,926 9,807<br />
Total 11,929 9,816<br />
18 Business Combination<br />
There have been no business combinations during the year ending 30 June <strong>2009</strong>.<br />
On 1 October 2007, <strong>ARTA</strong> acquired, via an Order In Council (dated 24 September 2007), the assets and<br />
businesses of ARTNL Harbour Berths Limited and ARTNL Metro Limited, wholly owned subsidiaries of<br />
<strong>Auckland</strong> Regional <strong>Transport</strong> Network Limited. This acquisition is in line with <strong>ARTA</strong>’s public benefit entity<br />
status and purpose.<br />
ARTNL Harbour Berths Limited owned (in part), developed and managed an integrated network of ferry<br />
terminals within the <strong>Auckland</strong> region to facilitate a comprehensive ferry network in accordance with the<br />
Regional Ferry Strategy.<br />
The acquired Harbour Berths business contributed revenues of $1,568,000 and a net loss of $641,000 to<br />
<strong>ARTA</strong> for the period 1 October 2007 to 30 June 2008.<br />
If the acquisition had occurred on 1 July 2007, revenue would have been $2,091,000, and the net loss<br />
$855,000.<br />
ARTNL Metro Limited leased, managed and upgraded 39 passenger rail stations within the <strong>Auckland</strong> region<br />
to ensure the provision of safe access for operators and passengers to rail stations.<br />
117
Details of net assets acquired and discount on acquisition are as follows:<br />
<strong>2009</strong> 2008<br />
$000 $000<br />
Purchase consideration nil nil<br />
Fair value of assets acquired nil 77,957<br />
Deferred tax liability nil (5,128)<br />
Discount on acquisition nil 72,829<br />
The assets and liabilities as of 1 October arising from the acquisition are as follows:<br />
<strong>2009</strong> <strong>2009</strong> 2008 2008<br />
Fair Acquiree’s Acquiree’s<br />
Value Carrying Amount Fair value Carrying Amount<br />
$000 $000 $000 $000<br />
Land subject to finance lease nil nil 15,050 nil<br />
(see note 7)<br />
Property, plant and equipment nil nil 40,385 nil<br />
(see note 7)<br />
Operating lease for rail station land nil nil 22,522 nil<br />
(see note 8)<br />
Deferred tax liabilities nil nil (5,128) nil<br />
(see note 20)<br />
Net assets acquired nil nil 72,829 nil<br />
Cash outflow on acquisition nil nil<br />
19 Inventory<br />
Inventory of $5,126,000 (2008: $3,096,000) comprises spare parts for <strong>ARTA</strong>’s rolling stock; it is held and<br />
managed by KiwiRail on <strong>ARTA</strong>’s behalf.<br />
The carrying amount of inventories is measured at the lower of cost and net realisable value.<br />
No inventories are pledged as security for liabilities.<br />
The cost of inventories recognised as an expense during the financial year is $3,454,000.<br />
There have been no write-downs of inventory to NRV. There have been no reversals of write-downs.<br />
118
20 Income Tax<br />
<strong>2009</strong> 2008<br />
Taxation $000 $000<br />
Current tax expense 0 0<br />
Adjustments to current tax in prior years 0 0<br />
Deferred tax on temporary differences 440 (193)<br />
Tax expense/(benefit) 440 (193)<br />
Relationship between tax expense and accounting surplus<br />
Net surplus (deficit) before tax 56,138 121,603<br />
Tax at 33% 40,129<br />
Tax at 30% 16,841<br />
Plus (less) tax effect of:<br />
Non-deductible expenditure<br />
Non-taxable income (16,841) (40,322)<br />
Prior year adjustment<br />
Deferred tax adjustment 440<br />
Tax expense/(benefit) 440 (193)<br />
Deferred Tax Asset (Liability)<br />
Prop, Plan and Employee Other Tax<br />
Equip Entitlements Provisions Losses Total<br />
Balance as at 30 June 2007 0 0 0 0 0<br />
Business acquisition (5,128) 0 0 0 (5,128)<br />
Charged to income 0 0 0 0 0<br />
Charged to equity 133 0 0 60 193<br />
Balance as at 30 June 2008 (4,995) 0 0 60 (4,935)<br />
Business acquisition 0 0 0 0 0<br />
Charged to equity 0 0 0 0 0<br />
Charged to income (414) 0 0 (26) (440)<br />
Balance as at 30 June <strong>2009</strong> (5,409) 0 0 34 (5,375)<br />
119
21 Capital Management<br />
<strong>ARTA</strong>’s capital is its equity (or owner’s interest), which comprise retained earnings and reserves. Equity is<br />
represented by net assets.<br />
The owner’s interest is largely managed as a by-product of managing revenues, expenses, assets, liabilities<br />
and general financial dealings. The objective of managing these items, as set out in the Local Government<br />
(<strong>Auckland</strong>) Amendment Act (LGAAA) 2004, is for <strong>ARTA</strong> to plan, fund and develop the <strong>Auckland</strong> regional<br />
land transport system for the <strong>Auckland</strong> region.<br />
The LGAAA requires <strong>ARTA</strong> to operate in a financially responsible manner and have regard to the reasonably<br />
foreseeable needs of future generations. <strong>ARTA</strong> has in place asset management plans for major classes of<br />
assets detailing renewals and maintenance programmes and must contribute to the ARC’s Long Term Council<br />
Community Plan in order for the ARC to make adequate and effective provision to fund <strong>ARTA</strong>’s activities in<br />
line with its obligations under the Local Government Act 2002.<br />
<strong>ARTA</strong> has the following reserves:<br />
Capital Grants Reserve – the capital grants reserve represents capital expenditure grants that have not been<br />
offset by an associated depreciation charge.<br />
22 Comparative Figures<br />
Comparative figures included in the financial statements relate to the financial year end 30 June 2008.<br />
Where necessary these figures have been reclassified on a basis consistent with current disclosure for <strong>2009</strong>.<br />
23 <strong>Auckland</strong> Council – Council Organisations<br />
Due to enactment of the Local Government (Tamaki Makaurau Reorganisation) Act <strong>2009</strong> the existing local<br />
authorities in the <strong>Auckland</strong> region will be dissolved on 31 October 2010. The functions, duties, and powers of<br />
the existing local authorities will become the functions, duties and powers of the single unitary authority (the<br />
<strong>Auckland</strong> Council) that will be responsible for governing the entire <strong>Auckland</strong> region from 1 November 2010.<br />
The <strong>Auckland</strong> Transition Agency will develop an organisational structure for the new <strong>Auckland</strong> Council and<br />
appropriate Council Organisations so that the Council can operate efficiently and effectively on and from<br />
1 November 2010. The <strong>Auckland</strong> Transition Agency will develop a change management plan that includes<br />
protocols and processes for managing the transition of:<br />
i) assets from existing local government organisations to the Council structure;<br />
ii) staff from existing local government organisations to the Council structure having regard to the<br />
existing employment agreements applying to the staff.<br />
Decisions are yet to be made on the <strong>Auckland</strong> Council’s organisational structure and operations including<br />
how the Council Organisations (including the <strong>Auckland</strong> Regional <strong>Transport</strong> Authority) will be vested and<br />
integrated into a relevant organisational structure.<br />
120
AUDIT REPORT<br />
To the readers of <strong>Auckland</strong> Regional <strong>Transport</strong> Authority’s financial statements and Performance<br />
Information for the year ended 30 June <strong>2009</strong><br />
The Auditor-General is the auditor of <strong>Auckland</strong> Regional <strong>Transport</strong> Authority (the Authority). The Auditor-<br />
General has appointed me, David Walker, using the staff and resources of Audit New Zealand, to carry out<br />
the audit of the financial statements and performance information of the Authority, on her behalf, for the<br />
year ended 30 June <strong>2009</strong>.<br />
Unqualified Opinion<br />
In our opinion:<br />
• The financial statements of the Authority on pages 81 to 120:<br />
xx<br />
comply with generally accepted accounting practice in New Zealand; and<br />
xx<br />
fairly reflect:<br />
--<br />
the Authority’s financial position as at 30 June <strong>2009</strong>; and<br />
--<br />
the results of its operations and cash flows for the year ended on that date.<br />
• The performance information of the Authority on pages 57 to 65 fairly reflects the achievements<br />
measured against the performance targets adopted for the year ended 30 June <strong>2009</strong>.<br />
The audit was completed on 26 August <strong>2009</strong>, and is the date at which our opinion is expressed.<br />
The basis of our opinion, which refers to the new local government structure for the <strong>Auckland</strong> region,<br />
is explained below. We also outline the responsibilities of the Board and the Auditor, and explain our<br />
independence.<br />
Basis of Opinion<br />
We carried out the audit in accordance with the Auditor-General’s Auditing Standards, which incorporate<br />
the New Zealand Auditing Standards.<br />
We planned and performed the audit to obtain all the information and explanations we considered necessary<br />
in order to obtain reasonable assurance that the financial statements and performance information did not<br />
have material misstatements, whether caused by fraud or error.<br />
121
Material misstatements are differences or omissions of amounts and disclosures that would affect a reader’s<br />
overall understanding of the financial statements and performance information. If we had found material<br />
misstatements that were not corrected, we would have referred to them in our opinion.<br />
The audit involved performing procedures to test the information presented in the financial statements and<br />
performance information. We assessed the results of those procedures in forming our opinion.<br />
Audit procedures generally include:<br />
• determining whether significant financial and management controls are working and can be relied on<br />
to produce complete and accurate data;<br />
• verifying samples of transactions and account balances;<br />
• performing analyses to identify anomalies in the reported data;<br />
• reviewing significant estimates and judgements made by the Board;<br />
• confirming year-end balances;<br />
• determining whether accounting policies are appropriate and consistently applied; and<br />
• determining whether all required disclosures are adequate.<br />
We did not examine every transaction, nor do we guarantee complete accuracy of the financial statements<br />
and performance information.<br />
We evaluated the overall adequacy of the presentation of information in the financial statements and<br />
performance information. We obtained all the information and explanations we required to support our<br />
opinion above.<br />
The financial statements refer to the new local government structure for the <strong>Auckland</strong> region<br />
In forming our opinion, we considered the disclosures in note 23 on page 120 about the Government<br />
establishing a new local government structure for the <strong>Auckland</strong> region. The Local Government (Tamaki<br />
Makaurau Reorganisation) Act <strong>2009</strong> will establish a single unitary authority (the <strong>Auckland</strong> Council) that will<br />
be responsible for governing the entire <strong>Auckland</strong> region from 1 November 2010.<br />
Decisions are yet to be made on the <strong>Auckland</strong> Council’s structure and operations, including how the<br />
Authority will be vested and integrated. We consider the disclosures to be appropriate to the Authority’s<br />
circumstances.<br />
122
Responsibilities of the Board and the Auditor<br />
The Board is responsible for preparing the financial statements in accordance with generally accepted<br />
accounting practice in New Zealand. The financial statements must fairly reflect the financial position of<br />
the Authority as at 30 June <strong>2009</strong> and the results of its operations and cash flows for the year ended on<br />
that date. The Board is also responsible for preparing performance information that fairly reflects service<br />
performance achievements for the year ended 30 June <strong>2009</strong>. The Board’s responsibilities arise from the<br />
Local Government Act 2002.<br />
We are responsible for expressing an independent opinion on the financial statements and performance<br />
information and reporting that opinion to you. This responsibility arises from section 15 of the Public Audit<br />
Act 2001 and section 69 of the Local Government Act 2002.<br />
Independence<br />
When carrying out the audit we followed the independence requirements of the Auditor-General, which<br />
incorporate the independence requirements of the New Zealand Institute of Chartered Accountants.<br />
Other than the audit, we have no relationship with or interests in the Authority.<br />
David Walker<br />
Audit New Zealand<br />
On behalf of the Auditor-General<br />
<strong>Auckland</strong>, New Zealand<br />
123
GLOSSARY<br />
AMETI<br />
<strong>Auckland</strong>-Manukau Eastern <strong>Transport</strong> Initiative<br />
ARC<br />
<strong>Auckland</strong> Regional Council. The ARC is <strong>ARTA</strong>’s sole shareholder<br />
ARLTS<br />
<strong>Auckland</strong> Regional Land <strong>Transport</strong> Strategy<br />
<strong>ARTA</strong><br />
<strong>Auckland</strong> Regional <strong>Transport</strong> Authority<br />
ATP<br />
<strong>Auckland</strong> <strong>Transport</strong> Plan<br />
CBD<br />
Central Business District<br />
GRH<br />
guaranteed Ride Home<br />
KiwiRail<br />
On 1 July 2008, Toll Rail became owned by the New Zealand Government<br />
and was renamed KiwiRail. KiwiRail and ONTRACK report to the New<br />
Zealand Railways Corporation Board. KiwiRail is responsible for the<br />
mechanical maintenance of the <strong>Auckland</strong> train fleet.<br />
NZTA<br />
NZ <strong>Transport</strong> Agency. In August 2008, the NZ <strong>Transport</strong> Agency<br />
was established by merging Land <strong>Transport</strong> New Zealand and Transit<br />
New Zealand.<br />
RARP<br />
Regional Arterial Road Plan<br />
RLTP<br />
Regional Land <strong>Transport</strong> Programme<br />
RWC<br />
Rugby World Cup<br />
SoI<br />
Statement of Intent, prepared annually by <strong>ARTA</strong>’s Board of Directors<br />
TDM<br />
Travel Demand Management<br />
TM<br />
Total Mobility<br />
124
DIRECTORY<br />
Chief Executive<br />
Postal Address<br />
Fergus Gammie<br />
Private Bag 92236<br />
<strong>Auckland</strong> 1142<br />
Board of Directors<br />
Rabin Rabindran (Chairman)<br />
Adrienne Young Cooper (Deputy Chair)<br />
Mark Benjamin<br />
Peter Brothers<br />
Telephone<br />
09 379 4422<br />
Auditors<br />
Audit New Zealand<br />
Andrew Buxton<br />
Anthony Marks<br />
Gary Taylor<br />
Mike Williams<br />
Solicitors<br />
Bell Gully<br />
Registered Office<br />
Level 3, 21 Pitt Street<br />
<strong>Auckland</strong> Central<br />
Design by Work Communications<br />
www.workcommunications.co.nz<br />
Printed by Blue Star Print New Zealand<br />
Websites<br />
www.arta.co.nz<br />
www.maxx.co.nz<br />
www.travelwise.org.nz<br />
www.bspg.co.nz<br />
Printed using vegetable-based, mineral-oil-free<br />
inks on environmentally responsible Media<br />
Satin using PEFC pulp from a mill that is EMAS<br />
accredited and ISO 14001 certified; and on<br />
9lives uncoated offset which is 50% recycled<br />
pulp and 50% virgin pulp sourced from<br />
well-managed forests.<br />
125
126<br />
Sandringham Road, New North Road and Kingsland train<br />
station: An example of multi-modal transport use in <strong>Auckland</strong>
www.maxx.co.nz<br />
www.arta.co.nz