
You also want an ePaper? Increase the reach of your titles
YUMPU automatically turns print PDFs into web optimized ePapers that Google loves.
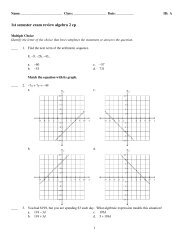
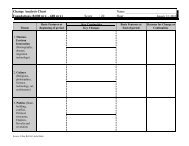
Student: Class: Date:<br />
<strong>Creating</strong> <strong>linear</strong> <strong>models</strong> <strong>for</strong> <strong>data</strong><br />
Student Activity Sheet 4; use with Exploring “Trans<strong>for</strong>mations on <strong>linear</strong> functions”<br />
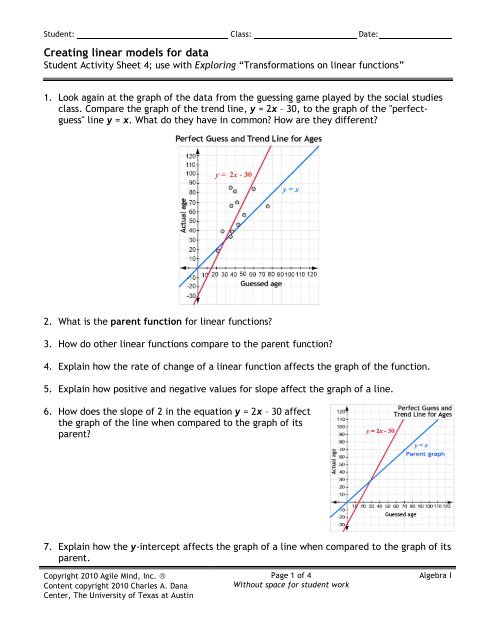
1. Look again at the graph of the <strong>data</strong> from the guessing game played by the social studies<br />
class. Compare the graph of the trend line, y = 2x – 30, to the graph of the "perfectguess"<br />
line y = x. What do they have in common? How are they different?<br />
2. What is the parent function <strong>for</strong> <strong>linear</strong> functions?<br />
3. How do other <strong>linear</strong> functions compare to the parent function?<br />
4. Explain how the rate of change of a <strong>linear</strong> function affects the graph of the function.<br />
5. Explain how positive and negative values <strong>for</strong> slope affect the graph of a line.<br />
6. How does the slope of 2 in the equation y = 2x – 30 affect<br />
the graph of the line when compared to the graph of its<br />
parent?<br />
7. Explain how the y-intercept affects the graph of a line when compared to the graph of its<br />
parent.<br />
Copyright 2010 Agile Mind, Inc. ®<br />
Content copyright 2010 Charles A. Dana<br />
Center, The University of Texas at Austin<br />
Page 1 of 4<br />
Without space <strong>for</strong> student work<br />
Algebra I
Student: Class: Date:<br />
<strong>Creating</strong> <strong>linear</strong> <strong>models</strong> <strong>for</strong> <strong>data</strong><br />
Student Activity Sheet 4; use with Exploring “Trans<strong>for</strong>mations on <strong>linear</strong> functions”<br />
8. In the equation y = 2x – 30, how does the y-intercept of -30<br />
affect the line compared to its parent?<br />
9. How would you trans<strong>for</strong>m the graph of y = x to produce<br />
the graph of y = 3x + 1?<br />
10. How would you trans<strong>for</strong>m the graph of y = x to produce<br />
1<br />
the graph of y = x -3?<br />
2<br />
Copyright 2010 Agile Mind, Inc. ®<br />
Content copyright 2010 Charles A. Dana<br />
Center, The University of Texas at Austin<br />
Page 2 of 4<br />
Without space <strong>for</strong> student work<br />
Algebra I
Student: Class: Date:<br />
<strong>Creating</strong> <strong>linear</strong> <strong>models</strong> <strong>for</strong> <strong>data</strong><br />
Student Activity Sheet 4; use with Exploring “Trans<strong>for</strong>mations on <strong>linear</strong> functions”<br />
11. How would you trans<strong>for</strong>m the graph of y = x to produce the<br />
graph of y = -3x + 2?<br />
12. Explain in terms of trans<strong>for</strong>mations how the graphs of y = 16 + 0.07x and<br />
y = 26.1 + 0.07x are related to each other.<br />
13. What characteristics of the graph of the parent function, y = x, do you have to change to<br />
get each of these graphs?<br />
Complete the following puzzle (questions 14–18) by matching the graph of each<br />
trans<strong>for</strong>mation with its verbal description. Write the letter of the graph in the space<br />
beside its verbal description. Some graphs may be used more than once.<br />
14. The graph of y = 3x – 2 shifted up 4 units.<br />
15. The graph y = x with a rate of change of 2 and shifted down 1 unit.<br />
3<br />
16. The <strong>linear</strong> parent function reflected across the x-axis and shifted up 2.<br />
17. The graph y = x shifted up 2 and with a rate of change of 3.<br />
2<br />
18. The graph of y = - x -5 reflected over the x-axis and shifted down 6 units.<br />
3<br />
Copyright 2010 Agile Mind, Inc. ®<br />
Content copyright 2010 Charles A. Dana<br />
Center, The University of Texas at Austin<br />
Page 3 of 4<br />
Without space <strong>for</strong> student work<br />
Algebra I
Student: Class: Date:<br />
<strong>Creating</strong> <strong>linear</strong> <strong>models</strong> <strong>for</strong> <strong>data</strong><br />
Student Activity Sheet 4; use with Exploring “Trans<strong>for</strong>mations on <strong>linear</strong> functions”<br />
19. REEI INFFORRCCEE For each trans<strong>for</strong>mation described below, sketch the graph that results.<br />
Then, write the function rule that represents the trans<strong>for</strong>mation. Use a single graph grid<br />
<strong>for</strong> all four graphs, and label each graph with the appropriate letter.<br />
a. Shift the graph of y = x down 2 units.<br />
Function rule:<br />
b. Shift the graph from part a up 5 units.<br />
Function rule:<br />
c. Reflect the graph from part b over the x-axis.<br />
Function rule:<br />
d. Create a graph with the same y-intercept as the graph in part c, but with 4 times the<br />
rate of change.<br />
Function rule:<br />
Copyright 2010 Agile Mind, Inc. ®<br />
Content copyright 2010 Charles A. Dana<br />
Center, The University of Texas at Austin<br />
Page 4 of 4<br />
Without space <strong>for</strong> student work<br />
Algebra I