Rural vs. Urban Ambulatory Health Care Review - HSR&D
Rural vs. Urban Ambulatory Health Care Review - HSR&D
Rural vs. Urban Ambulatory Health Care Review - HSR&D

You also want an ePaper? Increase the reach of your titles
YUMPU automatically turns print PDFs into web optimized ePapers that Google loves.
Department of Veterans Affairs<br />
<strong>Health</strong> Services Research & Development Service<br />
Evidence-based Synthesis Program<br />
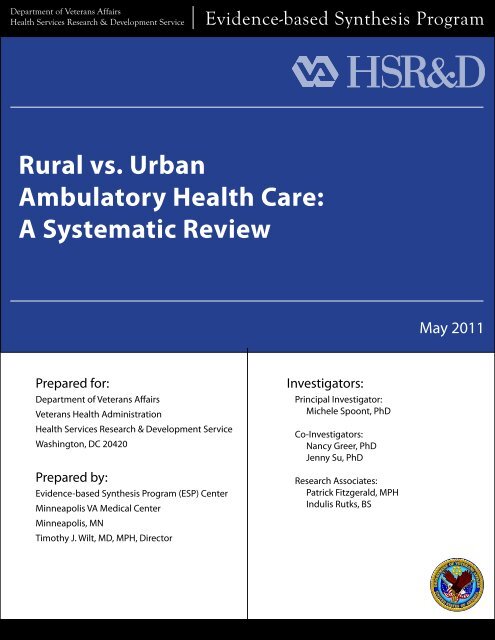
<strong>Rural</strong> <strong>vs</strong>. <strong>Urban</strong><br />
<strong>Ambulatory</strong> <strong>Health</strong> <strong>Care</strong>:<br />
A Systematic <strong>Review</strong><br />
May 2011<br />
Prepared for:<br />
Department of Veterans Affairs<br />
Veterans <strong>Health</strong> Administration<br />
<strong>Health</strong> Services Research & Development Service<br />
Washington, DC 20420<br />
Prepared by:<br />
Evidence-based Synthesis Program (ESP) Center<br />
Minneapolis VA Medical Center<br />
Minneapolis, MN<br />
Timothy J. Wilt, MD, MPH, Director<br />
Investigators:<br />
Principal Investigator:<br />
Michele Spoont, PhD<br />
Co-Investigators:<br />
Nancy Greer, PhD<br />
Jenny Su, PhD<br />
Research Associates:<br />
Patrick Fitzgerald, MPH<br />
Indulis Rutks, BS
<strong>Rural</strong> <strong>vs</strong>. <strong>Urban</strong> <strong>Ambulatory</strong> <strong>Health</strong> <strong>Care</strong>: A Systematic <strong>Review</strong><br />
Evidence-based Synthesis Program<br />
PREFACE<br />
<strong>Health</strong> Services Research & Development Service’s (HSR&D’s) Evidence-based Synthesis<br />
Program (ESP) was established to provide timely and accurate syntheses of targeted healthcare<br />
topics of particular importance to Veterans Affairs (VA) managers and policymakers, as they<br />
work to improve the health and healthcare of Veterans. The ESP disseminates these reports<br />
throughout VA.<br />
HSR&D provides funding for four ESP Centers and each Center has an active VA affiliation. The<br />
ESP Centers generate evidence syntheses on important clinical practice topics, and these reports<br />
help:<br />
• develop clinical policies informed by evidence,<br />
• guide the implementation of effective services to improve patient<br />
outcomes and to support VA clinical practice guidelines and<br />
performance measures, and<br />
• set the direction for future research to address gaps in clinical<br />
knowledge.<br />
In 2009, the ESP Coordinating Center was created to expand the capacity of HSR&D Central<br />
Office and the four ESP sites by developing and maintaining program processes. In addition,<br />
the Center established a Steering Committee comprised of HSR&D field-based investigators,<br />
VA Patient <strong>Care</strong> Services, Office of Quality and Performance, and Veterans Integrated Service<br />
Networks (VISN) Clinical Management Officers. The Steering Committee provides program<br />
oversight, guides strategic planning, coordinates dissemination activities, and develops<br />
collaborations with VA leadership to identify new ESP topics of importance to Veterans and the<br />
VA healthcare system.<br />
Comments on this evidence report are welcome and can be sent to Nicole Floyd, ESP<br />
Coordinating Center Program Manager, at nicole.floyd@va.gov.<br />
Recommended citation: Spoont M, Greer N, Su J, Fitzgerald P, Rutks I, and Wilt TJ. <strong>Rural</strong> <strong>vs</strong>.<br />
<strong>Urban</strong> <strong>Ambulatory</strong> <strong>Health</strong> <strong>Care</strong>: A Systematic <strong>Review</strong>. VA-ESP Project #09-009;2011.<br />
This report is based on research conducted by the Evidence-based Synthesis<br />
Program (ESP) Center located at the Minneapolis VA Medical Center, Minneapolis,<br />
MN funded by the Department of Veterans Affairs, Veterans <strong>Health</strong> Administration,<br />
Office of Research and Development, <strong>Health</strong> Services Research and Development.<br />
The findings and conclusions in this document are those of the author(s) who are<br />
responsible for its contents; the findings and conclusions do not necessarily represent<br />
the views of the Department of Veterans Affairs or the United States government.<br />
Therefore, no statement in this article should be construed as an official position of<br />
the Department of Veterans Affairs. No investigators have any affiliations or financial<br />
involvement (e.g., employment, consultancies, honoraria, stock ownership or options,<br />
expert testimony, grants or patents received or pending, or royalties) that conflict with<br />
material presented in the report.<br />
ii
<strong>Rural</strong> <strong>vs</strong>. <strong>Urban</strong> <strong>Ambulatory</strong> <strong>Health</strong> <strong>Care</strong>: A Systematic <strong>Review</strong><br />
Evidence-based Synthesis Program<br />
TABLE OF CONTENTS<br />
EXECUTIVE SUMMARY<br />
Background.................................................................................................................................................... 1<br />
Methods.......................................................................................................................................................... 1<br />
Data Synthesis................................................................................................................................................ 2<br />
Peer <strong>Review</strong>................................................................................................................................................... 2<br />
Results............................................................................................................................................................ 2<br />
Future Research.............................................................................................................................................. 3<br />
INTRODUCTION<br />
Background.................................................................................................................................................... 5<br />
Definitions of <strong>Rural</strong>ity................................................................................................................................... 6<br />
METHODS<br />
Topic Development........................................................................................................................................ 9<br />
Search Strategy.............................................................................................................................................. 9<br />
Study Selection............................................................................................................................................ 10<br />
Data Abstraction........................................................................................................................................... 10<br />
Data Synthesis.............................................................................................................................................. 10<br />
Rating the Body of Evidence....................................................................................................................... 10<br />
Peer <strong>Review</strong>................................................................................................................................................. 11<br />
RESULTS<br />
Literature Flow............................................................................................................................................. 12<br />
Preventive <strong>Care</strong>/<strong>Ambulatory</strong> <strong>Care</strong> Sensitive Conditions............................................................................. 13<br />
Cancer <strong>Care</strong>.................................................................................................................................................. 16<br />
Diabetes/End Stage Renal Disease.............................................................................................................. 20<br />
Cardiovascular Disease................................................................................................................................ 23<br />
HIV/AIDS.................................................................................................................................................... 25<br />
Neurologic Conditions................................................................................................................................. 26<br />
Mental <strong>Health</strong>................................................................................................................................ 28<br />
Processes or Structure of <strong>Care</strong>....................................................................................................... 33<br />
Use of Medication.......................................................................................................................... 33<br />
Medical Procedures and Diagnostic Tests..................................................................................... 35<br />
Medical Appointments with Providers.......................................................................................... 35<br />
Usual Source of <strong>Care</strong>..................................................................................................................... 36<br />
Provider Availability and Expertise............................................................................................... 37<br />
SUMMARY AND DISCUSSION<br />
Conclusions and Recommendations............................................................................................................ 42<br />
Summary of Evidence by Key Question...................................................................................................... 42<br />
Research Implications and Recommendations............................................................................................ 46<br />
iii
<strong>Rural</strong> <strong>vs</strong>. <strong>Urban</strong> <strong>Ambulatory</strong> <strong>Health</strong> <strong>Care</strong>: A Systematic <strong>Review</strong><br />
Evidence-based Synthesis Program<br />
REFERENCES.................................................................................................................................................... 49<br />
TABLES<br />
Table 1. Definitions of <strong>Urban</strong> and <strong>Rural</strong>................................................................................................... 7<br />
Table 2. Explanation of Confidence Scores............................................................................................ 11<br />
Table 3. Confidence Scores for Preventive <strong>Care</strong>/<strong>Ambulatory</strong> <strong>Care</strong> Sensitive Condition Studies.......... 16<br />
Table 4. Confidence Scores for Cancer <strong>Care</strong> Studies.............................................................................. 20<br />
Table 5. Confidence Scores for Diabetes and End-Stage Renal Disease Studies................................... 23<br />
Table 6. Confidence Scores for Cardiovascular Disease Studies............................................................ 25<br />
Table 7. Confidence Scores for HIV/AIDS Studies................................................................................ 26<br />
Table 8. Confidence Scores for Neurologic Conditions Studies............................................................. 28<br />
Table 9. Confidence Scores for Mental <strong>Health</strong> Studies........................................................................... 34<br />
Table 10. Confidence Scores for Processes and Structure of <strong>Care</strong> Studies............................................... 40<br />
FIGURES<br />
Figure 1. Analytic Framework.................................................................................................................... 9<br />
Figure 2. Flow Diagram of Included Studies............................................................................................ 12<br />
APPENDIX A. DATA ABSTRACTION FORM................................................................................... 58<br />
APPENDIX B. PEER REVIEW COMMENTS AND AUTHOR RESPONSES..................... 59<br />
APPENDIX C. EVIDENCE TABLES<br />
Table 1. Preventive <strong>Care</strong>/<strong>Ambulatory</strong> <strong>Care</strong> Sensitive Conditions.......................................................... 65<br />
Table 2. Cancer Screening....................................................................................................................... 67<br />
Table 3. Cancer <strong>Care</strong>............................................................................................................................... 69<br />
Table 4. Diabetes/End Stage Renal Disease............................................................................................ 73<br />
Table 5. Cardiovascular Disease............................................................................................................. 76<br />
Table 6. HIV/AIDS................................................................................................................................. 78<br />
Table 7. Neurologic Conditions.............................................................................................................. 79<br />
Table 8. Mental <strong>Health</strong>............................................................................................................................ 81<br />
Table 9. Use of Medication..................................................................................................................... 88<br />
Table 10. Medical Procedures and Diagnostic Tests................................................................................. 90<br />
Table 11. Medical Appointments with Providers...................................................................................... 91<br />
Table 12. Usual Source of <strong>Care</strong>................................................................................................................. 94<br />
Table 13. Provider Availability and Expertise........................................................................................... 96<br />
iv
<strong>Rural</strong> <strong>vs</strong>. <strong>Urban</strong> <strong>Ambulatory</strong> <strong>Health</strong> <strong>Care</strong>: A Systematic <strong>Review</strong><br />
Evidence-based Synthesis Program<br />
EXECUTIVE SUMMARY<br />
BACKGROUND<br />
Approximately 3 million veterans, slightly more than one-third of all veterans enrolled in<br />
the Department of Veterans Affairs (VA) health care system, live in rural areas. This pattern<br />
is likely to continue, as a comparable proportion of Operation Enduring Freedom/Operation<br />
Iraqi Freedom (OEF/OIF) veterans are from rural areas. The <strong>Rural</strong> Veterans <strong>Care</strong> Act of 2006<br />
was signed into law to improve care for rural veterans. Ensuring that the health care needs of<br />
rural veterans are met has become a top priority for VA, resulting in a considerable expansion<br />
of community based outpatient clinics (CBOCs), inclusion of rural health/access as a research<br />
priority, and creation of the VA Office of <strong>Rural</strong> <strong>Health</strong> (ORH) in 2006.<br />
Although there have been reports comparing health quality of life (both physical and mental)<br />
for rural and urban veterans, it remains unclear whether the observed lower health quality<br />
of life in rural veterans is due to disparities in health care, differences in disease prevalence,<br />
or other population differences. This systematic review examines the evidence regarding<br />
potential disparities between rural and urban areas in health care provision and delivery, and<br />
how differences in health care may contribute to disparities in health outcomes. Differences in<br />
rural-urban prevalence rates of diseases and other health conditions are beyond the scope of this<br />
review. Because veterans who use VA health care have been found to use more non-VA health<br />
care overall, we expanded the focus of this review to include comparisons of rural <strong>vs</strong>. urban<br />
health care in non-VA health systems.<br />
The key questions were:<br />
Key Question #1. Do adults with health care needs who live in rural areas have different<br />
intermediate (e.g., hemoglobin A1c [HbA1c], Blood pressure, etc.) or final health outcomes (i.e.,<br />
mortality, morbidity, quality of life [QOL]) than those living in urban areas?<br />
Key Question #2. Is the structure (e.g., types of available providers) or the process (e.g.,<br />
likelihood of referral) of health care different for adults with health care needs who live in urban<br />
<strong>vs</strong>. rural environments?<br />
Key Question #3. If there are differences in the structure or the process of health care in rural <strong>vs</strong>.<br />
urban environments, do those differences contribute to variation in overall or intermediate health<br />
outcomes for adults with health care needs?<br />
Key Question #4. If there are differences in intermediate or final health outcomes for adult<br />
patients with health care needs, what other systems factors moderate those differences (e.g.,<br />
availability of specialists, type of treatment needed, travel distance)?<br />
METHODS<br />
We searched OVID MEDLINE, PsycINFO, and CINAHL, using search terms related to rural<br />
health and rural health services, for clinical trials of adult patients in the United States, published<br />
in English language, between 1990 and June, 2010. Titles and abstracts were reviewed by the<br />
authors using pre-defined exclusion criteria. Additional articles were identified by searching<br />
1
<strong>Rural</strong> <strong>vs</strong>. <strong>Urban</strong> <strong>Ambulatory</strong> <strong>Health</strong> <strong>Care</strong>: A Systematic <strong>Review</strong><br />
Evidence-based Synthesis Program<br />
reference lists from relevant publications and from a search of the contents of The Journal of<br />
<strong>Rural</strong> <strong>Health</strong>. Study design, sample characteristic, data source, analysis, and outcome measure<br />
data were abstracted by the authors, all of whom have experience in critical analysis of the<br />
literature and who were trained on the use of the abstraction form created for this review. We<br />
created evidence tables and compiled a summary of findings for each clinical topic, and drew<br />
conclusions based on a qualitative synthesis of the findings.<br />
DATA SYNTHESIS<br />
Because we wished to examine the body of evidence related to specific areas of health care, the<br />
studies were reviewed with other studies in that area. We constructed evidence tables showing<br />
the study characteristics and results for all included studies. We critically analyzed studies to<br />
compare their characteristics, methods, and findings. We compiled a summary of findings for<br />
each clinical topic, and drew conclusions based on a qualitative synthesis of the findings.<br />
PEER REVIEW<br />
A draft version of this report was reviewed by nine technical experts, as well as clinical<br />
leadership. <strong>Review</strong>er comments were addressed and our responses were incorporated in the final<br />
report (Appendix B).<br />
RESULTS<br />
We screened 1,381 unique titles and abstracts, rejected 1,048, and performed a more detailed<br />
review on 333 articles. We excluded an additional 165 articles and added 24 articles through<br />
hand-searching of references lists and The Journal of <strong>Rural</strong> <strong>Health</strong>. We excluded 93 articles<br />
that were not related to ambulatory care, were studies of interventions, or were useful only for<br />
background information. Three studies were added after peer-review resulting in 102 studies that<br />
reported outcomes related to one of the key questions.<br />
The identified evidence has been presented under the following headings: preventive care/<br />
ambulatory care sensitive conditions (ACSCs), cancer care, diabetes/end stage renal disease<br />
(ESRD), cardiovascular disease, HIV/AIDS, neurologic conditions, and mental health. We also<br />
identified and presented research focused on medication use, medical procedures and tests, and<br />
provider and service utilization more generally. There are large gaps in the evidence base across<br />
clinical conditions, and minimal empirical work conducted on several areas of particular interest<br />
to the VA (e.g., traumatic brain injury, post-traumatic stress disorder, Hepatitis C).<br />
Of the areas in which there were studies, the overall evidence base was fairly weak. In addition<br />
to a limited number of studies in most areas, only one study used a prospective design, and few<br />
linked health care differences with health outcomes. Moreover, while very large databases are<br />
needed to adequately examine many aspects of rural <strong>vs</strong>. urban health care, studies that relied on<br />
existing national or state databases were limited by the covariates available in those databases.<br />
Definitions of rural and urban vary across studies making interpretations and comparisons of<br />
findings difficult. Furthermore, many studies treated correlates of urban and rural settings as<br />
confounders and adjusted for these factors in statistical models, effectively controlling for the<br />
very factors that might underlie a potential disparity.<br />
2
<strong>Rural</strong> <strong>vs</strong>. <strong>Urban</strong> <strong>Ambulatory</strong> <strong>Health</strong> <strong>Care</strong>: A Systematic <strong>Review</strong><br />
Evidence-based Synthesis Program<br />
Key Question #1. Do adults with health care needs who live in rural areas have<br />
different intermediate (e.g., HbA1c, Blood pressure, etc.) or final health outcomes<br />
(i.e., mortality, morbidity, QOL) than those living in urban areas?<br />
We identified some evidence of a health care disparity for the following conditions: suicide rates,<br />
hospitalization for ACSCs, stage of cancer presentation, and ESRD. Available evidence suggests<br />
that there is no disparity in diabetes care, the prevalence of ESRD, or control of hypertension.<br />
Key Question #2. Is the structure (e.g., types of available providers) or the process<br />
(e.g., likelihood of referral) of health care different for adults with health care<br />
needs who live in urban <strong>vs</strong>. rural environments?<br />
<strong>Urban</strong> residents tended to receive more medications but the evidence was limited. There were<br />
no consistent differences in the receipt of or adherence to medication. Office visits, medical<br />
procedures, and diagnostic tests were less frequent in rural settings, with consistently lower<br />
screening rates for breast and cervical cancer. In rural areas, cancers were more likely to be<br />
unstaged at the time of diagnosis. <strong>Rural</strong> residents were less likely to see medical specialists,<br />
including mental health specialists, and the availability of medical specialists is particularly<br />
limited in rural areas. Although rural residents were as likely as urban residents to have a usual<br />
source of care (i.e., a particular clinic), rural residents were more likely to have better continuity<br />
of care with a specific provider. Highly rural areas have an insufficient supply of health care<br />
providers, and are more likely to rely on physician extenders for primary care.<br />
Data on quality of care were only available for a few conditions, with some evidence suggesting<br />
lower quality of care in rural areas for patients with HIV or cancer, but findings were less<br />
consistent for the treatment of depression.<br />
Key Question #3. If there are differences in the structure or the process of health<br />
care in rural <strong>vs</strong>. urban environments, do those differences contribute to variation<br />
in overall or intermediate health outcomes for adults with health care needs?<br />
Although many studies document differences in health care structure or processes, very few<br />
studies associated these differences with variation in health outcomes. Among the limited<br />
findings were higher rates of invasive cervical and breast cancers associated with lower screening<br />
rates in rural areas, improved adherence to guideline care for diabetes treatment (associated with<br />
improved access to rural health clinics), higher rates of suicide in rural areas associated with<br />
differential use of antidepressants (especially older antidepressants), and better continuity of care<br />
associated with fewer providers in rural areas.<br />
Key Question #4. If there are differences in intermediate or final health outcomes<br />
for adult patients with health care needs, what other systems factors moderate<br />
those differences (e.g., type of treatment needed, travel distance)?<br />
Other factors identified include insurance, travel distance, patient attitudes, and race disparities.<br />
FUTURE RESEARCH<br />
There are many gaps in the existing research. Several important clinical conditions have not<br />
been addressed, and few studies have enrolled veterans. A key issue for future research is the<br />
3
<strong>Rural</strong> <strong>vs</strong>. <strong>Urban</strong> <strong>Ambulatory</strong> <strong>Health</strong> <strong>Care</strong>: A Systematic <strong>Review</strong><br />
Evidence-based Synthesis Program<br />
choice of definitions for rural and urban areas. Researchers should provide a rationale for why<br />
a particular definition was chosen and consider using more than one definition and reporting all<br />
results. Many factors are correlated with rurality, and adjusting for all available covariates may<br />
lead to false conclusions regarding the association of rurality and study outcomes and provide<br />
insufficient information for the development of healthcare policy. For most research questions, a<br />
more contextual analytic approach should be used.<br />
Accordingly, statistical methods should be clearly defined and researchers should report bivariate<br />
associations between rurality and study outcomes in addition to the results of multivariate<br />
models. Specific examination of rurality and race (and/or income) should be considered when<br />
appropriate, as should potential regional differences in rural-urban healthcare disparities.<br />
Future research should move beyond documentation of differences between urban and rural<br />
health care and determine whether such differences lead to disparities in health outcomes.<br />
Studies examining health care for conditions requiring specialists or subspecialists should<br />
consider whether rural residents seek such treatment in local <strong>vs</strong>. urban settings. Across studies on<br />
rural <strong>vs</strong>. urban healthcare, prospective designs are greatly underutilized which significantly limits<br />
the strength of the evidence base.<br />
4
<strong>Rural</strong> <strong>vs</strong>. <strong>Urban</strong> <strong>Ambulatory</strong> <strong>Health</strong> <strong>Care</strong>: A Systematic <strong>Review</strong><br />
Evidence-based Synthesis Program<br />
EVIDENCE REPORT<br />
INTRODUCTION<br />
BACKGROUND<br />
There are approximately 3 million veterans enrolled in the VA health care system who live in<br />
rural areas (as defined by VA) -- nearly 40% of the almost 8 million veterans who are current<br />
users of VA health care. 1 Given that only 17% of the US population lives in rural areas, rural<br />
residents are disproportionately represented among veterans using VA services. 2 This trend is<br />
likely to continue, as more than one-third of OEF/OIF veterans are from rural areas. 3 The <strong>Rural</strong><br />
Veterans <strong>Care</strong> Act of 2006 was signed into law to improve care for rural veterans. Ensuring that<br />
the health care needs of rural veterans are met has become a top priority for VA, resulting in<br />
a considerable expansion of community based outpatient clinics (CBOC’s), inclusion of rural<br />
health/access as a research priority, and creation of the VA Office of <strong>Rural</strong> <strong>Health</strong> (ORH) in<br />
2006.<br />
A comparison of rural and urban veterans enrolled in VA health care in 1999 observed that rural<br />
veterans had lower overall health quality of life (both physical and mental), more comorbidities,<br />
and lower health quality of life within disease category than urban veterans. 4,5 Although more<br />
recent assessments have shown that rural veterans appear to have comparable or even better<br />
mental health quality of life than urban veterans, the lower physical health quality of life in rural<br />
veterans has persisted over time. 6,7 While differences in health care use between rural and urban<br />
veterans have been documented, 8 it is unclear to what extent such differences in service use<br />
contribute to the observed differences in health outcomes. Some of the rural-urban difference in<br />
physical health quality of life among VA users is likely due to differences in disease prevalence, 4<br />
with elevated prevalence rates across numerous conditions among those rural veterans who use<br />
VA care. 9 It remains to be determined, however, whether the observed lower health quality of<br />
life among rural veterans is due to differences in disease prevalence, disparities in health care<br />
or differences in other population characteristics. Because this review focuses on health care,<br />
differences in rural-urban prevalence rates of diseases and other health conditions are beyond<br />
its scope. This systematic review examines the evidence regarding potential disparities between<br />
rural and urban areas in health care provision and delivery, and how differences in health care<br />
may contribute to disparities in health outcomes.<br />
Our first goal was to determine if a health care disparity exists across the urban-rural spectrum.<br />
For a disparity to exist, it would have to be demonstrated that health care outcomes of patients<br />
in rural areas differ from those of patients treated in urban areas for similar conditions. Because<br />
differences in health care process or delivery do not necessarily lead to disparities, we looked for<br />
evidence associating differences with poorer health outcomes. In their report, Unequal treatment:<br />
Confronting racial and ethnic disparities in healthcare, the Institute of Medicine 10 defined<br />
disparity as, “…racial or ethnic differences in the quality of health care that are not due to<br />
access-related factors or clinical needs, preferences, and appropriateness of intervention”(pg 32).<br />
They go on to note, however, that inequity in care is often due to access-related factors, and that<br />
access differences are integrally tied to bias, stereotyping and inherent differences in health care<br />
5
<strong>Rural</strong> <strong>vs</strong>. <strong>Urban</strong> <strong>Ambulatory</strong> <strong>Health</strong> <strong>Care</strong>: A Systematic <strong>Review</strong><br />
Evidence-based Synthesis Program<br />
systems. For the purposes of this review we conceptualized rural-urban disparities as differences<br />
in health care quality or availability.<br />
A second goal of the review was to identify areas for intervention should any disparities be<br />
found. In order to develop a meaningful intervention, specific information regarding differences<br />
in the structure of health care and the way it is administered (i.e., the process) would be critical.<br />
Since differences in health outcomes can occur for reasons other than differences in the health<br />
care systems themselves (e.g., accessibility), our third goal was to examine what, if any, nonhealth<br />
care factors (e.g., travel distance to a clinic) affected health outcomes. Because veterans<br />
who use VA health care actually use more non-VA health care overall, 9 we expanded the focus of<br />
this review to include comparisons of rural <strong>vs</strong>. urban health care in non-VA health systems.<br />
DEFINITIONS OF RURALITY<br />
As noted in a review of the VA rural health literature by Weeks et al. (2008), 11 synthesizing the<br />
literature on rural health is complicated by the methodologic and conceptual issues inherent<br />
in such a diverse literature. One recurrent problem is the lack of consistency across studies<br />
regarding the conventions used to define levels of rurality across communities, zip codes<br />
or counties. 11 This inconsistency affects interpretation of the individual studies as well as<br />
comparability of findings across studies. 12,13 It is beyond the scope of this review to address the<br />
complexities and ramifications of using specific population density classification schemes (for<br />
a discussion see Berke et al., 2009 14 ; Stern et al., 2010 12 ; West, 2010 13 ). However, given the<br />
implications of this variation, we note the particular convention used to categorize rurality used<br />
in each study in the evidence tables for each section. For the convenience of readers who may be<br />
unfamiliar with these conventions, we provide a table of the most commonly used conventions<br />
along with a brief description of each (Table 1).<br />
6
<strong>Rural</strong> <strong>vs</strong>. <strong>Urban</strong> <strong>Ambulatory</strong> <strong>Health</strong> <strong>Care</strong>: A Systematic <strong>Review</strong><br />
Evidence-based Synthesis Program<br />
Table 1. Definitions of <strong>Urban</strong> and <strong>Rural</strong> (West et al. 2010; 13 Berke et al. 2009 14 )<br />
<strong>Rural</strong>/<strong>Urban</strong> Definitions<br />
Office of Management<br />
and Budget (OMB) Metropolitan<br />
and Micropolitan<br />
Areas (2000)<br />
U.S. Department of<br />
Agriculture (USDA) <strong>Rural</strong><br />
<strong>Urban</strong> Continuum Codes<br />
Unit of <strong>Rural</strong><br />
Definition<br />
County Level<br />
County Level<br />
Designations<br />
Descriptions<br />
The Office of Management and Budget (OMB) Metropolitan and Micropolitan statistical areas are a county level classifications<br />
defined by the existence of an urban core, the population of the urban core, and the economic and social integration of<br />
its surrounding territory measured by commuting ties. The OMB strongly cautions against the use of Metropolitan and Micropolitan<br />
Statistical Area Standards for defining urban-rural definitions due to the fact that all counties included in Metropolitan<br />
and Micropolitan Statistical Areas and many other counties contain both urban and rural territory and populations.<br />
Metropolitan Statistical • Contains an <strong>Urban</strong>ized Area of 50,000 or more population and adjacent territory that has a high degree<br />
Area<br />
of social and economic integration with the core as measured by commuting ties<br />
Micropolitan Statistical • Contains an <strong>Urban</strong> Core of at least 10,000, but less than 50,000, population and adjacent territory that has<br />
Area<br />
a high degree of social and economic integration with the core as measured by commuting ties<br />
Non-core based • Based on an <strong>Urban</strong> Center of less than 10,000 people.<br />
Metro<br />
Non-metro<br />
The 2003 USDA <strong>Rural</strong>-<strong>Urban</strong> Continuum Codes form a classification scheme that distinguishes metropolitan<br />
counties by size and nonmetropolitan counties by degree of urbanization and proximity to metro areas. This standard<br />
divides those of the Office of Management and Budget (OMB) into three metro and six non-metro categories,<br />
resulting in a 9-part county coding system. The standards for defining metropolitan areas were modified in 1958,<br />
1971, 1975, 1980, 1990, and 2000. The current scheme was originally developed in 1974. This version allows researchers<br />
to specific populations based on population density and metro influence. Due to changes by the OMB’s<br />
metro area delineation procedures for the 2000 Census, the current 2003 standards are not fully compatible with<br />
those of earlier years.<br />
• Counties in metro areas of 1 million population or more<br />
• Counties in metro areas of 250,000 to 1 million population<br />
• Counties in metro areas of fewer than 250,000 population<br />
• <strong>Urban</strong> population of 20,000 or more, adjacent to a metro area<br />
• <strong>Urban</strong> population of 20,000 or more, not adjacent to a metro area<br />
• <strong>Urban</strong> population of 2,500 to 19,999, adjacent to a metro area<br />
• <strong>Urban</strong> population of 2,500 to 19,999, not adjacent to a metro area<br />
• Completely rural or less than 2,500 urban population, adjacent to a metro area<br />
• Completely rural or less than 2,500 urban population, not adjacent to a metro area<br />
Veteran’s Affairs (VA) County Level The VA system of urban/rural classification combines those of the census blocks following census tracts urbanized areas<br />
and those of county population density.<br />
<strong>Urban</strong><br />
• <strong>Urban</strong> nucleus of 50,000 or more people which may or may not contain any individual cities of 50,000 or more, but<br />
must have a core with a population density of 1,000 persons per square mile and may contain adjoining territory<br />
with at least 500 persons per square mile.<br />
<strong>Rural</strong><br />
• Those counties not falling into the extremes of <strong>Urban</strong> or Highly <strong>Rural</strong><br />
Highly <strong>Rural</strong><br />
• Counties with an average population density of 7 residents per square mile<br />
7
<strong>Rural</strong> <strong>vs</strong>. <strong>Urban</strong> <strong>Ambulatory</strong> <strong>Health</strong> <strong>Care</strong>: A Systematic <strong>Review</strong><br />
Evidence-based Synthesis Program<br />
<strong>Rural</strong>/<strong>Urban</strong> Definitions<br />
US Dept of Agriculture<br />
<strong>Rural</strong> <strong>Urban</strong> Commuting<br />
Area codes (RUCA)<br />
U.S. Census <strong>Urban</strong> <strong>Rural</strong><br />
Definitions<br />
US Dept of Agriculture<br />
<strong>Urban</strong> Influence Codes<br />
Unit of <strong>Rural</strong><br />
Definition<br />
Census Tract Level<br />
Population Density<br />
Population Density and<br />
proximity to urban areas<br />
Designations<br />
<strong>Urban</strong> Areas<br />
Large <strong>Rural</strong> Towns<br />
Small <strong>Rural</strong> Towns<br />
Isolated <strong>Rural</strong> Towns<br />
8<br />
Descriptions<br />
RUCA is a 33 code system which defines rural areas in terms of census tracts based on population density in an “urban<br />
area” combined with primary and secondary commuter flow rates. Census tracts can be converted to a ZIP code approximation.<br />
Operationalization of this classification system typically involves grouping these codes into larger categories. The most<br />
common grouping uses a 4 tier system including <strong>Urban</strong> Areas, Large <strong>Rural</strong> Towns, Small <strong>Rural</strong> Towns, and Isolated <strong>Rural</strong><br />
Towns. Below are the various versions and their data sources over time.<br />
Version 1.1 - First publicly released RUCA files. Based on 1998 ZIP code areas and 1990 Census commuting data. Data<br />
are not available.<br />
Version 1.11 - ZIP code correction made in Oregon file.<br />
Version 2.0 - Based on 2004 ZIP code areas and 2000 Census commuting data.<br />
*An additional 2.0 version based on 2006 ZIP code areas and 2000 commuting data is also available.<br />
• ZIP codes or census tracts that have Metropolitan cores as defined by the OMB<br />
• ZIP codes or census tracts with Micropolitan cores and substantial commuting patterns to urban clusters<br />
• ZIP codes or census tracts with primary commuting flows to or within population centers of between 2,500 and<br />
9,999 residents<br />
• ZIP codes or census tracts in less populated rural areas with no primary commuting flows to <strong>Urban</strong>ized Areas or<br />
<strong>Urban</strong> Clusters<br />
2000 census criteria All territory, population, and housing units located within an urbanized area (UA) or an urban cluster<br />
(UC). It delineates UA and UC boundaries to encompass densely settled territory, which consists of:<br />
• core census block groups* or blocks that have a population density of at least 1,000 people per square mile and<br />
• surrounding census blocks that have an overall density of at least 500 people per square mile<br />
“<strong>Rural</strong>” therefore consists of all territory, population, and housing units located outside of UAs and UCs. Geographic entities,<br />
such as census tracts, counties, metropolitan areas, and the territory outside metropolitan areas, often are “split” between<br />
urban and rural territory, and the population and housing units they contain often are partly classified as urban and partly<br />
classified as rural.<br />
1990 census criteria All territory, population, and housing units in urbanized areas and in places of 2,500 or more persons<br />
outside urbanized areas. More specifically, “urban” consists of territory, persons, and housing units in:<br />
1. Places of 2,500 or more persons incorporated as cities, villages, boroughs (except in Alaska and New York), and towns<br />
(except in the six New England states, New York, and Wisconsin), but excluding the rural portions of “extended cities.”<br />
2. Census designated places of 2,500 or more persons.<br />
3. Other territory, incorporated or unincorporated, included in urbanized areas.<br />
<strong>Urban</strong>ized Area • An urbanized area consists of a central city and surrounding areas whose population is > 50,000.<br />
They may or may not contain individual cities with 50,000 or more; rather, they must have a core with<br />
a population density generally exceeding 1,000 persons per square mile; and may contain adjoining<br />
territory with at least 500 persons per square mile (other towns outside of an urbanized area whose<br />
population exceeds 2,500).<br />
<strong>Rural</strong> Area<br />
• <strong>Rural</strong> areas comprise open country and settlements with fewer than 2,500 residents; areas designated<br />
as rural can have population densities as high as 999 per square mile or as low as 1 person per<br />
square mile.<br />
• <strong>Urban</strong> Influence Codes (2003) divide the 3,141 US counties into 12 groups combing both population<br />
density and proximity to urban areas.<br />
Metro counties<br />
• Divided into “large” areas with at least 1 million residents and “small” areas < 1 million residents.<br />
Nonmetro<br />
micropolitan counties<br />
Nonmetro noncore<br />
counties<br />
• Divided into three groups: adjacent to a large metro area, adjacent to a small metro area, and not<br />
adjacent to a metro area.<br />
• Divided into seven groups by: 1). their adjacency to metro or micro areas and 2) whether or not they<br />
have a town/village of at least 2,500 residents.<br />
*Census block group (BG) - an area normally bounded by visible features, such as streets, streams, and railroads, and by non-visible features, such as the boundary of an incorporated place.
<strong>Rural</strong> <strong>vs</strong>. <strong>Urban</strong> <strong>Ambulatory</strong> <strong>Health</strong> <strong>Care</strong>: A Systematic <strong>Review</strong><br />
Evidence-based Synthesis Program<br />
METHODS<br />
TOPIC DEVELOPMENT<br />
This project was nominated by HSR&D and the Office of <strong>Rural</strong> <strong>Health</strong>. The analytic framework<br />
and key questions were developed with input from technical expert panel members Brian Bair,<br />
MD; John Fortney, PhD; Peter Kaboli, MD, MS; Ryan Lilly, MPA; and Alan West, PhD.<br />
The analytic framework is depicted in Figure 1. The final key questions are:<br />
Key Question #1. Do adults with health care needs who live in rural areas have different<br />
intermediate (e.g., HbA1c, Blood pressure, etc.) or final health care outcomes (i.e., mortality,<br />
morbidity, QOL) than those living in urban areas?<br />
Key Question #2. Is the structure (e.g., types of available providers) or the process (e.g.,<br />
likelihood of referral) of health care different for adults with health care needs who live in urban<br />
<strong>vs</strong>. rural environments?<br />
Key Question #3. If there are differences in the structure or the process of health care in rural <strong>vs</strong>.<br />
urban environments, do those differences contribute to variation in overall or intermediate health<br />
outcomes for adults with health care needs?<br />
Key Question #4. If there are differences in intermediate or final health outcomes for adult<br />
patients with health care needs, what systems factors other than those due to differences in health<br />
care structure or process moderate those differences (e.g., travel distance)?<br />
SEARCH STRATEGY<br />
We searched OVID MEDLINE, PsycINFO, and CINAHL from 1990 to June, 2010 using the<br />
following MEDLINE search terms (or the corresponding terms in PsycINFO and CINAHL):<br />
hospitals, rural; rural health; rural population; rural health services, and United States. Limits<br />
to the search included English language, published 1990 or later, population age of 18 years or<br />
older, and publication types randomized controlled trial, clinical trial, cohort or cross-sectional<br />
study, meta-analysis, or review. Additionally, we did a hand search of references lists of relevant<br />
articles and of The Journal of <strong>Rural</strong> <strong>Health</strong> using the limits noted above.<br />
Figure 1. Analytic Framework<br />
KQ1<br />
Adult with <strong>Health</strong>care<br />
Need<br />
KQ1<br />
Intermediate<br />
Outcomes:<br />
(e.g., HgbA1c,<br />
Blood pressure)<br />
Final <strong>Health</strong><br />
Outcomes:<br />
(e.g., Quality of Life,<br />
Patient Satisfaction,<br />
Morbidity, Mortality<br />
KQ2<br />
Structure and/or<br />
Process Differences?<br />
(e.g., Provider Expertise,<br />
Liklihood of Referral)<br />
KQ3<br />
KQ4<br />
Non-Patient<br />
Moderating or<br />
Mediating Factors<br />
(e.g., Travel Distance)<br />
9
<strong>Rural</strong> <strong>vs</strong>. <strong>Urban</strong> <strong>Ambulatory</strong> <strong>Health</strong> <strong>Care</strong>: A Systematic <strong>Review</strong><br />
Evidence-based Synthesis Program<br />
STUDY SELECTION<br />
The principal investigator, co-investigators, and one of the research associates, all with<br />
experience in critical review of published studies, reviewed abstracts of articles identified in<br />
the search and selected articles for further review based on pre-defined exclusion criteria. In<br />
addition to the exclusion criteria used to limit the search, we also excluded articles if they were<br />
not about health care (e.g., focused on disease prevalence), if they did not include patients from<br />
rural settings, or if they were not about ambulatory care. Eligible articles provided primary data<br />
relevant to the key questions.<br />
DATA ABSTRACTION<br />
Data from eligible articles was abstracted by the principal investigator, co-investigators, and<br />
one of the research associates onto a brief screening form (see Appendix A). The principal<br />
investigator developed the form and all abstractors completed forms for a common set of six<br />
articles. Results of the trial abstraction were reviewed with the principal investigator. The<br />
abstraction form captured data on the study design, sample (including whether the subjects in<br />
the study were Veterans), definition of rural used in the study, data source including the date of<br />
datesets used, analyses including covariates, and outcome measures.<br />
DATA SYNTHESIS<br />
Because we wished to examine the body of evidence related to specific areas of health care, the<br />
studies were reviewed with other studies in that area. We constructed evidence tables showing<br />
the study characteristics and results for all included studies. We critically analyzed studies to<br />
compare their characteristics, methods, and findings. We compiled a summary of findings for<br />
each clinical topic, and drew conclusions based on a qualitative synthesis of the findings.<br />
RATING THE BODY OF EVIDENCE<br />
Due to the qualitative nature of the synthesis, standard methods for rating the body of evidence<br />
do not apply and there are no validated rating systems to compare the quality of observational<br />
studies. Based on the work of others, 15,16,17 we developed a rating system that we used as a<br />
heuristic in our efforts to compare studies that used different methodologies and to facilitate<br />
a synthesis of the evidence base in each content area. Although these ratings are essentially<br />
qualitative in nature, they provide the reader with information regarding our evaluations of the<br />
studies and, consequently, the overall evidence base. For each study, we evaluated the internal<br />
and the external validity, and then assigned an overall Confidence Score based on these ratings.<br />
The principal investigator and one of the co-investigators rated all articles after independently<br />
rating a set of 20 articles and reviewing the results. In Table 2 we detail the scales used and the<br />
kinds of elements that were considered within each rating category.<br />
10
<strong>Rural</strong> <strong>vs</strong>. <strong>Urban</strong> <strong>Ambulatory</strong> <strong>Health</strong> <strong>Care</strong>: A Systematic <strong>Review</strong><br />
Evidence-based Synthesis Program<br />
Table 2. Explanation of Confidence Scores<br />
Internal Validity<br />
Sampling Method/Bias<br />
Predictors/Confounders<br />
Outcomes<br />
Statistical Methods<br />
External Validity<br />
Use of proxy variables or<br />
aggregate measures<br />
Representativeness of<br />
sample<br />
Study design appropriate<br />
for the research question?<br />
Overall Confidence<br />
Score<br />
Rated G(Good), F(Fair), P(Poor). In order to receive a “G” for internal validity would<br />
need to have “G” ratings for all subsumed elements.<br />
Low response rates without correction; convenience sampling;<br />
Omission of socioeconomic/insurance factors or other factors usually associated with<br />
service use (e.g., age).<br />
Unreliable or not validated measures; use of proxy variables (e.g., self-reported service<br />
use)<br />
Omission of bivariate or multivariate statistics; Ignored data clustering<br />
Rated G(Good), F(Fair), P(Poor). In order to receive a “G” for external validity would<br />
need to have “G” ratings for all subsumed elements.<br />
Use of county level predictors or outcomes in lieu of individual ones; Dichotomized<br />
urban rural without further gradations if urban/rural were a covariate in their model.<br />
Small samples; samples limited to one demographic group; no correction for biased<br />
sampling;<br />
Dichotomized urban rural without further gradations if area of residence was the focus<br />
of the study; poorly conceptualized study; data insufficient to answer primary research<br />
question.<br />
Rated as follows:<br />
High Quality = further research unlikely to change confidence in effects. Both internal<br />
and external rated as “G”<br />
Moderate Quality= further research likely to have an important impact on confidence<br />
and may change the estimate of effect.<br />
Low Quality= further research is very likely to have an important impact and will likely<br />
change the estimate of effect.<br />
Very Low Quality= any estimate of effect is uncertain.<br />
Note: “H” Overall Confidence Score would require “Good” ratings for both Internal and<br />
External Validity.<br />
PEER REVIEW<br />
A draft version of this report was sent to nine peer reviewers. Their comments and our responses<br />
are presented in Appendix B.<br />
11
<strong>Rural</strong> <strong>vs</strong>. <strong>Urban</strong> <strong>Ambulatory</strong> <strong>Health</strong> <strong>Care</strong>: A Systematic <strong>Review</strong><br />
Evidence-based Synthesis Program<br />
RESULTS<br />
LITERATURE FLOW<br />
The literature flow is presented in Figure 2. The combined search library contained 1,381 citations,<br />
of which we reviewed 333 articles at the full-text level. We excluded 165 of the 333 articles<br />
and added 24 references through hand-searching reference lists of relevant articles and The<br />
Journal of <strong>Rural</strong> <strong>Health</strong>. Of 192 possible studies, we excluded 93 because they were not related<br />
to ambulatory care, described an intervention, or provided background information. Three studies<br />
were added based on comments received during peer-review resulting in 102 articles reporting<br />
data pertaining to one of the key questions. The included articles were categorized under the<br />
following ambulatory care services: preventive care/ambulatory care sensitive conditions, cancer<br />
care, diabetes/end stage renal disease, cardiovascular disease, HIV/AIDS, neurologic conditions,<br />
and mental health. We also identified and included articles focused on use of medication, medical<br />
procedures and tests, and provider and service utilization more generally.<br />
Figure 2. Flow Diagram of Included Studies<br />
Search results (MEDLINE,<br />
PsycINFO, CINAHL)<br />
(n=1,381)<br />
Studies added:<br />
a. hand searching (n=5)<br />
b. Journal of <strong>Rural</strong> <strong>Health</strong><br />
(n=19)<br />
Abstract <strong>Review</strong><br />
Potentially eligible studies for<br />
full text review (n=333)<br />
Articles abstracted (n=192)<br />
Non-United States population = 50<br />
Population
<strong>Rural</strong> <strong>vs</strong>. <strong>Urban</strong> <strong>Ambulatory</strong> <strong>Health</strong> <strong>Care</strong>: A Systematic <strong>Review</strong><br />
Evidence-based Synthesis Program<br />
PREVENTIVE CARE/AMBULATORY CARE SENSITIVE CONDITIONS<br />
(Table 3 and Appendix C, Tables 1 and 2)<br />
There were two studies looking at immunization rates, 18,19 nine looking at cancer screening<br />
rates, 18-26 one examining prenatal care, 27 and three examining hospital rates for ambulatory care<br />
sensitive conditions. 28-30<br />
Immunization rates were examined in only two studies, both using data more than 10 years<br />
old. Among respondents to the 1994 US National <strong>Health</strong> Interview Survey, the rate of flu shot<br />
receipt among 4,051 people over 65 yr was examined. 19 No differences were observed between<br />
older rural and urban residents in the receipt of flu vaccine in adjusted analyses. Similarly,<br />
national data of 130,452 respondents from the 1997 Behavioral Risk Factor Surveillance System<br />
(BRFSS) and the 1999 Area Resource File found no rural-urban differences in the rates of either<br />
flu or pneumonia vaccines among women age 65 years and older. 18<br />
Only one study examined prenatal care. 27 This study used the 2003 Oregon Pregnancy Risk<br />
Assessment Monitoring System to examine the odds of receiving prenatal care after the first<br />
trimester in RUCA defined urban, large rural and small rural areas among 1,508 women. Women<br />
were surveyed post childbirth about when during their pregnancy they initiated prenatal care<br />
(if at all). No differences were found between residence categories in the odds of late initiation<br />
(after first trimester) of prenatal care. However, given methodologic problems with the study, our<br />
confidence in this finding is moderately low.<br />
<strong>Ambulatory</strong> care sensitive conditions (ACSC) are those conditions in which inadequate<br />
outpatient treatment leads to increases in hospitalization. 30 Conditions that are considered to be<br />
ambulatory care sensitive include congestive heart failure (CHF), hypertension, angina, chronic<br />
obstructive pulmonary disease, as well as other conditions in which hospitalization can usually<br />
be avoided, such as bacterial pneumonia, cellulitis, diabetes, gastroenteritis, asthma, and urinary<br />
tract infections. A study of the prevalence of ACSC hospital admissions in New York State<br />
from 1991-1993 found that the rates increased as population density decreased within each of<br />
the demographic groupings (New York City area, upstate urban-suburban areas, more remote<br />
rural). They did not compare across areas. Of note, the percentage of blacks was positively<br />
associated with the rate of ACSC admissions in the two more populous groupings. 30 In a much<br />
better designed study, Laditka (2009) examined ACSC admissions in 8 states during 2002. 28<br />
They reported a step-wise increase in the rate ratios of admissions for patients 18-64 years across<br />
levels of rurality adjusted for demographics and availability of health care services. Although<br />
further adjustment for death rates from chronic diseases (e.g., heart disease) did not change the<br />
association appreciably, adjustment for percentage of population that was uninsured reduced<br />
the association across all levels of population density, suggesting that insurance-related access<br />
contributed to the variation across the spectrum of population density. However, since rates in<br />
the most rural areas remain elevated relative to urban rates even after adjusting for insurance<br />
(RR=1.28, 95%CI=1.12-1.47) the contribution of insurance possession to the population density<br />
effect is only partial. For patients 65 years or older, the step-wise increase in ACSC admissions<br />
was retained when all adjustments were made except for those related to death rates and<br />
physician supply (which was not significantly associated with ACSC admissions) (RR=1.46,<br />
95%CI=1.39-1.52 most rural:urban).<br />
13
<strong>Rural</strong> <strong>vs</strong>. <strong>Urban</strong> <strong>Ambulatory</strong> <strong>Health</strong> <strong>Care</strong>: A Systematic <strong>Review</strong><br />
Evidence-based Synthesis Program<br />
A study of secondary and tertiary prevention among 787 older adults with ACSCs (specifically,<br />
arthritis, hypertension, coronary heart disease, diabetes mellitus, peptic ulcer disease, and chronic<br />
obstructive pulmonary disease [COPD]), was conducted in Iowa in 1995. 29 No differences<br />
were found between rural and urban residents in condition-specific prevention scores, but<br />
methodologic limitations of this study resulted in a low Confidence Score, suggesting that these<br />
results are likely to change with new information. Although rural residents with these chronic<br />
conditions saw fewer specialists than urban residents (7% <strong>vs</strong>. 12%, p
<strong>Rural</strong> <strong>vs</strong>. <strong>Urban</strong> <strong>Ambulatory</strong> <strong>Health</strong> <strong>Care</strong>: A Systematic <strong>Review</strong><br />
Evidence-based Synthesis Program<br />
mammography and clinical breast exams among 108,326 women over 40 years old, and cervical<br />
cancer screens among 131,813 women over the age of 18 years. 21 Among rural women over 40<br />
years old, 66.7% had mammograms and 73% had clinical breast exams. The rates among urban<br />
women were 75.4% for mammography and 78.2% for clinical breast exams. Similar differences<br />
for cervical cancer screening rates were found, with 81.3% of rural women and 84.5% of the<br />
most urban women getting screens. These differences were attenuated with adjustment, but<br />
remained significant. Of note, rural-urban differences were greater among black and Hispanic<br />
women. Finally, a study examining cervical screening rates using 2002 BRFSS, found that the<br />
odds of receiving a Pap test among 91,492 rural women depended on the number of available<br />
primary care providers. 23 <strong>Urban</strong> women who lived in counties with fewer providers (i.e., fewer<br />
than 300 primary providers per 100,000 women) were more likely to get a Pap test than rural or<br />
suburban women from counties with similar provider availability (OR=1.13, 95%CI=1-1.28). In<br />
counties in which there were moderate numbers of providers (i.e., 300-500 per 100,000 women),<br />
only those in suburban counties were disadvantaged (OR=0.72, 95%CI=0.55-0.94). The odds<br />
of mammogram receipt were greater for urban (OR=1.21, 95%CI=1.11-1.32) and suburban<br />
(OR=1.28, 95%CI=1.17-1.4) women than rural women independent of provider availability.<br />
In both regional studies in which breast and cervical cancer screening rates were assessed<br />
there was a rural disadvantage, though significance remained after adjustment in only one of<br />
the studies. Using state BRFSS data from 1996-1997, non-disabled rural women in Iowa were<br />
found to have had lower rates of screening for breast (X 2 =5.73, p
<strong>Rural</strong> <strong>vs</strong>. <strong>Urban</strong> <strong>Ambulatory</strong> <strong>Health</strong> <strong>Care</strong>: A Systematic <strong>Review</strong><br />
Evidence-based Synthesis Program<br />
Of note, screening rates are not uniformly lower across rural areas. For example, a study looking<br />
at rates of mammography in randomly selected <strong>Rural</strong> <strong>Health</strong> Clinics nationally found triple<br />
the rate of screening in the Middle third of the country compared to that in the Western third of<br />
the country (OR=3.75, 95%CI=1.43-9.87). 31 Studies using national databases, therefore, may<br />
overlook actual rural-urban differences by pooling across regions.<br />
Hospitalizations associated with ACSCs are, at best, indirect measures of health care quality<br />
and/or access. Of the two studies examining hospitalization rates for ACSCs, we had<br />
greater confidence in the study that sampled from eight states and in which a higher rate of<br />
hospitalization for these conditions was found in rural areas. That the presence of federally<br />
qualified <strong>Rural</strong> <strong>Health</strong> Clinics or Community <strong>Health</strong> Centers have been found in other studies to<br />
diminish the rates of ACSC hospital admissions, 32 suggests that such admissions may be related<br />
to the availability of health care resources. Still, given the limited evidence base, this can only be<br />
viewed as provisional.<br />
Table 3. Confidence Scores for Preventive <strong>Care</strong>/<strong>Ambulatory</strong> <strong>Care</strong> Sensitive Condition Studies<br />
Casey<br />
2001 18<br />
Zhang<br />
2000 19<br />
Kinney<br />
2006 24<br />
Epstein<br />
2009 27<br />
Laditka<br />
2009 28<br />
Schreiber<br />
1997 30<br />
Saag 1998 29<br />
18<br />
Coughlin<br />
2002 21<br />
Coughlin<br />
2004 22<br />
Coughlin<br />
2008 23<br />
Stearns<br />
2000 26<br />
Brown<br />
2009 20<br />
Schootman<br />
1999 25<br />
Study<br />
Internal Validity G G G F G F F G G G G G G<br />
Sampling Method/Bias G G G F G G F G G G G G G<br />
Predictors/Confounders G G G G G F G G G G G G G<br />
Outcomes G G G F/P G G F G G G G G G<br />
Statistical Methods G G G G G F G G G G G G G<br />
External Validity G F G F F F F G G G F F F<br />
Use of proxy variables or<br />
aggregate measures<br />
Sample Representativeness<br />
(size, composition)<br />
Design appropriate for the<br />
research question<br />
G G G G F F F G G G G G F<br />
G F G F G G G G G G F G G<br />
G G F G G F G G G G G F F<br />
Overall Confidence Score H M M M/L M L L H H H M M M<br />
CANCER CARE (Table 4 and Appendix C, Table 3)<br />
Comparisons of rural and urban health care for cancer have focused on variation in staging,<br />
mortality, and quality of care. There were 12 studies comparing urban and rural cancer care.<br />
Three studies examined mortality. 25,33,34 Nine studies examined cancer stage at the time of<br />
diagnosis, 24,25,33,35-40 three studies examined the relationship between screening and disease<br />
progression, 25,35,37 and five looked at treatment quality. 33-35,41,42<br />
Of the three studies of mortality, two were of regional samples and the one national study used<br />
a sample of people 65 years and older. Using the Iowa Surveillance, Epidemiology, and End<br />
16
<strong>Rural</strong> <strong>vs</strong>. <strong>Urban</strong> <strong>Ambulatory</strong> <strong>Health</strong> <strong>Care</strong>: A Systematic <strong>Review</strong><br />
Evidence-based Synthesis Program<br />
Results (SEER) database for 1991-1995 and the BFRSS database for 1996-1997, mortality among<br />
breast and cervical cancer patients was examined. 25 No differences in age adjusted mortality rates<br />
for cervical and breast cancer were found between rural and urban women. Similarly, using the<br />
national SEER database and the Medicare Claims database from 1995 and 1999, patients over<br />
65 years with lung cancer were identified and service utilization, stage of illness at presentation<br />
and mortality rates were compared across four levels of rurality (N=26,073). 33 As in the Iowa<br />
study, no differences were seen in overall survival between rural and urban areas either before or<br />
after adjustments. Factors that were predictive of mortality were patient demographics, receipt<br />
of radiation for those with stage II and IV disease, and the number of subspecialists per 10,000<br />
residents 65 years and older. Both the odds of radiation receipt and the supply of subspecialists<br />
were lower in rural areas (radiation 47.0% urban <strong>vs</strong>. 43.2% rural, trend only; subspecialists: urban<br />
10.6 ±7.6 per 10,000 residents <strong>vs</strong>. most rural 1.2 ± 3.3 per 10,000, p
<strong>Rural</strong> <strong>vs</strong>. <strong>Urban</strong> <strong>Ambulatory</strong> <strong>Health</strong> <strong>Care</strong>: A Systematic <strong>Review</strong><br />
Evidence-based Synthesis Program<br />
and state databases. For example, examination of the rate of in situ <strong>vs</strong>. invasive breast and<br />
cervical cancers recorded in the Iowa SEER database between 1991-1995 showed that women<br />
who were from more urban areas had higher age-adjusted rates of in situ breast cancer (47.7<br />
<strong>vs</strong>. 37.3 per 100,000) and lower rates of invasive cervical cancer (7.3 <strong>vs</strong>. 9.3 per 100,000),<br />
both of which were interpreted as indicating underutilization of screening in rural areas. 25<br />
Similarly, among 2,568 cancer patients in the Lake Superior area study who were staged at<br />
the time of diagnosis, rural residents with breast, colorectal, and non-small cell lung cancers<br />
were more likely to present at later stages of disease progression than urban residents with<br />
those conditions. 35 Staging differences were not noted for prostate or small cell lung cancers,<br />
however. The Mississippi study also found that rural residents were more likely to present with<br />
regional or distant metastatic disease (<strong>vs</strong>. local) compared to urban residents when cancer types<br />
were considered collectively (Χ 2 =8.4, df=2, p
<strong>Rural</strong> <strong>vs</strong>. <strong>Urban</strong> <strong>Ambulatory</strong> <strong>Health</strong> <strong>Care</strong>: A Systematic <strong>Review</strong><br />
Evidence-based Synthesis Program<br />
The advantage for large rural towns in the Illinois study was also found in a well designed study<br />
of cancer patients in Nebraska. Examination of the stage of cancer at the time of diagnosis<br />
among 5,521 incident colorectal cancers in Nebraska between 1998-2003 found that residents<br />
from micropolitan communities (i.e., counties with an urban cluster of 10,000 to 49,999 people)<br />
were more likely to present with CRC at earlier stages of disease than residents from more rural<br />
or more urban areas in both adjusted and unadjusted analyses (OR=1.22, 95%CI=1.05, 1.42). 40<br />
There were very few studies examining the quality of cancer care and those that did suggest that<br />
there may be lower quality care in rural areas. Elliott (2004) reported that rural treatment of cancer<br />
was found to be of lower quality in the Great Lakes region across cancer types in terms of initial<br />
management, clinical trial participation and post-treatment surveillance; however, scores derived<br />
to measure these variables were not independently validated. 35 In a study of almost 7,000 women<br />
treated for breast cancer from 1991-1996 in the national SEER database, younger women with<br />
newly diagnosed ductal carcinoma in situ had reduced odds of therapeutic radiation receipt if they<br />
lived in a rural area (OR=0.38). 42 While radiation receipt among younger women was not related<br />
to availability of therapeutic radiation in the patient’s county, for older women more distant access<br />
to a therapeutic radiation site was associated with reduced odds of radiation receipt (OR=0.48). A<br />
similar finding was observed in a national study of Medicare beneficiaries over 65 years, where<br />
fewer of those living in rural areas received radiation (most urban 46.8% <strong>vs</strong> most rural 43.2%). 33<br />
Two studies observed differences in the availability of cutting edge treatments, but since both<br />
studies were rated with fairly low Confidence Scores the findings should only be viewed as<br />
suggestive and worthy of further study. A study of 461 women with estrogen sensitive breast<br />
cancers listed in the North Carolina Central Cancer Registry and who were also Medicaid<br />
enrollees between 2000-2004 examined the odds of ever receiving a prescription for an<br />
aromatase inhibitor (<strong>vs</strong>. Tamoxifen only). <strong>Rural</strong> residents were less likely than urban patients to<br />
have received a prescription for an aromatase inhibitor (OR=0.54). 41 The quality of lymphoma<br />
treatment was found to be lagging in rural areas, but only if the provider was not university<br />
affiliated. 34 While this suggests that rural community based treatment for lymphoma is of lower<br />
quality, our confidence in the generalizability of these findings is relatively low.<br />
Summary<br />
The evidence for differences in cancer-related health outcomes related to place of residence is<br />
relatively weak for most outcomes. Many of the studies used data that were at least 10 years old.<br />
Given the rapidly evolving nature of oncologic care, this is a significant limitation.<br />
There were no consistent rural-urban differences in mortality or in the stage of illness at the time<br />
of initial presentation. Greater consistency was noted in the odds of unstaged disease, with rural<br />
residents less likely to have their cancer staged at the time of initial presentation. Interpretation<br />
of this finding is complicated by two factors, however. First, studies categorized patients by<br />
residence rather than by point of care and rural patients are more likely to pursue treatment for<br />
conditions such as cancer in urban areas. 43 <strong>Rural</strong> providers may not pursue diagnostic procedures<br />
necessary to stage cancer if the patient intends to pursue treatment elsewhere. Second, the<br />
evidence base may be subject to a reporting bias since the odds of cancer staging were never the<br />
primary focus of the studies reviewed and studies that did not find a difference may not have<br />
reported a null finding.<br />
19
<strong>Rural</strong> <strong>vs</strong>. <strong>Urban</strong> <strong>Ambulatory</strong> <strong>Health</strong> <strong>Care</strong>: A Systematic <strong>Review</strong><br />
Evidence-based Synthesis Program<br />
It must be noted that patients in rural areas are not homogeneous, and barriers impeding<br />
screening of and treatment for cancer vary within both urban and rural populations. Depending<br />
on the compositions of the rural and urban samples being compared, age differences, income<br />
factors and racial/ethnic disparities may underlie some rural-urban differences when they<br />
emerge. For example, the large percentage of low income blacks in Chicago relative to the more<br />
rural areas in Illinois likely contributed to urban disadvantage in the odds of later stage of cancer<br />
at initial presentation. Similarly, older breast cancer patients may be more affected by distance to<br />
care than younger patients.<br />
Finally, studies looking at rural-urban differences in quality of care were few and methodologically<br />
problematic given either a lack of association with specific treatment guidelines or that treatment<br />
guidelines changed during the course of the study (e.g., McLaughlin, 2009). 41<br />
Table 4. Confidence Scores for Cancer <strong>Care</strong> Studies<br />
Study<br />
Shugarman<br />
2008 33<br />
Loberiza<br />
2009 34<br />
Elliott<br />
2004 35<br />
Paquette<br />
2007 38<br />
Internal Validity G F F F F F G G G G/F F F<br />
Sampling Method/Bias G F G G G G G G G G G G<br />
Predictors/Confounders G F G F F F G G G G/F F G<br />
Outcomes (clarity of<br />
measurement)<br />
Higginbotham<br />
2001 37<br />
Chirumbole<br />
2009 36<br />
Schootman<br />
1999 25<br />
Kinney<br />
2006 24<br />
Sankaranarayanan<br />
2009 40<br />
McLafferty<br />
2009 39<br />
Schootman<br />
2001 42<br />
McLaughlin<br />
2009 41<br />
G G F G G F G G G G G F<br />
Statistical Methods G G G G F F G G G G G G<br />
External Validity F F F F F F F G G/F F F F<br />
Use of proxy variables or<br />
aggregate measures<br />
Representativeness of<br />
sample<br />
Study design appropriate<br />
for the research question?<br />
Overall Confidence<br />
Score<br />
G G G/F G G F G G G F F G<br />
F F/P G F G G G G G G G F/P<br />
G G F G F F F F G/F G G G<br />
M M/L M/L M M L M M H/M M M M/L<br />
DIABETES/END STAGE RENAL DISEASE (Table 5 and Appendix C,<br />
Table 4)<br />
Only three studies (all cross-sectional) examined potential differences in health outcomes<br />
between urban and rural residents for diabetes or kidney disease. 44-46 One moderate to high<br />
quality study relied on patient self-report to assess complications of diabetes in a national<br />
sample, 45 while a low quality examined the incidence of diabetes-related end-stage renal<br />
disease. 46 The third study, of high quality, examined mortality rates between urban and rural<br />
patients receiving dialysis. 44 There were six studies (also all cross-sectional) examining<br />
20
<strong>Rural</strong> <strong>vs</strong>. <strong>Urban</strong> <strong>Ambulatory</strong> <strong>Health</strong> <strong>Care</strong>: A Systematic <strong>Review</strong><br />
Evidence-based Synthesis Program<br />
differences in measures of care for diabetes (e.g., concordance with American Diabetes<br />
Association [ADA] guidelines). Two were of low quality, two were of moderate quality, and<br />
two were of moderate to high quality. The smallest study compared two sites, 47 two national<br />
studies reported no difference between rural and urban areas, 48,49 and another large national<br />
study reported a mixed effect of residence category in that some outcome measures were<br />
more favorable for those in rural areas whereas others were more favorable for those in urban<br />
areas. 45 A fifth study in Washington State found better quality of care measures in large towns<br />
than in either urban or more rural areas. 50 The sixth study of adherence to ADA guideline<br />
recommendations was a national study that found rural disparities, but only in some parts of the<br />
country, and rural advantage in others. 51<br />
In a study by Morden et al. (2010), 49 quality indicators of eye exams, foot exams, LDL levels,<br />
blood pressure and hemoglobin A1c (HbA1c) levels were assessed among 11,688 veterans with<br />
diabetes in 2005. No differences were found in quality indicators between highly rural and urban<br />
RUCA categories. Koopman (2006), using the National <strong>Health</strong> and Nutrition Examination Survey<br />
from 1988-1994 and rural or urban classification based on metropolitan statistical areas, found<br />
that urban Hispanics had higher odds of their diabetes not being detected relative to urban whites<br />
(3.7% <strong>vs</strong>. 2.3%), rural whites (2.8%), and rural Hispanics (2.7%; p
<strong>Rural</strong> <strong>vs</strong>. <strong>Urban</strong> <strong>Ambulatory</strong> <strong>Health</strong> <strong>Care</strong>: A Systematic <strong>Review</strong><br />
Evidence-based Synthesis Program<br />
get eye exams, but they were more likely than rural residents (defined based on RUCA with 4<br />
rural subgroups) to get an HbA1c check (55.6% <strong>vs</strong>. 52.2%) and a cholesterol screen (66.6% <strong>vs</strong>.<br />
63.2%). After adjustments, residents living in large remote rural towns were the most likely to<br />
have had the tests. Importantly, rural residents were only less likely to get the assessments if they<br />
had not seen an endocrinologist in the prior year. 50 That is, specialty consultation, much more<br />
common among urban residents, was a primary determinant as to whether patients received the<br />
guideline assessments.<br />
Some of the inconsistency across studies may be due to differences between rural and urban<br />
areas in the rate of adherence to guideline recommended tests across geographic regions of<br />
the country. For example, in an examination of the geographic distribution of diabetic patients<br />
receiving a composite measure of guideline tests (i.e., lipid levels, HbA1c levels, and eye<br />
exams), Weingarten et al. (2006), found that rural residents (categorized as rural or semi-rural)<br />
were actually more likely to receive the tests than urban residents depending on in which region<br />
of the country they lived. 51 Because the study relied on aggregate measures, however, this finding<br />
should be considered only tentative.<br />
One of the many deleterious consequences of poorly controlled diabetes is end-stage renal<br />
disease (ESRD). Ward (2009) compared the rural and urban zip codes of 18,377 diabetic patients<br />
in California for the odds of ESRD attributable to diabetes. 46 There was only a trend for a<br />
decreased likelihood of ESRD among rural patients (beta=-0.035, p
<strong>Rural</strong> <strong>vs</strong>. <strong>Urban</strong> <strong>Ambulatory</strong> <strong>Health</strong> <strong>Care</strong>: A Systematic <strong>Review</strong><br />
Evidence-based Synthesis Program<br />
Summary<br />
There were no consistent differences between rural and urban areas in diabetes treatment quality<br />
measures, and two of the largest, moderate to high quality studies found no differences. Whether<br />
rural-urban differences in diabetes care varies across regions of the country requires further<br />
exploration. 51 For all patients, having access to a physician, and possibly an endocrinologist, may<br />
increase the odds of both illness detection and adherence to treatment guidelines. The increased<br />
use of <strong>Rural</strong> <strong>Health</strong> Clinics in underserved areas has greatly improved treatment access and,<br />
consequently, adherence to treatment guidelines. 52<br />
There was also little evidence for a disparity between rural and urban patients with diabetes in<br />
terms of diabetes complications or the prevalence of ESRD. Once a patient had ESRD, racial<br />
differences clearly affected outcomes, and this variation across race/ethnicity groups interacted<br />
with rural <strong>vs</strong>. urban residential categories. For example, a high quality study reported that<br />
blacks with ESRD had lower transplant rates regardless of where they lived, but were more<br />
disadvantaged in rural areas. 44 In contrast, rural Native Americans were actually more likely than<br />
their urban counterparts to receive a transplant. 44<br />
Table 5. Confidence Scores for Diabetes and End-Stage Renal Disease Studies<br />
Study<br />
Andrus<br />
2004 47<br />
Weingarten<br />
2006 41<br />
Krisha<br />
2010 45<br />
Rosenblatt<br />
2001 50<br />
Morden<br />
2010 49<br />
Koopman<br />
2006 48<br />
Ward<br />
2009 46<br />
O’Hare<br />
2006 44<br />
Internal Validity F F G F G F F G<br />
Sampling Method/Bias F F G F G G F G<br />
Predictors/Confounders P P G F G G F G<br />
Outcomes G G G F G G F G<br />
Statistical Methods P G G F G F P G<br />
External Validity F/P F F F F F F G<br />
Use of proxy variables or<br />
aggregate measures<br />
Representativeness of sample<br />
(size, composition)<br />
Is the study design appropriate for<br />
the research question?<br />
F F G G G G F G<br />
P P F F G F F G<br />
F F F G F G F G<br />
Overall Confidence Score VL L H/M M H/M M L H<br />
CARDIOVASCULAR DISEASE (Table 6 and Appendix C, Table 5)<br />
Only five studies examined outpatient management of cardiovascular disease, and two of these<br />
were smaller regional studies. The largest study, and the only one for which we had at least a<br />
moderate to high Confidence Score, was done by Morden et al., (2010) on 23,780 veterans with<br />
hypertension, about one-third of whom also had a mental disorder. 49 No differences in blood<br />
pressure (BP) control were found across three RUCA categories.<br />
23
<strong>Rural</strong> <strong>vs</strong>. <strong>Urban</strong> <strong>Ambulatory</strong> <strong>Health</strong> <strong>Care</strong>: A Systematic <strong>Review</strong><br />
Evidence-based Synthesis Program<br />
A Colorado study compared quality of care for hypertension among 780 rural and urban patients<br />
with diabetes from 26 primary care sites. 53 The study relied on provider post-appointment<br />
surveys. They found that rural patients had lower systolic and diastolic BP, but that urban<br />
providers were more likely to take action than rural providers if the patient’s BP were poorly<br />
controlled (39.1% <strong>vs</strong>. 27.5%, p
<strong>Rural</strong> <strong>vs</strong>. <strong>Urban</strong> <strong>Ambulatory</strong> <strong>Health</strong> <strong>Care</strong>: A Systematic <strong>Review</strong><br />
Evidence-based Synthesis Program<br />
Table 6. Confidence Scores for Cardiovascular Disease Studies<br />
Study<br />
Morden<br />
2010 49<br />
King<br />
2006 54<br />
Colleran<br />
2007 55<br />
Hicks<br />
2010 53<br />
Internal Validity G P F F P<br />
Sampling Method/Bias G P G F P<br />
Predictors/Confounders G G F F F<br />
Outcomes G P G G F<br />
Statistical Methods G F F/P G P<br />
External Validity F P F F P<br />
Use of proxy variables or aggregate<br />
measures<br />
Dellasega<br />
1999 56<br />
G P F G F<br />
Representativeness of sample G P P F P<br />
Study design appropriate for the research<br />
question?<br />
F F G F P<br />
Overall Confidence Score H/M VL L M VL<br />
HIV/AIDS (Table 7 and Appendix C, Table 6)<br />
There were four papers that reported rural-urban differences in HIV/AIDS patients. 57-60<br />
In a study of 308 women from Georgia diagnosed with AIDS by 1990, non-metropolitan<br />
residence was associated with a shorter median survival time (296 days <strong>vs</strong>. 400 days for urban<br />
residence) and a lower odds of surviving 90 days (0.84 urban <strong>vs</strong>. 0.69 non-metropolitan). 57 Our<br />
confidence in the study is very low, however, given significant methodologic problems and the<br />
use of data that covered cases diagnosed over 20 years ago.<br />
The frequency of visits per year did not differ between urban and rural residents in either<br />
adjusted or unadjusted analyses of a large observational cohort study of HIV patients in<br />
North Carolina. 59 However, all patients received care at the University of North Carolina<br />
HIV Outpatient Clinic, suggesting that distance to clinic was not a significant barrier to care.<br />
Relatedly, a national study using the HIV Cost and Services Utilization Study (HCSUS) from<br />
1996 found that nearly three-quarters of rural HIV patients receive their HIV-related care in<br />
urban areas. 60 Only older age was associated with receiving HIV-related care in a rural setting.<br />
In contrast to the North Carolina study, nearly one-third who received their care in urban settings<br />
reported that the distance deterred them from needed clinic appointments; however, actual<br />
number of clinic appointments was not assessed. Using the same dataset, Cohn (2001) found<br />
that rural HIV-related care was more likely to be of lower quality than urban care. Specifically,<br />
they found that 73% of urban residents received highly active antiretroviral therapy (HAART)<br />
<strong>vs</strong>. only 57% of rural residents (p
<strong>Rural</strong> <strong>vs</strong>. <strong>Urban</strong> <strong>Ambulatory</strong> <strong>Health</strong> <strong>Care</strong>: A Systematic <strong>Review</strong><br />
Evidence-based Synthesis Program<br />
care from providers with little experience treating HIV patients compared to only 3% of urban<br />
residents.<br />
Summary<br />
The very sparse data on the treatment of HIV/AIDS suggests that rural residents might not<br />
receive care comparable to that received by HIV infected residents living in urban areas if they<br />
receive care locally rather than travel to specialty HIV clinics in urban areas. However, no firm<br />
conclusions can be drawn from this minimal evidence base. A more recent assessment of the<br />
quality of HIV care is warranted given that diffusion of knowledge regarding treatment standards<br />
for HIV/AIDS may have occurred in the intervening period.<br />
Table 7. Confidence Scores for HIV/AIDS Studies<br />
Study<br />
Whyte<br />
1992 57<br />
Napravnik<br />
2006 59<br />
Schur<br />
2002 60<br />
Cohn<br />
2001 58<br />
Internal Validity F G/F F G<br />
Sampling Method/Bias G F G/F G<br />
Predictors/Confounders P G G G<br />
Outcomes G G F G<br />
Statistical Methods F G G G<br />
External Validity P F F G/F<br />
Use of proxy variables or aggregate<br />
measures<br />
F F F G<br />
Representativeness of sample P F F G<br />
Study design appropriate for the<br />
research question?<br />
P G F F<br />
Overall Confidence Score VL M M H/M<br />
NEUROLOGIC CONDITIONS (Table 8 and Appendix C, Table 7)<br />
There were only three studies that examined urban/rural differences in health care for patients<br />
with multiple sclerosis (MS), and all three of them were from the same research group and<br />
were based on the same dataset. The studies were based on a survey of national MS Society<br />
members, with sampling stratified to achieve 500 MS patients in each of three population density<br />
categories: urban, within 50 miles of urban area, and more than 50 miles. Their overall response<br />
rate was a low 31%, and several aspects of the methodology resulted in our giving all three<br />
studies low Confidence Scores. 61-63 In bivariate analyses, more MS patients in rural areas had a<br />
primary progressive form of MS, but fewer reported that they were being treated with disease<br />
modifying medications (urban 64%, adjacent rural 57%, remote rural 55%). 61 More MS patients<br />
in urban areas saw a neurologist in the previous year (urban 75.4%, adjacent rural 71%, remote<br />
rural 66.5%) and more patients in remote and adjacent rural areas indicated that they had wanted<br />
to have seen a neurologist in the previous year but did not do so (urban 9.4%, adjacent rural<br />
18.9%, remote rural 26.9%). 62 Finally, the primary reason reported for not seeking treatment was<br />
26
<strong>Rural</strong> <strong>vs</strong>. <strong>Urban</strong> <strong>Ambulatory</strong> <strong>Health</strong> <strong>Care</strong>: A Systematic <strong>Review</strong><br />
Evidence-based Synthesis Program<br />
a lack of availability of mental health providers (urban 5%, adjacent rural 33%, and 13% remote<br />
rural). 63<br />
There were only two studies that focused on services for those who incurred a traumatic brain<br />
injury (TBI). 64,65<br />
A survey of 292 residents with TBI 12-18 months previously, in the Iowa Central Registry for<br />
Brain and Spinal Cord Injuries in 1998, examined self-rated health and dependence on others. 64<br />
There were no differences between rural <strong>vs</strong>. urban areas in the association between perceived<br />
need for care and actual receipt of services; however, the authors did not examine the odds of<br />
service receipt in a multivariate model, and we rated this study with a low Confidence Score.<br />
Two studies examined the availability of health professionals who provide the interdisciplinary<br />
care needed by those who had TBIs. A survey of health providers in Missouri in 1999 found<br />
that although nearly one-third of state residents live in rural areas, much lower percentages<br />
of all provider types related to the treatment of patients with TBIs (e.g., physiatrists, other<br />
physicians, rehab therapists, mental health providers) worked in rural areas. 65 A similar pattern<br />
was found in a nationwide study of numbers of rehabilitation therapists (physical therapists,<br />
occupational therapists, and speech-language pathologists) in counties or “county sets” in most<br />
of the contiguous United States between 1980-2000. 66 Fewer rehabilitation therapists per 100,000<br />
residents were found in primary care health professional shortage areas. Although the number<br />
of all three types of rehabilitation therapists increased in both urban and rural county sets during<br />
the 20 year time period, the difference in the ratio of therapists per 100,000 residents remained<br />
significantly different between urban and rural areas (urban: rural rates per 100,000 for physical<br />
therapists 50.9: 35.5, occupational therapists 24.7: 15.3, and speech pathologists 35.0: 29.5).<br />
Summary<br />
Findings from the three studies of rural treatment for MS, all based on the same dataset, were<br />
inconclusive given several methodologic problems with the research design, measures and<br />
analyses.<br />
There was only one study that looked at outcomes for patients with a history of TBI in rural <strong>vs</strong>.<br />
urban settings of Iowa, but we had little confidence in the findings of that study. Two studies<br />
examining the availability of rehabilitation specialists found a paucity of such providers in many<br />
rural areas relative to urban areas. Significantly more research should be done on the course of<br />
recovery of rural TBI patients after their acute treatment, and to ascertain what types of services<br />
they receive by commuting to urban areas, what services are precluded by limited provider<br />
availability and/or travel distance, and what the impact of provider availability is on health<br />
outcomes.<br />
27
<strong>Rural</strong> <strong>vs</strong>. <strong>Urban</strong> <strong>Ambulatory</strong> <strong>Health</strong> <strong>Care</strong>: A Systematic <strong>Review</strong><br />
Evidence-based Synthesis Program<br />
Table 8. Confidence Scores for Neurologic Conditions Studies<br />
Study<br />
Buchanan<br />
2006a 61<br />
Buchanan<br />
2006b 62<br />
Buchanan<br />
2006c 63<br />
Schootman<br />
1999 64<br />
Internal Validity F F/P F/P F G G<br />
Sampling Method/Bias P P P G G G<br />
Predictors/Confounders G G G F G G<br />
Outcomes F F F F G G<br />
Statistical Methods P P P F G G<br />
External Validity F/P F/P F/P F G/F G/F<br />
Use of proxy variables or aggregate<br />
measures<br />
Johnstone<br />
2002 65<br />
Wilson<br />
2009 66<br />
F F F F F F<br />
Representativeness of sample P P P F G G<br />
Study design appropriate for the<br />
research question?<br />
F P P F G G<br />
Overall Confidence Score L/VL VL VL L H/M H/M<br />
MENTAL HEALTH (Table 9 and Appendix C, Table 8)<br />
There were three studies that compared suicide rates and medication use between rural and urban<br />
areas, 67-69 two studies that examined the odds of hospitalization, 70,71 five papers that addressed<br />
MH service access among rural residents with severe mental illness, 72-76 three studies that<br />
examined rural-urban differences in treatment of mood disorders, 69,77,78 one study examining<br />
PTSD, 79 five studies that examined receipt of alcohol/drug treatment, 80-84 and four papers that<br />
examined whether subgroups of rural residents were less likely to get mental health treatment. 85-88<br />
A large national study of suicide completers found an association between suicide and<br />
antidepressant prescription rates. 67 In rural areas, the suicide rates were higher than in urban<br />
areas (17.14 per 100,000 in the most rural <strong>vs</strong>. 11.51 per 100,000 in the most urban). Within these<br />
rural areas, there were fewer prescriptions for antidepressants and, of those that were written,<br />
a higher proportion of them were for the older tricyclic antidepressants (ratios of tricyclics <strong>vs</strong>.<br />
newer antidepressants were 1:1 in rural <strong>vs</strong>. 1:2 in urban). Only prescriptions for non-tricyclic<br />
antidepressants were associated with reduced suicide rates. A second study examining suicide<br />
rates among 41 county clusters in California from 1993-2001, found similar elevations in suicide<br />
rates among rural counties, but no association between suicide rates and the availability of either<br />
health care providers or physicians. 68 Although suggestive, these studies use only aggregate<br />
measures and limited control for confounders, resulting in lower Confidence Scores. One study<br />
that followed 470 depressed people in Arkansas found no difference in the odds or quality of<br />
depression treatment between rural and urban residents, but did find an elevated rate of suicide<br />
attempts among those in rural areas. 69<br />
Both studies that examined hospitalization rates per county for major mental illnesses used the<br />
2000 <strong>Health</strong> <strong>Care</strong> Cost and Utilization Project database for 14 states. 70,71 Both studies reported<br />
similar findings – that rural areas had lower hospitalization rates. Specifically, hospitalization<br />
28
<strong>Rural</strong> <strong>vs</strong>. <strong>Urban</strong> <strong>Ambulatory</strong> <strong>Health</strong> <strong>Care</strong>: A Systematic <strong>Review</strong><br />
Evidence-based Synthesis Program<br />
rates for schizophrenia were greatest in the most urban areas relative to all others (p
<strong>Rural</strong> <strong>vs</strong>. <strong>Urban</strong> <strong>Ambulatory</strong> <strong>Health</strong> <strong>Care</strong>: A Systematic <strong>Review</strong><br />
Evidence-based Synthesis Program<br />
The VA study of the amount and types of care received by 5,221 patients with serious mental<br />
illness enrolled in a MHICM program reported that patients in rural areas received fewer types of<br />
services than urban patients. 75 Although the difference in patient contact between rural and urban<br />
residents differed only slightly (though significantly), rural residents were less likely to receive<br />
several types of recovery-related services, such as psychotherapy (83% urban <strong>vs</strong>. 67% isolated<br />
rural), substance abuse treatment (35% urban <strong>vs</strong>. 29% rural town and 12% isolated rural), and<br />
rehab services (48% urban <strong>vs</strong>. 42% rural towns and 27% isolated rural) despite comparable<br />
symptomatology. Moreover, rural residents were more likely to be seen by only one person on<br />
the treatment team than urban patients. Whether this affected recovery is unclear, as all symptom<br />
measures were assessed at the time of program enrollment.<br />
The fourth study focused on the ease of care transition from inpatient to outpatient services for<br />
4,930 patients with serious mental illness who were discharged from Virginia state hospitals in<br />
1992. 72 Specifically, they found that rural residents had significantly better continuity of care than<br />
urban patients in that the community mental health centers associated with outpatient treatment<br />
for rural residents were much more likely to have copies of the discharge records (89% rural <strong>vs</strong>.<br />
76% urban), to have contacted the patient during the hospitalization (58% rural <strong>vs</strong>. 49% urban),<br />
to have made contact with the patient after discharge (82% rural <strong>vs</strong>. 78% urban), and to have<br />
seen the patient for an appointment (79% rural <strong>vs</strong>. 76% urban). Despite some limitations in rural<br />
mental health services for those with serious mental illness, the smaller size of rural community<br />
mental health clinics likely contributed to the post-discharge continuity. Of note, there were no<br />
differences in a composite of these continuity measures between black and white patients in<br />
rural areas, but in urban areas, blacks were clearly disadvantaged. That is, race disparities existed<br />
mostly in urban areas.<br />
There were two other studies that used the same dataset that examined rural-urban differences<br />
in treatment of bipolar disorder referenced above, and these subsequent studies focused on<br />
Arkansans who screened positive for major depression. Examining quality of care and outcomes<br />
for the 434 who met criteria for major depression, Rost (1999) reported that there were no ruralurban<br />
differences in the odds of outpatient treatment of depression, type of care, odds of care<br />
meeting clinical guidelines for acute stage treatment, or adherence to treatment. 77 <strong>Urban</strong> residents<br />
were more likely to have been high users of specialty mental health care, with 22% making<br />
23 or more visits during the follow-up year compared to 4% of rural residents (p=0.04). <strong>Rural</strong><br />
residents, were significantly more likely to be hospitalized for physical problems (OR=3.05,<br />
95%CI=1.23-7.53). In the second paper, the odds of these elevated admissions were really<br />
significant only during the first 6 months after baseline, with rural residents having much higher<br />
odds of hospitalization for physical (6.1% <strong>vs</strong>. 0.3%, p
<strong>Rural</strong> <strong>vs</strong>. <strong>Urban</strong> <strong>Ambulatory</strong> <strong>Health</strong> <strong>Care</strong>: A Systematic <strong>Review</strong><br />
Evidence-based Synthesis Program<br />
indicated that they took antidepressants for at least two of the previous six months. Because of<br />
the sampling and other methodologic problems inherent in this study, however, our Confidence<br />
Score was low.<br />
Only one very small study examined service use among patients diagnosed with PTSD. 79 No<br />
significant differences were found in the number of specialty PTSD clinic appointments between<br />
48 urban and 52 rural veterans. The absence of a finding is inconclusive, however, given the<br />
inadequate power to detect possible differences and the limited number of confounders included<br />
in the analyses.<br />
There were five studies that examined receipt of alcohol/drug treatment. Two studies of moderate<br />
to moderately high quality found no rural-urban differences in treatment utilization, 80,81 and three<br />
of moderate to low quality found greater treatment utilization among residents living in urban<br />
areas. 82-84<br />
In a Florida study of 2,222 out-of-treatment injection drug users and crack smokers, the rate<br />
of drug treatment receipt in the previous 24 months was twice as high for drug users in the<br />
urban Miami area than for drug users in the rural Immokalee area (16.3% <strong>vs</strong>. 4.4%, p
<strong>Rural</strong> <strong>vs</strong>. <strong>Urban</strong> <strong>Ambulatory</strong> <strong>Health</strong> <strong>Care</strong>: A Systematic <strong>Review</strong><br />
Evidence-based Synthesis Program<br />
residents to have sought mental health care (38% <strong>vs</strong>. 24%, p
<strong>Rural</strong> <strong>vs</strong>. <strong>Urban</strong> <strong>Ambulatory</strong> <strong>Health</strong> <strong>Care</strong>: A Systematic <strong>Review</strong><br />
Evidence-based Synthesis Program<br />
could suggest differences in health care access and/or quality, it is unclear whether the observed<br />
association between reduced county mental health care parameters (e.g., new generation<br />
antidepressant use) and suicide rate would remain if the individual (<strong>vs</strong>. the county) were the unit<br />
of analysis. One prospective study found elevated suicide rates among depressed rural residents<br />
in Arkansas, but the small numbers made it impossible to determine if this were related to<br />
differences in mental health care.<br />
Of note, two studies found greater racial disparities in mental health treatment receipt in urban<br />
areas. This could reflect a selectively improved access for whites in urban areas or a greater<br />
difficulty with access for minorities. Moreover, it also underscores the importance of examining<br />
race-rurality interactions, since ignoring such interactions could result in both race and/or rural<br />
disparities being attenuated.<br />
PROCESSES OR STRUCTURE OF CARE (Appendix C, Tables 9-13)<br />
There were a number of studies that compared various aspects of health care structure or<br />
processes between urban and rural health care settings without focusing on either a particular<br />
medical or mental health condition or, in most cases, without reference to health outcomes. We<br />
review these studies here as they relate to Key Question #2.<br />
Use of Medication (Appendix C, Table 9)<br />
There were a number of studies that examined the use of prescription medications without<br />
associating medication use with health outcomes. The studies on medication use examined<br />
prevalence and/or intensity of medication use, 56,89-94 expenditures for prescription drugs, 92,93,95<br />
likelihood of having a usual pharmacy, 94 and degree of change in postdischarge medication<br />
regimen. 56 All of the study samples consisted of outpatients over 65 years old. Three studies 92,93,95<br />
used national samples and the rest used samples from a single state. Two of the studies 92,95 that<br />
had used a national sample had relatively small sample sizes (N
<strong>Rural</strong> <strong>vs</strong>. <strong>Urban</strong> <strong>Ambulatory</strong> <strong>Health</strong> <strong>Care</strong>: A Systematic <strong>Review</strong><br />
Evidence-based Synthesis Program<br />
Table 9. Confidence Scores for Mental <strong>Health</strong> Studies<br />
Gibbons<br />
2005 67<br />
Fiske<br />
2005 68<br />
Farrell<br />
1996 72<br />
Fischer<br />
2008 73<br />
Mohamed<br />
2009 75<br />
Rost & Owen<br />
1998 76<br />
Rost<br />
1999 77<br />
Fortney<br />
1999 74<br />
Fortney<br />
2007 70<br />
Fortney<br />
2009 71<br />
Rost & Zhang<br />
1998 69<br />
Rost<br />
2007 78<br />
Elhai<br />
2004 79<br />
Booth<br />
2000 80<br />
Grant<br />
1996 81<br />
Metsch<br />
1999 82<br />
Fortney<br />
1995 84<br />
Robertson<br />
1997 83<br />
Petterson<br />
2003 85<br />
Petterson<br />
2009 86<br />
Hauenstein<br />
2006 87<br />
Wang<br />
2005 88<br />
Study<br />
Internal Validity F F F F F F G G G/F G/F G F F G G/F F G F G/F G/F G/F G<br />
Sampling Method/Bias G G G G G G G G G G G F G G G F G G G G G G<br />
Predictors/Confounders F F P F G G G G F F G G P G G/F G G F G G G G<br />
Outcomes G G G F F F G F G G G F G G G G G F F F F G<br />
Statistical Methods G F F G F G G G G G G G/F F G G F G F G G G G<br />
External Validity F/P F/P F F F F F F F F F F P G/F F F F F F F F F<br />
Use of proxy variables or<br />
aggregate measures<br />
Representativeness of<br />
sample<br />
Study design appropriate<br />
for the research question?<br />
Overall Confidence<br />
Score<br />
P P G F G G F G F F F F G F F/P G F F F F F G<br />
G G G F G P G/F F/P G G G/F F F/P G G P G G/F G G G F<br />
F F F G F F G F F F G F/P P G G/F F F F/P G G G G<br />
L L M M M L M M/L M/L M/L M L VL H/M M M/L M L M M M H/M<br />
34
<strong>Rural</strong> <strong>vs</strong>. <strong>Urban</strong> <strong>Ambulatory</strong> <strong>Health</strong> <strong>Care</strong>: A Systematic <strong>Review</strong><br />
Evidence-based Synthesis Program<br />
In a study of non-cognitively impaired residents 65 years and older in western Texas, Xu et al.<br />
(2003) found no difference in the odds of prescription drug use between individuals living in urban<br />
counties and those living in rural counties (i.e., counties outside of MSA or with a population less<br />
than 50,000); however, those living in frontier counties (i.e., counties with fewer than 7 people per<br />
square mile) had lower odds (OR=0.59, p
<strong>Rural</strong> <strong>vs</strong>. <strong>Urban</strong> <strong>Ambulatory</strong> <strong>Health</strong> <strong>Care</strong>: A Systematic <strong>Review</strong><br />
Evidence-based Synthesis Program<br />
79% of rural residents reported using at least some health care. 100 Similar findings were reported<br />
by a second national study using the Medical Expenditures Panel Survey from 1996 which found<br />
no difference across rural or urban areas in the odds of having at least one ambulatory visit in<br />
the past year. 102 However, rural residents reported fewer visits on average than residents of large<br />
metropolitan (4.9 visits <strong>vs</strong>. 6.1 visits, p
<strong>Rural</strong> <strong>vs</strong>. <strong>Urban</strong> <strong>Ambulatory</strong> <strong>Health</strong> <strong>Care</strong>: A Systematic <strong>Review</strong><br />
Evidence-based Synthesis Program<br />
Two regional studies of patients over 64 years old found that between 94% and 96% reported<br />
having a usual source of care with no difference between urban and rural residents 98,108 In the<br />
adjusted model, having insurance other than Medicare/Medicaid was associated with increased<br />
odds of having a usual source of care while Hispanic ethnicity was associated with decreased<br />
odds. 108 Both studies also looked at whether the respondent had a personal provider. No<br />
differences were found between rural and urban areas in the odds of having a personal provider<br />
(87%). 108 Hispanic ethnicity and lower income were associated with decreased odds. 108 The<br />
second study reported a rural advantage for continuity of care with a primary care provider (88%<br />
rural <strong>vs</strong>. 82% urban; p
<strong>Rural</strong> <strong>vs</strong>. <strong>Urban</strong> <strong>Ambulatory</strong> <strong>Health</strong> <strong>Care</strong>: A Systematic <strong>Review</strong><br />
Evidence-based Synthesis Program<br />
For example, the distribution of physicians and physician assistants was examined in rural and<br />
remote counties of Texas using the Texas Medical Board Web site and from US Census Data. 114<br />
Seventeen of 254 Texas counties had no licensed doctors or physician assistants. Statewide,<br />
there was one physician assistant for every 13.6 physicians. In the 60 frontier counties, however,<br />
the ratio was one physician assistant for every 2.3 physicians. Frontier counties, then, have<br />
not only a diminished availability of medical providers, but more of the providers that they do<br />
have are physician extenders. Patient perceptions of physician availability were consistent with<br />
the epidemiologic assessments. Biola et al. (2009) surveyed 4,879 patients living in 150 rural<br />
counties in the southeastern United States, and examined agreement with the statement “I feel<br />
there are enough doctors in my community.” 111 As would be expected, patients who lived in areas<br />
with more physicians relative to the county population were more likely to respond that there<br />
were enough physicians. Of interest, the perception that there were an insufficient number of<br />
physicians was greater not only among patients who live in areas with fewer physicians relative<br />
to county residents, but also among those who traveled more than 30 minutes for care, those<br />
who lived in a more impoverished county or who had problems with the cost of care, and among<br />
those who lacked confidence in their physician’s level of expertise.<br />
As noted previously, differences in provider availability were not only found for primary health<br />
care providers. A nationwide study of numbers of rehabilitation therapists (physical therapists,<br />
occupational therapists, and speech-language pathologists) between 1980-2000, found that<br />
although the disparity in therapist availability between rural and urban areas had improved<br />
over the 20 year period, that the ratio of therapists per 100,000 residents remained significantly<br />
different between urban and rural areas (urban:rural rates per 100,000 for physical therapists<br />
50.9:35.5, occupational therapists 24.7:15.3, and speech pathologists 35.0:29.5). 66<br />
In addition to limitations in provider availability, rural residents often have different types of<br />
providers available to them. A nationwide study of over 34,000 patients from non-metropolitan<br />
areas had greater adjusted odds of receiving services from family physicians, nurse practitioners,<br />
or physician assistants and lower adjusted odds of receiving services from general internists or<br />
non-surgical specialists. 110 Similarly, in the Wisconsin Longitudinal Study, 113 primary provider<br />
type was determined among survey respondents who indicated they had a usual source of<br />
care and compared across metropolitan, micropolitan, or nonmetropolitan (i.e., rural) areas. 113<br />
Overall, 4.5% of respondents reported that a physician assistant or nurse practitioner was their<br />
primary care provider and, in adjusted analyses, these provider types were more common among<br />
nonmetropolitan residents. Also consistent with findings was a study of over 28,000 clinicians<br />
practicing in California and over 5,600 clinicians practicing in Washington State. 112 Of physician<br />
assistants practicing in California, 22% were in rural areas. A similar pattern was observed in<br />
Washington. Family physicians, nurse practitioners, and physician assistants were more likely<br />
to practice in a rural area (relative to obstetrics/gynecology). Physician extenders in rural areas<br />
often work longer hours, see more patients and provide care to more patients without insurance<br />
than their urban counterparts. 118 Differences were found not only in the prevalence of physician<br />
extenders, but also in the type of physicians practicing in rural areas. For example, in a study of<br />
over 4,000 providers in Washington State, 117 family physicians were most likely to provide care<br />
in a rural area; psychiatrists, cardiologist, and gastroenterologists were least likely. Although<br />
the diagnostic scope of practice was similar for rural and urban physicians, rural obstetriciangynecologists<br />
were more likely to care for diagnoses outside of their specialty and rural general<br />
38
<strong>Rural</strong> <strong>vs</strong>. <strong>Urban</strong> <strong>Ambulatory</strong> <strong>Health</strong> <strong>Care</strong>: A Systematic <strong>Review</strong><br />
Evidence-based Synthesis Program<br />
surgeons were more likely to care for gastrointestinal disorders (<strong>vs</strong>. cardiac conditions for urban<br />
surgeons). Not surprisingly, procedure rates were higher for rural physicians.<br />
Of concern is the fact that often the qualifications of physician extenders in rural areas may not<br />
be comparable to those practicing in urban settings. A survey of nurse practitioners, certified<br />
nurse midwives, and physician assistants in Georgia found that of 554 nurse practitioners<br />
who responded, 31% were working in a rural environment. 118 <strong>Rural</strong> nurse practitioners were<br />
less likely to have had a bachelor’s degree and fewer had specialty credentials. This may be<br />
particularly concerning given that they were more likely to provide care in solo and clinic<br />
practice settings. Of 73 certified nurse midwives, 29% worked in a rural setting. <strong>Rural</strong> certified<br />
nurse midwives also had fewer specialty credentials, worked more hours per week, and saw<br />
more patients per hour. Of the 18% of 452 physician assistants practicing in rural settings, fewer<br />
had at least a bachelor’s degree compared to those practicing in urban settings. Although there<br />
is limited data comparing the quality of care between rural primary care providers who are<br />
physician extenders and those who are physicians, patients in the Wisconsin Longitudinal Study<br />
whose usual source of care was a physician assistant or nurse practitioner were more likely to<br />
report lower satisfaction with access to care (beta=−0.22, 95%CI=−0.35-−0.09), and were less<br />
likely to have received a complete health exam (OR=0.74, 95%CI = 0.55-0.99) or a mammogram<br />
(OR=0.65, 95%CI=0.45-0.93). 113. However, a national Web survey of physician assistants in<br />
2008 (response rate 49%), found that rural physician assistants were better at diagnosing and<br />
treating dermatologic conditions than their urban counterparts (p
<strong>Rural</strong> <strong>vs</strong>. <strong>Urban</strong> <strong>Ambulatory</strong> <strong>Health</strong> <strong>Care</strong>: A Systematic <strong>Review</strong><br />
Evidence-based Synthesis Program<br />
Table 10. Confidence Scores for Processes or Structure of <strong>Care</strong> Studies<br />
Study<br />
Dellasaga<br />
1999 56<br />
Fillenbaum<br />
1993 89<br />
Hanlon<br />
1996 90<br />
Lago<br />
1993 91<br />
Lillard<br />
1999 92<br />
Mueller<br />
2004 93<br />
Xu<br />
2003 94<br />
Internal Validity (G, F, P) F G G F F F F F F F F F F F F F F G F<br />
Sampling Method/Bias F G G F F G F F F F F F F G G G G G G<br />
Predictors/Confounders F G G F F F G F F F G F G F G G F G F<br />
Outcomes F G F G F G F F F F F F F F F G G G G<br />
Statistical Methods F G G G F F G F F F G F G F F F F G F<br />
External Validity (G, F, P) P F F F F F P F F P F F F G G F F G F<br />
Use of proxy variables or<br />
aggregate measures<br />
Representativeness of sample<br />
(size, composition)<br />
Is the study design appropriate for<br />
the research question?<br />
Rogowski<br />
1997 95<br />
Miller<br />
1995 96<br />
Escarce<br />
1993 97<br />
F G G G F G F F F F G G G G G F G G G<br />
P F F F F G F F F F F F F G G G G G G<br />
P G G G F P P F F P F F P G G F F G F<br />
Overall Confidence Score L M/L M/L M L M/L L L L L M/L L L M M M M H M<br />
Blazer<br />
1995 98<br />
McConell<br />
1993 99<br />
Saag<br />
1998 29<br />
Himes<br />
1993 101<br />
Larson<br />
2003 102<br />
Mueller<br />
1998 103<br />
Weeks<br />
2005 8<br />
Maciejewski<br />
2007 104<br />
Fortney<br />
2002 105<br />
40
<strong>Rural</strong> <strong>vs</strong>. <strong>Urban</strong> <strong>Ambulatory</strong> <strong>Health</strong> <strong>Care</strong>: A Systematic <strong>Review</strong><br />
Evidence-based Synthesis Program<br />
Table 10. Confidence Scores for Processes or Structure of <strong>Care</strong> Studies<br />
Study<br />
Meza<br />
2006 106<br />
Glover<br />
2004 100<br />
Borders<br />
2004 107<br />
Rohrer<br />
2004 108<br />
Koopman<br />
2006 48<br />
Wilson<br />
2009 66<br />
Internal Validity (G, F, P) P G F F F G F F F F G F F G F G P<br />
Sampling Method/Bias P G F F G G F P F F G F F G F G P<br />
Predictors/Confounders F G G G G N/A F G F F N/A N/A N/A N/A N/A N/A F<br />
Outcomes F G F F G G G P F G G F F G G G P<br />
Statistical Methods F G G G F G F G G G N/A G G G G G F<br />
External Validity (G, F, P) F F F F F G/F F P F F G F F F F G P<br />
Use of proxy variables or<br />
aggregate measures<br />
Representativeness of sample<br />
(size, composition)<br />
Is the study design appropriate<br />
for the research question?<br />
Ferrer<br />
2007 110<br />
Biola<br />
2009 111<br />
Grumbach<br />
2003 112<br />
G G G G G F G F G G G G G G G G F<br />
P G F P F G F F F F G F F F F G F<br />
F F F P G G F P P F G F F F F G P<br />
Overall Confidence Score L M M/L L M H/M M/L L L M/L H L L M/L M/L H L<br />
Everett<br />
2009 113<br />
Jones<br />
2008 114<br />
Gunderson<br />
2006 115<br />
Manachemi<br />
2006 116<br />
Baldwin<br />
1999 117<br />
Strickland<br />
1998 118<br />
Laditka<br />
2009 28<br />
Brown<br />
2009 109<br />
41
<strong>Rural</strong> <strong>vs</strong>. <strong>Urban</strong> <strong>Ambulatory</strong> <strong>Health</strong> <strong>Care</strong>: A Systematic <strong>Review</strong><br />
Evidence-based Synthesis Program<br />
SUMMARY AND DISCUSSION<br />
Conclusions and Recommendations<br />
In this section, we will summarize the results as they relate to the key questions and provide a<br />
series of recommendations for future research on rural health issues.<br />
As evidenced by our review, there were several conditions for which there was a paucity of<br />
evidence regarding their prevention, diagnosis or treatment in rural health care settings (e.g.,<br />
sexually transmitted diseases, rheumatoid arthritis, COPD, chronic pain, hepatitis C, anxiety<br />
disorders, substance use disorders, post-treatment cancer surveillance, traumatic brain injury).<br />
Studies tended to be conducted in areas in which either the information was readily available in a<br />
national database, a performance measure or guideline existed for which there was evidence and<br />
which served to operationalize quality care (e.g., via claims data), or a local health care problem<br />
existed that the authors were seeking to quantify. Given the data sources, study designs were<br />
predominantly cross-sectional or retrospective cohort designs, and only one of the studies we<br />
reviewed used a prospective design. Few studies associated health care differences with health<br />
outcomes. Given these limitations, the strength of the evidence was at best weak to moderate<br />
for most areas even when a significant finding was consistently present. This complicated<br />
interpretability. Most of our conclusions, therefore, are at best suggestive.<br />
Another significant conceptual problem with the use of extant data sources and the crosssectional<br />
study designs used was that potential reasons for rural-urban differences were often<br />
treated as confounders and adjusted for in statistical models. There are many correlates of rural<br />
residency that may affect health care utilization or access (e.g., lower rates of college graduates,<br />
types of health insurance, higher rates of poverty in highly rural areas, etc.). 119 Statistically<br />
adjusting for these contextual characteristics only to then find no difference between rural<br />
and urban residents in health outcomes does not mean that rural residents or, in some cases,<br />
urban residents are not disadvantaged. 120 Similar points have been made in discussions of race<br />
disparities, 121 with recommendations made to “unpack” the factors underlying the differences,<br />
which we feel are also applicable in this area.<br />
Because our evidence base relied on peer reviewed articles, we did not include national reports<br />
examining potential differences in rural <strong>vs</strong>. urban health care. However, because these reports<br />
serve to inform policy makers, at the end of this section we compare findings from the 2010<br />
National <strong>Health</strong>care Disparities Report 122 and the 2010 VHA Facility Quality and Safety<br />
Report 123 with the results of this systematic review.<br />
SUMMARY OF EVIDENCE BY KEY QUESTION<br />
Key Question #1. Do adults with health care needs who live in rural areas have<br />
different intermediate (e.g., HbA1c, Blood pressure, etc.) or final health care outcomes<br />
(i.e., mortality, morbidity, QOL) than those living in urban areas?<br />
Most of the evidence regarding potential differences in health care outcomes between rural and<br />
urban patients is weak either by the quality of the study designs and/or the paucity of studies<br />
42
<strong>Rural</strong> <strong>vs</strong>. <strong>Urban</strong> <strong>Ambulatory</strong> <strong>Health</strong> <strong>Care</strong>: A Systematic <strong>Review</strong><br />
Evidence-based Synthesis Program<br />
evaluating whether any differences exist. Below we list the findings for which there is some<br />
evidence of a health care disparity.<br />
• There is some weak evidence that increasing rurality is associated with a greater frequency<br />
of hospitalization for ACSC’s.<br />
• No evidence for differences in cancer mortality.<br />
• There is some evidence of greater rates of DCIS and lower rates of invasive cervical<br />
cancer in urban areas where screening rates are higher.<br />
• There was no evidence for a disparity between rural and urban patients with diabetes in terms<br />
of diabetes complications or the prevalence of ESRD. However, there was some evidence<br />
that race by rurality interactions may exist in diabetes care and in the treatment of ESRD.<br />
• Although very limited, the available information suggests that outpatient control of<br />
hypertension, at least among veterans, does not differ between those residing in rural <strong>vs</strong>.<br />
urban areas.<br />
There was weak evidence for higher hospitalization rates for rural residents treated for<br />
depression in Arkansas.<br />
Key Question #2. Is the structure (e.g., types of available providers) or the process<br />
(e.g., likelihood of referral) of health care different for adults with health care<br />
needs who live in urban <strong>vs</strong>. rural environments?<br />
Use of Medication<br />
No consistent differences were found in receipt of or adherence to medication. To the extent that<br />
a few studies reported any differences, urban residents tended to receive more medications.<br />
Medical Procedures and Diagnostic Tests<br />
The use of most services, including office visits and consultations, imaging services, and<br />
diagnostic testing, were found to be lower in rural areas compared to urban areas. More<br />
consistent evidence was found specifically for lower screening rates for breast and cervical<br />
cancer in many rural areas. Differences in screening rates for colorectal cancer are not<br />
consistently found. However, all but one study found a greater frequency of unstaged cancer at<br />
the time of diagnosis in rural areas compared to urban areas.<br />
Medical Appointments with Providers<br />
<strong>Rural</strong> residents were less likely to see a medical provider than urban residents. Specifically, rural<br />
residents were less likely to see specialists, and low availability of specialists had deleterious<br />
impact on some health outcomes (e.g., cancer mortality). However, studies did not generally<br />
account for the fact that rural residents often receive specialty health care in urban clinics and<br />
how this might affect health outcomes. More consistent was the lower rate of mental health care<br />
service receipt among residents in rural areas.<br />
43
<strong>Rural</strong> <strong>vs</strong>. <strong>Urban</strong> <strong>Ambulatory</strong> <strong>Health</strong> <strong>Care</strong>: A Systematic <strong>Review</strong><br />
Evidence-based Synthesis Program<br />
Usual Source of <strong>Care</strong><br />
There was no consistent evidence that rural residents were less likely to have a usual source of<br />
care. In fact, there was more consistent evidence that rural residents had better continuity of care.<br />
Having fewer health care choices seems to increase the odds of remaining with the same provider<br />
over time.<br />
Provider Availability and Expertise<br />
There was consistent evidence that highly rural areas had a paucity of health care providers.<br />
There was some evidence that providers in some highly rural areas were more likely to be<br />
physician extenders (e.g., physician assistants, nurse practitioners). There was some weak<br />
evidence that physician extenders in some rural areas may not have comparable credentials to<br />
their urban counterparts. More consistent evidence was found indicating that rural residents were<br />
more likely to have primary care providers whose training was in family medicine rather than<br />
general internal medicine or OB/GYN. There was also consistent evidence that rural residents<br />
had less access to specialty medical services unless they traveled to urban health care centers.<br />
Fewer non-physician rehabilitation specialists are available in rural areas.<br />
There was weak evidence provided by one study that suggested that limitations in provider<br />
knowledge might impact clinical practice viz. colorectal cancer screening.<br />
The two studies examining the availability of rehabilitation specialists both found a paucity<br />
of such providers in many rural areas relative to urban areas. One of the studies compared<br />
availability over several years, increasing confidence in this finding. Similarly, there is a fairly<br />
consistent finding of fewer mental health specialists in rural areas.<br />
Quality of <strong>Care</strong><br />
There were also no consistent differences between rural and urban areas in treatment quality<br />
measures for diabetes, although one study found evidence for regional variation in rural<br />
disparities. This was not assessed in other studies. Similarly, the two larger studies of treatment<br />
of hypertension did not find any quality differences between rural and urban settings.<br />
Although the studies are few, there is some evidence suggesting that care for some conditions<br />
(e.g., HIV/AIDS) may be lower in rural areas. Two of three studies examining quality of cancer<br />
treatment indicated lower quality of care in rural areas. The third, however, found that rurality<br />
was less of a contributor to quality care differences than was provider characteristics.<br />
Key Question #3. If there are differences in the structure or the process of health<br />
care in rural <strong>vs</strong>. urban environments, do those differences contribute to variation<br />
in overall or intermediate health outcomes for adults with health care needs?<br />
Although there were many studies that documented differences in health care structure or process<br />
between urban and rural health care settings, as we noted above few associated those differences<br />
with variation in health outcomes. The list of findings below is generally based on single studies<br />
of variable quality. Results can only be considered suggestive.<br />
44
<strong>Rural</strong> <strong>vs</strong>. <strong>Urban</strong> <strong>Ambulatory</strong> <strong>Health</strong> <strong>Care</strong>: A Systematic <strong>Review</strong><br />
Evidence-based Synthesis Program<br />
• Lower rates of mammography and cervical cancer screening in rural areas was associated<br />
with lower rates of ductal carcinoma in situ (<strong>vs</strong>. more invasive breast cancer) and higher<br />
rates of invasive cervical cancer in rural areas.<br />
• Improving access by the creation of <strong>Rural</strong> <strong>Health</strong> Clinics in underserved areas was<br />
associated with improved adherence to treatment guidelines for diabetes. 52<br />
• Limited numbers of providers in rural areas may foster better continuity of care.<br />
• Limitations in provider availability may be associated with increased odds of<br />
hospitalization among older rural residents for ACSCs.<br />
Two studies that were published after our sampling frame demonstrate comparable rates of<br />
pharmacotherapy for rural and urban residents with depression and rural <strong>vs</strong>. urban veterans with<br />
depression or anxiety disorders. 124,125 Both studies found that the odds of having psychotherapy<br />
appointments, however, were lower among those who lived in rural settings, and that this<br />
difference was mediated by provider availability.<br />
Key Question #4. If there are differences in intermediate or final health outcomes<br />
for adult patients with health care needs, what systems factors other than those<br />
due to differences in health care structure or process moderate those differences<br />
(e.g., travel distance)?<br />
Insurance<br />
• Lack of insurance was associated with increased odds of ACSC associated admissions,<br />
but this was not limited to rural residents; however, within rural areas those who had<br />
supplemental HMO plans had fewer admissions compared to older residence with a feefor-service<br />
insurance plan. Of note, one study found that Medicare HMO enrollees had to<br />
travel further for acute care services than Medicare fee-for-service patients, and were less<br />
likely to receive services within their county. 126<br />
Travel Distance<br />
• There was limited evidence that having a greater distance to treatment decreased odds of<br />
receipt of radiotherapy for older women with breast cancer, aftercare for veterans treated<br />
in inpatient alcohol treatment programs, and frequency of mental health appointments.<br />
• The presence of <strong>Rural</strong> <strong>Health</strong> Clinics in underserved areas improved treatment access and<br />
adherence to treatment guidelines for patients with diabetes.<br />
Patient Attitude<br />
• There is some weak evidence that urban residents may have a lower threshold for seeking<br />
mental health care than do rural residents, and that this may be related to differential use<br />
of mental health services.<br />
Race Disparities<br />
• For many conditions covered in this review, race disparities were greater in urban than<br />
in rural areas. This was observed in admissions for ACSC-related conditions, stage<br />
45
<strong>Rural</strong> <strong>vs</strong>. <strong>Urban</strong> <strong>Ambulatory</strong> <strong>Health</strong> <strong>Care</strong>: A Systematic <strong>Review</strong><br />
Evidence-based Synthesis Program<br />
at presentation for colorectal and prostate cancers, detection of diabetes, secondary<br />
prevention for diabetes-related conditions, post-hospitalization continuity of care for<br />
mental illness, and, among Native Americans, the odds of receiving a kidney transplant.<br />
• Race disparities were greater in rural areas for mortality rates among Hispanics for ESRD<br />
and for rates of organ transplants for blacks.<br />
The 2010 National <strong>Health</strong>care Disparities Report (NHDR) compared health outcomes between<br />
noncore areas (defined as rural counties without metropolitan or micropolitan areas) with large<br />
fringe metropolitan areas (defined as suburban counties of metropolitan areas with one million<br />
or more residents). 122 Most of their findings relating to adult ambulatory healthcare, found<br />
results comparable to this review. Specifically, the NHDR also found evidence for increased<br />
hospitalizations for ACSC’s, elevated suicide rates, reduced rates of CRC screens and lower<br />
insurance rates among rural residents. Differences in the NHDR and this review were only noted<br />
for lung and CRC related mortality rates and the odds of flu vaccination (they found disparities,<br />
we found the evidence to be inconsistent for cancer care). Importantly, it must be noted that the<br />
studies covered by this review most often compared rural areas with urban areas, not suburban<br />
areas. Given that we found urban disparities in some healthcare areas (notably cancer care),<br />
this might account for the differential findings. Finally, the NHDR reported differences in a<br />
few areas for which no articles were included in this review -- advice for exercise among obese<br />
patients and the five year odds of cholesterol screening -- both of which demonstrated a rural<br />
disadvantage.<br />
The 2010 VHA Facility Quality and Safety Report compared US census defined urban areas with<br />
non-urban areas (called rural, but which would include suburban counties). 123 Only bivariate<br />
findings are included in the report. Comparable to this evidence synthesis, no differences were<br />
noted for guideline concordant follow-up care for patients with diabetes, control of hypertension,<br />
or immunization rates for influenza. Also assessed in that report, but not covered by this evidence<br />
synthesis, were patient satisfaction, counseling for tobacco cessation and mental health screens,<br />
none of which demonstrated consistent differences between rural and urban areas nationally.<br />
Despite the similarities, it is difficult to conclude that no differences between highly rural and<br />
urban (or suburban) areas exist because of the way VA categorizes urban <strong>vs</strong>. rural.<br />
RESEARCH IMPLICATIONS AND RECOMMENDATIONS<br />
As has been shown by others, the definition of rural that is used in a study has a significant<br />
impact on the findings and, consequently, the policy implications. 11,12,14 Yet, there is little<br />
consistency across studies either in terms of what convention is used to define rural or how a<br />
chosen convention is actually employed in the study. Consequently, we make the following<br />
recommendations for researchers regarding definitions of “rural” and other methodologic issues<br />
based on our observations and the work of others. 11,12,14<br />
1. Specify the convention that was used to define “rural” in the study and how it was specifically<br />
operationalized. Many studies use rural–urban commuting area codes (RUCA) as their starting<br />
point, but then combine the categories in unique ways. The convention used by VA may<br />
minimize rural-urban disparities for some healthcare services. A more graded convention (e.g.,<br />
RUCA, RUCC or UIC) would allow for better identification of areas in need of intervention.<br />
46
<strong>Rural</strong> <strong>vs</strong>. <strong>Urban</strong> <strong>Ambulatory</strong> <strong>Health</strong> <strong>Care</strong>: A Systematic <strong>Review</strong><br />
Evidence-based Synthesis Program<br />
2. Provide a rationale for why the convention used in the study was chosen and the potential<br />
impact of that choice on the research question (e.g., Is a monotonic relationship between<br />
levels of population density and the outcome variable expected?).<br />
a. Consider using a statistical method for deciding between conventions if more than one<br />
option is available. 12<br />
3. If the study questions do not call for a clear choice in the convention to be used, consider<br />
using more than one convention and reporting the results for both definitions.<br />
4. Provide a rationale for the unit of analysis viz. the research question. For example, does the<br />
unit of analysis reflect the functioning of local health care systems or markets (e.g., county<br />
<strong>vs</strong>. zip code as unit of analysis) or is the focus individual health outcomes?<br />
a. Associations between health care parameters and specific health outcomes found when<br />
using aggregate units (e.g., counties or zip codes) may not hold at the individual level<br />
(i.e., a modifiable areal unit problem). This limitation was generally not acknowledged.<br />
As noted by Rost et al., 127 many of the important questions concerning rural-urban disparities in<br />
health care cannot be answered by simply demonstrating differences in health care systems. A<br />
more useful set of questions focus on clarifying what health outcomes, if any, show a disparity,<br />
for whom does the disparity exist, and why is there a disparity. Accordingly, we make the<br />
following recommendations.<br />
1. Because many factors are correlated with rurality, adjusting for all available covariates<br />
may lead to false conclusions regarding the association of rurality and study outcomes, and<br />
provide insufficient information for the development of healthcare policy. For most research<br />
questions, a more contextual analytic approach should be used.<br />
a. For example, first reporting bivariate associations (missing from many papers) and then<br />
examining which, if any, of the available covariates significant in multivariable models<br />
contributed to the observed differences in the bivariate analyses. Alternatively, other<br />
statistical models, such as multilevel models, might be useful.<br />
b. These associations must also be considered when selecting instrumental variables or<br />
developing propensity models for risk adjustment.<br />
2. Most rural residents receive their primary health care locally. However, a significant<br />
proportion of rural residents will travel to more urban areas for medical conditions that<br />
require specialist treatment or for which they have less confidence in the expertise of their<br />
usual provider 111 Few studies acknowledged this trend, and those that did generally omitted<br />
data from those individuals who received their care in urban settings. Studies should address<br />
this selection bias and seek to understand its implications for their study findings and for the<br />
health care systems involved.<br />
3. In several studies, interactions were found between race (and/or income) and residential<br />
population density. Such interactions may have significant implications for interventions<br />
designed to address a rural health disparity, and should be tested in the research model if<br />
47
<strong>Rural</strong> <strong>vs</strong>. <strong>Urban</strong> <strong>Ambulatory</strong> <strong>Health</strong> <strong>Care</strong>: A Systematic <strong>Review</strong><br />
Evidence-based Synthesis Program<br />
appropriate. Interactions between race and rurality should be further explored as they could<br />
reflect any of the following (see Stern, 2010 12 for a discussion):<br />
a. Living in a rural or urban area affects health care (or access to health care) for a minority<br />
group differently than it does for whites.<br />
b. The association is due to the distribution of minority members of the patient group in<br />
question.<br />
c. A third factor is associated with both race and rurality (e.g., poverty)<br />
d. There is an association between race and some aspect of the healthcare system (e.g.,<br />
proportion of providers who are minorities).<br />
4. Studies that describe differences in healthcare systems but do not associate such differences<br />
with health outcomes are of limited value. Areas with limited healthcare resources may<br />
engage in successful service substitution and areas with an abundance of health care<br />
resources may engage in overutilization.<br />
5. Only one of the studies we reviewed that compared rural with urban health care used a<br />
prospective design. This limits the confidence with which factors associated with a rural<br />
disparity can be considered as potentially causal.<br />
6. Studies focused on providing descriptions of barriers to care are only helpful insofar as the<br />
barriers are associated with actual limitations in the use of needed healthcare services. All<br />
consumers have barriers to care, but not all barriers limit health care seeking.<br />
7. Large national databases often involve statistical corrections to adjust for any potential<br />
sampling bias. Using such databases improves a study’s external validity; however, the<br />
findings from such secondary analyses are often limited by what measures are available in<br />
the database.<br />
8. Studies that relied on self-report measures rarely assessed or corrected for sampling bias, and<br />
many did not include sampling bias as a possible study limitation. Similarly, studies sampling<br />
from multiple sites often did not address potential clustering effects in their analyses.<br />
9. Studies that sample nationally should consider examining whether there is regional variation<br />
in observed rural-urban disparities. Regional variation in rural-urban disparities has been<br />
demonstrated in studies involving veterans 4 and non-veterans. 31,51 Pooling across regions may<br />
attenuate disparities. Moreover, health care systems operate locally and identifying areas<br />
where problems are greatest would help policy makers target areas that have the most need.<br />
There are large gaps in the evidence base across clinical conditions, and minimal empirical work<br />
conducted on several areas of particular interest to the VA (e.g., TBI, PTSD, Hepatitis C). Filling<br />
in the evidence base will allow VA policy planners to make informed decisions about resource<br />
allocation.<br />
48
<strong>Rural</strong> <strong>vs</strong>. <strong>Urban</strong> <strong>Ambulatory</strong> <strong>Health</strong> <strong>Care</strong>: A Systematic <strong>Review</strong><br />
Evidence-based Synthesis Program<br />
REFERENCES<br />
1. Veterans <strong>Health</strong> Administration, Department of Veterans Affairs, Office of <strong>Rural</strong> <strong>Health</strong>.<br />
About <strong>Rural</strong> Veterans. Available at: http://vaww.ruralhealth.va.gov/RURALHEALTH/<br />
About_<strong>Rural</strong>_Veterans.asp. Accessed April 29, 2011.<br />
2. United States Department of Agriculture. <strong>Rural</strong> Population and Migration, 2009. Available<br />
at: http://www.ers.usda.gov/Briefing/Population/. Accessed April 29, 2011.<br />
3. Veterans <strong>Health</strong> Administration, Department of Veterans Affairs, Office of <strong>Rural</strong> <strong>Health</strong>.<br />
Demographic Characteristics of <strong>Rural</strong> Veterans. Available at: http://vaww.ruralhealth.<br />
va.gov/RURALHEALTH/docs/IBDemographicCharacteristics.pdf. Accessed April 29,<br />
2011.<br />
4. Weeks WB, Kazis LE, Shen Y. Differences in health-related quality of life in rural and<br />
urban veterans. Am J Public <strong>Health</strong> 2004;94(10):1762-7.<br />
5. Weeks WB, Wallace AE, Wang S, Lee A, Kazis LE. <strong>Rural</strong>-urban disparities in health-related<br />
quality of life within disease categories of Veterans. J <strong>Rural</strong> <strong>Health</strong> 2006;22(3):204-<br />
11.<br />
6. Wallace AE, MacKenzie TA, Wright SM, Weeks WB. A cross-sectional, multi-year<br />
examination of rural and urban Veterans Administration users: 2002-2006. Mil Med<br />
2010;175(4):252-8.<br />
7. Wallace AE, Lee R, MacKenzie TA, et al. A longitudinal analysis of rural and urban veterans’<br />
health-related quality of life. J <strong>Rural</strong> <strong>Health</strong> 2010;26(2):156-63.<br />
8. Weeks WB, Bott DM, Lamkin PR, Wright SM. Veterans <strong>Health</strong> Administration and<br />
Medicare outpatient health care utilization by older rural and urban New England veterans.<br />
J <strong>Rural</strong> <strong>Health</strong> 2005;21(2):167-71.<br />
9. West AN, Weeks WB. <strong>Health</strong> care expenditures for urban and rural veterans in veterans<br />
health administration care. <strong>Health</strong> Serv Res 2009;44(5 Pt 1):1718-34.<br />
10. Institute of Medicine. Unequal treatment: confronting racial and ethnic disparities in<br />
health care. Washington DC: The National Academies Press, 2003.<br />
11. Weeks WB, Wallace AE, West AN, Heady HR, Hawthorne K. Research on rural veterans:<br />
An analysis of the literature. J <strong>Rural</strong> <strong>Health</strong> 2008;24(4):337-44.<br />
12. Stern S, Merwin E, Hauenstein E, et al. The effects of rurality on mental and physical<br />
health. <strong>Health</strong> Serv Outcomes Res Methods 2010;10:33-66.<br />
13. West AN, Lee RE, Shambaugh-Miller ME, et al. Defining “rural” for veterans’ health<br />
care planning. J <strong>Rural</strong> <strong>Health</strong> 2010;26(4):301-9.<br />
14. Berke EM, West AN, Wallace AE, Weeks WB. Practical and policy implications of using<br />
different rural-urban classification systems: a case study of inpatient service utilization<br />
among Veterans Administration users. J <strong>Rural</strong> <strong>Health</strong> 2009;25(3):259-66.<br />
49
<strong>Rural</strong> <strong>vs</strong>. <strong>Urban</strong> <strong>Ambulatory</strong> <strong>Health</strong> <strong>Care</strong>: A Systematic <strong>Review</strong><br />
Evidence-based Synthesis Program<br />
15. Institute of Medicine. Redesigning the clinical effectiveness research paradigm: Innovation<br />
and practice-based approaches: Workshop summary. Olsen L, McGinnis JM, eds.<br />
Washington DC: The National Academies Press, 2010.<br />
16. Owens DK, Lohr KN, Atkins D, et al. Grading the strength of a body of evidence when<br />
comparing medical interventions-Agency for <strong>Health</strong>care Research and Quality and the<br />
Effective <strong>Health</strong> <strong>Care</strong> Program. J Clin Epidemiol 2009;63:513-23.<br />
17. Shamliyan TA, Kane RL, Ansari M, et al. Development quality criteria to evaluate nontherapeutic<br />
studies of incidence, prevalence, or risk factors of chronic diseases: pilot<br />
study of new checklists. J Clin Epidemiol 2011;64:637-57.<br />
18. Casey MM, Thiede Call K, Klinger JM. Are rural residents less likely to obtain recommended<br />
preventive healthcare services? Am J Prev Med 2001;21:182-8.<br />
19. Zhang P, Tao G, Irwin KL. Utilization of preventive medical services in the United States:<br />
a comparison between rural and urban populations. J <strong>Rural</strong> <strong>Health</strong> 2000;16(4):349-56.<br />
20. Brown KC, Fitzhugh EC, Neutens JJ, Klein DA. Screening mammography utilization in<br />
Tennessee women: The association with residence. J <strong>Rural</strong> <strong>Health</strong> 2009;25:167-73.<br />
21. Coughlin SS, Leadbetter S, Richards T, Sabatino SA. Contextual analysis of breast and<br />
cervical cancer screening and factors associated with health care access among United<br />
States women, 2002. Soc Sci Med 2008;66:260-75.<br />
22. Coughlin SS, Thompson TD. Colorectal cancer screening practices among men and women<br />
in rural and nonrural areas of the United States, 1999. J <strong>Rural</strong> <strong>Health</strong> 2004;20:118-24.<br />
23. Coughlin SS, Thompson TD, Hall HI, Logan P, Uhler RJ. Breast and cervical carcinoma<br />
screening practices among women in rural and nonrural areas of the United States, 1998-<br />
1999. Cancer 2002;94:2801-12.<br />
24. Kinney AY, Harrell J, Slattery M, Martin C, Sandler RS. <strong>Rural</strong>-urban differences in colon<br />
cancer risk in blacks and whites: the North Carolina Colon Cancer Study. J <strong>Rural</strong> <strong>Health</strong><br />
2006;22(2):124-30.<br />
25. Schootman M, Fuortes LJ. Breast and cervical carcinoma: The correlation of activity<br />
limitations and rurality with screening, disease incidence, and mortality. Cancer<br />
1999a;86(6):1087-94.<br />
26. Stearns SC, Slifkin, RT, Edin HM. Access to care for rural Medicare beneficiaries. J <strong>Rural</strong><br />
<strong>Health</strong> 2000;16(1):31-42.<br />
27. Epstein B, Grant T, Schiff M, Kasehagen L. Does rural residence affect access to prenatal<br />
care in Oregon? J <strong>Rural</strong> <strong>Health</strong> 2009;25:150-157.<br />
28. Laditka JN, Laditka SB, Probst JC. <strong>Health</strong> care access in rural areas: Evidence that hospitalization<br />
for ambulatory care-sensitive conditions in the United States may increase with<br />
the level of rurality. <strong>Health</strong> Place 2009;15(3):761-70.<br />
50
<strong>Rural</strong> <strong>vs</strong>. <strong>Urban</strong> <strong>Ambulatory</strong> <strong>Health</strong> <strong>Care</strong>: A Systematic <strong>Review</strong><br />
Evidence-based Synthesis Program<br />
29. Saag KG, Doebbeling BN, Rohrer JE, et al. Variation in tertiary prevention and health<br />
service utilization among the elderly: The role of urban-rural residence and supplemental<br />
insurance. Med <strong>Care</strong> 1998;36:965-76.<br />
30. Schreiber S, Zielinski T. The meaning of ambulatory care sensitive admissions: urban and<br />
rural perspectives. J <strong>Rural</strong> <strong>Health</strong> 1997;13(4):276-84.<br />
31. Edwards JB, Tudiver F. Women’s preventive screening in <strong>Rural</strong> <strong>Health</strong> Clinics. Women’s<br />
<strong>Health</strong> Issues 2008;18(3):155-66.<br />
32. Probst JC, Laditka JN, Laditka SB. Association between community health center and rural<br />
health clinic presence and county-level hospitalization rates for ambulatory care sensitive<br />
conditions: an analysis across eight US states. BMC <strong>Health</strong> Serv Res 2009;9:134.<br />
Epub 2009 31 July.<br />
33. Shugarman LR, Sorbero ME, Tian H, Jain AK, Ashwood JS. An exploration of urban<br />
and rural differences in lung cancer survival among Medicare beneficiaries. Am J Public<br />
<strong>Health</strong> 2008;98(7):1280-7.<br />
34. Loberiza FR, Cannon AJ, Weisenburger DD, et al. Survival disparities in patients with<br />
lymphoma according to place of residence and treatment provider: A population based<br />
study. J Clin Oncol 2009;27:5376-82.<br />
35. Elliott TE, Elliott BA, Renier CM, Haller IV. <strong>Rural</strong>-urban differences in cancer care:<br />
results from the Lake Superior <strong>Rural</strong> Cancer <strong>Care</strong> Project. Minn Med 2004;87(9):44-50.<br />
36. Chirumbole M, Gusani N, Howard A, Leonard T, Lewis P, Muscat J. A comparison of<br />
stage of presentation for pancreatic and colorectal cancer in Pennsylvania 2000-2005.<br />
Anticancer Res 2009;29:3427-32.<br />
37. Higginbotham JC, Moulder J, Currier M. <strong>Rural</strong> v. urban aspects of cancer: first-year data<br />
from the Mississippi Central Cancer Registry. Fam Community <strong>Health</strong> 2001;24(2):1-9.<br />
38. Paquette I, Finlayson SRG. <strong>Rural</strong> versus urban colorectal and lung cancer patients: Differences<br />
in stage at presentation. J Am Coll Surg 2007;205(5):636-41.<br />
39. McLafferty S, Wang F. <strong>Rural</strong> reversal? <strong>Rural</strong>-urban disparities in late-stage cancer risk in<br />
Illinois. Cancer 2009;115:2755-64.<br />
40. Sankaranarayanan J, Watanabe-Galloway S, Sun J, Qiu F, Boilesen E, Thorson AG. <strong>Rural</strong>ity<br />
and other determinants of early colorectal cancer diagnosis in Nebraska: A 6-year<br />
cancer registry study, 1998-2003. J <strong>Rural</strong> <strong>Health</strong> 2009;25:358-65.<br />
41. McLaughlin J, Balkrishnan R, Paskett ED, Kimmick GG, Anderson RT. Patient and<br />
provider determinants associated with the prescription of adjuvant hormonal therapies<br />
following a diagnosis of breast cancer in Medicaid-enrolled patients. J Natl Med Assoc<br />
2009;101:1112-8.<br />
42. Schootman M, Aft R. <strong>Rural</strong>-urban differences in radiation therapy for ductal carcinoma<br />
in-situ of the breast. Breast Cancer Res Treat 2001;68(2):117-25.<br />
51
<strong>Rural</strong> <strong>vs</strong>. <strong>Urban</strong> <strong>Ambulatory</strong> <strong>Health</strong> <strong>Care</strong>: A Systematic <strong>Review</strong><br />
Evidence-based Synthesis Program<br />
43. Baldwin LM, Cai Y, Larson EH, et al. Access to cancer services for rural colorectal cancer<br />
patients. J <strong>Rural</strong> <strong>Health</strong> 2008;24(4):390-9.<br />
44. O’Hare AM, Johansen KL, Rodriguez RA. Dialysis and kidney transplantation among<br />
patients living in rural areas of the United States. Kidney Int 2006;69(2):343-9.<br />
45. Krishna S, Gillespie KN, McBride TM. Diabetes burden and access to preventive care in<br />
the rural United States. J <strong>Rural</strong> <strong>Health</strong> 2010;26(1):3-11.<br />
46. Ward MM. Access to care and the incidence of end-stage renal disease due to diabetes.<br />
Diabetes <strong>Care</strong> 2009;32(6):1032-6.<br />
47. Andrus MR, Kelley KW, Murphey LM, Herndon KC. A comparison of diabetes care in<br />
rural and urban medical clinics in Alabama. J Community <strong>Health</strong> 2004;29(1):29-44.<br />
48. Koopman RJ, Mainous AG, Geesey ME. <strong>Rural</strong> residence and Hispanic ethnicity: Doubly<br />
disadvantaged for diabetes? J <strong>Rural</strong> <strong>Health</strong> 2006;25:63-8.<br />
49. Morden NE, Berke EM, Welsh DE, McCarthy JF, MacKenzie TA, Kilbourne AM. Quality<br />
of care for cardiometabolic disease: Associations with mental disorder and rurality.<br />
Med <strong>Care</strong> 2010;48:72-78.<br />
50. Rosenblatt RA, Baldwin L-M, Chan L, et al. Improving the quality of outpatient care for<br />
older patients with diabetes: lessons from a comparison of rural and urban communities. J<br />
Fam Pract 2001;50(8):676-80.<br />
51. Weingarten JP, Brittman S, Hu W, Przybyszewski C, Hammond JM, FitzGerald D. The<br />
state of diabetes care provided to Medicare beneficiaries living in rural America. J <strong>Rural</strong><br />
<strong>Health</strong> 2006;22(4):351-8.<br />
52. Kirkbride K, Wallace N. <strong>Rural</strong> health clinics and diabetes-related primary care for Medicaid<br />
beneficiaries in Oregon. J <strong>Rural</strong> <strong>Health</strong> 2009;25:247-52.<br />
53. Hicks PC Bublitz Emsermann C, Westfall JM, Parnes B. Comparison of HTN management<br />
in patients with diabetes between rural and urban primary care clinics in Northeastern<br />
Colorado – a report from SNOCAP. <strong>Rural</strong> Remote <strong>Health</strong> 2010;10:1279. Epub 2010<br />
Feb 12.<br />
54. King DE, Crisp JR. <strong>Rural</strong>-urban differences in factors associated with poor blood pressure<br />
control among outpatients. South Med J 2006;99(11):1221-3.<br />
55. Colleran KM, Richards A, Shafer K. Disparities in cardiovascular disease risk and treatment:<br />
demographic comparison. J Investig Med 2007;55(8):415-22.<br />
56. Dellasega C, Orwig D, Ahern F, Lenz E. Postdischarge medication use of elderly cardiac<br />
patients from urban and rural locations. J Gerontol A Biol Sci Med Sci 1999;54A:M514-<br />
20.<br />
57. Whyte BM, Carr JC. Comparison of AIDS in women in rural and urban Georgia. South<br />
Med J 1992;85(6):571-8.<br />
52
<strong>Rural</strong> <strong>vs</strong>. <strong>Urban</strong> <strong>Ambulatory</strong> <strong>Health</strong> <strong>Care</strong>: A Systematic <strong>Review</strong><br />
Evidence-based Synthesis Program<br />
58. Cohn SE, Berk ML, Berry SH, et al. The care of HIV-infected adults in rural areas of the<br />
United States. J Acquir Immune Defic Syndr 2001;28(4):385-92.<br />
59. Napravnik S, Eron JJ, McKaig RG, Hein AD, Menezes P, Quinlivan EB. Factors associated<br />
with fewer visits for HIV primary care at a tertiary care center in the Southeastern<br />
U.S. AIDS <strong>Care</strong> 2006;18(Suppl 1):S45-50.<br />
60. Schur CL, Berk ML, Dunbar JR, Shapiro MF, Cohn SE, Bozzette SA. Where to<br />
seek care: An examination of people in rural areas with HIV/AIDS. J <strong>Rural</strong> <strong>Health</strong><br />
2002;18;337-47.<br />
61. Buchanan RJ, Schiffer R, Stuifbergen A, et al. Demographic and disease characteristics<br />
of people with multiple sclerosis living in urban and rural areas. Int J MS <strong>Care</strong><br />
2006a;8(3):89-98.<br />
62. Buchanan RJ, Wang S, Stuifbergen A, Chakravorty BJ, Zhu L, Kim M. <strong>Urban</strong>/rural differences<br />
in the use of physician services by people with multiple sclerosis. NeuroRehabilitation<br />
2006b;21(3):177-87.<br />
63. Buchanan RJ, Schiffer R, Wang S, et al. Satisfaction with mental health care among<br />
people with multiple sclerosis in urban and rural areas. Psychiatr Serv 2006c;57(8):1206-<br />
9.<br />
64. Schootman M, Fuortes L. Functional status following traumatic brain injuries: population-based<br />
rural-urban differences. Brain Inj 1999b;13:995-1004.<br />
65. Johnstone B, Nossaman LD, Schopp LH, Holmquist L, Rupright SJ. Distribution of services<br />
and supports for people with traumatic brain injury in rural and urban Missouri. J<br />
<strong>Rural</strong> <strong>Health</strong> 2002;18:109-17.<br />
66. Wilson RD, Lewis SA, Murray PK. Trends in the rehabilitation therapist workforce in<br />
underserved areas: 1980-2000. J <strong>Rural</strong> <strong>Health</strong> 2009;25:26-32.<br />
67. Gibbons RD, Hur K, Bhaumik DK, Mann JJ. The relationship between antidepressant<br />
medication use and rate of suicide. Arch Gen Psychiatry 2005;62(2):165-72.<br />
68. Fiske A, Gatz M, Hannell E. <strong>Rural</strong> suicide rates and availability of health care providers.<br />
J Community Psychol 2005;33(5):537-43.<br />
69. Rost K, Zhang M, Fortney J, Smith J, Smith GR. <strong>Rural</strong>-urban differences in depression<br />
treatment and suicidality. Med <strong>Care</strong> 1998;36(7):1098-107.<br />
70. Fortney J, Rushton G, Wood S, et al. Community-level risk factors for depression hospitalizations.<br />
Adm Policy Ment <strong>Health</strong> & Ment <strong>Health</strong> Serv Res 2007;34:343-52.<br />
71. Fortney JC, Xu S, Dong F. Community-level correlates of hospitalizations for persons<br />
with schizophrenia. Psychiatr Serv 2009 60:772-8.<br />
72. Farrell SP, Koch JR, Blank M. <strong>Rural</strong> and urban differences in continuity of care after<br />
state hospital discharge. Psychiatr Serv 1996;47(6):652-4.<br />
53
<strong>Rural</strong> <strong>vs</strong>. <strong>Urban</strong> <strong>Ambulatory</strong> <strong>Health</strong> <strong>Care</strong>: A Systematic <strong>Review</strong><br />
Evidence-based Synthesis Program<br />
73. Fischer EP, McSweeney JC, Pyne JM, et al. Influence of family involvement and<br />
substance use on sustained utilization of services for schizophrenia. Psychiatr Serv<br />
2008;59(8):902-8.<br />
74. Fortney J, Rost K, Zhang M, Warren J. The impact of geographic accessibility on the<br />
intensity and quality of depression treatment. Med <strong>Care</strong> 1999;37:884-93.<br />
75. Mohamed S, Neale M, Rosenheck RA. VA intensive mental health case management<br />
in urban and rural areas: veteran characteristics and service delivery. Psychiatr Serv<br />
2009;60(7):914-21.<br />
76. Rost K, Owen RR, Smith J, Smith GR. <strong>Rural</strong>-urban differences in service use and course<br />
of illness in bipolar disorder. J <strong>Rural</strong> <strong>Health</strong> 1998;14(1):36-43.<br />
77. Rost K, Fortney J, Zhang M, Smith J, Smith GR. Treatment of depression in rural Arkansas:<br />
policy implications for improving care. J <strong>Rural</strong> <strong>Health</strong> 1999;15(3):308-15.<br />
78. Rost K, Adams S, Xu S, Dong F. <strong>Rural</strong>-urban differences in hospitalization rates of primary<br />
care patients with depression. Psychiatr Serv 2007;58(4):503-8.<br />
79. Elhai JD, Baugher SN, Quevillon RP, Sauvageot J, Frueh BC. Psychiatric symptoms and<br />
health service utilization in rural and urban combat veterans with posttraumatic stress<br />
disorder. J Nerv Ment Dis 2004;192(10):701-4.<br />
80. Booth BM, Kirchner J, Fortney J, Ross R, Rost K. <strong>Rural</strong> at-risk drinkers: correlates and<br />
one-year use of alcoholism treatment services. J Stud Alcohol 2000;61(2):267-77.<br />
81. Grant BF. Toward an alcohol treatment model: a comparison of treated and untreated<br />
respondents with DSM-IV alcohol use disorders in the general population. Alcohol Clin<br />
Exp Res 1996;20(2):372-8.<br />
82. Metsch LR, McCoy CB. Drug treatment experiences: rural and urban comparisons. Subst<br />
Use Misuse 1999;34(4-5):763-84.<br />
83. Robertson EB, Donnermeyer JF. Illegal drug use among rural adults: mental health consequences<br />
and treatment utilization. Am J Drug Alcohol Abuse 1997;23(3):467-84.<br />
84. Fortney JC, Booth BM, Blow FC, Bunn JY, Loveland Cook CA. The effects of travel<br />
barriers and age on the utilization of alcoholism treatment aftercare. Am J Drug Alcohol<br />
Abuse 1995;21(3):391-406.<br />
85. Petterson SM. Metropolitan-nonmetropolitan differences in amount and type of mental<br />
health treatment. Arch Psychiatr Nurs 2003;17(1):12-9.<br />
86. Petterson S, Williams IC, Hauenstein EJ, Rovnyak V, Merwin E. Race and ethnicity and<br />
rural mental health treatment. J <strong>Health</strong> <strong>Care</strong> Poor Underserved 2009;20(3):662-77.<br />
87. Hauenstein EJ, Petterson S, Merwin E, Rovnyak V, Heise B, Wagner D. <strong>Rural</strong>ity, gender,<br />
and mental health treatment. Fam Community <strong>Health</strong> 2006;29(3):169-85.<br />
54
<strong>Rural</strong> <strong>vs</strong>. <strong>Urban</strong> <strong>Ambulatory</strong> <strong>Health</strong> <strong>Care</strong>: A Systematic <strong>Review</strong><br />
Evidence-based Synthesis Program<br />
88. Wang PS, Lane, M, Olfson M, Pincus, HA, Wells KB, Kessler RC. Twelve-month use of<br />
mental health services in the United States: Results from the National Comorbidity Survey<br />
Replication. Arch Gen Psychiatry 2005;62(6):629-40.<br />
89. Fillenbaum GG, Hanlon JT, Corder EH, Ziqubu-Page T, Wall WE, Brock D. Prescription<br />
and nonprescription drug use among black and white community-residing elderly. Am J<br />
Public <strong>Health</strong> 1993;83(11):1577-82.<br />
90. Hanlon JT, Landerman LR, Wall WE, et al. Is medication use by community-dwelling<br />
elderly people influenced by cognitive function? Age Aging 1996;25(3):190-6.<br />
91. Lago D, Stuart B, Ahern F. <strong>Rural</strong>ity and prescription drug utilization among the elderly:<br />
an archival study. J <strong>Rural</strong> <strong>Health</strong> 1993;9(1):6-16.<br />
92. Lillard LA, Rogowski J, Kington R. Insurance coverage for prescription drugs: effects on<br />
use and expenditures in the Medicare population. Med <strong>Care</strong> 1999;37(9):926-36.<br />
93. Mueller C, Schur C. Insurance coverage of prescription drugs and the rural elderly. J<br />
<strong>Rural</strong> <strong>Health</strong> 2004;20(1):17-25.<br />
94. Xu KT, Smith SR, Borders TF. Access to prescription drugs among noninstitutionalized<br />
elderly people in west Texas. Am J <strong>Health</strong>-Syst Pharm 2003;60:675-82.<br />
95. Rogowski J, Lillard LA, Kington R. The financial burden of prescription drug use among<br />
elderly persons. Gerontologist 1997;37(4):475-82.<br />
96. Miller ME, Holahan J, Welch WP. Geographic variations in physician service utilization.<br />
Med <strong>Care</strong> Res Rev 1995;52(2):252-78.<br />
97. Escarce JJ, Epstein KR, Colby DC, Schwartz JS. Racial differences in the elderly’s use of<br />
medical procedures and diagnostic tests. Am J Public <strong>Health</strong> 1993;83(7):948-54.<br />
98. Blazer DG, Landerman LR, Fillenbaum G, Horner R. <strong>Health</strong> services access and use<br />
among older adults in North Carolina: urban <strong>vs</strong> rural residents. Am J Public <strong>Health</strong><br />
1995;85(10):1384-90.<br />
99. McConnel CE, Zetzman MR. <strong>Urban</strong>/rural differences in health service utilization by<br />
elderly persons in the United States. J <strong>Rural</strong> <strong>Health</strong> 1993;9(4):270-80.<br />
100. Glover S, Moore CG, Probs JC, Samuels ME. Disparities in access to care among rural<br />
working-age adults. J <strong>Rural</strong> <strong>Health</strong> 2004;20(3):193-205.<br />
101. Himes CL, Rutrough TS. Differences in the use of health services by metropolitan and<br />
nonmetropolitan elderly. J <strong>Rural</strong> <strong>Health</strong> 1994;10(2):80-8.<br />
102. Larson SL, Fleishman JA. <strong>Rural</strong>-urban differences in usual source of care and ambulatory<br />
service use: analyses of national data using <strong>Urban</strong> Influence Codes. Med <strong>Care</strong> 2003;41(7<br />
Suppl):III-65-74.<br />
103. Mueller KJ, Patil K, Boilesen E. The role of uninsurance and race in healthcare utilization<br />
by rural minorities. <strong>Health</strong> Serv Res 1998;33(3 Pt 1):597-610.<br />
55
<strong>Rural</strong> <strong>vs</strong>. <strong>Urban</strong> <strong>Ambulatory</strong> <strong>Health</strong> <strong>Care</strong>: A Systematic <strong>Review</strong><br />
Evidence-based Synthesis Program<br />
104. Maciejewski ML, Perkins M, Li Y-F, Chapko M, Fortney JC, Liu C-F. Utilization and<br />
expenditures of veterans obtaining primary care in community clinis and VA medical centers:<br />
an observational cohort study. BMC <strong>Health</strong> Serv Res 2007;7:56. Epub 2007 18 April.<br />
105. Fortney JC, Borowsky SJ, Hedeen AN, Maciejewski ML, Chapko MK. VA Community-<br />
Based Outpatient Clinics: Access and utilization performance measures. Med <strong>Care</strong><br />
2002;40(7):561-9.<br />
106. Meza JL, Chen L-W, William TV, Ullrich F, Mueller KJ. Differences in beneficiary assessments<br />
of health care between TRICARE Prime and TRICARE Prime Remote. Mil<br />
Med 2006;171(10):950-4.<br />
107. Borders TF. <strong>Rural</strong> community-dwelling elders’ reports of access to care: are there Hispanic<br />
versus non-Hispanic white disparities? J <strong>Rural</strong> <strong>Health</strong> 2004;20(3):210-20.<br />
108. Rohrer JE, Kruse G, Zhang Y. Hispanic ethnicity, rural residence, and regular source of<br />
care. J Community <strong>Health</strong> 2004;29(1):1-13.<br />
109. Brown B, Bushardt R, Harmon K, Nguyen SA. Dermatology diagnoses among rural and<br />
urban physician assistants. JAAPA 2009;22(12):32-5.<br />
110. Ferrer RL. Pursuing equity: Contact with primary care and specialist clinicians by demographics,<br />
insurance, and health status. Ann Fam Med 2007;5(6):492-502.<br />
111. Biola H, Pathman DE. Are there enough doctors in my rural community? Perceptions of<br />
the local physician supply. J <strong>Rural</strong> <strong>Health</strong> 2009;25(2):115-23.<br />
112. Grumbach K, Hart LG, Mertz E, Coffman J, Palazzo L. Who is caring for the underserved?<br />
A comparison of primary care physicians and nonphysician clinicians in California<br />
and Washington. Ann Fam Med 2003;1(2):97-104.<br />
113. Everett CM, Schumacher JR, Wright A, Smith MA. Physician assistants and nurse practitioners<br />
as a usual source of care. J <strong>Rural</strong> <strong>Health</strong> 2009;25(4):407-14.<br />
114. Jones PE. Doctor and physician assistant distribution in rural and remote Texas counties.<br />
Aust J <strong>Rural</strong> <strong>Health</strong> 2008;16(6):389.<br />
115. Gunderson A, Menachemi N, Brummel-Smith K, Brooks R. Physicians who treat the elderly<br />
in rural Florida: trends indicating concerns regarding access to care. J <strong>Rural</strong> <strong>Health</strong><br />
2006;2(3):224-8.<br />
116. Menachemi N, Brooks RG, Clawson A, Stine C, Beitsch L. Continuing decline in service<br />
delivery for family physicians: is the malpractice crisis playing a role? Qual Manag<br />
<strong>Health</strong> <strong>Care</strong> 2006;15(1):39-45.<br />
117. Baldwin LM, Rosenblatt RA, Schneeweiss R, Lishner DM, Hart LG. <strong>Rural</strong> and urban<br />
physicians: does the content of their Medicare practices differ? J <strong>Rural</strong> <strong>Health</strong><br />
1999;15(2):240-251.<br />
56
<strong>Rural</strong> <strong>vs</strong>. <strong>Urban</strong> <strong>Ambulatory</strong> <strong>Health</strong> <strong>Care</strong>: A Systematic <strong>Review</strong><br />
Evidence-based Synthesis Program<br />
118. Strickland WJ, Strickland DL, Garretson C. <strong>Rural</strong> and urban nonphysician providers in<br />
Georgia. J <strong>Rural</strong> <strong>Health</strong> 1998;14(2):109-20.<br />
119. United States Census Bureau. 2009 American Community Survey 1-Year Estimates,<br />
Geographic Comparison Tables, 2009. Available at: http://factfinder.census.gov/servlet/<br />
DatasetMainPageServlet?_program=ACS. Accessed April 29, 2011.<br />
120. Brookhart MA, Stümer T, Glynn RJ, Rassen J, Schneeweiss S. Confounding control in<br />
healthcare database research: challenges and potential approaches. Med <strong>Care</strong> 2010;48(6<br />
Suppl):S114-20.<br />
121. Walsh ME, Katz MA, Sechrest L. Unpacking cultural factors in adaptation to type 2 diabetes<br />
mellitus. Med <strong>Care</strong> 2002;40(1 Suppl):I129-39.<br />
122. United States Department of <strong>Health</strong> and Human Services, Agency for <strong>Health</strong>care Research<br />
and Quality. National <strong>Health</strong>care Disparities Report, 2010. Available at: http://<br />
www.ahrq.gov/qual/qrdr10.htm. Accessed April 29, 2011.<br />
123. Veterans <strong>Health</strong> Administration, Department of Veterans Affairs. 2010 VHA Facility<br />
Quality and Safety Report, 2010. Available at: http://www.va.gov/health/docs/Hospital-<br />
ReportCard2010.pdf. Accessed April 29, 2011.<br />
124. Cully JA, Lameson JP, Phillips LL, Kunik ME, Fortney JC. Use of psychotherapy by<br />
rural and urban veterans. J <strong>Rural</strong> <strong>Health</strong> 2010;26:225-33.<br />
125. Fortney JC, Harman JS, Xu S, Dong F. The association between rural residence and the<br />
use, type, and quality of depression care. J <strong>Rural</strong> <strong>Health</strong> 2010;26:205-13.<br />
126. O’Neill L. The effect of insurance status on travel time for rural Medicare patients. Med<br />
<strong>Care</strong> Res Rev 2004;61(2):187-202.<br />
127. Rost K, Fortney J, Fischer E, Smith J. Use, quality, and outcomes of care for mental<br />
health: the rural perspective. Med <strong>Care</strong> Res Rev 2002;59(3):231-65.<br />
57
<strong>Rural</strong> <strong>vs</strong>. <strong>Urban</strong> <strong>Ambulatory</strong> <strong>Health</strong> <strong>Care</strong>: A Systematic <strong>Review</strong><br />
Evidence-based Synthesis Program<br />
APPENDIX A. DATA ABSTRACTION FORM<br />
Name of Study<br />
Check if Background<br />
paper<br />
Journal First Author Year Inclusion Eligibility? Y N If "No", what #?<br />
Study<br />
Design<br />
Cohort Cross-sectional Case-control RCT Non-<br />
RCT<br />
<strong>Review</strong>/Meta-analysis<br />
Sample<br />
Data<br />
Source<br />
Analyses<br />
Unit<br />
Registry<br />
Stat method<br />
# sites/<br />
national?<br />
Survey<br />
(note response rate)<br />
Sample<br />
size Inclusion/Exclusion Criteria Vet?<br />
<strong>Health</strong> care<br />
Records<br />
Primary <strong>vs</strong>.<br />
secondary<br />
1 o 2 o<br />
Adjusted Covariates/Independent Variables<br />
Y N<br />
<strong>Rural</strong>/<br />
urban?<br />
Y N<br />
National database (define)<br />
Appropriate Stats?<br />
Adjusted for sampling<br />
bias?<br />
Adjusted for non-response<br />
bias?<br />
Adjusted for clustering?<br />
Findings: Include outcome measures and, if appropriate, magnitude of effect.<br />
<strong>Rural</strong> definition used<br />
Date(s) of<br />
dataset<br />
Y N N/A<br />
Y N N/A<br />
Y N N/A<br />
Y N N/A<br />
Outcome<br />
Measure<br />
Question<br />
1 2 3 4 4a<br />
66<br />
58
<strong>Rural</strong> <strong>vs</strong>. <strong>Urban</strong> <strong>Ambulatory</strong> <strong>Health</strong> <strong>Care</strong>: A Systematic <strong>Review</strong><br />
Evidence-based Synthesis Program<br />
APPENDIX B. PEER REVIEW COMMENTS AND AUTHOR RESPONSES<br />
REVIEWER COMMENT<br />
1. Are the objectives, scope, and methods for this review clearly described?<br />
Yes. This is a good review.<br />
Yes, although I think it will be important to highlight that this review is comparing the care of rural<br />
<strong>vs</strong>. urban patients in general, and that data for rural <strong>vs</strong>. urban veterans are even more sparse and<br />
therefore one cannot infer that rural veterans face the same disparities in care as rural non-veterans.<br />
Yes<br />
Yes. The objectives, scope, and methods make sense and are useful for researchers, providers,<br />
and policymakers. More work of this kind is needed. It is not clear why only ambulatory care articles<br />
were included in the study selection when some of the topics were relevant beyond only ambulatory<br />
care. The repeated mention of inconsistencies and other problems related to definitions of<br />
rurality and the way “rural <strong>vs</strong>. urban” is viewed conceptually were very important. More detailed<br />
suggestions about what needs to be done to address this (e.g., how will consensus be reached)<br />
would be helpful. More explicit information is needed about the study selection, data abstractions,<br />
data synthesis, and rating of the body of evidence. It would be hard to replicate this review with the<br />
information given.<br />
a. Yes, though the methods could be expanded. It is difficult to assess the quality or thoroughness<br />
of the search for relevant articles, as the description of the process is minimal. Data abstractions<br />
were done by “researchers trained in critical analysis of the literature,” but there is no description of<br />
the training or of the qualifications of the abstractors. There is a bit more description of the evaluative<br />
ratings of the studies that were reviewed, but no mention of who did these ratings or of any<br />
inter-rater reliability.<br />
b. Another concern is that the tables in which you present your ratings of the quality of the studies<br />
do not seem to be reflected in the text. For example, in a table, you give two studies low confidence<br />
ratings. But in the text, there is no indication that there may be problems with those studies. As one<br />
reads the text, the only way he would know that you have doubts about the quality of these studies<br />
would be to continually refer to the table at the end of the section. Few readers will do this. Within<br />
each section of text, you might want to segregate the good studies form the bad ones so the reader<br />
will know which ones to rely most on.<br />
Yes<br />
Yes<br />
Yes<br />
2. Is there any indication of bias in our synthesis of the evidence?<br />
No<br />
RESPONSE<br />
Thank you.<br />
We agree, and have clarified this in the text.<br />
We focused on ambulatory care. Including hospital care<br />
would have made the review unwieldy and too diffusely<br />
focused. That being said, some traditionally non-ambulatory<br />
care topics were included because they were indirect indicators<br />
of ambulatory care access and/or quality (e.g., hospitalizations<br />
for ambulatory care sensitive conditions). We have<br />
further clarified our methodology in the text.<br />
These are both excellent points and we have made relevant<br />
revisions in the text.<br />
59
<strong>Rural</strong> <strong>vs</strong>. <strong>Urban</strong> <strong>Ambulatory</strong> <strong>Health</strong> <strong>Care</strong>: A Systematic <strong>Review</strong><br />
Evidence-based Synthesis Program<br />
REVIEWER COMMENT<br />
No. This is a balanced and objective review that highlights the lack of good information and the inability<br />
to draw any firm conclusions.<br />
No<br />
While there is no strong indication of bias, sources of bias could be better protected against<br />
through specific efforts. The methods used for review would be strengthened by blinding reviewers<br />
to both author and journal. Inter-rater reliability could be tested by more than one reviewer reviewing<br />
the same articles. It is unclear what preparation the reviewers had and how the reviewers were<br />
instructed and trained for this purpose. The term “trained reviewer” is used several times without<br />
much explanation about what that means. There is variation in that term.<br />
No – as you note, the evidence is pretty inconclusive.<br />
No<br />
No. There really is a lack of good published evidence. One problem, however, is that the synthesis<br />
does not include operational products within agencies (i.e., white papers, special studies). In the<br />
VA, for example, OQP have conducted internal analysis of clinical quality and patient satisfaction<br />
metrics and generally found no differences between patients residing in rural and urban areas.<br />
No<br />
3. Are there any published or unpublished studies that we may have overlooked?<br />
Not that I am aware of.<br />
I realize the scope of his review was on published, peer-reviewed literature but reports issued by<br />
government agencies that have undergone internal review should perhaps be considered particularly<br />
for “high level” views of disparities. The AHRQ National <strong>Health</strong> Disparities Report, as well as<br />
the VHA-published Hospital Report Cards for 2008-2010 are worth consulting. The VHA report<br />
cards include breakdown of our performance measurement system (including process and satisfaction<br />
results) by rural <strong>vs</strong>. urban residence.<br />
It would also be helpful to expand the scope beyond the three data sources used and include more<br />
hand searching (some was done). Inclusion of relevant dissertation research would be helpful.<br />
Assuring that negative findings are included (since there is publication bias) would strengthen the<br />
findings.<br />
None that I can think of.<br />
The library of articles on telehealth, including telephone management.<br />
Thank you.<br />
RESPONSE<br />
We have elaborated on the methodology in the text to address<br />
the issues raised. The first and second authors rated<br />
all papers after jointly rating 20 to achieve consensus in our<br />
ratings.<br />
Since there is no evidence based rating system for nonrandomized<br />
trials, we had to develop our own. In the text,<br />
we acknowledged that the ratings were qualitative in nature<br />
and that their primary value was to explicate to the readers<br />
the bases of our evaluations.<br />
The task was to develop a synthesis of the existing published<br />
peer-reviewed evidence base. We did, however, examine<br />
studies conducted by OQP and AHRQ, and have commented<br />
on the findings of those reports in our discussion.<br />
As noted above, we have now examined studies conducted<br />
by OQP and AHRQ, and have commented on the findings of<br />
those reports in our discussion.<br />
While we agree that information from well controlled studies<br />
that did not make it to publication because of negative<br />
findings would be informative, the systematic nature of the<br />
evidence based synthesis report precludes the use of nonpeer<br />
reviewed literature.<br />
When we began the literature review for this report, a<br />
separate report was being developed to cover the telehealth<br />
literature.<br />
60
<strong>Rural</strong> <strong>vs</strong>. <strong>Urban</strong> <strong>Ambulatory</strong> <strong>Health</strong> <strong>Care</strong>: A Systematic <strong>Review</strong><br />
Evidence-based Synthesis Program<br />
REVIEWER COMMENT<br />
See comment above about operational products within agencies. Some of these results are available<br />
in the public domain such as Data.gov and on VA Websites.<br />
This is a very complete review.<br />
4. Are there any clinical performance measures, programs, quality improvement measures,<br />
patient care services, or conferences that will be directly affected by this report? If so,<br />
please provide detail.<br />
No<br />
OQP plans to use this evidence review to inform our own measurement systems and reports, and<br />
will be particularly careful in our use of risk adjustment procedures that may “adjust away” the<br />
impact of rurality. We are also working closely with the Office of <strong>Rural</strong> <strong>Health</strong> to create more robust<br />
indicators of rural health disparities and believe the partnership will be strengthened by this report.<br />
Results should influence a) findings presented at annual HSR&D national meetings and b) programs<br />
funded by the Office of <strong>Rural</strong> <strong>Health</strong><br />
This report should be disseminated widely and used as the basis for creating an agenda for systematically<br />
closing gaps in both knowledge and practice. VA’s various centers (e.g., VERCs and<br />
QUERI groups) can use this report to help focus their efforts and assure that their work is applicable<br />
to veterans in rural and highly rural areas.<br />
Not that I am aware of.<br />
This paper has the potential to significantly impact and direct future directions in rural health research<br />
and rural health clinical implementation and quality improvement efforts.<br />
5. Please provide any recommendations on how this report can be revised to more directly<br />
address or assist implementation needs.<br />
a. I recommend leaving out studies that you do not believe contribute. It becomes hard to pick up<br />
on the important, relevant findings when everything is presented. Several of the studies were of different<br />
provider types not urban/rural differences in health care in my opinion. I also think that more<br />
clearly weighting and emphasizing the studies that you believe really are valid and generalizable<br />
would improve this paper.<br />
b. I think you should add a quality rating column to your evidence tables. It is hard to go back and<br />
forth. I would like to see good summary tables in the text when possible.<br />
You may be able to give more specific recommendations to policy makers, such as which definition<br />
of rurality to use, as well as specific advice on how to adjust for patient mix so as not to submerge<br />
important rural/urban disparities.<br />
See comments above.<br />
RESPONSE<br />
Thank you.<br />
Thank you – we will share the responses to this question<br />
with the people responsible for dissemination of the report.<br />
We have clarified study quality within the text and have<br />
added the final Confidence Score rating to our evidence<br />
tables to assist readers.<br />
It is our belief that the convention to be used in studies for<br />
the categorization of population density cannot be determined<br />
by this review and likely will vary depending on the<br />
type of study being conducted. Similarly, case mix adjustment<br />
depends on the focus of the study (e.g., whether or<br />
not to adjust for travel distance) will vary depending on the<br />
focus of the study.<br />
61
<strong>Rural</strong> <strong>vs</strong>. <strong>Urban</strong> <strong>Ambulatory</strong> <strong>Health</strong> <strong>Care</strong>: A Systematic <strong>Review</strong><br />
Evidence-based Synthesis Program<br />
REVIEWER COMMENT<br />
It would be helpful if there were tables (similar to the ones presenting the strength of evidence) with<br />
a + or a – or a NS, indicating which studies found significant rural-urban differences in the main<br />
constructs examined. This would allow the reader to get a quick visual on how many and what proportion<br />
of studies found differences in diabetes outcomes, for example.<br />
Section a beginning on page 49 seems out of place in a summary section. Perhaps it would fit better<br />
directly after page 45.<br />
This is a very dense report with lots of information. I liked the way the authors categorized their<br />
review by both their main questions and by disease categories within those. Some specific comments/suggestions:<br />
a. Spell out their search terms – saying standard search terms isn’t enough<br />
b. Specify that you used the VA definition in the intro when you say 40% of veterans are rural<br />
c. Even though it’s already very long, the review really does lack the whole piece on telehealth that<br />
the VA in particular uses to compensate for in-person ambulatory access deficits. At least need to<br />
explain why you left that out.<br />
d. Since this is a VA report, it might be helpful to segregate VA and non-VA studies within each category,<br />
or at least put asterisks on VA studies to denote them. Even saying they looked at “veterans”<br />
doesn’t say for sure they were looking at VA services, or even VA users.<br />
e. In terms of interventions, I didn’t see a section on that to be able to give feedback on. I assume<br />
this would be the place to include telehealth. This may call for a separate literature review to include<br />
all telehealth terms and not rely on “rural” “urban” terms to get at the articles they want.<br />
f. The point about paucity of prospective (or even longitudinal but non-interventional) studies is really<br />
important. I think this is where HSR&D should make the point (to ORH) that improving care and<br />
access to rural veterans is not just about observing and recording what’s out there, but about planning<br />
interventions and prospectively evaluating their effect on rural veteran’s health and access.<br />
Inclusion of non-published results per above comments. Because of the complexity of the issues,<br />
report should strongly recommend thoughtful “risk adjusted” analysis<br />
Additional Comments:<br />
The finding that continuity of care was reported for rural residents although there was no evidence<br />
that they were more likely to have a usual source of care seems incongruous<br />
“Among the findings were higher rates of invasive cancer related to lower rates of screening” –<br />
Please specify – did the findings really link these two?<br />
RESPONSE<br />
We have added ‘+’ and ‘-’ indicators to our tables to assist<br />
readers.<br />
When we began this report, a separate systematic review<br />
was to be conducted on telehealth interventions. For this<br />
reason, we chose to NOT evaluate telehealth studies and<br />
to focus instead on other types of interventions. However,<br />
since that review was not conducted, we agree with reviewers<br />
that examining only non-telehealth interventions makes<br />
little sense and so we have excluded that section from the<br />
final report.<br />
We have clarified our methods and the reasons why a<br />
review of telehealth interventions were not included. The<br />
section on interventions was removed for the reasons noted<br />
above.<br />
There were an insufficient number of studies conducted<br />
within VA to separate them. However, we specifically note<br />
VA studies when they were reviewed.<br />
Implications for risk adjustment have since been emphasized<br />
in the report.<br />
The distinction has now been clarified in the text.<br />
Yes, for cervical and breast cancers as we note.<br />
62
<strong>Rural</strong> <strong>vs</strong>. <strong>Urban</strong> <strong>Ambulatory</strong> <strong>Health</strong> <strong>Care</strong>: A Systematic <strong>Review</strong><br />
Evidence-based Synthesis Program<br />
REVIEWER COMMENT<br />
RESPONSE<br />
“Potential interactions of rurality and race (and/or income) should be considered.” – You might comment<br />
that this area of research (at least evaluating outcomes) is extremely prone to confounding<br />
This was noted in the discussion.<br />
eg. people may move to urban settings when ill/needing more health care or, people who chose<br />
rural locations might make other health care choices than those choosing an urban setting<br />
“It remains to be determined, however, whether the observed lower health quality of life among We agree, and further clarified this in the text.<br />
rural veterans is due to differences in disease prevalence, disparities in health care or both.” Or, different<br />
people choose different locals to live in. it is more complex than this in my opinion<br />
Regarding the literature search strategy figure, do you think there would be any value in adding We feel this might increase confusion.<br />
more arrows to the bottom box telling what category the papers fell into?<br />
The Institute of Medicine definition of disparity does not include variation due to differences in The specific reference was clarified in the text.<br />
access (IOM, 2003). -Not sure I agree with this statement. I thought the IOM focused on all differences<br />
in utilization that were not due to differences in need and preference. I would just drop this<br />
sentence and the next<br />
It might be nice to rate the relevance of the evidence to veterans. Perhaps each summary could We specifically indicated which studies focused on veterans.<br />
start with the VA study or state that no VA study exists.<br />
Since many veterans use non-VA care and many of those<br />
who use VA split their care between VA and community providers,<br />
all studies are potentially relevant to veterans.<br />
Mental <strong>Health</strong> section: Two studies were missed from the Journal of <strong>Rural</strong> <strong>Health</strong> that I think are<br />
important. One is a VA study.<br />
Cully JA, Jameson JP, Phillips LL, Kunik ME, Fortney JC. Use of Psychotherapy by <strong>Rural</strong> and <strong>Urban</strong><br />
Veterans. Journal of <strong>Rural</strong> <strong>Health</strong>, 26(3): 225-233, 2010.<br />
These studies were published after our March 2010 pull<br />
date. However, given their relevance we note their findings<br />
in the discussion.<br />
Fortney JC, Harman JS, Xu S, Dong F. The Association between <strong>Rural</strong> Residence and the Use,<br />
Type, and Quality of Depression <strong>Care</strong>, Journal of <strong>Rural</strong> <strong>Health</strong>,26(3): 205-213, 2010.<br />
This study found higher suicidality in rural versus urban: Rost, K., M. Zhang, et al. (1998). “<strong>Rural</strong>urban<br />
differences in depression treatment and suicidality.” Medical <strong>Care</strong> 36(7): 1098-1107.<br />
Here are two papers showing that rurality is related to hospitalization rates for depression and<br />
schizophrenia:<br />
Fortney J, Rushton G, Wood S, Zhang l, Xu S, Dong F, Rost K. Community-Level Risk Factors for<br />
Depression Hospitalizations. Administration and Policy in Mental <strong>Health</strong> and Mental <strong>Health</strong> Services<br />
Research, 34(4): 343-352, 2007<br />
Fortney J, Xu S, Dong F. Community-Level Correlates of Hospitalizations for Persons with Schizophrenia<br />
, Psychiatric Services, 60(6): 772-778, 2009.<br />
“Moreover, while rural residents were found to receive fewer MH services than urban residents in<br />
several studies, the clinical impact of this difference was unclear.” - See this article: Fortney J. Rost<br />
K. and Zhang M. The Impact of Geographic Accessibility on the Intensity and Quality of Depression<br />
Treatment. Medical <strong>Care</strong> 37(9):884-893, 1999.<br />
This study, which was already included in the review, was<br />
added to the section covering suicidality.<br />
We included these per your recommendation; however, the<br />
methods used were only suggestive regarding reasons for<br />
differential hospitalization rates in rural <strong>vs</strong>. urban areas.<br />
We have now included this article in our review.<br />
63
<strong>Rural</strong> <strong>vs</strong>. <strong>Urban</strong> <strong>Ambulatory</strong> <strong>Health</strong> <strong>Care</strong>: A Systematic <strong>Review</strong><br />
Evidence-based Synthesis Program<br />
REVIEWER COMMENT<br />
Regarding CBOCs and VAMCs This study is actually the better study, as it is quasi-experimental:<br />
Fortney J, Maciejewski M, Warren J, and Burgess J. Does Improving Geographic Access to VA Primary<br />
<strong>Care</strong> Services Impact Patients’ Patterns of Utilization and Costs? Inquiry, 42(1):29-42, 2005<br />
Travel Distance - There are actually lots and lots of travel distance articles which you didn’t find because<br />
you were searching for rural <strong>vs</strong> urban studies. You might need to either drop this or expand<br />
your search.<br />
“There is some weak evidence that urban residents have a lower threshold for seeking mental<br />
health care than do rural residents” - I don’t really believe this. Severity at intake is not different<br />
between rural and urban patients.<br />
“As has been shown by others (Weeks, Wallace, 2008; Berke, 2009; Stern, 2010) the definition of<br />
rural that is used in a study has a significant impact on the findings and, consequently, the policy<br />
implications.” - I would also reiterate that rural is a proxy for many different things (travel time,<br />
stigma, lack of insurance, etc.), and that the rural <strong>vs</strong> urban literature does not determine what underlying<br />
factors are driving the findings.<br />
“Because many factors are correlated with rurality, adjusting for all available covariates may lead to<br />
false conclusions regarding the association of rurality and study outcomes, and provide insufficient<br />
information for the development of healthcare policy. For most research questions, a more contextual<br />
analytic approach should be used.” – Good observation! Might want to include this point in the<br />
executive summary.<br />
Where possible use data / numbers (and indicate statistical significance, if appropriate) instead of<br />
phrases like, little difference, or increased rates etc. or give the page number where the specific<br />
data is found later in the document<br />
“However, all but one study found a greater frequency of unstaged cancer at the time of diagnosis<br />
in rural areas compared to urban areas.” - I think it would be good to mention the outcomes (present<br />
or absence of data) on how this finding affects mortality<br />
“Moreover, health care systems operate locally and identifying areas where problems are greatest<br />
would help policy makers target areas that have the most need.” - <strong>Rural</strong>ity may very well be different<br />
in various parts of the country i.e. rural Alaska is different than rural Mississippi etc.<br />
RESPONSE<br />
The relationship between CBOC placement and rurality is<br />
not uniform, which is why we did not include this interesting<br />
article in our review.<br />
We agree that our search terms did not allow us to comment<br />
sufficiently on this topic.<br />
We are aware of no studies that actually asses provider<br />
availability and patient treatment attitudes and needs in<br />
urban and rural residents and then associate those differences<br />
with use of mental health services.<br />
We have clarified this in the report.<br />
Thank you for this recommendation. We have now done so.<br />
We have tried to improve the clarity of findings in the report.<br />
No information about the implications of unstaged disease<br />
for outcomes were made in the papers reviewed. The odds<br />
of unstaged disease was not a primary focus of the studies,<br />
but was an incidental finding.<br />
We think these differences have received very little attention.<br />
64
<strong>Rural</strong> <strong>vs</strong>. <strong>Urban</strong> <strong>Ambulatory</strong> <strong>Health</strong> <strong>Care</strong>: A Systematic <strong>Review</strong><br />
Evidence-based Synthesis Program<br />
APPENDIX C. EVIDENCE TABLES<br />
Appendix C, Table 1. Preventive <strong>Care</strong>/<strong>Ambulatory</strong> <strong>Care</strong> Sensitive Conditions<br />
Author,<br />
Year, Study<br />
Design<br />
Casey, 2001 18<br />
Crosssectional<br />
Study Population (Sample<br />
Size, Inclusion/Exclusion,<br />
Region/Nationwide)<br />
N = 130,452 respondents<br />
Exclusion: respondents whose<br />
BRFSS records could not<br />
be linked to ARF data using<br />
county Federal Information<br />
Processing Standard (FIPS)<br />
codes<br />
Data Source, Year(s) (if<br />
applicable)<br />
Response Rate (if applicable)<br />
National data from the 1997<br />
Behavioral Risk Factor Surveillance<br />
System (BRFSS) and<br />
the 1999 Area Resource File<br />
Definition of<br />
<strong>Urban</strong>/<strong>Rural</strong><br />
<strong>Urban</strong> = Metropolitan<br />
Statistical Area<br />
(MSA)<br />
<strong>Rural</strong> adjacent: nonmetropolitan<br />
county<br />
physically adjacent<br />
to metropolitan<br />
Covariates<br />
Age, gender, education,<br />
Income, race/ethnicity, insurance<br />
coverage, primary care<br />
physicians/1000 population,<br />
census region<br />
Confidence<br />
Score*<br />
High<br />
Results**<br />
Influenza vaccination in the<br />
past year for women ≥ 65<br />
years old (-)<br />
Pneumonia vaccination for<br />
women ≥ 65 years old (-)<br />
Epstein,<br />
2009 27<br />
Crosssectional<br />
Nationwide<br />
N = 1,508<br />
Inclusion: stratified random<br />
sample of 200 women who<br />
gave birth to a live child 60-<br />
100 days before selection date<br />
2003 Oregon Pregnancy<br />
Risk Assessment Monitoring<br />
System<br />
Oregon Birth Certificate database<br />
<strong>Rural</strong> nonadjacent<br />
county<br />
<strong>Rural</strong>-<strong>Urban</strong> Commuting<br />
Area Codes:<br />
urban, large rural, or<br />
small/isolated rural<br />
Age, marital status, education,<br />
Hispanic ethnicity,<br />
intended or unintended pregnancy,<br />
household income,<br />
questionnaire language<br />
Low/<br />
Moderate<br />
Late initiation of prenatal care<br />
(-)<br />
Barriers to prenatal care initiation<br />
(-)<br />
Laditka,<br />
2009 28<br />
Crosssectional<br />
Saag, 1998 29<br />
Crosssectional<br />
Oregon<br />
Inclusion: counties with ≥<br />
1,000 for analyses of children<br />
and adults 65 years), ≥ 1 of<br />
the indicator conditions, resident<br />
of state’s 12 most rural<br />
and 10 most urban counties<br />
Iowa<br />
Response: 65.8%<br />
Hospital discharge data for<br />
2002 from State Inpatient<br />
Databases (SIDS); Area<br />
Resource File (2002); U.S.<br />
Census Bureau; U.S. Census<br />
Bureau’s Small Area <strong>Health</strong><br />
Insurance Estimates<br />
Population based phone<br />
survey evaluating six common<br />
chronic indicator conditions<br />
(arthritis, hypertension, cardiac<br />
disease, diabetes mellitus,<br />
peptic ulcer disease, and<br />
chronic obstructive pulmonary<br />
disease)<br />
Response: 57%<br />
2003 <strong>Urban</strong> Influence<br />
Codes (U.S.<br />
Department of Agriculture)<br />
with 7 levels<br />
from large metro to<br />
most rural<br />
U.S. Department of<br />
Agriculture continuum<br />
codes.<br />
<strong>Urban</strong>: metro areas<br />
with > 250,000<br />
residents<br />
<strong>Rural</strong>: U<br />
Hospitalization for ambulatory<br />
care sensitive conditions –<br />
ages 65 and older (+); R>U<br />
Continuity of care (seeing<br />
same physician) (+); R>U<br />
Appointments with specialists<br />
(+); R>U<br />
Perceived need for medical<br />
advice (+); R
<strong>Rural</strong> <strong>vs</strong>. <strong>Urban</strong> <strong>Ambulatory</strong> <strong>Health</strong> <strong>Care</strong>: A Systematic <strong>Review</strong><br />
Evidence-based Synthesis Program<br />
Author,<br />
Year, Study<br />
Design<br />
Schreiber,<br />
1997 30<br />
Crosssectional<br />
Zhang, 2000 19<br />
Crosssectional<br />
Study Population (Sample<br />
Size, Inclusion/Exclusion,<br />
Region/Nationwide)<br />
N = 1,461 Zip Codes with<br />
population >300<br />
New York<br />
N = 4,051<br />
Inclusion: men and women<br />
aged 65 or older<br />
Data Source, Year(s) (if<br />
applicable)<br />
Response Rate (if applicable)<br />
New York State Department<br />
of Public <strong>Health</strong>; U.S. Census<br />
Bureau 1990<br />
1994 National <strong>Health</strong> Interview<br />
Survey (NHIS)<br />
Overall response: 79.5%<br />
Definition of<br />
<strong>Urban</strong>/<strong>Rural</strong><br />
Six point urbanrural<br />
scale based<br />
on population, size<br />
of largest city/town,<br />
% of workforce that<br />
commutes outside<br />
the county; grouped<br />
to New York City<br />
area, upstate<br />
New York urbansuburban,<br />
and more<br />
remote rural<br />
U.S. Office of<br />
Management and<br />
Budget’s (MSAs<br />
and non-MSAs)<br />
Covariates<br />
% of population in poverty,<br />
population density (population<br />
per square mile, %<br />
blacks, number of primary<br />
care physicians per 1,000<br />
population), location of ZIP<br />
code (within 8 miles of hospital,<br />
within a health professional<br />
shortage area [HPSA])<br />
Census region, education,<br />
household income, insurance<br />
status, overall health status<br />
Confidence<br />
Score*<br />
Low<br />
Moderate<br />
Results**<br />
<strong>Ambulatory</strong> <strong>Care</strong> Sensitive<br />
Conditions (ACSC)<br />
admissions:<br />
a) increased as population<br />
density decreased within each<br />
of the 3 defined regions (+)<br />
b) increased as percentage of<br />
black residents increased (+)<br />
except in the most rural group<br />
(-)<br />
c) increased as number of<br />
primary care physicians per<br />
1000 increased (+)<br />
Flu shots received in previous<br />
year (-)<br />
Nationwide<br />
*See Methods section for explanation<br />
**U=<strong>Urban</strong>; R=<strong>Rural</strong>; HR=Highly rural; F=Frontier; S=Suburban; (+)=difference statistically significant; (-)=difference not statistically significant<br />
66
<strong>Rural</strong> <strong>vs</strong>. <strong>Urban</strong> <strong>Ambulatory</strong> <strong>Health</strong> <strong>Care</strong>: A Systematic <strong>Review</strong><br />
Evidence-based Synthesis Program<br />
Appendix C, Table 2. Cancer Screening<br />
Author, Year<br />
Study<br />
Design<br />
Brown K.,<br />
2009 20<br />
Crosssectional<br />
Study Population (Sample<br />
Size, Inclusion/Exclusion,<br />
Region/Nationwide)<br />
N = 1,922 women (620 rural)<br />
Inclusion: Non-Hispanic whites<br />
and non-Hispanic black, age<br />
≥40, reporting screening mammography<br />
or no mammography<br />
Data Source, Year(s) (if<br />
applicable)<br />
Response Rate (if applicable)<br />
Behavioral Risk Factor Surveillance<br />
System (BRFSS) 2001<br />
and 2003<br />
Definition of <strong>Urban</strong>/<br />
<strong>Rural</strong><br />
<strong>Rural</strong>-<strong>Urban</strong><br />
Continuum Codes<br />
(RUCCs) – collapsed<br />
to 2 levels:<br />
rural or urban<br />
Covariates<br />
Age, race/ethnicity, marital<br />
status, education, employment,<br />
health status, smoker,<br />
health insurance, personal<br />
health care provider<br />
Confidence<br />
Score*<br />
Moderate<br />
Results**<br />
Screening mammography<br />
utilization (-)<br />
Casey, 2001 18<br />
Crosssectional<br />
Coughlin,<br />
2008 23<br />
Crosssectional<br />
Tennessee<br />
N = 130,452 respondents<br />
Exclusion: respondents whose<br />
BRFSS records could not be<br />
linked to ARF data using county<br />
Federal Information Processing<br />
Standard (FIPS) codes; California<br />
data on mammograms and<br />
(Pap) tests (state had modified<br />
wording of those questions)<br />
N = 97,820 (Pap smears),<br />
91,492 (mammography)<br />
Inclusion: reported county of<br />
residence<br />
Pap smears-women with<br />
known Pap test status, ≥18<br />
yrs, no history of hysterectomy<br />
Mammography-women with<br />
known mammography screening<br />
status, ≥40 yrs<br />
National data from the 1997<br />
Behavioral Risk Factor Surveillance<br />
System (BRFSS) and<br />
the 1999 Area Resource File<br />
Behavioral Risk Factor Surveillance<br />
System (BRFSS) 2002<br />
Area Resource Files (ARF)<br />
2004<br />
Census 2002<br />
<strong>Urban</strong> = Metropolitan<br />
Statistical Area<br />
(MSA)<br />
<strong>Rural</strong> adjacent =<br />
nonmetropolitan<br />
county physically<br />
adjacent to metropolitan<br />
<strong>Rural</strong> nonadjacent<br />
county<br />
US Department of<br />
Agriculture (USDA)<br />
RUCC collapsed to<br />
3 levels: rural, suburban,<br />
metropolitan<br />
Age, gender, education,<br />
income, race/ethnicity, insurance<br />
coverage, primary care<br />
physicians/1000 population,<br />
census region<br />
Individual-level covariates<br />
(e.g., age, race, marital status,<br />
education, income, employment,<br />
health insurance,<br />
health status) and contextual<br />
covariates (e.g., residence,<br />
number of health centers per<br />
population, number of physicians<br />
per population)<br />
High<br />
Colon cancer screening for<br />
women and men age ≥50 (+);<br />
U>all R<br />
Cervical cancer screening for<br />
women age > 18 (+); U>all R<br />
Mammogram for women age<br />
≥50 (+); U>non-adjacent R<br />
High Pap test in counties with R,<br />
U>S<br />
Pap test in counties with 300-<br />
500 physicians per 100,000<br />
women (+); U>S<br />
Mammogram (+); U>R, S>R<br />
Coughlin,<br />
2004 22<br />
Crosssectional<br />
Coughlin,<br />
2002 21<br />
Crosssectional<br />
Nationwide excluding Alaska,<br />
including District of Columbia<br />
N = 23,565 men and 37,847<br />
women, age ≥ 50 yrs<br />
Nationwide<br />
N = 108,326 women, age ≥ 40<br />
yrs (mammography and clinical<br />
breast examination)<br />
N=131,813 women, age ≥ 18<br />
yrs, with no history of hysterectomy<br />
(Pap testing)<br />
Behavioral Risk Factor Surveillance<br />
System (BRFSS)<br />
1998-1999<br />
Behavioral Risk Factor Surveillance<br />
System (BRFSS)<br />
1998-1999<br />
USDA RUCC collapsed<br />
to 3 levels:<br />
rural, suburban,<br />
metropolitan<br />
USDA Beale Codes<br />
collapsed to 3<br />
levels: metropolitan,<br />
suburban, rural<br />
Race/ethnicity, age, gender,<br />
education, health insurance,<br />
visit to physician in past year,<br />
health profile, shortage area<br />
Age, gender, race, education,<br />
number of people in<br />
household, health status,<br />
visit to physician in past year,<br />
marital status<br />
High<br />
High<br />
Fecal occult blood test in past<br />
year (+); U>R, S>R<br />
Sigmoidoscopy or colonoscopy<br />
in past 5 years (+); U>R<br />
Mammogram in past 2 years<br />
(+); U>R, U>S, S>R<br />
Pap test in past 3 years (+);<br />
U>R<br />
Nationwide<br />
67
<strong>Rural</strong> <strong>vs</strong>. <strong>Urban</strong> <strong>Ambulatory</strong> <strong>Health</strong> <strong>Care</strong>: A Systematic <strong>Review</strong><br />
Evidence-based Synthesis Program<br />
Author, Year<br />
Study<br />
Design<br />
Kinney,<br />
2006 24<br />
Case-control<br />
Study Population (Sample<br />
Size, Inclusion/Exclusion,<br />
Region/Nationwide)<br />
N = 558 cases and 952 controls<br />
(matched on race, age,<br />
and gender)<br />
Inclusion (cases): ages 50-80<br />
yrs, pathologically confirmed<br />
invasive adenocarcinoma of<br />
colon<br />
Data Source, Year(s) (if<br />
applicable)<br />
Response Rate (if applicable)<br />
Interviews (face-to-face) 1996-<br />
2000<br />
Response: 72% (cases), 62%<br />
(controls)<br />
Definition of <strong>Urban</strong>/<br />
<strong>Rural</strong><br />
U.S. Census Bureau<br />
1990 standards<br />
<strong>Urban</strong>: Metropolitan<br />
Statistical Area (1<br />
city with ≥50,000 or<br />
total metro area of<br />
≥100,000)<br />
Covariates<br />
Age, race, gender, education,<br />
poverty index, recent<br />
colorectal cancer screening<br />
Confidence<br />
Score*<br />
Moderate<br />
Results**<br />
Colon cancer screening (NR);<br />
U>R #<br />
#<br />
Unadjusted analysis<br />
Schootman,<br />
1999 25<br />
Crosssectional<br />
Stearns,<br />
2000 26<br />
Cervical cancer screening<br />
model: education, age,<br />
income, having health insurance<br />
Crosssectional<br />
Zhang, 2000 19<br />
Crosssectional<br />
North Carolina<br />
N = 7,200 women<br />
Inclusion: Primary breast or<br />
cervical carcinoma diagnosed<br />
1991-95, non-institutionalized,<br />
≥18 yrs old<br />
Iowa<br />
N = 12,637<br />
Inclusion: Medicare enrollee<br />
for whole year, living in household<br />
for whole year<br />
Nationwide<br />
N = 8,970 (Pap smears), 2,729<br />
(mammography), 4,051 (flu<br />
shots)<br />
Inclusion: completed all three<br />
sections of NHIS<br />
Three services:<br />
Pap smears in past 3 years<br />
for women 18-65 yrs, mammogram<br />
in past 2 years for<br />
women-50-69 yrs, flu shot in<br />
past year for people ≥65 yrs<br />
Behavioral Risk Factor Surveillance<br />
System (BRFSS)<br />
1996-97<br />
Surveillance, Epidemiology, and<br />
End Results (SEER) 1991-95<br />
Response: 39%<br />
Medicare Current Beneficiary<br />
Survey (MCBS) 1993<br />
U.S. National <strong>Health</strong> Interview<br />
Survey (NHIS) 1994<br />
Response: 80%<br />
<strong>Rural</strong>: non-metropolitan<br />
Based on number of<br />
residents per square<br />
mile; 5 levels R<br />
Cervical cancer screening (+);<br />
U>R<br />
Moderate Mammogram in last year (-)<br />
(except rural county with city of<br />
>10,000 < urban)<br />
Pap test in last year (-)<br />
Moderate Pap smear (-)<br />
Mammogram (-)<br />
Nationwide<br />
*See Methods section for explanation<br />
**U=<strong>Urban</strong>; R=<strong>Rural</strong>; HR=Highly rural; F=Frontier; S=Suburban; (+)=difference statistically significant; (-)=difference not statistically significant; (NR)=significance not reported<br />
68
<strong>Rural</strong> <strong>vs</strong>. <strong>Urban</strong> <strong>Ambulatory</strong> <strong>Health</strong> <strong>Care</strong>: A Systematic <strong>Review</strong><br />
Evidence-based Synthesis Program<br />
Appendix C, Table 3. Cancer <strong>Care</strong><br />
Author,<br />
Year, Study<br />
Design<br />
Chirumbole,<br />
2009 36<br />
Crosssectional<br />
Elliott, 2004 35<br />
Data collected<br />
as part<br />
of grouprandomized<br />
trial of<br />
intervention<br />
directed at<br />
rural providers<br />
Higginbotham,<br />
2001 37<br />
Crosssectional<br />
Study Population (Sample<br />
Size, Inclusion/Exclusion,<br />
Region/Nationwide)<br />
N = 10,414 cases (pancreatic),<br />
56,767 (colorectal)<br />
Inclusion: colorectal or pancreatic<br />
cancer<br />
Pennsylvania<br />
N = 2,568 (1,463 or 57% rural)<br />
Inclusion: pathologically<br />
confirmed incident cancers of<br />
breast, colon, rectum, lung, or<br />
prostate; age ≥18 yrs, resided<br />
and had primary care physician<br />
in one of 18 rural study<br />
communities, spoke English,<br />
accrued within 6 weeks of<br />
diagnosis<br />
Lake Superior region (Minnesota,<br />
Wisconsin, Michigan)<br />
N = 9,685 cancer cases<br />
Inclusion: incident cancer<br />
cases (primary cancer site)<br />
Mississippi<br />
Data Source, Year(s) (if<br />
applicable)<br />
Response Rate (if applicable)<br />
Pennsylvania Department of<br />
<strong>Health</strong>, Bureau of <strong>Health</strong> Statistics<br />
Research 2000-05<br />
US Census Bureau 2000<br />
American Medical Association<br />
Physician-Related Data<br />
Resources<br />
<strong>Health</strong> <strong>Care</strong> Records 1992-97<br />
Mississippi State Department<br />
of <strong>Health</strong> Central Cancer<br />
Registry and Division of Vital<br />
Statistics 1996<br />
Definition of<br />
<strong>Urban</strong>/<strong>Rural</strong><br />
US Census Bureau;<br />
grouped 67<br />
counties into 22<br />
Workforce Investment<br />
Areas (WIA);<br />
rurality variable<br />
was % of a WIA<br />
population that<br />
was rural<br />
U.S. Census<br />
Bureau<br />
Census data:<br />
county with more<br />
than 50% rural<br />
designated as rural<br />
Covariates<br />
Age, gender, insurance<br />
status, education, poverty<br />
status, race, number of<br />
physicians per 100,000, ratio<br />
of oncology physicians to<br />
primary care physicians<br />
Age, oncology consultation<br />
Confidence<br />
Score*<br />
Low<br />
Low/<br />
Moderate<br />
Results**<br />
Later stage at diagnosis:<br />
Pancreatic (+); U>R<br />
Colorectal (-)<br />
Proportion of cases staged at<br />
diagnosis:<br />
(+); U>R for breast, non-small<br />
cell lung, and prostate cancer<br />
(-); colorectal and small cell<br />
lung cancer<br />
Stage at diagnosis:<br />
(+); R>U for breast, colorectal,<br />
and non-small cell lung cancer<br />
(-); small cell lung or prostate<br />
cancer<br />
Initial management score:<br />
(+); RR; African Americans<br />
(except lung cancer)<br />
Advanced stage at diagnosis<br />
(+); R>U all sites and lung<br />
cancer<br />
69
<strong>Rural</strong> <strong>vs</strong>. <strong>Urban</strong> <strong>Ambulatory</strong> <strong>Health</strong> <strong>Care</strong>: A Systematic <strong>Review</strong><br />
Evidence-based Synthesis Program<br />
Author,<br />
Year, Study<br />
Design<br />
Kinney,<br />
2006 24<br />
Case-control<br />
Loberiza,<br />
2009 34<br />
Retrospective<br />
cohort<br />
Study Population (Sample<br />
Size, Inclusion/Exclusion,<br />
Region/Nationwide)<br />
N = 558 cases and 952 controls<br />
(matched on race, age,<br />
and gender)<br />
Inclusion (cases): ages 50-80<br />
yrs, pathologically confirmed<br />
invasive adenocarcinoma of<br />
colon<br />
North Carolina<br />
N = 2,330<br />
Inclusion: lymphoma complete<br />
prognostic clinical data, residential<br />
ZIP code<br />
Patients with lymphoma<br />
reported to the Nebraska Lymphoma<br />
Study Group (Nebraska<br />
and surrounding states)<br />
Data Source, Year(s) (if<br />
applicable)<br />
Response Rate (if applicable)<br />
Interviews (face-to-face) 1996-<br />
2000<br />
Response: 72% (cases), 62%<br />
(controls)<br />
University of Nebraska Medical<br />
Center Oncology Database<br />
1982-2006<br />
Definition of<br />
<strong>Urban</strong>/<strong>Rural</strong><br />
U.S. Census Bureau,<br />
1990<br />
<strong>Urban</strong>: Metropolitan<br />
Statistical<br />
Area (1 city<br />
with ≥50,000 or<br />
total metro area of<br />
≥100,000)<br />
<strong>Rural</strong>: non-metropolitan<br />
<strong>Rural</strong>-<strong>Urban</strong> Commuting<br />
Area code;<br />
collapsed to 2<br />
categories<br />
Providers classified<br />
as universityor<br />
communitybased<br />
Covariates<br />
Age, race, gender, education,<br />
poverty index, sampling<br />
probabilities<br />
Median household income,<br />
distance traveled, year of<br />
treatment<br />
Confidence<br />
Score*<br />
Moderate<br />
Low/<br />
Moderate<br />
Results**<br />
Colon cancer stage at diagnosis<br />
(-)<br />
Risk of death (-); risk greater<br />
for rural community treated<br />
patients than urban or rural<br />
university treated patients; in<br />
high-risk subgroup risk higher<br />
for all groups relative to urban<br />
university treated<br />
Advanced treatment (-); use<br />
was higher in Universitytreated<br />
compared to community<br />
treated regardless of<br />
residence<br />
McLafferty, N = 150,794 cases<br />
2009 39 Inclusion: breast, colorectal,<br />
lung, or prostate cancer;<br />
staged cases<br />
Illinois<br />
Illinois State Cancer Registry<br />
1998-2002<br />
Surveillance, Epidemiology,<br />
and End Results (SEER) staging<br />
data<br />
<strong>Rural</strong>-<strong>Urban</strong><br />
Commuting Areas:<br />
modified to create<br />
Chicago city, Chicago<br />
suburb, other<br />
metropolitan, large<br />
town, and rural<br />
Multiple models<br />
1) unadjusted<br />
2) age, race<br />
3) socioeconomic and access<br />
variables based on zip<br />
code<br />
Moderate<br />
Death from primary lymphoma<br />
(+); R>U<br />
Risk of late stage diagnosis:<br />
Model 1 (+); city > all other regions<br />
for all 4 cancers (except<br />
lung cancer in suburb)<br />
Model 2 (+); city > all other<br />
regions for colorectal, breast<br />
(except city similar to most<br />
rural), and lung (except city<br />
similar to suburb) cancers; city<br />
> suburb (only) for prostate<br />
cancer<br />
Model 3 (+); city >other metro<br />
and large town for breast, city<br />
> large town for colorectal, and<br />
city >all regions except suburb<br />
for lung cancers<br />
70
<strong>Rural</strong> <strong>vs</strong>. <strong>Urban</strong> <strong>Ambulatory</strong> <strong>Health</strong> <strong>Care</strong>: A Systematic <strong>Review</strong><br />
Evidence-based Synthesis Program<br />
Author,<br />
Year, Study<br />
Design<br />
McLaughlin,<br />
2009 41<br />
Nested casecontrol<br />
Study Population (Sample<br />
Size, Inclusion/Exclusion,<br />
Region/Nationwide)<br />
N = 453 patients<br />
Inclusion: continuous Medicaid<br />
enrollment, newly started<br />
on aromatase inhibitor or<br />
tamoxifen, hormone receptorpositive<br />
tumors, stage I-III<br />
breast cancer, started adjuvant<br />
hormonal monotherapy during<br />
study, female, ≥55 yrs, white or<br />
African American<br />
Data Source, Year(s) (if<br />
applicable)<br />
Response Rate (if applicable)<br />
Linked North Carolina Central<br />
Cancer Registry-Medicaid<br />
Claims data 2000-04<br />
Definition of<br />
<strong>Urban</strong>/<strong>Rural</strong><br />
US Census<br />
Bureau and US<br />
Department of<br />
<strong>Health</strong> and Human<br />
Services- urban or<br />
rural<br />
Covariates<br />
Tumor size, type of surgery,<br />
race, type of provider and<br />
practice setting, admitted to<br />
hospital, admitted to nursing<br />
facility, receiving home health<br />
care, age<br />
Confidence<br />
Score*<br />
Low/<br />
Moderate<br />
Results**<br />
Treatment with aromatase<br />
inhibitors (+); U>R<br />
Paquette,<br />
2007 38<br />
Cross-sectional<br />
North Carolina<br />
N = 129,811 (colorectal),<br />
161,479 (lung)<br />
Inclusion: all adults (≥20 yrs) in<br />
SEER database with primary<br />
colorectal or lung cancer<br />
Nationwide<br />
Surveillance, Epidemiology,<br />
and End Results (SEER)<br />
database (National Cancer<br />
Institute), 2000-03<br />
<strong>Rural</strong>-<strong>Urban</strong><br />
Continuum Codes<br />
(RUCCs) – 9<br />
levels collapsed to:<br />
rural (levels 7 and<br />
9) or urban (levels<br />
1 to 3)<br />
Age, race, language isolation,<br />
gender, marital status,<br />
income<br />
Moderate<br />
Unstaged cancer rates:<br />
Colorectal (+); R>U<br />
Lung (+); R>U #<br />
Stage IV at presentation:<br />
Colorectal (+); U>R<br />
Lung (+); U>R<br />
#<br />
Unadjusted analysis<br />
Sankaranarayanan,<br />
N = 6,561 cases<br />
2009 40 Inclusion: incident colorectal<br />
cancer, age ≥19 yrs, no missing<br />
data in registry<br />
Nebraska<br />
Schootman,<br />
1999 25<br />
Cross-sectional<br />
Schootman,<br />
2001 42<br />
Cross-sectional<br />
N = 7,200 women<br />
Inclusion: primary breast or<br />
cervical carcinoma diagnosed<br />
1991-95, non-institutionalized,<br />
≥18 yrs old<br />
Iowa<br />
N = 6,988 (502 [7%] rural)<br />
Inclusion: women, all ages,<br />
diagnosed with primary microscopically<br />
confirmed DCIS<br />
1991-1996, treated with breast<br />
conserving surgery<br />
Nebraska Cancer Registry<br />
1998-2003<br />
Surveillance, Epidemiology,<br />
and End Results (SEER) staging<br />
data<br />
Behavioral Risk Factor Surveillance<br />
System (BRFSS)<br />
1996-97<br />
Surveillance, Epidemiology,<br />
and End Results (SEER) 1991-<br />
95<br />
Response: 39%<br />
Surveillance, Epidemiology,<br />
and End Results (SEER)<br />
program<br />
Area Resource File (ARF)<br />
Office of Management<br />
and Budget<br />
(OMB) 2003<br />
definitions: urban<br />
metropolitan,<br />
micropolitan nonmetropolitan,<br />
rural<br />
nonmetropolitan<br />
Based on number<br />
of residents per<br />
square mile; 5<br />
levels R (metropolitan<br />
no different from rural)<br />
Age Moderate In situ breast cancer rate (NR);<br />
RU<br />
Breast or cervical cancer<br />
mortality (-)<br />
SEER registry, year of diagnosis<br />
Moderate<br />
Receipt of radiation therapy:<br />
Age
<strong>Rural</strong> <strong>vs</strong>. <strong>Urban</strong> <strong>Ambulatory</strong> <strong>Health</strong> <strong>Care</strong>: A Systematic <strong>Review</strong><br />
Evidence-based Synthesis Program<br />
Author,<br />
Year, Study<br />
Design<br />
Study Population (Sample<br />
Size, Inclusion/Exclusion,<br />
Region/Nationwide)<br />
Shugarman N = 26,073 (84.2% urban,<br />
2008 33 6.3% large rural, 4.9% small<br />
rural, 4.6% isolated rural)<br />
Inclusion: continuously enrolled<br />
Medicare beneficiaries,<br />
age 65+, first diagnosed cancer<br />
was lung cancer 1995-99<br />
Exclusion: enrolled in managed<br />
care, end-stage renal<br />
disease, eligible for Medicare<br />
due to disability<br />
14 registries nationwide<br />
Data Source, Year(s) (if<br />
applicable)<br />
Response Rate (if applicable)<br />
SEER data linked to Medicare<br />
claims<br />
Area Resource File<br />
Definition of<br />
<strong>Urban</strong>/<strong>Rural</strong><br />
<strong>Rural</strong>-urban<br />
commuting area<br />
(RUCA codes) –<br />
30 codes collapsed<br />
to 4 categories:<br />
urban, large<br />
rural city, small<br />
rural town, isolated<br />
small rural town<br />
Covariates<br />
Gender, race/ethnicity, age<br />
at diagnosis, median ZIP<br />
code income, comorbidities,<br />
number of subspecialists,<br />
number of hospitals, residing<br />
in health professional shortage<br />
area, residing in census<br />
tract with >15% non-fluent<br />
English speakers<br />
Confidence<br />
Score*<br />
Results**<br />
Moderate Mortality (-)<br />
Unstaged at diagnosis (-)<br />
Stage at diagnosis (-)<br />
Number of subspecialists (+);<br />
R
<strong>Rural</strong> <strong>vs</strong>. <strong>Urban</strong> <strong>Ambulatory</strong> <strong>Health</strong> <strong>Care</strong>: A Systematic <strong>Review</strong><br />
Evidence-based Synthesis Program<br />
Appendix C, Table 4. Diabetes/End Stage Renal Disease (ESRD)<br />
Author,<br />
Year, Study<br />
Design<br />
Andrus,<br />
2004 47<br />
Non-RCT<br />
Koopman,<br />
2006 48<br />
Crosssectional<br />
Krishna,<br />
2010 45<br />
Crosssectional<br />
Study Population (Sample<br />
Size, Inclusion/Exclusion,<br />
Region/Nationwide)<br />
N = 187<br />
Inclusion: type II diabetes, two<br />
or more visits to their clinic in<br />
the past 12 months (<strong>Rural</strong> =<br />
78, <strong>Urban</strong> = 109)<br />
Alabama<br />
N = 947<br />
Inclusion: US civilian, ≥20<br />
years, non-institutionalized,<br />
participated in NHANES III:<br />
household adult, examination,<br />
and laboratory data files<br />
Exclusion: did not participate<br />
in all three parts of the survey<br />
Nationwide<br />
BRFSS (N = 441,351)<br />
MEPS (N = 48,428)<br />
Inclusion: age 18 and older<br />
Nationwide<br />
Data Source, Year(s) (if<br />
applicable)<br />
Response Rate (if applicable)<br />
Medical records of patients<br />
seen in clinics between January<br />
and August 2001<br />
Data collection took place Aug-<br />
Sept 2001 in <strong>Rural</strong> clinic; and<br />
Feb-March 2002 in urban clinic<br />
Third National <strong>Health</strong> and<br />
Nutrition Examination Survey<br />
(NHANES III) 1988-1994<br />
Behavioral Risk Factor Surveillance<br />
System (BRFSS)<br />
2001-2002; Medical Expenditure<br />
Panel Survey (MEPS)<br />
2001-2002.<br />
Definition of<br />
<strong>Urban</strong>/<strong>Rural</strong><br />
Not defined other<br />
than rural family<br />
practice clinic was<br />
a “physician-owned<br />
private family practice<br />
clinic with one<br />
physician provider”<br />
and urban internal<br />
medicine clinic<br />
included five physicians<br />
specializing<br />
in internal medicine<br />
and one physician<br />
specializing in endocrinology<br />
<strong>Urban</strong>: MSA<br />
<strong>Rural</strong>: Non-MSA<br />
<strong>Urban</strong>: MSA<br />
<strong>Rural</strong>: Non-MSA<br />
Covariates<br />
Confidence<br />
Score*<br />
Results**<br />
None Very Low Preventive care consistent<br />
with American Diabetes Association<br />
guidelines (NR); RU<br />
Compliance with diabetes care<br />
guidelines for eye exam, foot<br />
exam, diabetes education<br />
(+); R
<strong>Rural</strong> <strong>vs</strong>. <strong>Urban</strong> <strong>Ambulatory</strong> <strong>Health</strong> <strong>Care</strong>: A Systematic <strong>Review</strong><br />
Evidence-based Synthesis Program<br />
Author,<br />
Year, Study<br />
Design<br />
Morden,<br />
2010 49<br />
Crosssectional<br />
O’Hare,<br />
2006 44<br />
Crosssectional<br />
Rosenblatt,<br />
2001 50<br />
Crosssectional<br />
Study Population (Sample<br />
Size, Inclusion/Exclusion,<br />
Region/Nationwide)<br />
N=11,688<br />
Inclusion: Veterans with<br />
diabetes<br />
Nationwide<br />
N = 552,279 (and 4,363 dialysis<br />
facilities)<br />
Inclusion: initiated dialysis<br />
between 1/1/95 and 12/31/02<br />
and survived >90 days without<br />
transplant<br />
Nationwide<br />
N = 30,589<br />
Inclusion: all fee-for-service<br />
Medicare (continuous coverage)<br />
patients, 65+ years, alive<br />
at the end of the 1994, 2+ physician<br />
encounters for diabetes<br />
care in 1994, all medical care<br />
in Washington<br />
Data Source, Year(s) (if<br />
applicable)<br />
Response Rate (if applicable)<br />
2005 national Veterans <strong>Health</strong><br />
Administration cardiometabolic<br />
quality of care random sample<br />
chart review<br />
SMITREC: VA Serious<br />
Mental Illness Treatment and<br />
Evaluation Center<br />
U.S. Renal Data System<br />
2000 U.S. Census<br />
CMS Dialysis Facilities Compare<br />
database<br />
Medicare Part B claims data<br />
1994<br />
Definition of<br />
<strong>Urban</strong>/<strong>Rural</strong><br />
RUCA categories<br />
RUCA 1: urban<br />
RUCA 2: large rural<br />
city/town<br />
RUCA 3: small/isolated<br />
rural town<br />
<strong>Rural</strong>-<strong>Urban</strong> Commuting<br />
Area Codes<br />
(RUCA):<br />
<strong>Urban</strong> area<br />
Large <strong>Rural</strong> Area<br />
Small <strong>Rural</strong> Area<br />
Remote, Small<br />
<strong>Rural</strong> Area<br />
RUCA subset:<br />
<strong>Urban</strong><br />
Adjacent Large<br />
<strong>Rural</strong><br />
Remote Large <strong>Rural</strong><br />
Adjacent Small<br />
Remote Small<br />
Covariates<br />
Mental disorder diagnosis,<br />
RUCA (1-3), age, gender,<br />
race (black/non-black),<br />
marital status, substance<br />
abuse diagnosis, Charlson<br />
comorbidity index score, #<br />
VA outpatient visits, # visits to<br />
a VA community-based outpatient<br />
clinic, VA cost share<br />
category<br />
Age, gender, comorbid<br />
conditions at start of dialysis,<br />
dialysis modality at 90 days;<br />
ZIP code per capita income<br />
and % >25 yrs with high<br />
school diploma<br />
Stratified for race/ethnicity<br />
Sociodemographic factors,<br />
comorbidities, provider<br />
specialty<br />
Confidence<br />
Score*<br />
Moderate/<br />
High<br />
Results**<br />
LDL, foot exams, eye exams,<br />
renal testing, HbA1c, blood<br />
pressure (-)<br />
High Survival (+); all R white<br />
non-Hispanic > U white non-<br />
Hispanic; remote small R white<br />
Hispanic < U white Hispanic;<br />
small R and remote small R<br />
black > U black<br />
Time to kidney transplant (+);<br />
all R white non-Hispanic > U<br />
white non-Hispanic; large R<br />
and small R black < U black;<br />
remote small R Native American<br />
> U Native American<br />
Moderate Glycated hemoglobin test (+);<br />
Adjacent large R all others<br />
Ward, 2009 48<br />
Crosssectional<br />
Washington state<br />
N = 18,377 (from 1,681 ZIP<br />
codes with analysis by ZIP)<br />
Inclusion: age ≥ 20 years,<br />
treated incident end-stage renal<br />
disease (ESRD) attributed<br />
to diabetes or autosomal dominant<br />
polycystic kidney disease<br />
(ADPCKD) 1/1/01 to 6/30/04,<br />
California resident<br />
U.S. Renal Data System*,<br />
2000 U.S. Census, California<br />
Office of Statewide <strong>Health</strong><br />
Planning and Development*,<br />
U.S. Dept of <strong>Health</strong> and Human<br />
Services <strong>Health</strong> Resources*<br />
*1/1/01 to 6/30/04<br />
U.S.D.A <strong>Rural</strong>-<br />
<strong>Urban</strong> Commuting<br />
Area Codes; 10<br />
levels collapsed to<br />
rural (codes 9, 10)<br />
or urban (codes 1-8)<br />
Socioeconomic status (income,<br />
proportion with income<br />
<strong>Rural</strong> <strong>vs</strong>. <strong>Urban</strong> <strong>Ambulatory</strong> <strong>Health</strong> <strong>Care</strong>: A Systematic <strong>Review</strong><br />
Evidence-based Synthesis Program<br />
Author,<br />
Year, Study<br />
Design<br />
Weingarten,<br />
2006 51<br />
Cohort<br />
Study Population (Sample<br />
Size, Inclusion/Exclusion,<br />
Region/Nationwide)<br />
Inclusion: fee-for-service<br />
Medicare beneficiaries with<br />
diabetes, ages 18-75, enrolled<br />
for prior 12 months with ≥23<br />
months of continuous Part<br />
B coverage, ≥ 1 inpatient or<br />
emergency visit or 2 outpatient<br />
visits ≥7 days apart<br />
Exclusion: gestational diabetes,<br />
died during measurement<br />
period<br />
Nationwide<br />
Data Source, Year(s) (if<br />
applicable)<br />
Response Rate (if applicable)<br />
CMS National Diabetes Database<br />
(Part of Medicare <strong>Health</strong><br />
<strong>Care</strong> Quality Improvement Program)<br />
1999-2001<br />
Participants identified from<br />
Part A and Part B claims data<br />
Definition of<br />
<strong>Urban</strong>/<strong>Rural</strong><br />
County codes from<br />
the Federal Information<br />
Processing<br />
Standards; based<br />
on urban-rural continuum<br />
codes – 9<br />
codes collapsed to<br />
3: <strong>Urban</strong>, Semi-rural<br />
(adjacent to metropolitan<br />
area), <strong>Rural</strong><br />
(not adjacent)<br />
Covariates<br />
Race (white/non-white),<br />
ethnicity (Hispanic/non-<br />
Hispanic), states (Census<br />
divisions)<br />
Confidence<br />
Score*<br />
*See Methods section for explanation<br />
**U=<strong>Urban</strong>; R=<strong>Rural</strong>; SR=Semi-rural; (+)=difference statistically significant; (-)=difference not statistically significant; (NR)=significance not reported<br />
Low<br />
Results**<br />
Indicator rate*<br />
A. in 10 top performing states<br />
(many in northern and eastern<br />
regions of US): 1 of 10 SRU; 2 of 10 RU<br />
B. in 10 lowest performing<br />
states (many in south): 9 of 10<br />
SRU; 7 of 10<br />
RU<br />
*Indicator rate = Annual HbA1c<br />
measurement; Biennial lipid<br />
profile; Biennial eye exam<br />
75
<strong>Rural</strong> <strong>vs</strong>. <strong>Urban</strong> <strong>Ambulatory</strong> <strong>Health</strong> <strong>Care</strong>: A Systematic <strong>Review</strong><br />
Evidence-based Synthesis Program<br />
Appendix C, Table 5. Cardiovascular Disease<br />
Author,<br />
Year, Study<br />
Design<br />
Colleran,<br />
2007 55<br />
Crosssectional<br />
Study Population (Sample<br />
Size, Inclusion/Exclusion,<br />
Region/Nationwide)<br />
N = 200<br />
Inclusion: 50 + years old, seen<br />
more than once at the study<br />
sites (1 urban academic medical<br />
center, 1 rural community<br />
clinic) in the previous year<br />
New Mexico<br />
Data Source, Year(s) (if<br />
applicable)<br />
Response Rate (if applicable)<br />
Medical record review; randomly<br />
selected charts to include 50<br />
patients with cardiovascular<br />
disease (CVD) (25 Hispanic,<br />
25 non-Hispanic white) and 50<br />
without CVD from each site<br />
Definition of<br />
<strong>Urban</strong>/<strong>Rural</strong><br />
Not defined other<br />
than “urban academic<br />
medical center”,<br />
“rural community<br />
clinic”<br />
Covariates<br />
Age, gender, hypertension,<br />
diabetes, dyslipidemia, smoking<br />
status<br />
Confidence<br />
Score*<br />
Low<br />
Results**<br />
Standard medications for<br />
treatment of CVD (+); U>R #<br />
Cholesterol lowering medications<br />
(+); U>R #<br />
Attainment of blood pressure<br />
goal (+); U>R #<br />
Attainment of LDL goal (-) #<br />
#<br />
Unadjusted analysis<br />
Dellasega,<br />
1999 56<br />
Case Reports<br />
Hicks, 2010 53<br />
Crosssectional<br />
King, 2006 54<br />
Crosssectional<br />
N = 32<br />
Inclusion: Patients from tertiary<br />
care center serving 31 counties,<br />
65+ years old, primary<br />
diagnosis a medical or surgical<br />
cardiac condition, cognitively<br />
intact, being discharged to<br />
home<br />
Pennsylvania<br />
N = 778 surveys<br />
Inclusion: Provider completed<br />
survey after patient encounter,<br />
non-pregnant adult with type 2<br />
diabetes<br />
26 practices in Colorado (13<br />
urban; 13 rural)<br />
N = 300<br />
Inclusion: outpatient, diagnosed<br />
hypertension (100 from<br />
an urban, a suburban, and a<br />
rural clinic)<br />
South Carolina<br />
Patient medical records; phone<br />
survey post-discharge to 20<br />
weeks<br />
Survey Response: 32/50 completed<br />
all five surveys (60%)<br />
Provider questionnaire, June<br />
2003-May 2004<br />
Response: not stated<br />
Medical record review; consecutive<br />
sample<br />
Pennsylvania Dept<br />
of Aging <strong>Rural</strong><br />
Services Task Force<br />
seven designations:<br />
Philadelphia, Allegheny,<br />
urban, suburban,<br />
semi-urban,<br />
semi-rural, and rural<br />
(based on population<br />
density and<br />
proximity to major<br />
metropolitan area)<br />
<strong>Rural</strong>: community of<br />
fewer than 25,000<br />
residents at least 32<br />
km (20 mi) from a<br />
major metropolitan<br />
center<br />
Not defined other<br />
than “urban university<br />
family practice<br />
center”, “suburban<br />
residency practice”,<br />
“rural private practice”<br />
clinics<br />
Age, gender, marital status,<br />
education, number of hospitalizations,<br />
severity of illness<br />
Age, gender, race, ethnicity,<br />
BP (near goal or uncontrolled),<br />
practice level, communication<br />
problems, income<br />
level, number of prescription<br />
medications<br />
Age, race, gender, number of<br />
medications, number of visits<br />
in past 12 months, comorbidities<br />
Very Low<br />
Moderate<br />
Number of medications at discharge<br />
and during follow-up<br />
(+); U>R with more fluctuations<br />
in medications in urban<br />
patients<br />
Number of cardiac medications<br />
at discharge and during<br />
follow-up (+); U>R<br />
General <strong>Health</strong> SF-36 scale<br />
(NR); R improved over time,<br />
U decreased over time<br />
Provider taking action if BP<br />
was poorly controlled (-)<br />
Number of medications (+);<br />
R>U<br />
Very Low Blood pressure control (+);<br />
R>U<br />
76
<strong>Rural</strong> <strong>vs</strong>. <strong>Urban</strong> <strong>Ambulatory</strong> <strong>Health</strong> <strong>Care</strong>: A Systematic <strong>Review</strong><br />
Evidence-based Synthesis Program<br />
Author,<br />
Year, Study<br />
Design<br />
Morden,<br />
2010 49<br />
Crosssectional<br />
Study Population (Sample<br />
Size, Inclusion/Exclusion,<br />
Region/Nationwide)<br />
N = 23,780<br />
Inclusion: Veterans with hypertension<br />
(approximately 1/3 with<br />
mental disorder [MD])<br />
Nationwide<br />
Data Source, Year(s) (if<br />
applicable)<br />
Response Rate (if applicable)<br />
2005 national Veterans <strong>Health</strong><br />
Administration cardiometabolic<br />
quality of care random sample<br />
chart review<br />
SMITREC: VA Serious<br />
Mental Illness Treatment and<br />
Evaluation Center<br />
Definition of<br />
<strong>Urban</strong>/<strong>Rural</strong><br />
RUCA categories<br />
RUCA 1: urban<br />
RUCA 2: large rural<br />
city/town<br />
RUCA 3: small/isolated<br />
rural town<br />
Covariates<br />
Mental disorder diagnosis,<br />
RUCA (1-3), age, gender,<br />
race (black/non-black), marital<br />
status, substance abuse diagnosis,<br />
Charlson comorbidity<br />
index score, # VA outpatient<br />
visits, # visits to a VA community-based<br />
outpatient clinic, VA<br />
cost share category<br />
*See Methods section for explanation<br />
**U=<strong>Urban</strong>; R=<strong>Rural</strong>; (+)=difference statistically significant; (-)=difference not statistically significant; (NR)=significance not reported<br />
Confidence<br />
Score*<br />
Moderate/<br />
High<br />
Results**<br />
Blood pressure control (-)<br />
77
<strong>Rural</strong> <strong>vs</strong>. <strong>Urban</strong> <strong>Ambulatory</strong> <strong>Health</strong> <strong>Care</strong>: A Systematic <strong>Review</strong><br />
Evidence-based Synthesis Program<br />
Appendix C, Table 6. HIV/AIDS<br />
Author,<br />
Year, Study<br />
Design<br />
Cohn, 2001 58<br />
Cohort<br />
Napravnik,<br />
2006 59<br />
Crosssectional<br />
Schur, 2002 60<br />
Cohort<br />
Whyte, 1992 57<br />
Cohort<br />
Study Population (Sample<br />
Size, Inclusion/Exclusion,<br />
Region/Nationwide)<br />
N = 3,173 (367 rural)<br />
Inclusion: HIV-infected adults<br />
who received care from January<br />
through June, 1996<br />
Contiguous United States<br />
N = 1,404<br />
Inclusion: 18+ years, attended<br />
≥ 1 clinic appointment at a<br />
Univ. of North Carolina HIV<br />
clinic between 1/1/2000 and<br />
12/31/2002<br />
Southeastern United States<br />
(predominantly North Carolina)<br />
N = 275 rural patients<br />
Inclusions: HIV infected adults,<br />
receiving care from sampled<br />
providers (≥ 1 visit in early<br />
1996)<br />
Exclusions: patients seen by<br />
military, prison, or emergency<br />
department providers<br />
Contiguous United States<br />
N = 308 AIDs cases<br />
Inclusion: female residents of<br />
Georgia aged 13 and older at<br />
time of diagnosis whose cases<br />
were reported by 12/31/90<br />
Georgia<br />
Data Source, Year(s) (if<br />
applicable)<br />
Response Rate (if applicable)<br />
HIV Cost and Services Utilization<br />
Study (HCSUS) 1996;<br />
rural component<br />
Patient medical records from<br />
the University of North Carolina<br />
HIV outpatient clinic<br />
HIV Cost and Services Utilization<br />
Study (HCSUS) 1996<br />
American Medical Association<br />
MasterFile of physicians<br />
Centers for Disease Control<br />
and Prevention (1983-1990)<br />
Office of Vital Statistics (Georgia),<br />
March 1991<br />
Definition of<br />
<strong>Urban</strong>/<strong>Rural</strong><br />
<strong>Urban</strong>: MSA or New<br />
England county<br />
metropolitan areas<br />
<strong>Rural</strong>: non-MSA<br />
Office of Budget<br />
and Management,<br />
1992<br />
<strong>Rural</strong>: MSA with <<br />
50,000 inhabitants<br />
<strong>Urban</strong>: MSA<br />
<strong>Rural</strong>: non-MSA<br />
Office of Budget<br />
and Management,<br />
1992<br />
Metro Atl: residents<br />
of 8 counties of metropolitan<br />
Atlanta<br />
Other Areas: residents<br />
of remaining<br />
counties<br />
Covariates<br />
Age, gender, race, ethnicity,<br />
risk group behavior, education,<br />
insurance, household<br />
income, region of care, CD4<br />
count, HIV provider type<br />
Age, gender, race/ethnicity,<br />
insurance status, distance to<br />
clinic, clinical AIDS diagnosis,<br />
CD4 cell count, time<br />
since entry into HIV care<br />
Age, gender, race/ethnicity,<br />
risk group, clinical stage,<br />
annual income, insurance<br />
status, CD4 count<br />
Race, mean age, mode of<br />
infection<br />
*See Methods section for explanation<br />
**U=<strong>Urban</strong>; R=<strong>Rural</strong>; (+)=difference statistically significant; (-)=difference not statistically significant; (NR)=significance not reported<br />
#<br />
Unadjusted results<br />
Confidence<br />
Score*<br />
Moderate/<br />
High<br />
Moderate<br />
Moderate<br />
Results**<br />
Appointments with providers<br />
caring for more HIV-infected<br />
patients (+); urban care > rural<br />
care #<br />
Use of pneumocystis carinii<br />
pneumonia medication (+);<br />
urban care > rural care #<br />
Use of highly-active antiretroviral<br />
therapy (HAART) (+); urban<br />
care > rural care<br />
Average number of clinic visits<br />
per year (-) #<br />
73.6% of rural residents<br />
received HIV care in urban<br />
setting #<br />
Older patients more likely to<br />
receive care in rural area (+) #<br />
Very Low Median survival time (+);<br />
Metro>Other #<br />
Probability of surviving 90<br />
days (+); Metro>Other #<br />
78
<strong>Rural</strong> <strong>vs</strong>. <strong>Urban</strong> <strong>Ambulatory</strong> <strong>Health</strong> <strong>Care</strong>: A Systematic <strong>Review</strong><br />
Evidence-based Synthesis Program<br />
Appendix C, Table 7. Neurologic Conditions<br />
Author,<br />
Year, Study<br />
Design<br />
Buchanan,<br />
2006b 62<br />
Cohort<br />
Buchanan,<br />
2006a 61<br />
Cohort<br />
Buchanan,<br />
2006c 63<br />
Cohort<br />
Wilson,<br />
2009 66<br />
Crosssectional<br />
Study Population (Sample<br />
Size, Inclusion/Exclusion,<br />
Region/Nationwide)<br />
N = 1,518<br />
Inclusion: Member of the National<br />
Multiple Sclerosis (MS)<br />
Society<br />
Exclusion: none<br />
Nationwide<br />
N = 1,518<br />
Inclusion: Member of the<br />
National Multiple Sclerosis<br />
Society<br />
Exclusion: none<br />
Nationwide<br />
N = 1,518<br />
Inclusion: Member of the<br />
National Multiple Sclerosis<br />
Society<br />
Exclusion: none<br />
Nationwide<br />
N = 1,427 counties or county<br />
sets (contiguous, single state<br />
sets of counties merged to<br />
achieve population >50,000)<br />
Inclusion: all US counties or<br />
county sets except Alaska,<br />
Hawaii, and 12 cities with<br />
changes in county definitions<br />
between 1980 and 2000<br />
Data Source, Year(s) (if<br />
applicable)<br />
Response Rate (if applicable)<br />
Phone interview, Oct 2004 –<br />
Jan 2005<br />
Response: 31%<br />
Phone interview, Oct 2004 –<br />
Jan 2005<br />
Response: 31%<br />
Phone interview, Oct 2004 –<br />
Jan 2005<br />
Response: 31%<br />
Numbers of rehabilitation<br />
therapists (physical [PT] or<br />
occupational [OT] therapists,<br />
speech-language pathologists<br />
[SLP]) from 1980 and 1990<br />
ARF and 2000 EEO<br />
<strong>Health</strong> Professional Shortage<br />
Area Data<br />
Definition of<br />
<strong>Urban</strong>/<strong>Rural</strong><br />
<strong>Urban</strong>: Metropolitan<br />
Statistical Area<br />
(MSA)<br />
Adjacent <strong>Rural</strong> Area:<br />
50 miles from<br />
MSA<br />
<strong>Urban</strong>: Metropolitan<br />
Statistical Area<br />
(MSA)<br />
Adjacent <strong>Rural</strong> Area:<br />
50 miles from<br />
MSA<br />
<strong>Urban</strong>: Metropolitan<br />
Statistical Area<br />
(MSA)<br />
Adjacent <strong>Rural</strong> Area:<br />
50 miles from<br />
MSA<br />
US Office of Management<br />
and Budget<br />
(OMB) – metropolitan<br />
(metro):<br />
central county with<br />
≥1 urbanized area<br />
and outlying counties<br />
economically<br />
tied to core county<br />
Covariates<br />
Confidence<br />
Score*<br />
Results**<br />
None Very Low Saw neurologist in past year<br />
(+); U>MRR #<br />
None<br />
Low/<br />
Very Low<br />
Wanted to see neurologist but<br />
did not (+); MRR>U, AR>U #<br />
Majority of MS care from<br />
primary care physician (+);<br />
MRR>U #<br />
Taking disease-modifying<br />
medications (+); U>MRR #<br />
Discontinued disease-modifying<br />
medications because of<br />
other medical side effects(+);<br />
AR>U #<br />
Discontinued disease-modifying<br />
medications because<br />
of out-of-pocket expense (+);<br />
AR>U #<br />
None Very Low Need for mental health care<br />
in past 12 months (+); ARU #<br />
No providers in area or too far<br />
to visit (+); AR>U #<br />
PTs, OTs, or SLPs per 100,000<br />
residents (NR); U>R #<br />
PTs, OTs, or SLPs per 100,000<br />
residents (NR); Non-shortage<br />
area > partial or total shortage<br />
area #<br />
Nationwide<br />
79
<strong>Rural</strong> <strong>vs</strong>. <strong>Urban</strong> <strong>Ambulatory</strong> <strong>Health</strong> <strong>Care</strong>: A Systematic <strong>Review</strong><br />
Evidence-based Synthesis Program<br />
Author,<br />
Year, Study<br />
Design<br />
Johnstone,<br />
2002 65<br />
Crosssectional<br />
Schootman<br />
and Fuortes,<br />
1999 64<br />
Crosssectional<br />
Study Population (Sample<br />
Size, Inclusion/Exclusion,<br />
Region/Nationwide)<br />
Data on numbers of providers<br />
of services to people with<br />
traumatic brain injury<br />
Missouri<br />
N = 292 patients age 18+<br />
years with TBI sustained July-<br />
Dec 1996<br />
Iowa<br />
Data Source, Year(s) (if<br />
applicable)<br />
Response Rate (if applicable)<br />
U.S. Census Bureau, 2000;<br />
Office of Social and Economic<br />
Data Analysis, 2000; <strong>Rural</strong><br />
Policy Research Institute,<br />
2000; Missouri State Board of<br />
Registration for the Healing<br />
Arts, 1999; American Board<br />
of Professional Psychology;<br />
Missouri Brain Injury Association,<br />
2000<br />
Survey sent to persons identified<br />
through the Iowa Central<br />
Registry for Brain and Spinal<br />
Cord Injuries, January, 1998<br />
Response: 57.4% (292 is subset<br />
– those 18 years and older)<br />
Definition of<br />
<strong>Urban</strong>/<strong>Rural</strong><br />
Office of Management<br />
and Budget<br />
(OMB) designations<br />
of Metropolitan and<br />
Non-metropolitan<br />
(MSA or non-MSA)<br />
Population density<br />
(residents/square<br />
mile) – 5 levels<br />
R #<br />
Physiatrists (NR); U>R #<br />
Nurses (NR); U=R #<br />
Rehabilitation Therapists (NR)<br />
U>R #<br />
Mental <strong>Health</strong> (NR); U>R #<br />
Low Functional dependence (+);<br />
most urban > non-urban<br />
Perceived need for services (-)<br />
*See Methods section for explanation<br />
**U=<strong>Urban</strong>; R=<strong>Rural</strong>; MRR=More Remote <strong>Rural</strong>; AR=Adjacent <strong>Rural</strong>; (+)=difference statistically significant; (-)=difference not statistically significant; (NR)=significance not reported<br />
#<br />
Unadjusted analysis<br />
80
<strong>Rural</strong> <strong>vs</strong>. <strong>Urban</strong> <strong>Ambulatory</strong> <strong>Health</strong> <strong>Care</strong>: A Systematic <strong>Review</strong><br />
Evidence-based Synthesis Program<br />
Appendix C, Table 8. Mental <strong>Health</strong><br />
Author,<br />
Year, Study<br />
Design<br />
Severe Mental <strong>Health</strong><br />
Farrell, 1996 72 N = 4,930<br />
Crosssectional<br />
Study Population (Sample<br />
Size, Inclusion/Exclusion,<br />
Region/Nationwide)<br />
Inclusion: adults discharged<br />
from 8 public psychiatric<br />
hospitals to 1 of 40 community<br />
mental health centers (CMHC,<br />
23 rural, 17 urban) in 1992<br />
Virginia<br />
Data Source, Year(s) (if<br />
applicable)<br />
Response Rate (if applicable)<br />
Questionnaire (completed by<br />
CMHC staff), 1992<br />
Inpatient Database<br />
Questionnaire completion rate:<br />
97% (94% linked to database)<br />
Definition of<br />
<strong>Urban</strong>/<strong>Rural</strong><br />
State mental health<br />
authority definition -<br />
rural is U<br />
as indicated by a. CMHC had<br />
record of discharge, b. CMHC<br />
contacted patient during hospitalization,<br />
c. patient and CMHC<br />
had contact after discharge, d.<br />
CMHC provided face-to-face<br />
services, and e. composite<br />
score #<br />
#<br />
Unadjusted analysis<br />
Fischer,<br />
2008 73<br />
Cohort<br />
Mohamed,<br />
2009 75<br />
Cohort<br />
N = 258 (121 or 47% rural;<br />
included veterans)<br />
Inclusion: ages 18-67, schizophrenia,<br />
mental health service<br />
utilization records available for<br />
at least 18 months<br />
Arkansas<br />
N = 5,221 veterans (4,373<br />
urban)<br />
Inclusion: participant in mental<br />
health intensive case management<br />
(MHICM) program<br />
Nationwide<br />
Interviews with patients (consumers)<br />
and family, friends,<br />
or providers who knew patient<br />
well (informants) 1992-99<br />
Clinical process assessments<br />
by MHICM staff after veteran’s<br />
1 st 6 months in MHICM program,<br />
FY2000-FY2005<br />
VA Outpatient Encounter File<br />
Office of Management<br />
and Budget –<br />
<strong>Urban</strong>: Metropolitan<br />
Statistical Area<br />
(MSA)<br />
<strong>Rural</strong>: non-MSA<br />
<strong>Rural</strong>-<strong>Urban</strong> Commuting<br />
Codes –<br />
4-groups: urban (U),<br />
large rural city (LR),<br />
small rural town<br />
(SR), or isolated<br />
rural (R) community<br />
Insight into illness, cognitive<br />
functioning, age, gender,<br />
ethnicity<br />
Moderate<br />
Irregular <strong>vs</strong>. regular outpatient<br />
mental health service use (+);<br />
R>U<br />
Comorbid substance abuse<br />
effect on mental health service<br />
use (+); less effect on patients<br />
with family support at least<br />
weekly<br />
None Moderate Patient contact (+); RU<br />
d. suicide attempt (-)<br />
e. manic episode (+); R>U<br />
f. depressive symptoms (-)
<strong>Rural</strong> <strong>vs</strong>. <strong>Urban</strong> <strong>Ambulatory</strong> <strong>Health</strong> <strong>Care</strong>: A Systematic <strong>Review</strong><br />
Evidence-based Synthesis Program<br />
Author,<br />
Year, Study<br />
Design<br />
Study Population (Sample<br />
Size, Inclusion/Exclusion,<br />
Region/Nationwide)<br />
Hospitalization<br />
Fortney N = 811 counties<br />
2007 70<br />
Crosssectional<br />
Fortney<br />
2009 71<br />
Crosssectional<br />
Depression<br />
Fortney,<br />
1999 74<br />
Cohort<br />
Rost, 2007 78<br />
Crosssectional<br />
(combining<br />
data from 2<br />
studies)<br />
Inclusion: 551, 529 depression<br />
related hospitalizations, age<br />
20+<br />
14 states nationwide<br />
N = 811 counties<br />
Inclusion: 1443,107 schizophrenia<br />
related hospitalizations,<br />
age 20+<br />
14 states nationwide<br />
N = 106 of original 470 with<br />
depression visit in 6 months<br />
after baseline interview, complete<br />
data set, and provider in<br />
Arkansas (see Rost 1999)<br />
Arkansas<br />
N = 1,455 (304 rural)<br />
Inclusion: primary care<br />
patients with depression<br />
(excluded schizophrenia and<br />
bipolar disorder)<br />
11 states<br />
Data Source, Year(s) (if<br />
applicable)<br />
Response Rate (if applicable)<br />
Statewide Inpatient Database<br />
(SID), 2000<br />
Census Bureau<br />
Dept. of Agriculture<br />
<strong>Health</strong> Resources and Services<br />
Administration<br />
Statewide Inpatient Database<br />
(SID), 2000<br />
Census Bureau<br />
Dept. of Agriculture<br />
<strong>Health</strong> Resources and Services<br />
Administration<br />
See Rost 1999<br />
Records from providers, insurers,<br />
and pharmacies identified<br />
Geocoded addresses for travel<br />
time<br />
2 studies in Quality Improvement<br />
for Depression database<br />
(through 1999):<br />
1) Partners in <strong>Care</strong> (PIC), 46<br />
practices (3 rural), 5 states<br />
(35% agreed to participate;<br />
follow-up 89% at 2 yr)<br />
2) Quality Enhancement by<br />
Strategic Teaming (QuEST),<br />
12 practices (4 rural), 10<br />
states (73% agreed to participate,<br />
follow-up 70% at 2 yr)<br />
Definition of<br />
<strong>Urban</strong>/<strong>Rural</strong><br />
<strong>Urban</strong> Influence<br />
Codes (UIC) – 12<br />
categories<br />
<strong>Urban</strong> Influence<br />
Codes – 12 categories<br />
U.S. Office of<br />
Management and<br />
Budget – MSA/non-<br />
MSA<br />
Used travel time<br />
Practices designated<br />
as urban (MSA)<br />
or rural (non-MSA)<br />
Covariates<br />
Ethnicity, poverty level,<br />
education, income, employment,<br />
housing stress,<br />
county economy source,<br />
number of providers,<br />
number of hospital beds,<br />
penetration rate of HMOs,<br />
shortage area, geographic<br />
location<br />
Ethnicity, poverty level,<br />
education, income, employment,<br />
housing stress,<br />
county economy source,<br />
providers, hospital beds,<br />
penetration rate of HMOs,<br />
shortage area, geographic<br />
location<br />
Age, gender, ethnicity,<br />
employment status, education,<br />
severity of depression,<br />
physical and psychiatric<br />
comorbidities, insurance<br />
coverage, treatment sector<br />
Age, gender, minority status,<br />
education, marital status,<br />
employment, depression,<br />
psychiatric or physical<br />
comorbidity, antidepressant<br />
use, social support, stressful<br />
life events<br />
Confidence<br />
Score*<br />
Low/<br />
Moderate<br />
Low/<br />
Moderate<br />
Low/<br />
Moderate<br />
Low<br />
Results**<br />
Hospitalization rate (+); most<br />
U>all other UIC categories (5<br />
comparisons were significant)<br />
Hospitalization rate (+);most<br />
U>all other UIC categories (8<br />
comparisons were significant)<br />
Number of visits (+); increased<br />
travel time associated with<br />
fewer visits<br />
Guideline concordant treatment<br />
(+); increased travel time<br />
associated with reduced odds of<br />
guideline concordant treatment<br />
Baseline characteristics:<br />
a. use of outpatient care (specialty,<br />
medical) - past 6 mos (-) #<br />
b. antidepressant use -past 6<br />
mos (-) #<br />
c. any hospitalization - past 6<br />
mos (-) #<br />
Hospitalization for physical<br />
problems in 6 months after<br />
baseline (+); R>U whether or<br />
not they received specialty care<br />
during those 6 months<br />
Hospitalization for emotional<br />
problems (+); R>U at 18<br />
months<br />
#<br />
Unadjusted analysis<br />
82
<strong>Rural</strong> <strong>vs</strong>. <strong>Urban</strong> <strong>Ambulatory</strong> <strong>Health</strong> <strong>Care</strong>: A Systematic <strong>Review</strong><br />
Evidence-based Synthesis Program<br />
Author,<br />
Year, Study<br />
Design<br />
Rost, 1999 77<br />
Crosssectional<br />
NOTE:<br />
telephone<br />
interviews<br />
with randomly<br />
selected<br />
adults in<br />
11,078<br />
households;<br />
998 screened<br />
positive for<br />
depression<br />
Rost &<br />
Zhang, 1998 69<br />
Study Population (Sample<br />
Size, Inclusion/Exclusion,<br />
Region/Nationwide)<br />
N = 434 (286 rural) of original<br />
470 with 12 month data<br />
Inclusion: ≥18 yrs; screened<br />
positive for depression (both<br />
telephone and face-to-face<br />
interviews); not bereaved,<br />
manic, or acutely suicidal<br />
Arkansas<br />
Data Source, Year(s) (if<br />
applicable)<br />
Response Rate (if applicable)<br />
Telephone and face-to-face<br />
interviews 1992-93<br />
Response: 74% of eligible after<br />
screening agreed to faceto-face<br />
interview; 92% with<br />
complete data<br />
Definition of<br />
<strong>Urban</strong>/<strong>Rural</strong><br />
Census data 1990,<br />
rural defined as<br />
non-metropolitan<br />
See Rost 1999 See Rost, 1999 Census data 1990,<br />
rural defined as<br />
non-metropolitan<br />
Post Traumatic Stress Disorder (PTSD)<br />
Elhai, 2004 79 N = 100 veterans (52 rural)<br />
Crosssectional<br />
Crosssectional<br />
Inclusion: male, diagnosed<br />
with PTSD at outpatient clinic<br />
Southeastern United States<br />
Medical chart review (date not<br />
reported)<br />
U.S. Census data<br />
1990<br />
Covariates<br />
Age, gender, education,<br />
health insurance, marital<br />
status, minority status,<br />
employment status, income,<br />
living alone, health insurance,<br />
severity of depression,<br />
physical and psychiatric<br />
comorbidity<br />
Confidence<br />
Score*<br />
Moderate<br />
Results**<br />
Any outpatient treatment for<br />
depression (-)<br />
Type of outpatient treatment for<br />
depression (-)<br />
Quality of outpatient depression<br />
treatment (-)<br />
Outpatient specialty care visits<br />
for depression (+); RU<br />
Hospitalization for mental health<br />
problems (-)<br />
See Rost, 1999 Moderate Outpatient services for physical<br />
problems (-)<br />
Outpatient services for mental<br />
health other than depression (-)<br />
Hospitalizations for physical<br />
or mental health problems 1-6<br />
months after baseline (+); R>U<br />
Hospitalizations in months 7-12<br />
(-)<br />
Suicide attempts (+); R>U<br />
Service use adjusted for<br />
distance and driving time<br />
Very Low<br />
Service use (PTSD clinic,<br />
primary care, and specialty care<br />
visits) within 1 year after initial<br />
PTSD evaluation (-)<br />
Dissociative Experiences Scale<br />
score (+); R>U<br />
MMPI-2 clinical scales (-)<br />
83
<strong>Rural</strong> <strong>vs</strong>. <strong>Urban</strong> <strong>Ambulatory</strong> <strong>Health</strong> <strong>Care</strong>: A Systematic <strong>Review</strong><br />
Evidence-based Synthesis Program<br />
Author,<br />
Year, Study<br />
Design<br />
Study Population (Sample<br />
Size, Inclusion/Exclusion,<br />
Region/Nationwide)<br />
Substance Abuse<br />
Booth, 2000 80 N = 733<br />
Cohort Inclusion: current adult drinkers<br />
(18+) who met DSM-IV<br />
criteria for alcohol abuse or<br />
dependence in the past year<br />
or were at risk for meeting<br />
DSM-IV diagnostic criteria in<br />
the following year<br />
Six southern states (AL, AR,<br />
GA, LA, MS, TN)<br />
Fortney et al.,<br />
1995 84<br />
Cohort<br />
Grant, 1996 81<br />
Crosssectional<br />
N = 4,621<br />
Inclusion: adult (18+) male<br />
veterans completing inpatient<br />
alcoholism treatment at VA Alcohol<br />
Dependency Treatment<br />
Program (ADTP)<br />
33 VA inpatient ADTPs<br />
N = 42,862<br />
Inclusion: non-institutionalized<br />
adults (18+)<br />
Nationwide<br />
Data Source, Year(s) (if<br />
applicable)<br />
Response Rate (if applicable)<br />
Telephone interview<br />
Response: 76% (baseline);<br />
90% and 82% of baseline<br />
completed interview at 6 and<br />
12 months, respectively<br />
VA Patient Treatment File,<br />
1987<br />
National Longitudinal Alcohol<br />
Epidemiological Survey, 1992<br />
Response: 97.4% (person);<br />
91.9% (household)<br />
Definition of<br />
<strong>Urban</strong>/<strong>Rural</strong><br />
Census Bureau<br />
definitions of MSA;<br />
rural is non-MSA<br />
Small community<br />
(outside an MSA);<br />
metropolitan area<br />
(MSAs with < 3 million<br />
inhabitants);<br />
large metropolitan<br />
area (MSAs with > 3<br />
million inhabitants)<br />
Not provided<br />
Covariates<br />
Gender, ethnicity, age,<br />
income, health insurance,<br />
average time to provider,<br />
days to see MD for advice<br />
about drinking, acceptability<br />
of treatment, social support,<br />
alcohol abuse (past<br />
6 months), alcohol dependence<br />
(past 6 months),<br />
lifetime drug use, Axis I DIS<br />
diagnosis (past 6 months),<br />
antisocial personality disorder,<br />
social consequences<br />
of drinking, negative life<br />
events, chronic medical<br />
problems, prior treatment<br />
for alcohol problems<br />
Distance to VA medical<br />
center, age, marital status,<br />
illness severity, race<br />
Gender, age, ethnicity,<br />
education, marital status,<br />
family history of alcoholism,<br />
past alcohol disorder and<br />
treatment, health insurance,<br />
employment, income, children<br />
< 14 at home, spouse/<br />
partner with alcoholism,<br />
onset and severity of alcoholism,<br />
daily alcohol intake,<br />
major depression, comorbid<br />
drug use disorder; illicit drug<br />
use in past year<br />
Confidence<br />
Score*<br />
Moderate/<br />
High<br />
Moderate<br />
Moderate<br />
Results**<br />
Twelve month alcoholism treatment<br />
use (-)<br />
Attendance at outpatient appointment<br />
for alcoholism treatment<br />
30 days after discharge<br />
from inpatient ADTP (+); small<br />
community > metropolitan, large<br />
metropolitan < metropolitan<br />
Odds of entering treatment in<br />
the past year for drinking-related<br />
problems (-)<br />
84
<strong>Rural</strong> <strong>vs</strong>. <strong>Urban</strong> <strong>Ambulatory</strong> <strong>Health</strong> <strong>Care</strong>: A Systematic <strong>Review</strong><br />
Evidence-based Synthesis Program<br />
Author,<br />
Year, Study<br />
Design<br />
Metsch &<br />
McCoy,<br />
1999 82<br />
Crosssectional<br />
Study Population (Sample<br />
Size, Inclusion/Exclusion,<br />
Region/Nationwide)<br />
N = 2,222<br />
Inclusion: age 18+, selfreported<br />
drug use ≤30 days<br />
prior to recruitment; no active<br />
drug treatment 30 days prior<br />
to intake<br />
Two sites in Florida: Miami<br />
(urban) and Immokalee (rural)<br />
Data Source, Year(s) (if<br />
applicable)<br />
Response Rate (if applicable)<br />
In-person interview<br />
Response: not reported<br />
Definition of<br />
<strong>Urban</strong>/<strong>Rural</strong><br />
Not defined<br />
Immokalee characterized<br />
as an<br />
unincorporated area<br />
known for agriculture<br />
and cattle<br />
industries<br />
Covariates<br />
None<br />
Confidence<br />
Score*<br />
Low/<br />
Moderate<br />
Results**<br />
Ever in drug-user treatment (+);<br />
U>R #<br />
Length of prior treatment (+);<br />
U>R #<br />
Treatment in past 24 months<br />
(+); U>R #<br />
Attempted but unable to get<br />
treatment in past 12 months (+);<br />
U>R #<br />
Of those using treatment, use of<br />
outpatient treatment (-) #<br />
#<br />
Unadjusted analysis<br />
Robertson &<br />
Donnermeyer,<br />
1997 83<br />
Correlational<br />
NONE???? For this outcome<br />
Suicide<br />
Fiske, 2005 68<br />
Crosssectional<br />
Gibbons,<br />
2005 67<br />
Crosssectional<br />
N = 3,629 (497 who used an<br />
illegal substance in the past<br />
year)<br />
Inclusion: age 21+, non-institutionalized,<br />
living in residential<br />
type of interest<br />
Nationwide<br />
N = 41 county clusters (counties<br />
of larger population<br />
counties<br />
Ratio of non-tricyclic antidepressants<br />
to tricyclic antidepressants<br />
(NR); larger population<br />
counties>smaller population<br />
counties<br />
85
<strong>Rural</strong> <strong>vs</strong>. <strong>Urban</strong> <strong>Ambulatory</strong> <strong>Health</strong> <strong>Care</strong>: A Systematic <strong>Review</strong><br />
Evidence-based Synthesis Program<br />
Author,<br />
Year, Study<br />
Design<br />
Utilization<br />
Hauenstein,<br />
2006 87<br />
Crosssectional<br />
Petterson,<br />
2009 86<br />
Crosssectional<br />
Petterson,<br />
2003 85<br />
Crosssectional<br />
Study Population (Sample<br />
Size, Inclusion/Exclusion,<br />
Region/Nationwide)<br />
N = 32,319<br />
Inclusion: civilian, non-institutionalized,<br />
18-64 yrs<br />
Nationwide<br />
N = 36,288<br />
Inclusion: civilian, non-institutionalized,<br />
≥18 yrs; non-Hispanic<br />
white, African American,<br />
Mexican American<br />
Nationwide<br />
N = 2,381<br />
Inclusion: ≥ 1 visit of any<br />
mental health treatment during<br />
calendar year, civilian, noninstitutionalized,<br />
18-64 yrs<br />
Nationwide<br />
Data Source, Year(s) (if<br />
applicable)<br />
Response Rate (if applicable)<br />
Medical Expenditure Panel<br />
Survey (MEPS), 1996-2000<br />
data<br />
Response: 73%-78% (varied<br />
by panel)<br />
Medical Expenditure Panel<br />
Survey (MEPS) 1996-2000<br />
data<br />
Response: 73%-78% (varied<br />
by panel)<br />
Medical Expenditure Panel<br />
Survey (MEPS) 1996-98 data<br />
Response: 78%<br />
Definition of<br />
<strong>Urban</strong>/<strong>Rural</strong><br />
<strong>Rural</strong>-<strong>Urban</strong> Continuum<br />
Codes 1994;<br />
collapsed to metropolitan,<br />
non-metropolitan<br />
least rural,<br />
or non-metropolitan<br />
most rural<br />
<strong>Rural</strong>-<strong>Urban</strong> Continuum<br />
Codes 1994;<br />
collapsed to metropolitan,<br />
non-metropolitan<br />
least rural,<br />
or non-metropolitan<br />
most rural<br />
<strong>Rural</strong>-<strong>Urban</strong><br />
Continuum Codes<br />
1993; collapsed to<br />
metropolitan or nonmetropolitan<br />
Covariates<br />
Gender, age, income-toneeds<br />
ratio, schooling,<br />
geographic region, mental<br />
health, physical health,<br />
marital status, number of<br />
children, usual source of<br />
care, insurance type, year<br />
Self-reported mental and<br />
physical health, gender,<br />
age, education, employment<br />
status, marital status,<br />
income-to-needs ratio,<br />
health insurance<br />
Gender, race/ethnicity,<br />
age, education, employment<br />
status, marital status,<br />
income-to-needs ratio,<br />
health insurance, mental<br />
health, physical health<br />
Confidence<br />
Score*<br />
Results**<br />
Moderate Any mental health visit (+);<br />
U>most R and least R>most R<br />
for women<br />
Specialized mental health visit<br />
(+) U>most R for women and<br />
men<br />
Moderate<br />
Moderate<br />
Receipt of any mental health<br />
service:<br />
(+); African American < non-<br />
Hispanic white in any location<br />
(+); Mexican American < non-<br />
Hispanic white, urban and least<br />
rural non-MSA only<br />
Receipt of specialty mental<br />
health service:<br />
(+) African American < non-Hispanic<br />
white in urban and least<br />
rural locations<br />
(+) Mexican American R if reported mental<br />
health was good or fair #<br />
(-) if reported mental health was<br />
poor #<br />
Mental health care use (-); trend<br />
for U>R<br />
Ever hospitalized in calendar<br />
year (-)<br />
Ever saw a medical doctor (-)<br />
Primarily saw a medical doctor<br />
(-)<br />
#<br />
Unadjusted analysis<br />
86
<strong>Rural</strong> <strong>vs</strong>. <strong>Urban</strong> <strong>Ambulatory</strong> <strong>Health</strong> <strong>Care</strong>: A Systematic <strong>Review</strong><br />
Evidence-based Synthesis Program<br />
Author,<br />
Year, Study<br />
Design<br />
Wang, 2005 88<br />
Crosssectional<br />
Study Population (Sample<br />
Size, Inclusion/Exclusion,<br />
Region/Nationwide)<br />
N = 9,282 (interviewed)<br />
Inclusion: ages 18+, English<br />
speaking<br />
Nationwide<br />
Data Source, Year(s) (if<br />
applicable)<br />
Response Rate (if applicable)<br />
National Comorbidity Survey<br />
Replication (NCS-R), 2001-<br />
2003 (face-to-face interviews)<br />
Response: 71%<br />
Definition of<br />
<strong>Urban</strong>/<strong>Rural</strong><br />
U.S. Census Bureau,<br />
2000; large (≥<br />
2 million) and small<br />
central city, large (≥<br />
2 million) and small<br />
suburbs or central<br />
city, adjacent area,<br />
rural area<br />
Covariates<br />
Age, gender, race/ethnicity,<br />
education, marital status,<br />
family income, health insurance<br />
Confidence<br />
Score*<br />
Moderate/<br />
High<br />
Results**<br />
Odds of receiving any mental<br />
health treatment in prior 12<br />
months (+); rural
<strong>Rural</strong> <strong>vs</strong>. <strong>Urban</strong> <strong>Ambulatory</strong> <strong>Health</strong> <strong>Care</strong>: A Systematic <strong>Review</strong><br />
Evidence-based Synthesis Program<br />
Appendix C, Table 9. Use of Medication<br />
Author,<br />
Year, Study<br />
Design<br />
Dellasega,<br />
1999 56<br />
Prospective/<br />
Longitudinal<br />
Characteristics of Study<br />
Population (Sample Size,<br />
Inclusion/Exclusion, Region<br />
of United States)<br />
N = 32<br />
Elderly patients admitted to a<br />
large tertiary care center for<br />
cardiac condition.<br />
Specific inclusion criteria: 1)<br />
65 or older; 2) has medical<br />
or surgical cardiac condition<br />
as primary diagnosis; 3)<br />
cognitively intact; 4) being<br />
discharged from hospital<br />
Data Source and Year(s) of<br />
Sampling (if applicable)<br />
Response rate (if applicable)<br />
Medical records and telephone<br />
interviews<br />
Response rate: 50%<br />
Definition of<br />
<strong>Urban</strong>/<strong>Rural</strong><br />
Seven-level county<br />
designations established<br />
by the<br />
Pennsylvania Department<br />
of Aging<br />
<strong>Rural</strong> Services Task<br />
Force merged into<br />
two categories (i.e.,<br />
rural <strong>vs</strong>. urban)<br />
Covariates<br />
Age, gender, severity of<br />
illness<br />
Confidence<br />
Score*<br />
Results**<br />
Low Number of medications (+);<br />
U>R<br />
Pennsylvania<br />
Fillenbuam,<br />
1993 89<br />
Correlational<br />
Hanlon,<br />
1996 90<br />
Crosssectional<br />
Lago, 1993 91<br />
Crosssectional<br />
N = 3,973<br />
Individuals 65 or older who are<br />
identified as black or white<br />
Piedmont area of North Carolina<br />
N = 4,110<br />
Individuals 65 or older who are<br />
identify as black or white<br />
Piedmont area of North Carolina<br />
N = 18,641<br />
Elderly enrolled in the Pennsylvania<br />
Pharmaceutical<br />
Assistance Contract for the<br />
Elderly (PACE)<br />
Pennsylvania<br />
Duke Established Populations<br />
for Epidemiologic Studies of<br />
the Elderly, 1986-1987<br />
Response rate: 80.3% (black);<br />
87.2% white<br />
Duke Established Populations<br />
for Epidemiologic Studies of<br />
the Elderly, 1986-1987<br />
Response rate: 80.3% (black);<br />
87.2% white<br />
Claims data for PACE beneficiaries,<br />
1984-1988; Medicare<br />
health services records;<br />
County-level demographic<br />
and health services resources<br />
databases<br />
U.S. Census Bureau<br />
Definition<br />
U.S. Census Bureau<br />
Definition<br />
Human Resources<br />
Profile County<br />
Code from 1980<br />
census data in Area<br />
Resource File (ARF;<br />
10 levels depicting<br />
degree of rurality)<br />
Gender, marital status, age,<br />
education, functional status,<br />
medical status, self-rated<br />
health, number of medical<br />
visits in past year, continuity<br />
of care, overnight hospitalization<br />
in past year, insurance<br />
status, income<br />
Age, race, gender, education,<br />
functional status, number of<br />
functional limitations, chronic<br />
disease status, number of<br />
health visits in past year,<br />
hospitalization in past year,<br />
continuity of care, Medicaid<br />
status<br />
Age; gender; race; income;<br />
marital status; physicians,<br />
pharmacies, hospital beds,<br />
and nursing home beds per<br />
1,000 population; outpatient<br />
physician visits; any physician<br />
visits, inpatient days, or any<br />
hospital day in past month<br />
Low/<br />
Moderate<br />
Low/<br />
Moderate<br />
Moderate<br />
Medication use - elderly whites<br />
(+);U>R<br />
Medication use - elderly blacks<br />
(-)<br />
Prescription medication use<br />
(+); U>R<br />
Number of non-prescription<br />
medications (+); U>R<br />
Use of non-prescription medications<br />
(-)<br />
Monthly claims(-); HR, U<br />
88
<strong>Rural</strong> <strong>vs</strong>. <strong>Urban</strong> <strong>Ambulatory</strong> <strong>Health</strong> <strong>Care</strong>: A Systematic <strong>Review</strong><br />
Evidence-based Synthesis Program<br />
Author,<br />
Year, Study<br />
Design<br />
Characteristics of Study<br />
Population (Sample Size,<br />
Inclusion/Exclusion, Region<br />
of United States)<br />
Data Source and Year(s) of<br />
Sampling (if applicable)<br />
Response rate (if applicable)<br />
Definition of<br />
<strong>Urban</strong>/<strong>Rural</strong><br />
Covariates<br />
Confidence<br />
Score*<br />
Results**<br />
Lillard, 1999 92<br />
Crosssectional<br />
Mueller,<br />
2004 93<br />
Crosssectional<br />
Rogowski,<br />
1997 95<br />
Crosssectional<br />
N = 910<br />
Medicare enrollees ages 66<br />
or older<br />
Excluded individuals covered<br />
by HMOs or institutionalized<br />
National<br />
N = 32,465,895<br />
Noninstitutionalized Medicare<br />
beneficiaries 65 or older<br />
National<br />
N = 996<br />
Noninstitutionalized Medicare<br />
enrollees ages 66 or older<br />
National<br />
1990 Elderly <strong>Health</strong> Supplement<br />
to the Panel Study of<br />
Income Dynamics (PSID), a<br />
nationally representative telephone/mail<br />
survey<br />
Response rate: 99% (telephone<br />
survey); 74%(mail<br />
survey)<br />
1997 Medicare Current Beneficiary<br />
Survey; 1996 Medical<br />
Expenditure Panel Survey<br />
Panel Study of Income Dynamics<br />
(PSID), 1990<br />
Response rate: 99% (telephone<br />
survey); 74% (mail<br />
survey)<br />
Area Resource<br />
File (Department of<br />
<strong>Health</strong> and Human<br />
Services)<br />
<strong>Rural</strong>: any place of<br />
residence not in a<br />
Metropolitan Statistical<br />
Area (MSA)<br />
<strong>Rural</strong>: any place of<br />
residence not in a<br />
MSA<br />
Age, gender, race, marital<br />
status, education, income,<br />
current health status, insurance<br />
status<br />
Insurance status<br />
Age, education, gender, race,<br />
marital status, income, insurance<br />
status, health status<br />
Low<br />
Low/’<br />
Moderate<br />
Low<br />
Twelve-month medication use:<br />
(-)<br />
Prescription cost (+); U>R<br />
Total drug expenditures (-)<br />
Prescriptions filled (+);<br />
R>Uninsured U<br />
Prescriptions filled (+): Insured<br />
R>insured U<br />
Percentage of family income<br />
spent on medications (-)<br />
Xu, 2003 94<br />
Crosssectional<br />
N = 3,498<br />
Noninstitutionalized elderly<br />
West Texas<br />
Telephone survey, 2000<br />
Response rate: 71% (phase 1);<br />
89.3% (phase 2); 53.2% (both<br />
phase 1 and 2)<br />
<strong>Urban</strong> (counties in<br />
MSA)<br />
<strong>Rural</strong> (counties outside<br />
MSA or population<br />
< 50,000)<br />
Frontier (counties<br />
with < 7 people/<br />
square mile)<br />
Race, age, gender, employment,<br />
income, insurance,<br />
usual source of care, physical<br />
and mental health-related<br />
quality of life, several health<br />
beliefs<br />
*See Methods section for explanation<br />
**U=<strong>Urban</strong>; R=<strong>Rural</strong>; HR=Highly rural; F=Frontier; (+)=difference statistically significant; (-)=difference not statistically significant<br />
Low<br />
Odds of prescription drug use<br />
(-) R,U; (+) U>F<br />
Usual pharmacy (-) R,U; (+)<br />
U>F<br />
e<br />
89
<strong>Rural</strong> <strong>vs</strong>. <strong>Urban</strong> <strong>Ambulatory</strong> <strong>Health</strong> <strong>Care</strong>: A Systematic <strong>Review</strong><br />
Evidence-based Synthesis Program<br />
Appendix C, Table 10. Medical Procedures and Diagnostic Tests<br />
Author,<br />
Year, Study<br />
Design<br />
Escarce et al.,<br />
1993 97<br />
Crosssectional<br />
Miller et al.,<br />
1995 96<br />
Crosssectional<br />
Characteristics of Study<br />
Population (Sample Size,<br />
Inclusion/Exclusion, Region<br />
of United States)<br />
N = 1,204,022<br />
Inclusion: Medicare enrollees<br />
65+ years<br />
Exclusion: end-stage renal<br />
disease, covered by an HMO<br />
National<br />
N = 31,100,000<br />
Medicare Part B beneficiaries<br />
Excluded those enrolled in<br />
HMOs<br />
National<br />
Data Source and Year(s) of<br />
Sampling (if applicable)<br />
Response rate (if applicable)<br />
<strong>Health</strong> <strong>Care</strong> Finance Administration<br />
(HCFA) Medicare Part B<br />
Annual Data Beneficiary File,<br />
1986<br />
HCFA <strong>Health</strong> Insurance Skeleton<br />
Eligibility Write-off File,<br />
1986<br />
Medicare Part B Annual Data<br />
File, 1990<br />
<strong>Health</strong> Insurance Eligibility<br />
Write-off File, 1990<br />
Definition of<br />
<strong>Urban</strong>/<strong>Rural</strong><br />
<strong>Rural</strong>: living in a<br />
nonmetropolitan<br />
county<br />
<strong>Urban</strong>: living in a<br />
metropolitan county<br />
<strong>Rural</strong> areas are the<br />
non-MSA areas of<br />
states. <strong>Urban</strong> areas<br />
are subdivided<br />
into small MSAs<br />
(less than 250,000<br />
inhabitants), large<br />
MSAs (250,000 to<br />
3 million), and very<br />
large MSAs (3 million<br />
or more).<br />
Covariates<br />
Confidence<br />
Score*<br />
Results**<br />
Age, gender Low <strong>Rural</strong>ity and race interaction<br />
(+); white-black relative risks<br />
for services were higher in<br />
rural areas for 12 of 32 studied<br />
services (including 8 of 14<br />
outpatient services)<br />
Age, race, gender Low Physician utilization (+); R
<strong>Rural</strong> <strong>vs</strong>. <strong>Urban</strong> <strong>Ambulatory</strong> <strong>Health</strong> <strong>Care</strong>: A Systematic <strong>Review</strong><br />
Evidence-based Synthesis Program<br />
Appendix C, Table 11. Medical Appointments with Providers<br />
Author,<br />
Year, Study<br />
Design<br />
Blazer, 1995 98<br />
Crosssectional<br />
Fortney,<br />
2002 105<br />
US Bureau of the<br />
Census: rural is<br />
county with fewer<br />
than 2,500 inhabitants<br />
Also classified<br />
counties as rural or<br />
urban<br />
Comparisons<br />
focused on CBOCs<br />
<strong>vs</strong>. VAMCs<br />
Crosssectional<br />
Glover,<br />
2004 100<br />
Crosssectional<br />
Himes &<br />
Rutrough,<br />
1994 101<br />
Crosssectional<br />
Characteristics of Study<br />
Population (Sample Size,<br />
Inclusion/Exclusion, Region<br />
of United States)<br />
N = 4,162 (4,001 respondents)<br />
Inclusion: ages 65+ years;<br />
resident of 1 of 5 counties<br />
1 urban and 4 rural counties in<br />
North Carolina<br />
N = 355,452<br />
Inclusion: primary care<br />
patients treated at 38 Community-Based<br />
Outpatient Clinics<br />
(CBOCs) or 32 parent VA<br />
Medical Centers (VAMCs)<br />
CBOCs and VAMCs from 16<br />
Veterans Integrated Services<br />
Networks (VISNs)<br />
N = 50,993 (9,778 or 19%<br />
rural)<br />
Inclusion: ages 18-64<br />
Nationwide<br />
N = 11,101<br />
Inclusion: non-institutionalized<br />
persons ages 65 and older<br />
Nationwide<br />
Data Source and Year(s) of<br />
Sampling (if applicable)<br />
Response rate (if applicable)<br />
Duke Established Populations<br />
for Epidemiologic Studies of<br />
the Elderly, 1986-1987<br />
Response rate: 80%<br />
Austin Automatic Center (AAC)<br />
outpatient file, 1995-1998<br />
National <strong>Health</strong> Interview Surveys,<br />
1999-2000<br />
Response: 81% (1999) and<br />
83% (2000)<br />
National <strong>Health</strong> Interview<br />
Survey (Supplement on Aging),<br />
1984<br />
Definition of<br />
<strong>Urban</strong>/<strong>Rural</strong><br />
<strong>Urban</strong>: Metropolitan<br />
Statistical Area<br />
<strong>Rural</strong>: Non-MSA<br />
Four categories:<br />
Metropolitan central<br />
city residents (within<br />
SMSAs); metropolitan<br />
noncentral city<br />
residents; nonmetropolitan<br />
nonfarm<br />
residents (outside<br />
SMSA); nonmetropolitan<br />
farm<br />
residents<br />
Covariates<br />
Race/ethnicity, self-rated<br />
health, the health index, age,<br />
gender, education, marital<br />
status, employment status,<br />
income, Medicare coverage,<br />
Medicaid coverage, private<br />
insurance<br />
Age, gender, marital status,<br />
ethnicity, service-connected,<br />
percent service connected,<br />
VA service use in prior year<br />
Race/ethnicity, gender, age,<br />
region of residence, interview<br />
language, limitations in<br />
activities, self-reported health<br />
status, education, employment,<br />
family size, income,<br />
marital status, insurance<br />
Age, gender, ethnicity, marital<br />
status, education, health<br />
status, limitations in activities<br />
of daily living, living arrangement,<br />
poverty, region of U.S.,<br />
bed disability days<br />
Confidence<br />
Score*<br />
Low/<br />
Moderate<br />
Results**<br />
<strong>Ambulatory</strong> care visits (-)<br />
Moderate Primary care encounters (+);<br />
CBOC>VAMC<br />
Specialty care encounters (+);<br />
CBOC
<strong>Rural</strong> <strong>vs</strong>. <strong>Urban</strong> <strong>Ambulatory</strong> <strong>Health</strong> <strong>Care</strong>: A Systematic <strong>Review</strong><br />
Evidence-based Synthesis Program<br />
Author,<br />
Year, Study<br />
Design<br />
Larson &<br />
Fleishman,<br />
2003 102<br />
Crosssectional<br />
Maciejewski,<br />
2007 104<br />
Crosssectional<br />
McConnel<br />
& Zetzman,<br />
1993 99<br />
Cohort<br />
Characteristics of Study<br />
Population (Sample Size,<br />
Inclusion/Exclusion, Region<br />
of United States)<br />
N = 14,997<br />
Inclusion: persons 18+ in second<br />
round interviews<br />
Exclusion: missing data for<br />
the independent variables, or<br />
died, became institutionalized,<br />
or moved out of the country in<br />
1996<br />
Nationwide<br />
N = 63,478<br />
Inclusion: primary care patients<br />
treated at one of 108<br />
Community-Based Outpatient<br />
Clinics (CBOCs) and/or one of<br />
72 parent VA Medical Centers<br />
(VAMCs)<br />
N = 3,350<br />
Inclusion: individuals 55 and<br />
older<br />
Exclusion: died, moved, could<br />
not be re-interviewed, or had<br />
missing data on relevant<br />
variables<br />
Nationwide<br />
Data Source and Year(s) of<br />
Sampling (if applicable)<br />
Response rate (if applicable)<br />
Medical Expenditure Panel<br />
Survey, 1996<br />
VA FY2000 Outpatient <strong>Care</strong><br />
File; VA FY2000 Patient Treatment<br />
File; VA FY2000 and<br />
FY2001 Decision Support System<br />
Outpatient and Inpatient<br />
National Extracts<br />
National Center for <strong>Health</strong><br />
Statistics’ Longitudinal Study of<br />
Aging, 1984-1986<br />
Area Resource File, 1987<br />
Definition of<br />
<strong>Urban</strong>/<strong>Rural</strong><br />
Nine-category<br />
<strong>Urban</strong> Influence<br />
Codes: Large MSA<br />
with 1million or<br />
more; small MSA<br />
with less than 1 million;<br />
adjacent large<br />
MSA with city of<br />
10K or more; adjacent<br />
large MSA with<br />
city less than 10K;<br />
adjacent small MSA<br />
with city of 10K<br />
or more; adjacent<br />
small MSA with city<br />
less than 10K; not<br />
adjacent with city<br />
of 10K or more; not<br />
adjacent with city<br />
between 2.5-10K;<br />
non-adjacent with<br />
no town more than<br />
2.5K<br />
Compared VAMC<br />
patients, CBOC<br />
patients, and crossover<br />
patients<br />
U.S. Department of<br />
Agriculture (1989)<br />
10-level County<br />
Adjacency Codes to<br />
create three categories:<br />
major urban<br />
(MSA counties),<br />
less urban (non-<br />
MSA counties with<br />
towns larger than<br />
2.5K), and rural<br />
(non-MSA counties<br />
with towns with<br />
fewer than 2.5K)<br />
Covariates<br />
Gender, ethnicity, education,<br />
age, insurance, family<br />
income, self-reported health,<br />
priority condition, limitations<br />
in activities of daily living or<br />
instrumental activities of daily<br />
living, physician availability,<br />
region, has usual source of<br />
care<br />
Age, gender, race, marital<br />
status, eligibility for free care,<br />
service-related disability,<br />
DCG risk score, distance to<br />
usual source of care<br />
Age, gender, ethnicity, living<br />
arrangement, social contact,<br />
education, prior service<br />
use, Medicaid eligibility,<br />
limitations in activities of daily<br />
living, health status, chronic<br />
conditions, and availability<br />
of hospital beds, physicians,<br />
and nursing home beds.<br />
Confidence<br />
Score*<br />
Results**<br />
Moderate Any ambulatory care visit (+);<br />
adjacent large MSA (with city<br />
10k) < MSA with ≥<br />
1million<br />
Any ambulatory care visit (-):<br />
most rural <strong>vs</strong>. most urban<br />
Number of ambulatory care<br />
visits (+); most rural < large<br />
MSA<br />
High Primary care visits (+);<br />
CBOC>VAMC<br />
Specialty care visits (+);<br />
CBOC
<strong>Rural</strong> <strong>vs</strong>. <strong>Urban</strong> <strong>Ambulatory</strong> <strong>Health</strong> <strong>Care</strong>: A Systematic <strong>Review</strong><br />
Evidence-based Synthesis Program<br />
Author,<br />
Year, Study<br />
Design<br />
Mueller,<br />
1998 103<br />
Crosssectional<br />
Saag et al.,<br />
1998 29<br />
Crosssectional<br />
Weeks et al.,<br />
2005 8<br />
Cohort<br />
Characteristics of Study<br />
Population (Sample Size,<br />
Inclusion/Exclusion, Region<br />
of United States)<br />
N = 112,246<br />
Inclusion: respondents under<br />
65<br />
Nationwide<br />
N = 787<br />
Inclusion: home-dwelling<br />
elderly (age > 65 years), ≥ 1 of<br />
the indicator conditions, resident<br />
of state’s 12 most rural<br />
and 10 most urban counties<br />
Iowa<br />
N = 67,985 (1997); 51,899<br />
(1998); 56,833 (1999)<br />
Inclusion: male veterans 65<br />
years or older and enrolled in<br />
Medicare fee-for-service plans<br />
New England<br />
Data Source and Year(s) of<br />
Sampling (if applicable)<br />
Response rate (if applicable)<br />
National <strong>Health</strong> Interview<br />
Survey, 1992<br />
Response rate: 95.7%<br />
Population based phone<br />
survey evaluating six common<br />
chronic indicator conditions<br />
(arthritis, hypertension, cardiac<br />
disease, diabetes mellitus,<br />
peptic ulcer disease, and<br />
chronic obstructive pulmonary<br />
disease)<br />
Response: 57%<br />
VHA’s Patient Treatment File<br />
and Outpatient Clinic File,<br />
1995-1999<br />
Medicare Denominator, 100%<br />
MEDPAR, Outpatient, and<br />
Physician Supply files, 1997-<br />
1999<br />
Definition of<br />
<strong>Urban</strong>/<strong>Rural</strong><br />
<strong>Urban</strong>: central or<br />
noncentral cities located<br />
within a MSA<br />
<strong>Rural</strong>: outside a<br />
MSA, either on a<br />
farm or not<br />
U.S. Department of<br />
Agriculture continuum<br />
codes.<br />
<strong>Urban</strong>: metro areas<br />
with > 250,000<br />
residents<br />
<strong>Rural</strong>:
<strong>Rural</strong> <strong>vs</strong>. <strong>Urban</strong> <strong>Ambulatory</strong> <strong>Health</strong> <strong>Care</strong>: A Systematic <strong>Review</strong><br />
Evidence-based Synthesis Program<br />
Appendix C, Table 12. Usual Source of <strong>Care</strong><br />
Author,<br />
Year, Study<br />
Design<br />
Meza, 2006 106<br />
Blazer, 1995 98<br />
Crosssectional<br />
Crosssectional<br />
Study Population (Sample<br />
Size, Inclusion/Exclusion,<br />
Region/Nationwide)<br />
N = 3,871<br />
Inclusion: Department of<br />
Defense beneficiaries, active<br />
duty, uniformed services<br />
Nationwide<br />
N = 4,162 (2,152 or 47% rural);<br />
4001 with complete data<br />
Inclusion: >65 yrs, resident of<br />
1 urban or 4 rural counties<br />
North Carolina<br />
Data Source, Year(s) (if<br />
applicable)<br />
Response Rate (if applicable)<br />
<strong>Health</strong> <strong>Care</strong> Survey of DoD<br />
Beneficiearies (HCSDB) –<br />
mailed survey 2002<br />
Response: 29%<br />
Stratified (race & residence)<br />
random sample-Duke Established<br />
Populations for Epidemiologic<br />
Study of the Elderly<br />
survey, 1986-87<br />
Response: 80%<br />
Definition of <strong>Urban</strong>/<br />
<strong>Rural</strong><br />
US Census Bureau<br />
– metropolitan<br />
(metro), adjacent to<br />
metropolitan (adj),<br />
or nonadjacent (non<br />
adj)<br />
US Bureau of the<br />
Census<br />
<strong>Rural</strong>: fewer than<br />
2,500 inhabitants<br />
Also classified<br />
counties as rural or<br />
urban<br />
Covariates<br />
Age, service category, marital<br />
status, self-reported health<br />
status, race, rank, gender,<br />
utilization, years in health<br />
plan, health plan, indicator of<br />
other health plan<br />
Race/ethnicity, self-rated<br />
health, health index, age,<br />
gender, education, marital<br />
status, employment, income,<br />
Medicare and Medicaid coverage,<br />
private insurance<br />
Confidence<br />
Score*<br />
Low<br />
Low/<br />
Moderate<br />
Results**<br />
Rating of health plan, rating<br />
of health care, getting care<br />
quickly (+); Adj or non-adj><br />
Metro<br />
Getting needed care (+);<br />
Metro>Adj or non-adj<br />
Usual source of care (-)<br />
Usually sees same provider(+);<br />
R>U<br />
Put off care due to not knowing<br />
where to go (-)<br />
Put off care due to transportation<br />
difficulties (-)<br />
Borders,<br />
2004 107<br />
Crosssectional<br />
Glover,<br />
2004 100<br />
Crosssectional<br />
N = 2,097<br />
Inclusion: community dwelling,<br />
age ≥65, Hispanic or non-<br />
Hispanic white<br />
West Texas<br />
N = 50,993 (9,778 or 19%<br />
rural)<br />
Inclusion: ages 18-64<br />
Nationwide<br />
Telephone survey<br />
Response: 53%<br />
National <strong>Health</strong> Interview Surveys,<br />
1999-2000<br />
Response: 81% (1999) and<br />
83% (2000)<br />
<strong>Rural</strong>: county with<br />
fewer than 50,000<br />
persons<br />
Frontier: county with<br />
fewer than 50,000<br />
persons and fewer<br />
than 7 persons/mi 2<br />
<strong>Rural</strong>: any place of<br />
residence not in a<br />
Metropolitan Statistical<br />
Area<br />
Age, gender, ethnicity, marital<br />
status, education, economic<br />
factors, insurance, chronic<br />
conditions<br />
Race/ethnicity, gender, age,<br />
interview language, region<br />
of residence, limitation of<br />
activities, self-reported health<br />
status, education, employment,<br />
family size, income,<br />
marital status, insurance<br />
Low/<br />
Moderate<br />
Low/<br />
Moderate<br />
Put off care due to cost (+);<br />
R>U<br />
Always/usually see personal<br />
doctor/nurse (-)<br />
Always/usually able to obtain<br />
care without a long wait (-)<br />
Usual source of care (-) (in<br />
rural and urban areas Hispanic<br />
adults less likely than white<br />
adults to have usual source of<br />
care)<br />
<strong>Health</strong> care use in past 12<br />
months (-)<br />
94
<strong>Rural</strong> <strong>vs</strong>. <strong>Urban</strong> <strong>Ambulatory</strong> <strong>Health</strong> <strong>Care</strong>: A Systematic <strong>Review</strong><br />
Evidence-based Synthesis Program<br />
Author,<br />
Year, Study<br />
Design<br />
Koopman,<br />
2006 48<br />
Crosssectional<br />
Larson,<br />
2003 102<br />
Crosssectional<br />
Rohrer,<br />
2004 18<br />
Crosssectional<br />
Study Population (Sample<br />
Size, Inclusion/Exclusion,<br />
Region/Nationwide)<br />
N = 947<br />
Inclusion: US civilian, ≥20<br />
years, non-institutionalized,<br />
participated in NHANES III:<br />
household adult, examination,<br />
and laboratory data files<br />
Exclusion: did not participate<br />
in all three parts of the survey<br />
Nationwide<br />
N = 15,518 for geographic<br />
variation<br />
N = 14,997 for regression<br />
Inclusion: non-institutionalized,<br />
civilian, age 18 and older<br />
Nationwide<br />
N = 3,689 (1,983 or 54% rural)<br />
N,=,3,680 for usual source of<br />
care outcome<br />
Inclusion: ages 65 and older<br />
West Texas<br />
Data Source, Year(s) (if<br />
applicable)<br />
Response Rate (if applicable)<br />
Third National <strong>Health</strong> and<br />
Nutrition Examination Survey<br />
(NHANES III) 1988-1994<br />
Medical Expenditures Panel<br />
Survey (MEPS), 1996<br />
Area Resource File (ARF) with<br />
<strong>Urban</strong> Influence Codes (UIC)<br />
Texas Tech 5000 telephone<br />
survey, Sept.-Dec. 2000<br />
Response: 57%<br />
Definition of <strong>Urban</strong>/<br />
<strong>Rural</strong><br />
<strong>Urban</strong>: MSA<br />
<strong>Rural</strong>: Non-MSA<br />
UICs by county<br />
– large (pop’l >1<br />
million) or small<br />
metropolitan areas;<br />
non-metropolitan<br />
areas distinguished<br />
by adjacency and<br />
pop’l of largest city<br />
(>10,000)<br />
<strong>Rural</strong>: county with<br />
population less than<br />
50,000<br />
*See Methods section for explanation<br />
**U=<strong>Urban</strong>; R=<strong>Rural</strong>; (+)=difference statistically significant; (-)=difference not statistically significant<br />
Covariates<br />
Gender, age, BMI, perceived<br />
health status, income, insurance<br />
status, education, usual<br />
place of care, # times seeing<br />
physician in past year, duration<br />
of diabetes<br />
Gender, ethnicity, education,<br />
age, insurance, family<br />
income, self-reported health,<br />
priority condition, limitations<br />
in activities of daily living or<br />
instrumental activities of daily<br />
living, physician availability,<br />
region, usual source of care<br />
Age, gender, ethnicity,<br />
resides in continuing care,<br />
health limitations, specific<br />
diagnoses, education, income,<br />
marital status, medical<br />
skepticism, religiousness,<br />
insurance status, employment,<br />
home ownership<br />
Confidence<br />
Score*<br />
Moderate<br />
Moderate<br />
Results**<br />
Usual source of care (+); U<br />
Hispanicmost U (adj. to large MSA<br />
with city
<strong>Rural</strong> <strong>vs</strong>. <strong>Urban</strong> <strong>Ambulatory</strong> <strong>Health</strong> <strong>Care</strong>: A Systematic <strong>Review</strong><br />
Evidence-based Synthesis Program<br />
Appendix C, Table 13. Provider Availability and Expertise<br />
Author,<br />
Year, Study<br />
Design<br />
Baldwin,<br />
1999 117<br />
Crosssectional<br />
Study Population (Sample<br />
Size, Inclusion/Exclusion,<br />
Region/Nationwide)<br />
N = 4,003 physicians (619 or<br />
15.5% rural); 382,776 patients<br />
of those physicians<br />
Inclusion: physicians practicing<br />
in either rural or urban areas<br />
(not both); specialties with at<br />
least 10 physicians submitting<br />
claims in rural and urban locations;<br />
Medicare beneficiaries<br />
(65 and older)<br />
Washington<br />
Data Source, Year(s) (if<br />
applicable)<br />
Response Rate (if applicable)<br />
Medicare Part B file (billed<br />
services), 1994<br />
<strong>Health</strong> <strong>Care</strong> Financing Administration<br />
(HCFA) provider<br />
directory<br />
Medicare beneficiary file<br />
Definition of<br />
<strong>Urban</strong>/<strong>Rural</strong><br />
<strong>Rural</strong> <strong>Health</strong> Service<br />
Areas defined<br />
as physician practice<br />
addresses with<br />
ZIP codes closer to<br />
rural hospital than<br />
urban hospital<br />
Covariates<br />
None<br />
Confidence<br />
Score*<br />
Low/<br />
Moderate<br />
Results**<br />
Family physicians most likely<br />
to practice in rural area (25%);<br />
psychiatrists (5%), cardiologists<br />
(6%), gastroenterologist<br />
(8%) least likely #<br />
Family physician age (+); R>U #<br />
Patients/physician (+); R>U #<br />
Outpatient visits/physician (+);<br />
R>U #<br />
Diagnostic scope of practice<br />
similar except: urban general<br />
surgeons >CV disorders;<br />
rural general surgeons >GI<br />
disorders and urban obstetrician-gynecologists<br />
>care for<br />
menopausal symptoms; rural<br />
obstetrician-gynecologists >diagnoses<br />
outside specialty #<br />
Procedure rates (+); R>U for<br />
family practice, internal medicine,<br />
general surgery #<br />
#<br />
Unadjusted analysis<br />
Biola, 2009 111<br />
Crosssectional<br />
N = 4,879 from 150 rural counties<br />
Inclusion: English- or Spanishspeaking,<br />
age ≥18, lived in<br />
community for previous 12<br />
months (1 person selected<br />
from each household reached)<br />
Southeast (AL, AK, GA, LA,<br />
MS, SC, TX, WV)<br />
Telephone survey 2002-2003;<br />
this report focused on question:<br />
How much do you agree<br />
with the statement: ‘I feel there<br />
are enough doctors in my<br />
community?’<br />
Response: 51%<br />
Not reported<br />
NOTE: counties<br />
selected by project<br />
leaders; typically<br />
higher poverty and<br />
unemployment<br />
rates, larger racialethnic<br />
minority proportions,<br />
and higher<br />
infant mortality rates<br />
than other rural<br />
counties in the state<br />
Age, gender, race, education,<br />
children areas with more physicians/pop’l<br />
b. travel time to care more<br />
than 30 min > travel time to<br />
care less than 30 min<br />
96
<strong>Rural</strong> <strong>vs</strong>. <strong>Urban</strong> <strong>Ambulatory</strong> <strong>Health</strong> <strong>Care</strong>: A Systematic <strong>Review</strong><br />
Evidence-based Synthesis Program<br />
Author,<br />
Year, Study<br />
Design<br />
Brown B,<br />
2009 109<br />
Crosssectional<br />
Study Population (Sample<br />
Size, Inclusion/Exclusion,<br />
Region/Nationwide)<br />
N = 264 (132 self-reported<br />
rural)<br />
Primary care physician assistants<br />
(PAs)<br />
Nationwide<br />
Data Source, Year(s) (if<br />
applicable)<br />
Response Rate (if applicable)<br />
Web-based survey, 2008 (10<br />
case-scenarios)<br />
Response: 49% responded;<br />
44% analyzed<br />
Definition of<br />
<strong>Urban</strong>/<strong>Rural</strong><br />
Respondents selfreported<br />
rural or<br />
urban<br />
Covariates<br />
Confidence<br />
Score*<br />
Results**<br />
None Low Mean score on 10 question<br />
case-scenario quiz (+); R>U #<br />
PAs reporting they diagnose<br />
and treat 50-100% of skin<br />
complaints (+); R>U #<br />
Cases referred to specialist<br />
per week (-) #<br />
#<br />
Unadjusted analysis<br />
Everett,<br />
2009 113<br />
Crosssectional<br />
N = 6,803 (887 or 13% nonmetropolitan)<br />
Inclusion: graduated from<br />
high school in Wisconsin in<br />
1957 or one of their siblings;<br />
stated they had usual source<br />
of care in 2004-05; specified a<br />
physician assistant (PA), nurse<br />
practitioner (NP), or physician<br />
(MD) with primary care specialty<br />
as usual provider<br />
Wisconsin Longitudinal Study<br />
(WLS) - telephone and mail<br />
survey 1993-94 for perceived<br />
health, 2004-05 survey defined<br />
sample and all other variables<br />
Response: 80% for graduates,<br />
78% for siblings (telephone);<br />
88% for graduates and 81%<br />
for siblings (mailed survey<br />
to those who did telephone<br />
interview)<br />
Office of Management<br />
and Budget<br />
(metropolitan,<br />
micropolitan, or<br />
nonmetropolitan)<br />
Age, gender, marital status,<br />
education, personality traits,<br />
income, insurance, perceived<br />
health, number of diagnoses<br />
Low/<br />
Moderate<br />
306 (4.5%) use PA/NPs as<br />
usual source of care #<br />
PA/NP as usual source of care<br />
(+); non-metro>metro, nonmetro>micro<br />
#<br />
Unadjusted analysis<br />
Ferrer, 2007 110<br />
Crosssectional<br />
Wisconsin<br />
N = 34,403<br />
Inclusion: all ages, noninstitutionalized,<br />
able to link<br />
household component with<br />
office and outpatient facility<br />
face-to-face visits<br />
Nationwide<br />
MEPS, 2004<br />
plus information from relevant<br />
clinicians<br />
Response (to MEPS): 64%<br />
Metropolitan Statistical<br />
Area (MSA) =<br />
urban, non-MSA =<br />
rural<br />
Age, gender, income, insurance,<br />
race/ethnicity<br />
Low/<br />
Moderate<br />
Odds of visiting family physician,<br />
nurse practitioner, and<br />
physician assistant (+); non-<br />
MSA>MSA<br />
Odds of visiting general internist<br />
or non-surgical specialist<br />
(+); non-MSA
<strong>Rural</strong> <strong>vs</strong>. <strong>Urban</strong> <strong>Ambulatory</strong> <strong>Health</strong> <strong>Care</strong>: A Systematic <strong>Review</strong><br />
Evidence-based Synthesis Program<br />
Author,<br />
Year, Study<br />
Design<br />
Grumbach,<br />
2003 112<br />
Crosssectional<br />
Study Population (Sample<br />
Size, Inclusion/Exclusion,<br />
Region/Nationwide)<br />
N = 33,673 clinicians (28,053<br />
California [CA], 5,620 Washington<br />
[WA])<br />
Inclusion: active in patient<br />
care, no longer in training,<br />
primary self-reported specialty<br />
of family/general practice,<br />
internal medicine, pediatrics,<br />
obstetrics/gynecology<br />
California, Washington<br />
Data Source, Year(s) (if<br />
applicable)<br />
Response Rate (if applicable)<br />
AMA Physician Masterfile plus<br />
WA licensing board information<br />
and contacts with rural physicians<br />
(physician data)<br />
Mailed survey (non-physician<br />
data)<br />
Response: 64% (CA); 67%<br />
NPs in WA, 86% PAs in WA<br />
Definition of<br />
<strong>Urban</strong>/<strong>Rural</strong><br />
CA: Medical Service<br />
Study Areas<br />
(MSSA); rural –<br />
population density<br />
30 min from<br />
population base of<br />
≥10,000<br />
Covariates<br />
Clinician age, gender, and<br />
race/ethnicity<br />
Confidence<br />
Score*<br />
Low<br />
Results**<br />
22% of Physician Assistants in<br />
CA practice in rural area; 28%<br />
in WA #<br />
Odds of practicing in rural<br />
areas:<br />
(+) family physicians, nurse<br />
practitioners, and physician<br />
assistants more likely relative<br />
to obstetricians/gynecologists<br />
(+) Asian, African Americans,<br />
Latinos (CA only) less likely<br />
(+) females less likely<br />
#<br />
Unadjusted analysis<br />
Gunderson,<br />
2006 115<br />
Crosssectional<br />
N = 539 physicians who practiced<br />
in rural Florida<br />
Inclusion: physicians who<br />
self-report treating elderly (primary<br />
care, psychiatry, surgery,<br />
specialists)<br />
Florida<br />
Mailed survey 2003<br />
Response: 43%<br />
Census data<br />
<strong>Rural</strong>: one of 33<br />
designated rural<br />
counties in Florida,<br />
practicing in rural<br />
areas of nonrural<br />
counties by <strong>Rural</strong><br />
<strong>Urban</strong> Commuting<br />
Area codes, or<br />
<strong>Health</strong> Resources<br />
and Services<br />
Administration list of<br />
rural ZIP codes<br />
None Low 55% reported decreased or<br />
eliminated patient services<br />
in past year including mental<br />
health, (35%), vaccine administration<br />
(29%), office-based<br />
surgeries (40%), Pap smears<br />
(24%), x-rays (24%), endoscopies<br />
(43%), and electrocardiograms<br />
(11%) #<br />
Physicians in practice where<br />
≥65% of patients were Medicare<br />
patients were more likely<br />
to reduce or eliminate services<br />
compared to those with<br />
<strong>Rural</strong> <strong>vs</strong>. <strong>Urban</strong> <strong>Ambulatory</strong> <strong>Health</strong> <strong>Care</strong>: A Systematic <strong>Review</strong><br />
Evidence-based Synthesis Program<br />
Author,<br />
Year, Study<br />
Design<br />
Laditka 2009 28<br />
Cross-sectional<br />
Study Population (Sample<br />
Size, Inclusion/Exclusion,<br />
Region/Nationwide)<br />
Inclusion: all US counties<br />
Nationwide<br />
Data Source, Year(s) (if<br />
applicable)<br />
Response Rate (if applicable)<br />
Area Resource File, 2002<br />
Definition of<br />
<strong>Urban</strong>/<strong>Rural</strong><br />
<strong>Urban</strong> Influence<br />
Codes, 2003<br />
Covariates<br />
Confidence<br />
Score*<br />
Results**<br />
None High Mean primary care physician<br />
supply (per 10,000 population):<br />
Metropolitan: 17.8 (large), 16.9<br />
(small)<br />
Micropolitan: 12.3 (adj. to large<br />
metro), 13.1 (adj. to small<br />
metro)<br />
<strong>Rural</strong>: 7.1 (adj.t o small metro),<br />
7.2 (adj. to micro), 9.2 (not adj.<br />
to metro or micro) #<br />
#<br />
Unadjusted analysis<br />
Menachemi,<br />
2006 116<br />
Cross-sectional<br />
Strickland,<br />
1998 118<br />
Cross-sectional<br />
N = 308 family physicians (176<br />
rural, 132 urban)<br />
Florida<br />
N = 1,118 providers (1,079<br />
with ZIP codes)<br />
Inclusion: nurse practitioners<br />
(NP), certified nurse midwives<br />
(CNM), physician assistants<br />
(PA) residing or practicing in<br />
Georgia<br />
Georgia<br />
Mailed survey<br />
Response: 42%<br />
Mailed survey, 1994<br />
Response: 62%<br />
<strong>Rural</strong>: one of 33<br />
designated rural<br />
counties in Florida,<br />
practicing in rural<br />
areas of nonrural<br />
counties by <strong>Rural</strong><br />
<strong>Urban</strong> Commuting<br />
Area codes, or<br />
<strong>Health</strong> Resources<br />
and Services<br />
Administration list of<br />
rural ZIP codes<br />
Metropolitan Statistical<br />
Area (MSA) =<br />
urban, non-MSA =<br />
rural<br />
None Low Overall, 60% reported delivery<br />
of patient services decreased<br />
or eliminated in past year #<br />
None<br />
Low/<br />
Moderate<br />
Types of services decreased<br />
or eliminated (-) (except for<br />
office-based surgeries) #<br />
#<br />
Unadjusted analysis<br />
NPs (n=554, 31% rural): older,<br />
fewer with bachelor’s degree,<br />
fewer specialty credentials,<br />
more years in health care,<br />
more solo and clinic practice<br />
settings, fewer insured patients<br />
(+); R <strong>vs</strong>. U #<br />
CNMs (n=73, 29% rural):<br />
fewer specialty credentials,<br />
more hours per week, more<br />
patients per hour (+); R <strong>vs</strong>. U #<br />
PAs (n=452, 18% rural): older,<br />
fewer with bachelor’s degree,<br />
more years in health care and<br />
years as PA, more patients<br />
each hour, more clinic practice<br />
settings, fewer insured patients<br />
(+); R <strong>vs</strong>. U #<br />
#<br />
Unadjusted analysis<br />
99
<strong>Rural</strong> <strong>vs</strong>. <strong>Urban</strong> <strong>Ambulatory</strong> <strong>Health</strong> <strong>Care</strong>: A Systematic <strong>Review</strong><br />
Evidence-based Synthesis Program<br />
Author,<br />
Year, Study<br />
Design<br />
Wilson,<br />
2009 66<br />
Cross-sectional<br />
Study Population (Sample<br />
Size, Inclusion/Exclusion,<br />
Region/Nationwide)<br />
N = 1,427 counties or county<br />
sets (contiguous, single state<br />
sets of counties merged to<br />
achieve population >50,000)<br />
Inclusion: all US counties or<br />
county sets except Alaska,<br />
Hawaii, and 12 cities with<br />
changes in county definitions<br />
between 1980 and 2000<br />
Data Source, Year(s) (if<br />
applicable)<br />
Response Rate (if applicable)<br />
Numbers of rehabilitation<br />
therapists (physical [PT] or<br />
occupational [OT] therapists,<br />
speech-language pathologists<br />
[SLP]) from 1980 and 1990<br />
ARF and 2000 EEO<br />
<strong>Health</strong> Professional Shortage<br />
Area Data<br />
Definition of<br />
<strong>Urban</strong>/<strong>Rural</strong><br />
US Office of Management<br />
and Budget<br />
(OMB) – metropolitan<br />
(metro):<br />
central county with<br />
≥1 urbanized area<br />
and outlying counties<br />
economically<br />
tied to core county<br />
Covariates<br />
None<br />
Confidence<br />
Score*<br />
Moderate/<br />
High<br />
Results**<br />
PTs, OTs, or SLPs per 100,000<br />
residents (NR); U>R #<br />
PTs, OTs, or SLPs per 100,000<br />
residents (NR); Non-shortage<br />
area > partial or total shortage<br />
area #<br />
Nationwide<br />
*See Methods section for explanation<br />
**U=<strong>Urban</strong>; R=<strong>Rural</strong>; (+)=difference statistically significant; (-)=difference not statistically significant<br />
100