Growth 70/30 Fund - Q209 UPDATE - SEI
Growth 70/30 Fund - Q209 UPDATE - SEI
Growth 70/30 Fund - Q209 UPDATE - SEI

You also want an ePaper? Increase the reach of your titles
YUMPU automatically turns print PDFs into web optimized ePapers that Google loves.
FOR FINANCIAL INTERMEDIARY USE ONLY.<br />
<strong>Growth</strong> <strong>70</strong>/<strong>30</strong> <strong>Fund</strong> - <strong>Q209</strong> <strong>UPDATE</strong><br />
PERFORMANCE - O CLASS (GROSS OF MANAGEMENT FEES)<br />
Q2 1 MONTH 1 YEAR 3 YEAR 5 YEAR<br />
SINCE<br />
INCEPTION<br />
INCEPTION<br />
DATE<br />
CALENDAR YEAR RETURNS<br />
2008 2007 2006 2005 2004 2003<br />
11.9% 3.4% -16.3% -1.4% 3.3% 5.7% SEP-02 -22.2% 2.4% 13.0% 13.9% 11.3% 17.6%<br />
BENCHMARK - <strong>SEI</strong> GROWTH <strong>70</strong>/<strong>30</strong> COMPOSITE INDEX<br />
11.4% 3.0% -14.0% -0.8% 3.6% 6.0% -20.0% 1.5% 13.9% 13.4% 11.1% 17.6%<br />
INVESTMENT APPROACH<br />
The aim of the <strong>SEI</strong> <strong>Growth</strong> <strong>70</strong>/<strong>30</strong> <strong>Fund</strong> is to provide long-term growth of capital and income primarily through investment<br />
in a diversified portfolio of equity and fixed income securities with a greater bias to equity securities to allow opportunity for<br />
capital growth. The <strong>Fund</strong> generally has a mix of <strong>30</strong>% fixed income securities and <strong>70</strong>% equity securities.<br />
The <strong>Fund</strong> seeks to accomplish its objective by investing in other <strong>SEI</strong> <strong>Fund</strong>s which utilize a Manager of Managers<br />
investment strategy that combines multiple specialist Portfolio Managers. Each Portfolio Manager is responsible for<br />
managing a portion of the underlying <strong>SEI</strong> <strong>Fund</strong> in accordance with a specific mandate, based on their specific area of<br />
expertise. Portfolio Managers are carefully selected using in-depth quantitative and qualitative research. Once appointed,<br />
they are subject to an on-going disciplined and rigorous monitoring process.<br />
PERFORMANCE*<br />
• Canadian equity markets showed significant strength through Q2, finishing with a 20.0% gain.<br />
• Small cap Canadian stocks posted an extremely positive quarter with a gain of 25.8%.<br />
• Large cap U.S. stocks also showed signs of strength as the Russell 1000 Index in Canadian dollars returned 7.4%<br />
on the quarter.<br />
• Small cap U.S. stocks, as measured by the Russell 2500 Index, outperformed large cap stocks, as they gained 10.9%.<br />
• Developed international equity markets, as measured by the MSCI EAFE Index, posted a 15.8% return for the quarter.<br />
• Emerging Markets had a positive quarter posting a 24.4% gain in Q2.<br />
• The Canadian fixed income market, as measured by the DEX Index, increased by 1.2% for the quarter.<br />
• Real return bonds had a strong quarter rising 1.3%.<br />
• Global bonds, as measured by the Citigroup World Government Bond Index fell by 5.3% resulting from tight<br />
credit conditions.<br />
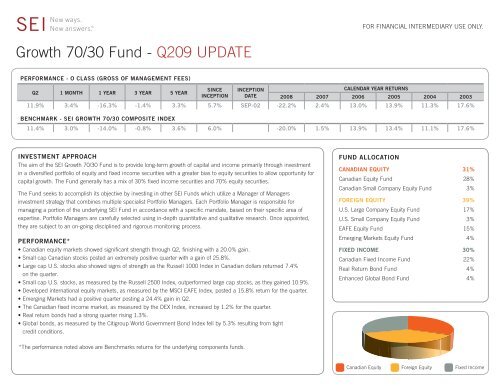
FUND ALLOCATION<br />
CANADIAN EQUITY 31%<br />
Canadian Equity <strong>Fund</strong> 28%<br />
Canadian Small Company Equity <strong>Fund</strong> 3%<br />
FOREIGN EQUITY 39%<br />
U.S. Large Company Equity <strong>Fund</strong> 17%<br />
U.S. Small Company Equity <strong>Fund</strong> 3%<br />
EAFE Equity <strong>Fund</strong> 15%<br />
Emerging Markets Equity <strong>Fund</strong> 4%<br />
FIXED INCOME <strong>30</strong>%<br />
Canadian Fixed Income <strong>Fund</strong> 22%<br />
Real Return Bond <strong>Fund</strong> 4%<br />
Enhanced Global Bond <strong>Fund</strong> 4%<br />
*The performance noted above are Benchmarks returns for the underlying components funds.<br />
Canadian Equity Foreign Equity Fixed Income
FOR FINANCIAL INTERMEDIARY USE ONLY.<br />
TOP 25 HOLDINGS<br />
HOLDING<br />
% OF TOTAL NET ASSETS<br />
Government Of Canada 0.000% T-Bill 17-Sept-2009 3.5%<br />
Royal Bank Of Canada 1.9%<br />
Bank Of Nova Scotia 1.8%<br />
Toronto-Dominion Bank 1.7%<br />
Research In Motion Ltd 1.0%<br />
Encana Corporation 0.8%<br />
Manulife Financial Corp 0.8%<br />
Canadian Natural Resources Ltd 0.8%<br />
Canada Housing Trust No 1 Var Rt 15-Sept-2010 Ser 12 0.8%<br />
Barrick Gold Corp 0.7%<br />
Government Of Canada 3.000% 01-Dec-2036 Real Rtn Bd 0.7%<br />
Transcanada Corp 0.6%<br />
Government Of Canada 4.250% 01-Dec-2026 Real Rtn Bd 0.6%<br />
Petro-Canada 0.6%<br />
Goldcorp Inc 0.6%<br />
Prov Of Quebec 4.250% 01-Dec-2031 Real Rtn Bd 0.6%<br />
Prov Of Quebec Var Rt 10-Dec-2013 Mtn Ser 87 0.6%<br />
Suncor Energy Inc 0.5%<br />
Talisman Energy Inc 0.5%<br />
Bank Of Montreal 0.5%<br />
Exxon Mobil Corp 0.5%<br />
Snc-Lavalin Group Inc 0.5%<br />
Potash Corp Of Saskatchewan 0.5%<br />
Government Of Canada 5.000% 01-Jun-2037 Ser Xw98 0.5%<br />
Prov Of Quebec 4.500% 01-Dec-2026 Real Rtn Bd 0.4%<br />
22.0%<br />
PORTFOLIO BREAKDOWN<br />
SECTOR<br />
% OF TOTAL NET ASSETS<br />
Canadian Equities 31.7%<br />
Canadian Fixed Income 25.4%<br />
US Equities 19.7%<br />
International Equities 19.1%<br />
Global Fixed Income 3.9%<br />
Cash and Cash Equivalents 0.2%<br />
TOTAL 100.0%<br />
Where a fund has less than 25 holdings, all investments have been disclosed. The<br />
summary of investment portfolio may change due to ongoing portfolio transactions of the<br />
fund. Quarterly updates are available at www.seic.com within 60 days after each quarter<br />
end. This fund invests in securities of other mutual funds managed by <strong>SEI</strong>. You may view<br />
the prospectus and other information about the underlying mutual funds on the internet at<br />
www.sedar.com or on our website at www.seic.com.<br />
<strong>SEI</strong> offers the <strong>Growth</strong> <strong>70</strong>/<strong>30</strong> <strong>Fund</strong> in <strong>SEI</strong>’s Asset Allocation <strong>Fund</strong>s. This is available in<br />
P Class: <strong>Fund</strong>SERV Code PCA224 and F Class: <strong>Fund</strong>SERV Code PCA324.<br />
Total Net Asset Value $165,769,453<br />
This material represents an assessment of the market environment at a specific point in time and is not intended to be a forecast of future events, or a guarantee of future results. This information should not be relied<br />
upon by the reader as research or investment advice regarding the funds or any stock in particular, nor should it be construed as a recommendation to purchase or sell a security, including futures contracts. There<br />
is no assurance as of the date of this material that any of the securities mentioned are owned or not owned by any of the <strong>SEI</strong> <strong>Fund</strong>s. The portfolio managers within a <strong>Fund</strong> or the allocations of assets to a particular<br />
portfolio manager are subject to change from time to time at <strong>SEI</strong>'s discretion. Commissions, trailing commissions, management fees and expenses all may be associated with mutual fund investments. Please read the<br />
prospectus before investing. Mutual funds are not guaranteed, their values change frequently and past performances may not be repeated. All reference to performance figures of the <strong>SEI</strong> <strong>Fund</strong>s is for O Class units (gross<br />
of management fees). Except as otherwise noted, the indicated rates of return are the historical annual compounded total returns including changes in unit value and reinvestment of all distributions. The rates of return<br />
for periods of less than one year are simple rates of return.<br />
AUGUST 2009 FOR FINANCIAL INTERMEDIARY USE ONLY. NOT FOR PUBLIC DISTRIBUTION. www.seic.com<br />
0 9 0 8 1 2 ( 8 / 0 9 )