Basic Beet Piler Design and its Application to Construction - ASSBT ...
Basic Beet Piler Design and its Application to Construction - ASSBT ...
Basic Beet Piler Design and its Application to Construction - ASSBT ...

Create successful ePaper yourself
Turn your PDF publications into a flip-book with our unique Google optimized e-Paper software.
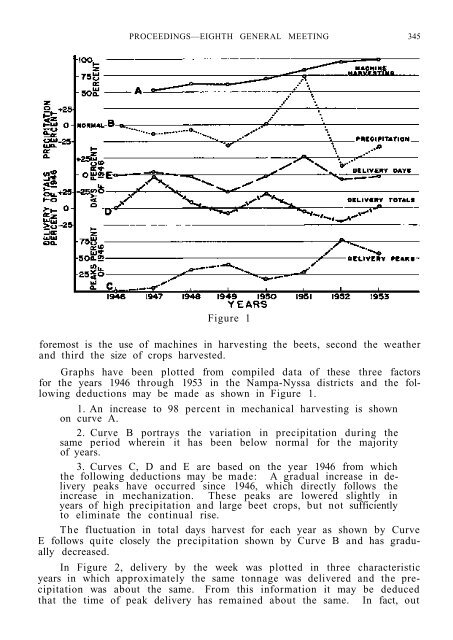
PROCEEDINGS—EIGHTH GENERAL MEETING 345<br />
Figure 1<br />
foremost is the use of machines in harvesting the beets, second the weather<br />
<strong>and</strong> third the size of crops harvested.<br />
Graphs have been plotted from compiled data of these three fac<strong>to</strong>rs<br />
for the years 1946 through 1953 in the Nampa-Nyssa districts <strong>and</strong> the following<br />
deductions may be made as shown in Figure 1.<br />
1. An increase <strong>to</strong> 98 percent in mechanical harvesting is shown<br />
on curve A.<br />
2. Curve B portrays the variation in precipitation during the<br />
same period wherein it has been below normal for the majority<br />
of years.<br />
3. Curves C, D <strong>and</strong> E are based on the year 1946 from which<br />
the following deductions may be made: A gradual increase in delivery<br />
peaks have occurred since 1946, which directly follows the<br />
increase in mechanization. These peaks are lowered slightly in<br />
years of high precipitation <strong>and</strong> large beet crops, but not sufficiently<br />
<strong>to</strong> eliminate the continual rise.<br />
The fluctuation in <strong>to</strong>tal days harvest for each year as shown by Curve<br />
E follows quite closely the precipitation shown by Curve B <strong>and</strong> has gradually<br />
decreased.<br />
In Figure 2, delivery by the week was plotted in three characteristic<br />
years in which approximately the same <strong>to</strong>nnage was delivered <strong>and</strong> the precipitation<br />
was about the same. From this information it may be deduced<br />
that the time of peak delivery has remained about the same. In fact, out