Summary of spanner crab (Ranina ranina) survey results: 2000-2005
Summary of spanner crab (Ranina ranina) survey results: 2000-2005
Summary of spanner crab (Ranina ranina) survey results: 2000-2005

You also want an ePaper? Increase the reach of your titles
YUMPU automatically turns print PDFs into web optimized ePapers that Google loves.
Queensland the Smart State<br />
Fisheries<br />
Long Term<br />
Monitoring Program<br />
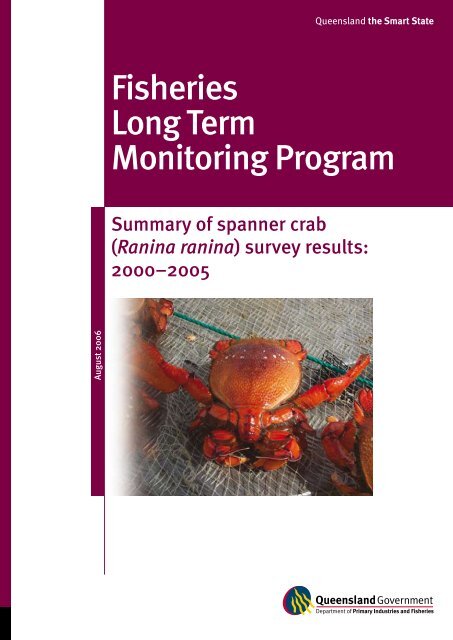
<strong>Summary</strong> <strong>of</strong> <strong>spanner</strong> <strong>crab</strong><br />
(<strong>Ranina</strong> <strong>ranina</strong>) <strong>survey</strong> <strong>results</strong>:<br />
<strong>2000</strong>–<strong>2005</strong><br />
August 2006
Fisheries<br />
Long Term<br />
Monitoring Program<br />
<strong>Summary</strong> <strong>of</strong> <strong>spanner</strong> <strong>crab</strong><br />
(<strong>Ranina</strong> <strong>ranina</strong>) <strong>survey</strong> <strong>results</strong>:<br />
<strong>2000</strong>–<strong>2005</strong><br />
August 2006<br />
Jason McGilvray<br />
Ian Brown<br />
Eddie Jebreen<br />
Darren Smallwood
Department <strong>of</strong> Primary Industries and Fisheries<br />
Queensland<br />
ISSN 0727-6273<br />
QI06095<br />
This document may be cited as:<br />
McGilvray, J., Brown, I., Jebreen, E., and Smallwood, D. (2006). Fisheries Long Term Monitoring Program<br />
– <strong>Summary</strong> <strong>of</strong> <strong>spanner</strong> <strong>crab</strong> (<strong>Ranina</strong> <strong>ranina</strong>) <strong>survey</strong> <strong>results</strong>: <strong>2000</strong>-<strong>2005</strong>. Department <strong>of</strong> Primary Industries and<br />
Fisheries, Queensland, QI06095, Brisbane, Australia.<br />
Acknowledgments:<br />
Thanks are due to the skippers <strong>of</strong> the chartered vessels for their willingness to undertake the <strong>survey</strong> work, <strong>of</strong>ten<br />
under adverse conditions. The dedication <strong>of</strong> the monitoring team members and other DPI&F staff involved in the<br />
<strong>survey</strong> is gratefully acknowledged. The support <strong>of</strong> Len Olyott, Brooke Young and the Assessment and Monitoring<br />
team is recognised for database design, mapping, data entry and retrieval. Malcolm Dunning and Olivia Whybird<br />
are thanked for their review and editorial input.<br />
General disclaimer:<br />
This publication has been prepared with care. DPI&F:<br />
(a) takes no responsibility for any errors, omissions or inaccuracies contained in this publication;<br />
(b) does not warrant that the information contained in this publication is current or that there is not more recent<br />
or more relevant information available;<br />
(c) does not accept any liability for any decisions or actions taken on the basis <strong>of</strong> this publication; and<br />
(d) does not accept any liability for any loss or damage suffered directly or indirectly from the use <strong>of</strong> the<br />
information contained in this publication.<br />
© The State <strong>of</strong> Queensland, Department <strong>of</strong> Primary Industries and Fisheries 2006<br />
Copyright protects this material. Except as permitted by the Copyright Act 1968 (Cth), reproduction by any means<br />
(photocopying, electronic, mechanical, recording or otherwise), making available online, electronic transmission<br />
or other publication <strong>of</strong> this material is prohibited without the prior written permission <strong>of</strong> The Department <strong>of</strong><br />
Primary Industries and Fisheries, Queensland. Inquiries should be addressed to copyright@dpi.qld.gov.au<br />
(telephone +61 7 3404 6999).<br />
Inquiries should be addressed to:<br />
Intellectual Property and Commercialisation Unit<br />
Department <strong>of</strong> Primary Industries and Fisheries<br />
GPO Box 46<br />
BRISBANE, QLD 4001
Contents<br />
List <strong>of</strong> Acronyms<br />
v<br />
<strong>Summary</strong><br />
vi<br />
Long Term Monitoring Program background 1<br />
Introduction 1<br />
Objectives 2<br />
Methods 3<br />
Experimental Design 3<br />
Data Recording 5<br />
Data Analysis 5<br />
Results 6<br />
<strong>Summary</strong> for all <strong>survey</strong> regions (2 to 7) and years (<strong>2000</strong>-2003 and <strong>2005</strong>) 6<br />
Set times 6<br />
Length frequency distributions 6<br />
Sex-ratios 8<br />
Catch rates 9<br />
Relationships with physical variables 10<br />
Bycatch and interactions with other marine species 13<br />
Region 2 14<br />
Size frequency 14<br />
Catch rates 15<br />
Sex-ratios 16<br />
Relationships with physical variables 17<br />
Region 3 18<br />
Size frequency 19<br />
Catch rates 19<br />
Sex-ratios 20<br />
Relationships with physical variables 21<br />
Region 4 22<br />
Size frequency 22<br />
Catch rates 23<br />
Sex-ratios 24<br />
Relationships with physical variables 25<br />
Region 5 26<br />
Size frequency 26<br />
Catch rates 27<br />
Sex-ratios 28<br />
Relationships with physical variables 29<br />
Region 6 30<br />
Size frequency 30<br />
Catch rates 31<br />
Sex-ratios 32<br />
Relationships with physical variables 33<br />
iii
Region 7 34<br />
Size frequency 34<br />
Catch rates 36<br />
Sex-ratios 37<br />
Relationships with physical variables 37<br />
Discussion 38<br />
Survey technique 38<br />
Set times 38<br />
Length frequency distributions 38<br />
Sex-ratios 39<br />
Catch rates 39<br />
Relationships with physical variables 40<br />
Bycatch and interactions with other marine species 40<br />
Conclusions and Recommendations 40<br />
References 41<br />
Appendix A—Mean catch rates (individuals per dilly lift) <strong>of</strong> bycatch species<br />
caught during the Long Term Monitoring Program <strong>spanner</strong> <strong>crab</strong> <strong>survey</strong> in<br />
2001, 2003 and <strong>2005</strong> per region (2–6). 42<br />
iv Fisheries Long Term Monitoring Program, <strong>Summary</strong> <strong>of</strong> <strong>spanner</strong> <strong>crab</strong> (<strong>Ranina</strong> <strong>ranina</strong>) <strong>survey</strong> <strong>results</strong>: <strong>2000</strong>–<strong>2005</strong>
List <strong>of</strong> Acronyms<br />
CFISH<br />
Commercial Fisheries Information System, DPI&F<br />
CPUE<br />
Catch Per Unit Effort<br />
CrabMAC Crab fishery Management Advisory Committee<br />
DPI&F<br />
Department <strong>of</strong> Primary Industries and Fisheries, Queensland<br />
ITQ<br />
Individual Transferable Quota<br />
LTMP<br />
Long Term Monitoring Program, DPI&F<br />
MLS<br />
Minimum Legal Size<br />
TACC<br />
Total Allowable Commercial Catch<br />
SOCI<br />
Species <strong>of</strong> Conservation Interest<br />
v
<strong>Summary</strong><br />
The Department <strong>of</strong> Primary Industries and Fisheries manages the harvest <strong>of</strong> Queensland’s<br />
fish, mollusc and crustacean species and the habitats they live in. Inherent in this<br />
responsibility is a commitment to monitoring the condition and trends in fish populations<br />
and their associated habitats. This information is used to assess the effectiveness <strong>of</strong><br />
fisheries management strategies and contributes to ensuring that the fisheries remain<br />
ecologically sustainable.<br />
The <strong>spanner</strong> <strong>crab</strong>, <strong>Ranina</strong> <strong>ranina</strong>, inhabits sandy bottoms on the continental shelf <strong>of</strong>f<br />
Australia’s east coast, from southern New South Wales, north to the southern Great<br />
Barrier Reef. The annual commercial harvest <strong>of</strong> <strong>spanner</strong> <strong>crab</strong>s in Queensland increased<br />
rapidly from 1988 to 1994 with fishing effort and catch rates increasing as the fishery<br />
expanded into previously unexploited areas. Since 1999, the fishery has been subject to<br />
a Total Allowable Commercial Catch (TACC) in Management Area A, divided between the<br />
licensed operators by way <strong>of</strong> Individual Transferable Quota units (ITQ). The current TACC<br />
<strong>of</strong> 1727 tonnes has been in effect since June 2002.<br />
The present TACC setting decision rules are based on performance criteria derived<br />
from commercial catch rates. However, there is concern about the reliability <strong>of</strong> fishery<br />
dependent catch rates as indicators <strong>of</strong> stock abundance, partly because the stock is not<br />
uniformly distributed, resulting in fishers targeting aggregations <strong>of</strong> <strong>crab</strong>s. In response<br />
to these management concerns and the high value <strong>of</strong> the fishery (approximately $10 m),<br />
<strong>spanner</strong> <strong>crab</strong>s were included in the Department’s Long Term Monitoring Program (LTMP).<br />
The objectives <strong>of</strong> the <strong>spanner</strong> <strong>crab</strong> monitoring component <strong>of</strong> this program are to obtain<br />
fishery independent catch per unit effort (CPUE) data, record length frequency and sexratio<br />
data, identify interactions with species <strong>of</strong> conservation interest (SOCI), and monitor<br />
bycatch composition.<br />
The sampling design includes five assessment regions (Regions 2 to 6) comprising <strong>of</strong> the<br />
Queensland Commercial Fishery (Managed Area A), which is subject to the TACC. For the<br />
<strong>2005</strong> <strong>survey</strong> an extra region (Region 7) was added in New South Wales. Fifteen sets per<br />
subgrids were conducted, with each set consisting <strong>of</strong> ten standard commercial <strong>spanner</strong><br />
<strong>crab</strong> dillies connected by a ‘trot-line’ (or single string). Five subgrids were sampled in<br />
Regions 2 to 6, and four subgrids in Region 7. This report presents <strong>survey</strong> <strong>results</strong> from<br />
five years, <strong>2000</strong> to 2003 and <strong>2005</strong>.<br />
A total <strong>of</strong> 19 290 individual dilly lifts have been undertaken by the LTMP fishery<br />
independent <strong>spanner</strong> <strong>crab</strong> <strong>survey</strong>. In the Queensland regions observations <strong>of</strong> fishery<br />
bycatch during 2002, 2003 and <strong>2005</strong> show very low catch rates. Most <strong>of</strong> the bycatch<br />
species captured by <strong>spanner</strong> <strong>crab</strong> fishing gear are alive, and expected survival rates after<br />
release would be extremely high. To date there is not a single record <strong>of</strong> physical interaction<br />
between sampling gear and marine protected species.<br />
Differences in mean carapace lengths were observed between male and female <strong>crab</strong>s<br />
over all regions. Overall, 68.1% <strong>of</strong> the 23 842 males and 13.0% <strong>of</strong> the 4193 females<br />
captured over the five year <strong>survey</strong> period were larger than the minimum legal carapace<br />
length <strong>of</strong> 100 mm. Carapace lengths also varied greatly between all regions sampled<br />
(Regions 2 to 7); male <strong>crab</strong>s were smaller in Region 5 compared to other regions and<br />
female <strong>crab</strong>s were largest in Regions 6 and 7.<br />
Overall, catches were dominated by males, which represented 85.0% <strong>of</strong> the overall catch.<br />
Distinct trends were evident in the proportion <strong>of</strong> the catch represented by males and<br />
females in each region and these were relatively consistent across the five year study<br />
period. In particular, Regions 6 and 7 had a much higher percentage <strong>of</strong> females in the<br />
catch, 25.5% and 50.9% respectively compared to Regions 2, 3, 4 and 5 (9.6% to 17.6%).<br />
vi Fisheries Long Term Monitoring Program, <strong>Summary</strong> <strong>of</strong> <strong>spanner</strong> <strong>crab</strong> (<strong>Ranina</strong> <strong>ranina</strong>) <strong>survey</strong> <strong>results</strong>: <strong>2000</strong>–<strong>2005</strong>
Catch rates <strong>of</strong> male and female <strong>crab</strong>s varied between all regions. While catch rates differed<br />
among years within regions, differences among regions were generally consistent over the<br />
five year study period. Catch rates over the five year period were much higher in Region<br />
4 than all other regions, reflecting the commercial catch data for the same period, which<br />
indicated highest catch rates in Region 4.<br />
Analysis <strong>of</strong> catch rates with respect to the fishing depth and average bottom water<br />
temperature indicated that catches were highest at depths <strong>of</strong> 60 to 69 m for both male and<br />
female <strong>crab</strong>s. Catch rates <strong>of</strong> male and female <strong>crab</strong>s were variable with regards to bottom<br />
water temperature. However, these relationships were confounded by region to a large<br />
extent and were not consistently observed across all regions.<br />
The LTMP <strong>spanner</strong> <strong>crab</strong> component, has delivered a time series <strong>of</strong> size and sex-ratio<br />
data coupled with fishery independent catch rate data for the five Queensland assessment<br />
regions in Commercial Fishery (Managed Area A). Similar data were collected from<br />
NSW in <strong>2005</strong> only, although only for a single year. Further standardization <strong>of</strong> the fishery<br />
independent catch rate with associated biological and physical characteristics will<br />
greatly enhance the importance <strong>of</strong> this data set for future analysis and regional<br />
population assessments.<br />
vii
Long Term Monitoring Program background<br />
Introduction<br />
The <strong>spanner</strong> <strong>crab</strong> fishery is managed by the Department <strong>of</strong> Primary Industries and<br />
Fisheries (DPI&F) by input and output controls, involving an annually reviewed Total<br />
Allowable Catch (TACC) divided between some 240 licensed operators (128 boats) by way<br />
<strong>of</strong> Individual Transferable Quota (ITQ) units. In mid-1999, 100 000 ITQ units were allocated,<br />
on the basis <strong>of</strong> prior history in the fishery. The Fisheries (Spanner Crab) Management Plan<br />
(1999) sets out the objectives <strong>of</strong> management, performance indicators and review events.<br />
The present TACC setting decision rules are based on performance criteria derived from<br />
commercial catch rates (CPUE), which until further information becomes available,<br />
are deemed to be indicative <strong>of</strong> stock abundance. However, there is concern about the<br />
reliability <strong>of</strong> fishery dependent catch rates as indicators <strong>of</strong> stock abundance. This is partly<br />
because the stock is not uniformly distributed, resulting in fishers targeting aggregations<br />
<strong>of</strong> <strong>crab</strong>s. Such a fishing strategy is not uncommon, but it means that declining overall<br />
abundance may not be revealed as a signal in the commercial catch rates until the stock is<br />
very seriously depleted. It is also partly due to the use <strong>of</strong> a “passive” fishing method, the<br />
success <strong>of</strong> which may vary considerably in response to changes in the behaviour <strong>of</strong><br />
the target species.<br />
At the Fisheries Research and Development Corporation sponsored Stock Assessment<br />
Review Workshop (Southern Fisheries Centre, August 1998 – Dichmont et al. 1999) the<br />
Spanner Crab Working Group agreed that, largely because <strong>of</strong> concerns outlined above,<br />
one <strong>of</strong> the most pressing issues for this fishery in Queensland was the establishment<br />
<strong>of</strong> a fishery independent monitoring program. The Crab fishery Management Advisory<br />
Committee (CrabMAC) strongly endorsed the need for corroborative data on stock<br />
abundance, and incorporated a significant element <strong>of</strong> cost recovery for such a program in<br />
the Fisheries (Spanner Crab) Management Plan 1999.<br />
The principal objective <strong>of</strong> the LTMP <strong>survey</strong>s was to provide the DPI&F fishery managers<br />
through the <strong>spanner</strong> <strong>crab</strong> Stock Assessment Group, with independent information<br />
about the abundance <strong>of</strong> <strong>spanner</strong> <strong>crab</strong>s in selected regions <strong>of</strong> the commercial fishery.<br />
This information is ultimately to be incorporated, along with fishery dependent CPUE data,<br />
into a fishery model to provide a more robust estimate <strong>of</strong> optimum yield (TACC) than is<br />
presently available. The DPI&F is committed to regular assessment <strong>of</strong> the status<br />
<strong>of</strong> this fishery using the best available scientific information to ensure the fishery<br />
remains sustainable.<br />
1
Objectives<br />
The DPI&F LTMP’s principal objective is to provide the Stock Assessment Group to<br />
CrabMAC with independent information about the abundance <strong>of</strong> <strong>spanner</strong> <strong>crab</strong>s in selected<br />
regions <strong>of</strong> the commercial fishery. This is achieved by providing information on size and<br />
sex composition <strong>of</strong> the <strong>spanner</strong> <strong>crab</strong> catch and CPUE.<br />
In accordance with the Australian Government Department <strong>of</strong> the Environment and<br />
Heritage recommendations associated with the fishery accreditation, (http://www.deh.<br />
gov.au/coasts/fisheries/qld/<strong>spanner</strong>/decision.html#recommendations) bycatch is<br />
monitored. Bycatch composition is monitored in two out <strong>of</strong> every five years by recording<br />
bycatch species, individual sizes and total weight <strong>of</strong> species. Interaction <strong>of</strong> species <strong>of</strong><br />
conservation interest with the <strong>survey</strong> operation is also monitored.<br />
2 Fisheries Long Term Monitoring Program, <strong>Summary</strong> <strong>of</strong> <strong>spanner</strong> <strong>crab</strong> (<strong>Ranina</strong> <strong>ranina</strong>) <strong>survey</strong> <strong>results</strong>: <strong>2000</strong>–<strong>2005</strong>
Methods<br />
Experimental Design<br />
A detailed description <strong>of</strong> all methods can be found in DPI&F (<strong>2005</strong>). The five Queensland<br />
assessment regions within the <strong>spanner</strong> <strong>crab</strong> Commercial Fishery (Managed Area A) were<br />
sampled in May <strong>2000</strong>–2003 and <strong>2005</strong> (Figure 1). The <strong>survey</strong> was not conducted in 2004.<br />
Sampling was undertaken aboard commercially licensed <strong>spanner</strong> <strong>crab</strong> vessels and<br />
research vessels.<br />
Assessment Regions 2–6 encompassed the following areas:<br />
Region 2 23 o 00’ to 24 o 00’ S (Yeppoon – Bustard Head [excl. Area B waters])<br />
Region 3 24 o 00’ to 25 o 00’ S (Bustard Head – Indian Head)<br />
Region 4 25 o 00’ to 26 o 30’ S (Indian Head – Noosa)<br />
Region 5 26 o 30’ to 27 o 30’ S (Noosa – Point Lookout)<br />
Region 6 27 o 30’ to 28 o 12’ S (Point Lookout – Tweed Heads)<br />
Note: Region 7 is south <strong>of</strong> 28 o 12’ S in NSW waters<br />
3
GLADSTONE<br />
T30<br />
SEVENTEEN SEVENTY<br />
QUEENSLAND<br />
U30<br />
U31<br />
BUNDABERG<br />
0 25 50 100 150 200<br />
km<br />
Legend<br />
Subgrids sampled<br />
Pre RAP subgrids<br />
Post RAP subgrids<br />
Sampled 30 minute grids<br />
V31<br />
V32<br />
TIN CAN BAY<br />
BRISBANE<br />
QLD Spanner Crab Commercial Fishery (Managed Area A)<br />
NSW Spanner Crab (Northern Zone) endorsement<br />
QLD Spanner Crab Commercial Fishery (Managed Area B)<br />
W31<br />
W33<br />
W34<br />
W36<br />
W37<br />
CUDGEN<br />
POTTSVILLE<br />
BYRON BAY<br />
BALLINA<br />
X34<br />
X35<br />
X37<br />
X38<br />
NSW1<br />
NSW2<br />
NSW3<br />
NSW4<br />
REGION 2<br />
REGION 3<br />
REGION 4<br />
REGION 5<br />
REGION 6<br />
REGION 7<br />
29°0’S 28°0’S 27°0’S 26°0’S 25°0’S 24°0’S 23°0’S<br />
NEW SOUTH WALES<br />
YAMBA<br />
151°0’E 152°0’E 153°0’E 154°0’E<br />
Figure 1. Commercial Fisheries Information System (CFISH) six-minute subgrids sampled in the<br />
<strong>spanner</strong> <strong>crab</strong> <strong>survey</strong>, before (<strong>2000</strong>–2003) and after (<strong>2005</strong>) the introduction <strong>of</strong> the Great Barrier Reef<br />
Marine Park Authority Representative Area Program (RAP). Region 7 was sampled in <strong>2005</strong> only.<br />
Fisheries Long Term Monitoring Program, <strong>Summary</strong> <strong>of</strong> <strong>spanner</strong> <strong>crab</strong> (<strong>Ranina</strong> <strong>ranina</strong>) <strong>survey</strong> <strong>results</strong>: <strong>2000</strong>–<strong>2005</strong>
Within each region, five six-minute by six-minute subgrids, corresponding with CFISH<br />
gridsites (Table 1), were sampled each year. These were chosen randomly from a list <strong>of</strong><br />
subgrids with high historical catch rates and fishing effort.<br />
In 2004 the Great Barrier Reef Marine Park Authority implemented a new zoning plan<br />
(Representative Areas Program) for the Marine Park. As a result, some subgrids were<br />
no longer able to be sampled. These were replaced with the nearest subgrid in a nonprotected<br />
area <strong>of</strong> the Marine Park and first sampled in May <strong>2005</strong>.<br />
Table 1. Subgrids (corresponding to Commercial Fisheries Information System (CFISH) gridsites)<br />
sampled in each <strong>of</strong> the five assessment regions in Managed Area A. Subgrids marked * were<br />
replaced in <strong>2005</strong> and replacement subgrids are shown in parentheses.<br />
Region 2 Region 3 Region 4 Region 5 Region 6<br />
*25U30 (23U30) 22V31 2X35 15W37 6X38<br />
21U30 7V32 23X34 6X37 2X38<br />
22U30 *10U31 (3U31) 20W33 16X37 1X38<br />
11U30 *13U31 (12U31) 14W34 1X37 12X38<br />
19T30 *21W31 (25V31) 10W34 19W36 22X38<br />
In June <strong>2005</strong>, four six-minute by six-minute subgrids were sampled in New South Wales,<br />
(Region 7). The subgrids were located <strong>of</strong>f Cudgen (NSW 1), Pottsville (NSW2), Byron Bay<br />
(NSW3) and Ballina (NSW4) (Figure 1).<br />
Fifteen sites within every six-minute by six-minute subgrid were chosen randomly each year.<br />
At each site, a single 500 m long string with 10 evenly spaced dillies was deployed. Dillies were<br />
constructed from 8 mm galvanised reinforcing steel bent to form a one metre by one metre<br />
frame. Each frame was covered with a single layer <strong>of</strong> white 32 mm multifilament nylon mesh,<br />
hung with no drop. Dillies were baited with frozen pilchards (Sardinops sagax). The standard<br />
bait quantity was the equivalent <strong>of</strong> three whole pilchards per bait bag. The depth <strong>of</strong> water,<br />
as indicted by an echo sounder, was recorded at each site as the first dilly was deployed.<br />
Temperature-loggers were attached to the first string <strong>of</strong> dillies set each day (DPI&F <strong>2005</strong>).<br />
Data Recording<br />
Dillies were deployed during daylight hours only. Lift time and set time was recorded to<br />
calculate a soak time for each string.<br />
Crabs caught per string were grouped as a single sample i.e. no attempt was made to<br />
keep each dilly’s catch separate (DPI&F <strong>2005</strong>). The sex <strong>of</strong> each <strong>crab</strong> was determined and<br />
recorded, together with the rostral carapace length, which was measured to the nearest<br />
millimetre using vernier callipers (DPI&F In Prep.).<br />
In 2001, 2003 and <strong>2005</strong> all animals other than <strong>spanner</strong> <strong>crab</strong>s (bycatch) were also sampled<br />
in the Queensland regions. The numbers <strong>of</strong> sand <strong>crab</strong>s (Portunus pelagicus) and three<br />
spot <strong>crab</strong>s (Portunus sanguinolentus) were recorded (DPI&F <strong>2005</strong>). All other bycatch was<br />
retained and in the laboratory it was identified to species level, weighed to the nearest<br />
gram, measured to the nearest millimetre and counted (DPI&F In Prep.).<br />
Data Analysis<br />
Spanner <strong>crab</strong>s CPUE was expressed as the mean number <strong>of</strong> <strong>crab</strong>s caught per dilly per hour<br />
(<strong>crab</strong>s/dilly.hour) and was calculated using the following formula:<br />
(Number <strong>of</strong> <strong>crab</strong>s captured / Number <strong>of</strong> dillies retrieved) / Soak time (hrs)<br />
Sex-ratio <strong>of</strong> male <strong>spanner</strong> <strong>crab</strong>s was calculated by applying the following formula:<br />
Number <strong>of</strong> male <strong>crab</strong>s / (Number <strong>of</strong> male <strong>crab</strong>s + Number <strong>of</strong> female <strong>crab</strong>s)<br />
Mean water temperature was determined for the period, starting 15 min after deployment<br />
until the gear was retrieved. The 15 min delay ensured the temperature logger had<br />
adjusted fully to the ambient water temperature.<br />
5