PDF | 554 KB - Australian Building Codes Board
PDF | 554 KB - Australian Building Codes Board
PDF | 554 KB - Australian Building Codes Board

You also want an ePaper? Increase the reach of your titles
YUMPU automatically turns print PDFs into web optimized ePapers that Google loves.
E N E R G Y E F F I C I E N C Y P R O J E C T<br />
C O M M E R C I A L B U I L D I N G S<br />
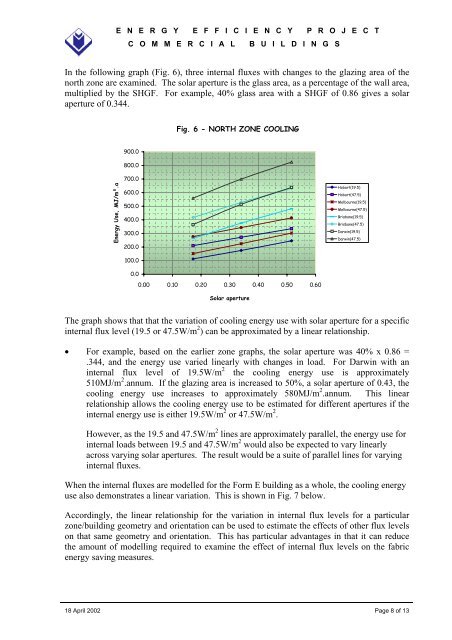
In the following graph (Fig. 6), three internal fluxes with changes to the glazing area of the<br />
north zone are examined. The solar aperture is the glass area, as a percentage of the wall area,<br />
multiplied by the SHGF. For example, 40% glass area with a SHGF of 0.86 gives a solar<br />
aperture of 0.344.<br />
Fig. 6 - NORTH ZONE COOLING<br />
900.0<br />
800.0<br />
700.0<br />
Energy Use, MJ/m².a<br />
600.0<br />
500.0<br />
400.0<br />
300.0<br />
200.0<br />
100.0<br />
0.0<br />
0.00 0.10 0.20 0.30 0.40 0.50 0.60<br />
Solar aperture<br />
Hobart(19.5)<br />
Hobart(47.5)<br />
Melbourne(19.5)<br />
Melbourne(47.5)<br />
Brisbane(19.5)<br />
Brisbane(47.5)<br />
Darwin(19.5)<br />
Darwin(47.5)<br />
The graph shows that that the variation of cooling energy use with solar aperture for a specific<br />
internal flux level (19.5 or 47.5W/m 2 ) can be approximated by a linear relationship.<br />
• For example, based on the earlier zone graphs, the solar aperture was 40% x 0.86 =<br />
.344, and the energy use varied linearly with changes in load. For Darwin with an<br />
internal flux level of 19.5W/m 2 the cooling energy use is approximately<br />
510MJ/m 2 .annum. If the glazing area is increased to 50%, a solar aperture of 0.43, the<br />
cooling energy use increases to approximately 580MJ/m 2 .annum. This linear<br />
relationship allows the cooling energy use to be estimated for different apertures if the<br />
internal energy use is either 19.5W/m 2 or 47.5W/m 2 .<br />
However, as the 19.5 and 47.5W/m 2 lines are approximately parallel, the energy use for<br />
internal loads between 19.5 and 47.5W/m 2 would also be expected to vary linearly<br />
across varying solar apertures. The result would be a suite of parallel lines for varying<br />
internal fluxes.<br />
When the internal fluxes are modelled for the Form E building as a whole, the cooling energy<br />
use also demonstrates a linear variation. This is shown in Fig. 7 below.<br />
Accordingly, the linear relationship for the variation in internal flux levels for a particular<br />
zone/building geometry and orientation can be used to estimate the effects of other flux levels<br />
on that same geometry and orientation. This has particular advantages in that it can reduce<br />
the amount of modelling required to examine the effect of internal flux levels on the fabric<br />
energy saving measures.<br />
18 April 2002 Page 8 of 13