Polynomial functions
Polynomial functions
Polynomial functions

You also want an ePaper? Increase the reach of your titles
YUMPU automatically turns print PDFs into web optimized ePapers that Google loves.
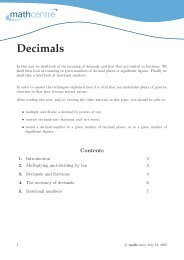
<strong>Polynomial</strong> <strong>functions</strong><br />
Many common <strong>functions</strong> are polynomial <strong>functions</strong>. In this unit we describe polynomial <strong>functions</strong><br />
and look at some of their properties.<br />
In order to master the techniques explained here it is vital that you undertake plenty of practice<br />
exercises so that they become second nature.<br />
After reading this text, and/or viewing the video tutorial on this topic, you should be able to:<br />
• recognise when a rule describes a polynomial function, and write down the degree of the<br />
polynomial,<br />
• recognize the typical shapes of the graphs of polynomials, of degree up to 4,<br />
• understand what is meant by the multiplicity of a root of a polynomial,<br />
• sketch the graph of a polynomial, given its expression as a product of linear factors.<br />
Contents<br />
1. Introduction 2<br />
2. What is a polynomial? 2<br />
3. Graphs of polynomial <strong>functions</strong> 3<br />
4. Turning points of polynomial <strong>functions</strong> 6<br />
5. Roots of polynomial <strong>functions</strong> 7<br />
1 c○ mathcentre July 18, 2005
1. Introduction<br />
A polynomial function is a function such as a quadratic, a cubic, a quartic, and so on, involving<br />
only non-negative integer powers of x. We can give a general defintion of a polynomial, and<br />
define its degree.<br />
2. What is a polynomial?<br />
A polynomial of degree n is a function of the form<br />
f(x) = a n x n + a n−1 x n−1 + . . . + a 2 x 2 + a 1 x + a 0<br />
where the a’s are real numbers (sometimes called the coefficients of the polynomial). Although<br />
this general formula might look quite complicated, particular examples are much simpler. For<br />
example,<br />
f(x) = 4x 3 − 3x 2 + 2<br />
is a polynomial of degree 3, as 3 is the highest power of x in the formula. This is called a cubic<br />
polynomial, or just a cubic. And<br />
f(x) = x 7 − 4x 5 + 1<br />
is a polynomial of degree 7, as 7 is the highest power of x. Notice here that we don’t need every<br />
power of x up to 7: we need to know only the highest power of x to find out the degree. An<br />
example of a kind you may be familiar with is<br />
f(x) = 4x 2 − 2x − 4<br />
which is a polynomial of degree 2, as 2 is the highest power of x. This is called a quadratic.<br />
Functions containing other operations, such as square roots, are not polynomials. For example,<br />
f(x) = 4x 3 + √ x − 1<br />
is not a polynomial as it contains a square root. And<br />
f(x) = 5x 4 − 2x 2 + 3/x<br />
is not a polynomial as it contains a ‘divide by x’.<br />
A polynomial is a function of the form<br />
Key Point<br />
f(x) = a n x n + a n−1 x n−1 + . . . + a 2 x 2 + a 1 x + a 0 .<br />
The degree of a polynomial is the highest power of x in its expression. Constant (non-zero)<br />
polynomials, linear polynomials, quadratics, cubics and quartics are polynomials of degree 0,<br />
1, 2 , 3 and 4 respectively. The function f(x) = 0 is also a polynomial, but we say that its<br />
degree is ‘undefined’.<br />
c○ mathcentre July 18, 2005 2
3. Graphs of polynomial <strong>functions</strong><br />
We have met some of the basic polynomials already. For example, f(x) = 2 is a constant<br />
function and f(x) = 2x + 1 is a linear function.<br />
f (x)<br />
f (x) = 2x + 1<br />
2 f (x) = 2<br />
1<br />
x<br />
It is important to notice that the graphs of constant <strong>functions</strong> and linear <strong>functions</strong> are always<br />
straight lines.<br />
We have already said that a quadratic function is a polynomial of degree 2. Here are some<br />
examples of quadratic <strong>functions</strong>:<br />
f(x) = x 2 , f(x) = 2x 2 , f(x) = 5x 2 .<br />
What is the impact of changing the coefficient of x 2 as we have done in these examples? One<br />
way to find out is to sketch the graphs of the <strong>functions</strong>.<br />
f (x)<br />
f (x) = 5x 2<br />
f (x) = 2x 2<br />
f (x) = x 2<br />
x<br />
You can see from the graph that, as the coefficient of x 2 is increased, the graph is stretched<br />
vertically (that is, in the y direction).<br />
What will happen if the coefficient is negative? This will mean that all of the positive f(x) values<br />
will now become negative. So what will the graphs of the <strong>functions</strong> look like? The <strong>functions</strong> are<br />
now<br />
f(x) = −x 2 , f(x) = −2x 2 , f(x) = −5x 2 .<br />
3 c○ mathcentre July 18, 2005
f (x)<br />
x<br />
f (x) = −x 2<br />
f (x) = −2x 2<br />
f (x) = −5x 2<br />
Notice here that all of these graphs have actually been reflected in the x-axis. This will always<br />
happen for <strong>functions</strong> of any degree if they are multiplied by −1.<br />
Now let us look at some other quadratic <strong>functions</strong> to see what happens when we vary the<br />
coefficient of x, rather than the coefficient of x 2 . We shall use a table of values in order to plot<br />
the graphs, but we shall fill in only those values near the turning points of the <strong>functions</strong>.<br />
x −5 −4 −3 −2 −1 0 1 2<br />
x 2 + x 6 2 0 0 2 6<br />
x 2 + 4x 0 −3 −4 −3 0<br />
x 2 + 6x −5 −8 −9 −8 −5<br />
You can see the symmetry in each row of the table, demonstrating that we have concentrated<br />
on the region around the turning point of each function. We can now use these values to plot<br />
the graphs.<br />
f (x)<br />
f (x) = x 2 + x<br />
f (x) = x 2 + 4x<br />
x<br />
f (x) = x 2 + 6x<br />
As you can see, increasing the positive coefficient of x in this polynomial moves the graph down<br />
and to the left.<br />
c○ mathcentre July 18, 2005 4
What happens if the coefficient of x is negative?<br />
x −2 −1 0 1 2 3 4 5<br />
x 2 − x 6 2 0 0 2 6<br />
x 2 − 4x 0 −3 −4 −3 0<br />
x 2 − 6x −5 −8 −9 −8 −5<br />
Again we can use these tables of values to plot the graphs of the <strong>functions</strong>.<br />
f (x)<br />
f (x) = x 2 − x<br />
f (x) = x 2 − 4x<br />
x<br />
f (x) = x 2 − 6x<br />
As you can see, increasing the negative coefficient of x (in absolute terms) moves the graph<br />
down and to the right.<br />
So now we know what happens when we vary the x 2 coefficient, and what happens when we<br />
vary the x coefficient. But what happens when we vary the constant term at the end of our<br />
polynomial? We already know what the graph of the function f(x) = x 2 + x looks like, so how<br />
does this differ from the graph of the <strong>functions</strong> f(x) = x 2 + x + 1, or f(x) = x 2 + x + 5, or<br />
f(x) = x 2 + x − 4? As usual, a table of values is a good place to start.<br />
x −2 −1 0 1 2<br />
x 2 + x 2 0 0 2 6<br />
x 2 + x + 1 3 1 1 3 7<br />
x 2 + x + 5 7 5 5 7 11<br />
x 2 + x − 4 −2 −4 −4 −2 2<br />
Our table of values is particularly easy to complete since we can use our answers from the x 2 +x<br />
column to find everything else. We can use these tables of values to plot the graphs of the<br />
<strong>functions</strong>.<br />
5 c○ mathcentre July 18, 2005
f (x)<br />
f (x) = x 2 + x + 5<br />
f (x) = x 2 + x + 1<br />
f (x) = x 2 + x<br />
f (x) = x 2 + x − 4<br />
x<br />
As we can see straight away, varying the constant term translates the x 2 + x curve vertically.<br />
Furthermore, the value of the constant is the point at which the graph crosses the f(x) axis.<br />
4. Turning points of polynomial <strong>functions</strong><br />
A turning point of a function is a point where the graph of the function changes from sloping<br />
downwards to sloping upwards, or vice versa. So the gradient changes from negative to positive,<br />
or from positive to negative. Generally speaking, curves of degree n can have up to (n − 1)<br />
turning points.<br />
For instance, a quadratic has only one turning<br />
point.<br />
A cubic could have up to two turning points,<br />
and so would look something like this.<br />
However, some cubics have fewer turning points:<br />
for example f(x) = x 3 . But no cubic has more<br />
than two turning points.<br />
c○ mathcentre July 18, 2005 6
In the same way, a quartic could have up to<br />
three turning turning points, and so would<br />
look something like this.<br />
Again, some quartics have fewer turning points, but none has more.<br />
Key Point<br />
A polynomial of degree n can have up to (n − 1) turning points.<br />
5. Roots of polynomial <strong>functions</strong><br />
You may recall that when (x − a)(x − b) = 0, we know that a and b are roots of the function<br />
f(x) = (x − a)(x − b). Now we can use the converse of this, and say that if a and b are roots,<br />
then the polynomial function with these roots must be f(x) = (x − a)(x − b), or a multiple of<br />
this.<br />
For example, if a quadratic has roots x = 3 and x = −2, then the function must be f(x) =<br />
(x−3)(x+2), or a constant multiple of this. This can be extended to polynomials of any degree.<br />
For example, if the roots of a polynomial are x = 1, x = 2, x = 3, x = 4, then the function must<br />
be<br />
f(x) = (x − 1)(x − 2)(x − 3)(x − 4),<br />
or a constant multiple of this.<br />
Let us also think about the function f(x) = (x − 2) 2 . We can see straight away that x − 2 = 0,<br />
so that x = 2. For this function we have only one root. This is what we call a repeated root,<br />
and a root can be repeated any number of times. For example, f(x) = (x − 2) 3 (x + 4) 4 has<br />
a repeated root x = 2, and another repeated root x = −4. We say that the root x = 2 has<br />
multiplicity 3, and that the root x = −4 has multiplicity 4.<br />
The useful thing about knowing the multiplicity of a root is that it helps us with sketching the<br />
graph of the function. If the multiplicity of a root is odd then the graph cuts through the x-axis<br />
at the point (x, 0). But if the multiplicity is even then the graph just touches the x-axis at the<br />
point (x, 0).<br />
For example, take the function<br />
f(x) = (x − 3) 2 (x + 1) 5 (x − 2) 3 (x + 2) 4 .<br />
• The root x = 3 has multiplicity 2, so the graph touches the x-axis at (3, 0).<br />
7 c○ mathcentre July 18, 2005
• The root x = −1 has multiplicity 5, so the graph crosses the x-axis at (−1, 0).<br />
• The root x = 2 has multiplicity 3, so the graph crosses the x-axis at (2, 0).<br />
• The root x = −2 has multiplicity 4, so the graph touches the x-axis at (−2, 0).<br />
To take another example, suppose we have the function f(x) = (x − 2) 2 (x + 1). We can see<br />
that the largest power of x is 3, and so the function is a cubic. We know the possible general<br />
shapes of a cubic, and as the coefficient of x 3 is positive the curve must generally increase to<br />
the right and decrease to the left. We can also see that the roots of the function are x = 2 and<br />
x = −1. The root x = 2 has even multiplicity and so the curve just touches the x-axis here,<br />
whilst x = −1 has odd multiplicity and so here the curve crosses the x-axis. This means we can<br />
sketch the graph as follows.<br />
f (x)<br />
−1<br />
2<br />
x<br />
Key Point<br />
The number a is a root of the polynomial function f(x) if f(a) = 0, and this occurs when<br />
(x − a) is a factor of f(x).<br />
If a is a root of f(x), and if (x − a) m is a factor of f(x) but (x − a) m+1 is not a factor, then we<br />
say that the root has multiplicity m.<br />
At a root of odd multiplicity the graph of the function crosses the x-axis, whereas at a root of<br />
even multiplicity the graph touches the x-axis.<br />
Exercises<br />
1. What is a polynomial function?<br />
2. Which of the following <strong>functions</strong> are polynomial <strong>functions</strong>?<br />
(a) f(x) = 4x 2 + 2 (b) f(x) = 3x 3 − 2x + √ x (c) f(x) = 12 − 4x 5 + 3x 2<br />
(d) f(x) = sin x + 1 (e) f(x) = 3x 12 − 2/x (f) f(x) = 3x 11 − 2x 12<br />
c○ mathcentre July 18, 2005 8
3. Write down one example of each of the following types of polynomial function:<br />
(a) cubic (b) linear (c) quartic (d) quadratic<br />
4. Sketch the graphs of the following <strong>functions</strong> on the same axes:<br />
(a) f(x) = x 2 (b) f(x) = 4x 2 (c) f(x) = −x 2 (d) f(x) = −4x 2<br />
5. Consider a function of the form f(x) = x 2 +ax, where a represents a real number. The graph<br />
of this function is represented by a parabola.<br />
(a) When a > 0, what happens to the parabola as a increases?<br />
(b) When a < 0, what happens to the parabola as a decreases?<br />
6. Write down the maximum number of turning points on the graph of a polynomial function<br />
of degree:<br />
(a) 2 (b) 3 (c) 12 (d) n<br />
7. Write down a polynomial function with roots:<br />
(a) 1, 2, 3, 4 (b) 2, −4 (c) 12, −1, −6<br />
8. Write down the roots and identify their multiplicity for each of the following <strong>functions</strong>:<br />
(a) f(x) = (x − 2) 3 (x + 4) 4 (b) f(x) = (x − 1)(x + 2) 2 (x − 4) 3<br />
9. Sketch the following <strong>functions</strong>:<br />
(a) f(x) = (x − 2) 2 (x + 1) (b) f(x) = (x − 1) 2 (x + 3)<br />
Answers<br />
1. A polynomial function is a function that can be written in the form<br />
f(x) = a n x n + a n−1 x n−1 + a n−2 x n−2 + . . . + a 2 x 2 + a 1 x + a 0 ,<br />
where each a 0 , a 1 , etc. represents a real number, and where n is a natural number (including<br />
0).<br />
2.<br />
(a) f(x) = 4x 2 + 2 is a polynomial<br />
(b) f(x) = 3x 3 − 2x + √ x is not a polynomial, because of √ x<br />
(c) f(x) = 12 − 4x 5 + 3x 2 is a polynomial<br />
(d) f(x) = sin x + 1 is not a polynomial, because of sinx<br />
(e) f(x) = 3x 12 − 2/x is not a polynomial, because of 2/x<br />
(f) f(x) = 3x 11 − 2x 12 is a polynomial<br />
3.<br />
(a) The highest power of x must be 3, so examples might be f(x) = x 3 − 2x + 1 or f(x) =<br />
x 3 − 2.<br />
(b) The highest power of x must be 1, so examples might be f(x) = x or f(x) = 6x − 5.<br />
(c) The highest power of x must be 4, so examples might be f(x) = x 4 − 3x 3 + 2x or<br />
f(x) = x 4 − x − 5.<br />
(d) The highest power of x must be 2, so examples might be f(x) = x 2 or f(x) = x 2 − 5.<br />
4.<br />
9 c○ mathcentre July 18, 2005
f (x)<br />
f (x) = 4x 2<br />
f (x) = x 2<br />
x<br />
f (x) = −x 2<br />
5.<br />
(a)<br />
(b)<br />
f (x) = −4x 2<br />
When a > 0, the parabola moves down and to the left as a increases.<br />
When a < 0, the parabola moves down and to the right as a decreases.<br />
6.<br />
(a) 1 turning point (b) 2 turning points (c) 11 turning points<br />
(d) (n − 1) turning points.<br />
7.<br />
(a)<br />
(b)<br />
(c)<br />
f(x) = (x − 1)(x − 2)(x − 3)(x − 4) or a multiple<br />
f(x) = (x − 2)(x + 4) or a multiple<br />
f(x) = (x − 12)(x + 1)(x + 6) or a multiple.<br />
8.<br />
(a) x = 2 odd multiplicity<br />
x = −4 even multiplicity<br />
(b) x = 1 odd multiplicity<br />
x = −2 even multiplicity<br />
x = 4 odd multiplicity<br />
c○ mathcentre July 18, 2005 10
9)<br />
f (x)<br />
f (x) = (x − 1) 2 (x + 3)<br />
f (x) = (x − 2) 2 (x + 1)<br />
x<br />
11 c○ mathcentre July 18, 2005