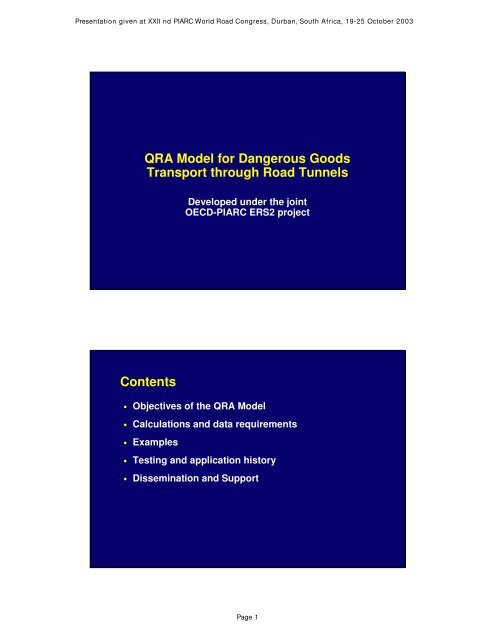
QRA Model for Dangerous Goods Transport through Road Tunnels ...
QRA Model for Dangerous Goods Transport through Road Tunnels ...
QRA Model for Dangerous Goods Transport through Road Tunnels ...

You also want an ePaper? Increase the reach of your titles
YUMPU automatically turns print PDFs into web optimized ePapers that Google loves.
Presentation given at XXII nd PIARC World <strong>Road</strong> Congress, Durban, South Africa, 19-25 October 2003<br />
<strong>QRA</strong> <strong>Model</strong> <strong>for</strong> <strong>Dangerous</strong> <strong>Goods</strong><br />
<strong>Transport</strong> <strong>through</strong> <strong>Road</strong> <strong>Tunnels</strong><br />
Developed under the joint<br />
OECD-PIARC ERS2 project<br />
Contents<br />
• Objectives of the <strong>QRA</strong> <strong>Model</strong><br />
• Calculations and data requirements<br />
• Examples<br />
• Testing and application history<br />
• Dissemination and Support<br />
Page 1
Presentation given at XXII nd PIARC World <strong>Road</strong> Congress, Durban, South Africa, 19-25 October 2003<br />
<strong>QRA</strong> Objectives<br />
• Compare risks due to <strong>Dangerous</strong> <strong>Goods</strong> (DG) transport<br />
<strong>for</strong> alternative routes<br />
• Compare DG risks with acceptability criteria<br />
• Evaluate tunnel regulations <strong>for</strong> DG traffic<br />
• Evaluate tunnel equipment options<br />
<strong>QRA</strong> <strong>Model</strong> produces F-N curves<br />
• Number of Casualties<br />
• Cumulative Frequency (= 1 / Return Period)<br />
Cumulated frequency (1/year) .<br />
1.E-01<br />
1.E-02<br />
1.E-03<br />
1.E-04<br />
1.E-05<br />
1.E-06<br />
150 fatalities incident<br />
every 10,000 years<br />
10 fatalities incident<br />
every 1000 years<br />
10<br />
100<br />
1,000<br />
10,000<br />
100,000<br />
1,000,000<br />
Return period (years)<br />
1.E-07<br />
10,000,000<br />
1 10 100 1000<br />
Number of fatalities<br />
Page 2
Presentation given at XXII nd PIARC World <strong>Road</strong> Congress, Durban, South Africa, 19-25 October 2003<br />
How are F-N curves produced?<br />
• Assessment of all situations is impossible…<br />
… simplification is necessary<br />
• Methodology<br />
− Small number of representative DG scenarios<br />
− Accident frequencies<br />
− Physical consequences in open and within tunnel(s)<br />
− Physiological effects on people<br />
− Take account of escape and sheltering<br />
− Calculate risk of death or injury<br />
Representative DG scenarios<br />
1 Empty / non-combustible load 20MW HGV fire<br />
2 Combustible load 100MW HGV fire<br />
3 LPG BLEVE (cylinder)<br />
4 Motor spirit Pool fire<br />
5 Motor spirit VCE<br />
6 Chlorine Toxic gas release<br />
7 LPG BLEVE (bulk tank)<br />
8 LPG VCE<br />
9 LPG Torch fire<br />
10 Ammonia Toxic gas release<br />
11 Acrolein Toxic release (bulk tank)<br />
12 Acrolein Toxic release (cylinder)<br />
13 Non-flammable liquefied gas BLEVE<br />
Page 3
Presentation given at XXII nd PIARC World <strong>Road</strong> Congress, Durban, South Africa, 19-25 October 2003<br />
Input data - Routes and <strong>Tunnels</strong><br />
• Routes<br />
− defined in sections<br />
− constant carriageway geometry, traffic and accident rate<br />
• Tunnel<br />
− defined in sections of constant geometry and ventilation<br />
− ventilation (may need specialist help <strong>for</strong> complex tunnels)<br />
− drainage<br />
− emergency egress (warning systems, spacing of exits)<br />
− structural parameters (lining, overburden, fire rating)<br />
Input data - Traffic<br />
• Traffic flow<br />
− defined <strong>for</strong> each route section,<br />
traffic direction and time period<br />
− vehicle mix (light vehicles,<br />
buses/coaches, HGVs)<br />
− traffic speeds<br />
• <strong>Dangerous</strong> <strong>Goods</strong> vehicles<br />
− DG traffic flow<br />
− proportions of different<br />
classes of dangerous goods<br />
1200<br />
1000<br />
800<br />
600<br />
400<br />
200<br />
Veh/hr<br />
0<br />
19:00 - 07:00<br />
07:00 - 19:00<br />
1 2 3 4 5 6 7 8 9<br />
Month<br />
10 11 12<br />
Page 4
Presentation given at XXII nd PIARC World <strong>Road</strong> Congress, Durban, South Africa, 19-25 October 2003<br />
Input data - Accident Frequencies<br />
• HGV accident rates<br />
− according to road type, speed limit, etc<br />
− default data provided from France, Canada and Norway<br />
− use correct national or local statistics where available<br />
• Apply correction factor <strong>for</strong> DG vehicles<br />
• Conditional probability of DG scenario,<br />
once a DG vehicle is involved in an accident<br />
Input data - Population & Meteorology<br />
• Population density<br />
− grid-based data<br />
− according to period<br />
(day/night)<br />
• Wind data<br />
− frequency according to:<br />
− wind speed<br />
− direction<br />
− stability class<br />
Page 5
Presentation given at XXII nd PIARC World <strong>Road</strong> Congress, Durban, South Africa, 19-25 October 2003<br />
Hazard Analysis<br />
• Fire<br />
− HGV or hydrocarbon pool fire, radiant heat and smoke spread<br />
• VCE (Vapour Cloud Explosion)<br />
− liquid release, evaporation, gas dispersion, ignition, blast effects<br />
• BLEVE (Boiling Liquid Expanding Vapour Explosion)<br />
− catastrophic failure of tank heated by fire, blast and fireball effects<br />
• Toxic release<br />
− dispersion of toxic gas cloud along tunnel or in open air<br />
Lethality Ranges<br />
• <strong>Tunnels</strong><br />
90%<br />
50%<br />
1%<br />
• Open air<br />
90% 50% 1%<br />
Page 6
Presentation given at XXII nd PIARC World <strong>Road</strong> Congress, Durban, South Africa, 19-25 October 2003<br />
Casualty Analysis<br />
• Lethality ranges<br />
− hazard ranges <strong>for</strong> radiant heat, toxic concentration & overpressure<br />
− exposure duration<br />
− hazardous dose<br />
− probit equations<br />
− % fatalities (and/or injuries)<br />
• Population<br />
− road users and/or local population<br />
− possibility of escape and sheltering<br />
• Number of fatalities = %fatalities x people present<br />
<strong>QRA</strong> <strong>Model</strong> Software<br />
• Software<br />
− based on Microsoft Excel with Visual Basic programming<br />
− data entry screens to assist the user<br />
− User Manual<br />
data preparation, entry and processing<br />
− Reference Manual theoretical basis and examples<br />
• Latest release<br />
− <strong>QRA</strong>M v3.60 released 2003<br />
Page 7
Presentation given at XXII nd PIARC World <strong>Road</strong> Congress, Durban, South Africa, 19-25 October 2003<br />
Example 1 - Compare Routes<br />
• 6 shipments of bulk chlorine<br />
East-to-West every day<br />
• 6 shipments of bulk bromine<br />
West-to-East every day<br />
• Dual carriageway coastal route<br />
passing <strong>through</strong> 3 tunnels<br />
• Single carriageway <strong>through</strong><br />
mountainous region<br />
• Which route is safer?<br />
Example 1 - Comparison of F-N Curves<br />
• Route via tunnels<br />
• Alternative open route<br />
1.E-01<br />
1.E-01<br />
1.E-02<br />
Fires in<br />
tunnels<br />
1.E-02<br />
Chlorine<br />
releases<br />
Cumulated frequency (1/year)<br />
1.E-03<br />
1.E-04<br />
1.E-05<br />
Cumulated frequency (1/year)<br />
1.E-03<br />
1.E-04<br />
1.E-05<br />
1.E-06<br />
1.E-06<br />
1.E-07<br />
1 10 100 1000<br />
Number of fatalities<br />
1.E-07<br />
1 10 100 1000<br />
Number of fatalities<br />
Page 8
Presentation given at XXII nd PIARC World <strong>Road</strong> Congress, Durban, South Africa, 19-25 October 2003<br />
Example 1 - Route Conclusions<br />
• Risks along alternative (open) route greater than<br />
risks along tunnel route<br />
− chlorine risk dominates along open route<br />
− HGV fire risk dominates in tunnels<br />
− larger number of people at risk along open route<br />
Example 2 - Acceptability Criteria<br />
• Compare DG risks with acceptability criteria<br />
− criteria are specific to country and application<br />
− subjective issues (risk aversion, etc)<br />
1.E-01<br />
Cumulated frequency (1/year) .<br />
1.E-02<br />
1.E-03<br />
1.E-04<br />
1.E-05<br />
Negligible risk<br />
1.E-06<br />
1.E-07<br />
1 10 100 1000<br />
Number of fatalities<br />
Intolerable risk<br />
Risk tolerable<br />
if risk reduction<br />
impracticable or<br />
cost too high<br />
Page 9
Presentation given at XXII nd PIARC World <strong>Road</strong> Congress, Durban, South Africa, 19-25 October 2003<br />
Example 3 - Evaluate Equipment Options<br />
• Investigate ‘what if ?’ scenarios<br />
• Existing tunnel<br />
− 650m single bore, no emergency exits<br />
− no CCTV or detection systems<br />
• Possible improvements to reduce risks during prolonged<br />
contraflow traffic operations<br />
− install additional escape route(s)<br />
− upgrade detection/surveillance<br />
− upgrade traffic control and communications<br />
Example 3 - <strong>QRA</strong> Results <strong>for</strong> Options<br />
Traffic<br />
Single<br />
direction<br />
Tunnel<br />
ventilation<br />
Y<br />
Upgrade detection<br />
&<br />
communications<br />
-<br />
Fatalities/year<br />
0.09<br />
Bi-directional<br />
-<br />
-<br />
0.30<br />
Bi-directional<br />
-<br />
Y<br />
0.06<br />
Single<br />
direction<br />
Y<br />
Y<br />
0.02<br />
Page 10
Presentation given at XXII nd PIARC World <strong>Road</strong> Congress, Durban, South Africa, 19-25 October 2003<br />
Software Evaluation and Usage<br />
• Evaluation studies<br />
− Austria, France, Netherlands, Norway<br />
− Spain, Sweden, Switzerland<br />
− Germany (trial pending)<br />
• Practical studies<br />
− France (20 studies) regulatory role<br />
− Greece (1 study) possible regulatory role<br />
− UK (3 studies)<br />
Dissemination and Support<br />
• Responsibilities<br />
− contract between PIARC and OECD<br />
− dissemination and support led by WG5 on behalf of C5<br />
• Software distribution<br />
− CD-ROM sold (at low price to cover costs), and/or<br />
− freely downloadable from PIARC website<br />
• Support<br />
− direct arrangement between developers and users<br />
− training courses<br />
− user group meetings<br />
Page 11
Presentation given at XXII nd PIARC World <strong>Road</strong> Congress, Durban, South Africa, 19-25 October 2003<br />
Future Development<br />
• Only very limited maintenance by PIARC<br />
• Development by users authorised<br />
− encouraged to make modified models available to PIARC and<br />
other users<br />
• Future development possible <strong>through</strong> international<br />
projects or by individual countries / bodies<br />
Page 12