Equal Employment Opportunity and Minority Hiring Practices Report ...
Equal Employment Opportunity and Minority Hiring Practices Report ...
Equal Employment Opportunity and Minority Hiring Practices Report ...

Create successful ePaper yourself
Turn your PDF publications into a flip-book with our unique Google optimized e-Paper software.
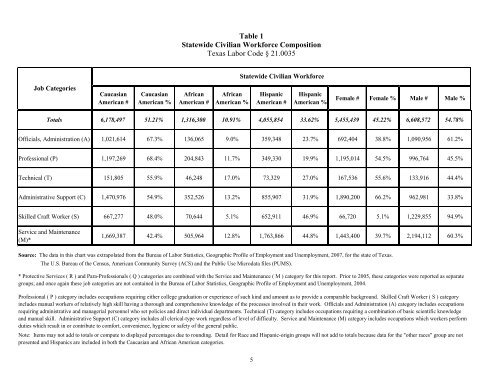
Table 1<br />
Statewide Civilian Workforce Composition<br />
Texas Labor Code § 21.0035<br />
Statewide Civilian Workforce<br />
Job Categories<br />
Caucasian<br />
American #<br />
Caucasian<br />
American %<br />
African<br />
American #<br />
African<br />
American %<br />
Hispanic<br />
American #<br />
Hispanic<br />
American %<br />
Female # Female % Male # Male %<br />
Totals 6,178,497 51.21% 1,316,300 10.91% 4,055,854 33.62% 5,455,439 45.22% 6,608,572 54.78%<br />
Officials, Administration (A) 1,021,614 67.3% 136,065 9.0% 359,348 23.7% 692,404 38.8% 1,090,956 61.2%<br />
Professional (P) 1,197,269 68.4% 204,843 11.7% 349,330 19.9% 1,195,014 54.5% 996,764 45.5%<br />
Technical (T) 151,805 55.9% 46,248 17.0% 73,329 27.0% 167,536 55.6% 133,916 44.4%<br />
Administrative Support (C) 1,470,976 54.9% 352,526 13.2% 855,907 31.9% 1,890,200 66.2% 962,981 33.8%<br />
Skilled Craft Worker (S) 667,277 48.0% 70,644 5.1% 652,911 46.9% 66,720 5.1% 1,229,855 94.9%<br />
Service <strong>and</strong> Maintenance<br />
(M)*<br />
1,669,387 42.4% 505,964 12.8% 1,763,866 44.8% 1,443,400 39.7% 2,194,112 60.3%<br />
Source: The data in this chart was extrapolated from the Bureau of Labor Statistics, Geographic Profile of <strong>Employment</strong> <strong>and</strong> Unemployment, 2007, for the state of Texas.<br />
The U.S. Bureau of the Census, American Community Survey (ACS) <strong>and</strong> the Public Use Microdata files (PUMS).<br />
* Protective Services ( R ) <strong>and</strong> Para-Professionals ( Q ) categories are combined with the Service <strong>and</strong> Maintenance ( M ) category for this report. Prior to 2005, these categories were reported as separate<br />
groups; <strong>and</strong> once again these job categories are not contained in the Bureau of Labor Statistics, Geographic Profile of <strong>Employment</strong> <strong>and</strong> Unemployment, 2004.<br />
Professional ( P ) category includes occupations requiring either college graduation or experience of such kind <strong>and</strong> amount as to provide a comparable background. Skilled Craft Worker ( S ) category<br />
includes manual workers of relatively high skill having a thorough <strong>and</strong> comprehensive knowledge of the processes involved in their work. Officials <strong>and</strong> Administration (A) category includes occupations<br />
requiring administrative <strong>and</strong> managerial personnel who set policies <strong>and</strong> direct individual departments. Technical (T) category includes occupations requiring a combination of basic scientific knowledge<br />
<strong>and</strong> manual skill. Administrative Support (C) category includes all clerical-type work regardless of level of difficulty. Service <strong>and</strong> Maintenance (M) category includes occupations which workers perform<br />
duties which result in or contribute to comfort, convenience, hygiene or safety of the general public.<br />
Note: Items may not add to totals or compute to displayed percentages due to rounding. Detail for Race <strong>and</strong> Hispanic-origin groups will not add to totals because data for the "other races" group are not<br />
presented <strong>and</strong> Hispanics are included in both the Caucasian <strong>and</strong> African American categories.<br />
5