Equal Employment Opportunity and Minority Hiring Practices Report ...
Equal Employment Opportunity and Minority Hiring Practices Report ...
Equal Employment Opportunity and Minority Hiring Practices Report ...
Create successful ePaper yourself
Turn your PDF publications into a flip-book with our unique Google optimized e-Paper software.
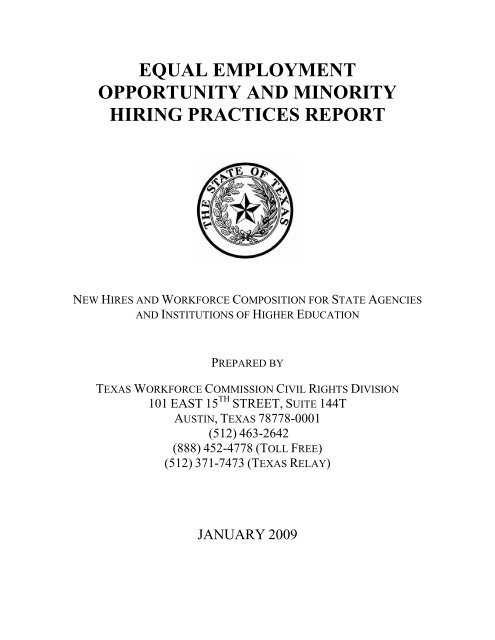
EQUAL EMPLOYMENT<br />
OPPORTUNITY AND MINORITY<br />
HIRING PRACTICES REPORT<br />
NEW HIRES AND WORKFORCE COMPOSITION FOR STATE AGENCIES<br />
AND INSTITUTIONS OF HIGHER EDUCATION<br />
PREPARED BY<br />
TEXAS WORKFORCE COMMISSION CIVIL RIGHTS DIVISION<br />
101 EAST 15 TH STREET, SUITE 144T<br />
AUSTIN, TEXAS 78778-0001<br />
(512) 463-2642<br />
(888) 452-4778 (TOLL FREE)<br />
(512) 371-7473 (TEXAS RELAY)<br />
JANUARY 2009
Tom Pauken, Chairman<br />
Ronald G. Congleton<br />
Commissioner Representing<br />
Labor<br />
Andres Alcantar<br />
Commissioner Representing the<br />
Public<br />
January 12, 2009<br />
Larry E. Temple<br />
Executive Director<br />
The Honorable Rick Perry<br />
Governor of the State of Texas<br />
Office of the Governor<br />
P.O. Box 12428<br />
Austin TX 78711-2428<br />
SUBJECT: 2009 <strong>Equal</strong> <strong>Employment</strong> <strong>Opportunity</strong> <strong>and</strong> <strong>Minority</strong> <strong>Hiring</strong> <strong>Practices</strong> <strong>Report</strong><br />
Dear Governor Perry:<br />
Enclosed is the combined 2009 <strong>Equal</strong> <strong>Employment</strong> <strong>Opportunity</strong> <strong>and</strong> <strong>Minority</strong> <strong>Hiring</strong> <strong>Practices</strong><br />
<strong>Report</strong> prepared by the Texas Workforce Commission’s Civil Rights Division.<br />
This report has been prepared to fulfill the reporting requirements of Texas Labor Code §§<br />
21.0035 (Statewide Civilian Workforce Composition), 21.504 (State Agency <strong>Minority</strong> <strong>Hiring</strong> <strong>Practices</strong><br />
<strong>Report</strong>) <strong>and</strong> 21.553 (<strong>Equal</strong> <strong>Employment</strong> <strong>Opportunity</strong> <strong>Report</strong>) <strong>and</strong> provides information by prescribed<br />
categories on, respectively, the composition of the statewide civilian workforce, new hires for state<br />
agencies <strong>and</strong> institutions of higher education, <strong>and</strong> the composition of state agencies <strong>and</strong> institutions of<br />
higher education.<br />
We hope that you find the report valuable. Please do not hesitate to contact us should you have<br />
any questions.<br />
Sincerely,<br />
Tom Pauken<br />
Chairman<br />
Ronald Congleton<br />
Commissioner Representing Labor<br />
Andres Alcantar<br />
Commissioner Representing Public<br />
101 E. 15th Street • Austin, Texas 78778-0001 • (512) 463-2222 • Relay Texas: 800-735-2989 (TDD) 800-735-2988 (Voice) •<br />
www.texasworkforce.org<br />
<strong>Equal</strong> <strong>Opportunity</strong> Employer / Services
EQUAL EMPLOYMENT OPPORTUNITY AND MINORITY HIRING PRACTICES REPORT<br />
COVERING<br />
STATE AGENCIES AND INSTITUTIONS OF HIGHER EDUCATION<br />
TABLE OF CONTENTS<br />
I. PURPOSE……………………………………………………………………………………..1<br />
Page<br />
II.<br />
METHODOLOGY……………………………………………………………………………...1<br />
III. RESULTS AND OBSERVATIONS……………………………………………………………….3<br />
IV. TABLES/CHARTS …………………………………………………………………………….4<br />
TABLE 1.<br />
TABLE 2.<br />
CHART 1.<br />
CHART 2.<br />
CHART 3.<br />
CHART 4.<br />
CHART 5.<br />
STATEWIDE CIVILIAN WORKFORCE COMPOSITION………………………………………………………5<br />
STATE AGENCIES WORKFORCE COMPOSITION…………………………………………………………...6<br />
STATISTICAL AVAILABILITY OF AFRICAN-AMERICANS, HISPANIC-AMERICANS, AND FEMALES<br />
IN THE STATEWIDE CIVILIAN WORKFORCE………………………………………………………………7<br />
STATISTICAL AVAILABILITY OF AFRICAN-AMERICANS, HISPANIC-AMERICANS, AND FEMALES<br />
IN THE STATE AGENCIES WORKFORCE…………………………………………………………………...7<br />
STATISTICAL COMPARISON OF THE AVAILABILITY OF AFRICAN-AMERICANS IN THE STATEWIDE<br />
CIVILIAN WORKFORCE AND THEIR REPRESENTATION IN STATE AGENCIES WORKFORCE………………8<br />
STATISTICAL COMPARISON OF THE AVAILABILITY OF HISPANIC-AMERICANS IN THE STATEWIDE<br />
CIVILIAN WORKFORCE AND THEIR REPRESENTATION IN STATE AGENCIES WORKFORCE……………8<br />
STATISTICAL COMPARISON OF THE AVAILABILITY OF FEMALES IN THE STATEWIDE<br />
CIVILIAN WORKFORCE AND THEIR REPRESENTATION IN STATE AGENCIES WORKFORCE……………9<br />
SUMMARIES OF STATEWIDE STATISTICAL DATA FOR STATE AGENCIES<br />
FISCAL YEAR 2007 AND 2008………………………………………………………………………ATTACHMENTS 1 - 4<br />
SUMMARIES OF STATEWIDE STATISTICAL DATA FOR<br />
INSTITUTIONS OF HIGHER EDUCATION FY 2007 AND 2008………………………………………ATTACHMENTS 5 - 8<br />
NOTE: DETAILED REPORTS FOR ALL STATE AGENCIES AND INSTITUTIONS OF HIGHER EDUCATION<br />
CAN BE FOUND ON THE CIVIL RIGHTS DIVISION’S WEB SITE AT WWW.TEXASWORKFORCE.ORG.
I. Purpose<br />
The purpose of the <strong>Equal</strong> <strong>Employment</strong> <strong>Opportunity</strong> <strong>and</strong> <strong>Minority</strong> <strong>Hiring</strong> <strong>Practices</strong> <strong>Report</strong><br />
is to provide demographic information to the Governor, the Legislature, <strong>and</strong> the<br />
Legislative Budget Board in compliance with Texas Labor Code §§ 21.0035, 21.504, <strong>and</strong><br />
21.553. This report combines the following statutory reporting requirements:<br />
• Texas Labor Code § 21.0035 requires a biennial report to the Governor <strong>and</strong><br />
Legislature regarding the percentage of the statewide civilian workforce composed<br />
of Caucasian-Americans, African-Americans, Hispanic-Americans, females, <strong>and</strong><br />
males in the job categories of state agency administration, professional, technical,<br />
protective services, paraprofessional, administrative support, skilled craft, <strong>and</strong><br />
service <strong>and</strong> maintenance.<br />
• Texas Labor Code § 21.504 requires an annual report to the Governor <strong>and</strong><br />
Legislative Budget Board regarding the total number of African-Americans,<br />
Hispanic-Americans, females, <strong>and</strong> other persons hired for each job category listed<br />
above by state agencies during the preceding state fiscal year.<br />
• Texas Labor Code § 21.553 requires a biennial report to the Legislature containing<br />
an analysis of EEO information for the preceding two fiscal years (obtained pursuant<br />
to § 21.552) regarding new hires <strong>and</strong> the workforce composition of state agencies<br />
<strong>and</strong> institutions of higher education.<br />
II. Methodology<br />
Statewide Civilian Workforce Percentage Composition per Texas Labor Code § 21.0035:<br />
The data used to report the percentage composition of the statewide civilian<br />
workforce was extrapolated from the U.S. Department of Labor Bureau of Labor<br />
Statistics (BLS), Geographic Profile of <strong>Employment</strong> <strong>and</strong> Unemployment, 2007,<br />
Table 15, Percent of Distribution of Employed Persons by Sex, Race, Hispanic<br />
Origin, <strong>and</strong> Occupation for the state of Texas, which is the most recent BLS data,<br />
the U.S. Census Bureau, American Community Survey (ACS), <strong>and</strong> the Public Use<br />
Microdata Files (PUMs). Prior to 2005, EEO-1 <strong>and</strong> EEO-4 reports were used to<br />
compile this data for all job categories but, pursuant to TWC Rule 819.21, this<br />
report shall be prepared using the best available data from all appropriate sources.<br />
However, the BLS does not collect data for the protective services <strong>and</strong><br />
paraprofessional job categories, <strong>and</strong> data for these two categories is not a subset of<br />
any published groups <strong>and</strong> cannot be compiled from BLS data. Therefore, in this<br />
<strong>Report</strong>, to supply numbers for these two statutorily required categories, data from<br />
the microdata sample of the American Community Survey (PUMS-ACS) reports<br />
was utilized as a proxy for the BLS data.<br />
1
New Hires <strong>and</strong> Workforce Composition for State Agencies <strong>and</strong> Institutions of Higher<br />
Education as per Texas Labor Code § 21.504:<br />
The Civil Rights Division of the Texas Workforce Commission (TWC) coordinated<br />
data collection for state agencies <strong>and</strong> institutions of higher education with the<br />
Comptroller of Public Accounts, Human Resources Information System (HRIS).<br />
The information on the total number of African-Americans, Hispanic-Americans,<br />
females, <strong>and</strong> other persons for state agencies <strong>and</strong> institutions of higher education<br />
was extracted from data entered into the Uniform Statewide Payroll/Personnel<br />
System (USPS) or reported to the (HRIS) or the St<strong>and</strong>ardized Payroll/Personnel<br />
<strong>Report</strong>ing System (SPRS).<br />
This report contains new hires <strong>and</strong> workforce summaries for state agencies <strong>and</strong><br />
institutions of higher education for fiscal years 2007 <strong>and</strong> 2008 (Attachments 1<br />
through 8). The summaries show the combined total for new hires <strong>and</strong> the<br />
combined total workforce of state agencies <strong>and</strong> institutions of higher education. The<br />
summaries also show the percentages of African-Americans, Hispanic-Americans,<br />
<strong>and</strong> females in the job categories of state agency administration, professional,<br />
technical, administrative support, skilled craft, <strong>and</strong> service <strong>and</strong> maintenance (which<br />
include protective services <strong>and</strong> paraprofessional).<br />
Analysis of EEO Information for the Preceding Fiscal Year as per Texas Labor<br />
Code § 21.553:<br />
The Civil Rights Division conducted a workforce analysis using the 80 percent<br />
benchmark of 29 C.F.R., Part 1607, EEOC’s Uniform Guidelines on Employee<br />
Selection, to determine if African-Americans, Hispanic-Americans, <strong>and</strong> females are<br />
underutilized in state agencies. A selection rate for any race, sex, or ethnic group<br />
that is less than 80 percent of the rate for the group with the highest rate will<br />
generally be regarded by Federal enforcement agencies as evidence of adverse<br />
impact, while a greater than 80 percent rate will generally not be regarded by<br />
Federal enforcement agencies as evidence of adverse impact. The division has taken<br />
the 80 percent benchmark <strong>and</strong> applied it to the workforce of the state agencies.<br />
The division compared the percentages of African-Americans, Hispanic-Americans,<br />
<strong>and</strong> females in the available workforce (using the statewide civilian workforce<br />
composition) to the workforce of the state agencies for fiscal year 2007. This<br />
methodology incorporates the workforce analysis methodology required<br />
by state agencies as per Texas Labor Code § 21.501. The analysis reports on how<br />
Texas is doing in the areas of recruitment <strong>and</strong> retention of African-Americans,<br />
Hispanic-Americans, <strong>and</strong> females in state government.<br />
This report does not include information on state agency employees with<br />
disabilities, as the division, in consultation with the Office of the Comptroller,<br />
believes that this data does not tend to be reported on a consistent or uniform basis<br />
due in part to its sensitivity.<br />
2
III. Results <strong>and</strong> Observations<br />
In the aggregate, state agencies are doing a good job in recruiting <strong>and</strong> retaining African-<br />
Americans (Chart 3) <strong>and</strong> females (Chart 5). Using the 80 percent <strong>Equal</strong> <strong>Employment</strong><br />
<strong>Opportunity</strong> Commission (EEOC) benchmark, African-Americans are well represented<br />
as shown in this report in proportion to the available workforce as they were in 2007.<br />
However, Hispanic-Americans (Chart 4) are underutilized in the job categories of<br />
Officials, Administration (26 percent), Professionals (5 percent), Technical (3 percent),<br />
showed no improvement in the Skilled Craft (28 percent as compared to 5.2 percent in<br />
2007), <strong>and</strong> are underutilized in the Service/Maintenance category (25 percent as<br />
compared to 13.06 percent in 2007). In the 2007 report; Females were not underutilized<br />
in any category (Chart 5).<br />
Heads of state agencies <strong>and</strong> institutions of higher education should use the information in<br />
this report, in conjunction with their own analyses of their current workforce required by<br />
Texas Labor Code § 21.501, to develop a recruitment plan as required by Texas Labor<br />
Code § 21.502, that addresses any underutilization in identified job categories.<br />
Acknowledgments<br />
The TWC Civil Rights Division would like to thank the Office of the Comptroller,<br />
Human Resource Information System (HRIS) for their assistance <strong>and</strong> cooperation in the<br />
preparation of this report. The division would also like to thank the Texas Workforce<br />
Commission Labor Market <strong>and</strong> Career Information Section for its assistance preparing<br />
this report.<br />
3
IV. Table/Charts<br />
4
Table 1<br />
Statewide Civilian Workforce Composition<br />
Texas Labor Code § 21.0035<br />
Statewide Civilian Workforce<br />
Job Categories<br />
Caucasian<br />
American #<br />
Caucasian<br />
American %<br />
African<br />
American #<br />
African<br />
American %<br />
Hispanic<br />
American #<br />
Hispanic<br />
American %<br />
Female # Female % Male # Male %<br />
Totals 6,178,497 51.21% 1,316,300 10.91% 4,055,854 33.62% 5,455,439 45.22% 6,608,572 54.78%<br />
Officials, Administration (A) 1,021,614 67.3% 136,065 9.0% 359,348 23.7% 692,404 38.8% 1,090,956 61.2%<br />
Professional (P) 1,197,269 68.4% 204,843 11.7% 349,330 19.9% 1,195,014 54.5% 996,764 45.5%<br />
Technical (T) 151,805 55.9% 46,248 17.0% 73,329 27.0% 167,536 55.6% 133,916 44.4%<br />
Administrative Support (C) 1,470,976 54.9% 352,526 13.2% 855,907 31.9% 1,890,200 66.2% 962,981 33.8%<br />
Skilled Craft Worker (S) 667,277 48.0% 70,644 5.1% 652,911 46.9% 66,720 5.1% 1,229,855 94.9%<br />
Service <strong>and</strong> Maintenance<br />
(M)*<br />
1,669,387 42.4% 505,964 12.8% 1,763,866 44.8% 1,443,400 39.7% 2,194,112 60.3%<br />
Source: The data in this chart was extrapolated from the Bureau of Labor Statistics, Geographic Profile of <strong>Employment</strong> <strong>and</strong> Unemployment, 2007, for the state of Texas.<br />
The U.S. Bureau of the Census, American Community Survey (ACS) <strong>and</strong> the Public Use Microdata files (PUMS).<br />
* Protective Services ( R ) <strong>and</strong> Para-Professionals ( Q ) categories are combined with the Service <strong>and</strong> Maintenance ( M ) category for this report. Prior to 2005, these categories were reported as separate<br />
groups; <strong>and</strong> once again these job categories are not contained in the Bureau of Labor Statistics, Geographic Profile of <strong>Employment</strong> <strong>and</strong> Unemployment, 2004.<br />
Professional ( P ) category includes occupations requiring either college graduation or experience of such kind <strong>and</strong> amount as to provide a comparable background. Skilled Craft Worker ( S ) category<br />
includes manual workers of relatively high skill having a thorough <strong>and</strong> comprehensive knowledge of the processes involved in their work. Officials <strong>and</strong> Administration (A) category includes occupations<br />
requiring administrative <strong>and</strong> managerial personnel who set policies <strong>and</strong> direct individual departments. Technical (T) category includes occupations requiring a combination of basic scientific knowledge<br />
<strong>and</strong> manual skill. Administrative Support (C) category includes all clerical-type work regardless of level of difficulty. Service <strong>and</strong> Maintenance (M) category includes occupations which workers perform<br />
duties which result in or contribute to comfort, convenience, hygiene or safety of the general public.<br />
Note: Items may not add to totals or compute to displayed percentages due to rounding. Detail for Race <strong>and</strong> Hispanic-origin groups will not add to totals because data for the "other races" group are not<br />
presented <strong>and</strong> Hispanics are included in both the Caucasian <strong>and</strong> African American categories.<br />
5
Table 2<br />
State Agencies Workforce Composition<br />
Fiscal Year 2008<br />
State Agency Workforce Composition<br />
Job Categories<br />
Total Employees<br />
Caucasian<br />
American #<br />
Caucasian<br />
American %<br />
African<br />
American #<br />
African<br />
American %<br />
Hispanic<br />
American #<br />
Hispanic<br />
American %<br />
Female # Female % Male # Male %<br />
Totals 340,467 187,346 55.03% 59,469 17.47% 67,450 19.81% 192,169 56.44% 148,298 43.56%<br />
Officials, Administration (A) 14,916 11,021 73.89% 1,350 9.05% 1,908 12.79% 7,356 49.32% 7,560 50.68%<br />
Professional (P) 150,097 92,431 61.58% 16,899 11.26% 22,302 14.86% 82,797 55.16% 67,300 44.84%<br />
Technical (T) 31,831 16,626 52.23% 4,872 15.31% 6,590 20.70% 16,589 52.12% 15,242 47.88%<br />
Administrative Support (C) 42,341 21,219 50.11% 8,252 19.49% 11,657 27.53% 37,328 88.16% 5,013 11.84%<br />
Skilled Craft Worker (S) 10,848 7,124 65.67% 856 7.89% 2,646 24.39% 486 4.48% 10,362 95.52%<br />
Service <strong>and</strong> Maintenance (M)* 90,434 38,925 43.04% 27,240 30.12% 22,347 24.71% 47,613 52.65% 42,821 47.35%<br />
.<br />
6
The following charts are derived from the data of Tables 1 <strong>and</strong> 2<br />
Chart 1. Statistical Availability of African Americans, Hispanic<br />
Americans, <strong>and</strong> Females in the Statewide Civilian Workforce<br />
80%<br />
60%<br />
40%<br />
20%<br />
0%<br />
African<br />
Americans<br />
Hispanic<br />
Americans<br />
Fem ales<br />
A=Officials/Administration 9 23.7 38.8<br />
P=Professional 11.7 19.9 54.5<br />
T=Technical 17 27 55.6<br />
C=Administrative Support 13.2 31.9 66.2<br />
S=Skilled Craft 5.1 46.9 5.1<br />
M=Service <strong>and</strong> Maintenance* 12.8 44.8 39.7<br />
* In the past, the Protective Services (R) <strong>and</strong> Para-Professional (Q) categories were each reported as separate groups; however,<br />
these job categories are not contained in the Bureau of Labor Statistics, Geographic Profile of <strong>Employment</strong> <strong>and</strong> Unemployment,<br />
2004. These job categories are combined with the Service/Maintenance (M) category.<br />
Chart 2. Statistical Availability of African Americans, Hispanic<br />
Americans, <strong>and</strong> Females in the State Agencies Workforce<br />
100<br />
90<br />
80<br />
70<br />
60<br />
50<br />
40<br />
30<br />
20<br />
10<br />
0<br />
African Americans Hispanic Americans Females<br />
A=Officials/Administration 9.05 12.79 49.32<br />
P=Professional 11.26 14.86 55.16<br />
T=Technical 15.31 20.7 52.12<br />
C=Administrative Support 19.49 27.53 88.16<br />
S=Skilled Craft 7.89 24.3 4.5<br />
M=Service <strong>and</strong> Maintenance* 30.12 24.71 52.65<br />
* In the past, the Protective Services (R) <strong>and</strong> Para-Professional (Q) categories were each reported as separate groups; however,<br />
these job categories are not contained in the Bureau of Labor Statistics, Geographic Profile of <strong>Employment</strong> <strong>and</strong> Unemployment,<br />
2004. These job categories are combined with the Service/Maintenance (M) category.<br />
7
Chart 3. Statistical Comparison of the Availability of African Americans in the Statewide Civilian<br />
Workforce <strong>and</strong> Their Representation in State Agencies Workforce from the BLS, 2007, US Bureau of<br />
Census, American Community Survey, <strong>and</strong> the Public Use Micro Data Files<br />
35%<br />
30%<br />
25%<br />
20%<br />
Statewide Availability<br />
State Agencies Workforce<br />
15%<br />
10%<br />
5%<br />
0%<br />
A P T C S M*<br />
Statewide Availability 9 11.7 17 13.2 5.1 12.8<br />
State Agencies Workforce 9.05 11.26 15.31 19.49 7.9 30.12<br />
A=Officials/Administration; P=Professional; T=Technical; C=Administrative Support; S=Skilled Craft; M=Service/Maintenance*<br />
* In the past, the Protective Services (R) <strong>and</strong> Para-Professional (Q) categories were each reported as separate groups; however,<br />
these job categories are not contained in the Bureau of Labor Statistics, Geographic Profile of <strong>Employment</strong> <strong>and</strong> Unemployment,<br />
2004. These job categories are combined with the Service/Maintenance (M) category.<br />
African-Americans in state agencies are well-represented in proportion to their availability in the<br />
workforce. In applying the 80 percent benchmark of the EEOC Uniform Guidelines on Employee<br />
Selection, 29 C.F.R. 1607, no categories indicate underutilization.<br />
Chart 4. Statistical Comparison of the Availability of Hispanic Americans in the Statewide Civilian<br />
Workforce <strong>and</strong> Their Representation in State Agencies Workforce from the BLS, 2007, US Bureau of<br />
Census, American Community Survey, <strong>and</strong> the Public Use Micro data Files<br />
Hundreds<br />
50%<br />
40%<br />
30%<br />
20%<br />
10%<br />
0%<br />
A P T C S M*<br />
A P T C S M*<br />
Statewide Availability 23.7 19.9 27 31.9 46.9 44.8<br />
State Agencies Workforce 12.79 14.86 20.7 27.53 24.4 24.71<br />
A=Officials/Administration; P=Professional; T=Technical; C=Administrative Support; S=Skilled Craft; M=Service/Maintenance*;<br />
R=Protective Services; Q=Para-Professionals<br />
* In the past, the Protective Services (R) <strong>and</strong> Para-Professional (Q) categories were each reported as separate groups; however,<br />
these job categories are not contained in the Bureau of Labor Statistics, Geographic Profile of <strong>Employment</strong> <strong>and</strong> Unemployment,<br />
2004. These job categories are combined with the Service/Maintenance (M) category.<br />
Hispanic-Americans in state agencies are well represented in proportion to their availability in the<br />
workforce in the Officials/Administration, Professional, Technical, <strong>and</strong> Administrative Support job<br />
categories. However, in applying the 80 percent benchmark of the EEOC Uniform Guidelines on<br />
Employee Selection, 29 C.F.R. 1607, Hispanics are underutilized in the job categories of<br />
Officials/Administration (26 percent), Professional (5 percent), Technical (3 percent), Skilled Craft<br />
(28 percent) <strong>and</strong> Service/Maintenance (25 percent).<br />
8
Chart 5. Statistical Comparison of the Availability of Female in the Statewide Civilian Workforce <strong>and</strong><br />
Their Representation in State Agencies Workforce from the BLS, 2007, US Bureau of Census,<br />
American Community Survey, <strong>and</strong> the Public Use Micro data Files<br />
100%<br />
80%<br />
60%<br />
40%<br />
20%<br />
0%<br />
A P T C S M*<br />
Statewide Availability 38.8 54.5 55.6 66.2 5.1 39.7<br />
State Agencies Workforce 49.32 55.19 52.12 88.16 4.5 52.65<br />
A=Officials/Administration; P=Professional; T=Technical; C=Administrative Support; S=Skilled Craft; M=Service/Maintenance*<br />
* In the past, the Protective Services (R) <strong>and</strong> Para-Professional (Q) categories were each reported as separate groups; however,<br />
these job categories are not contained in the Bureau of Labor Statistics, Geographic Profile of <strong>Employment</strong> <strong>and</strong> Unemployment,<br />
2004. These job categories are combined with the Service/Maintenance (M) category.<br />
Females in state agencies are well-represented in proportion to their availability in the workforce.<br />
In applying the 80 percent benchmark of the EEOC Uniform Guidelines on Employee Selection, 29<br />
C.F.R. 1607, no categories indicate underutilization.<br />
* Prior to 2005, the Protective Services (R) <strong>and</strong> Paraprofessional (Q) categories were each<br />
reported as separate groups; however, these job categories are not contained in the Bureau of<br />
Labor Statistics, Geographic Profile of <strong>Employment</strong> <strong>and</strong> Unemployment, 2007, the American<br />
Community Survey or the Public Use Microdata Files. These job categories are combined<br />
with the Service/Maintenance (M) category.<br />
9
Attachments
Code Job Category Total<br />
State of Texas<br />
Statewide <strong>Report</strong>ing Group<br />
<strong>Equal</strong> <strong>Employment</strong> <strong>Opportunity</strong> <strong>Report</strong> – Statewide Workforce Summary<br />
Statewide Agencies Workforce<br />
(September 1, 2006 – August 31, 2007)<br />
Fiscal Year 2007<br />
Caucasian-<br />
American 55.87% African-American 17.14%<br />
Hispanic<br />
American 19.39% Other American 7.57% Total Total<br />
Employees Males Females Total Males Females Total Males Females Total Males Females Total Males Females<br />
A Officials/Administrators 14,351 5,642 5,096 10,738 539 726 1265 900 899 1,799 300 249 549 7,381 6,970<br />
C Administrative Support 41,469 2,436 18,786 21,222 803 7,068 7871 1,423 9,712 11,135 281 960 1,241 4,943 36,526<br />
M* Service <strong>and</strong> Maintenance 86,520 20,517 17,105 37,662 9,702 16,183 25,885 10,586 10,539 21,125 1,014 874 1,888 41,819 44,701<br />
P Professionals 144,486 42,903 47,326 90,229 4,909 10,861 15,770 8,597 12,396 20,993 9,352 8,142 17,494 65,761 78,725<br />
S Skilled Craft Workers 11,249 7,082 289 7,371 872 94 966 2,558 108 2,666 224 22 246 10,736 513<br />
T Technical 31,305 8,831 8,033 16,864 1,433 3,284 4,717 3,039 3,137 6,176 1,944 1,604 3,548 15,247 16,058<br />
TOTALS 329,380 87,411 96,635 184,046 18,258 38,216 56,474 27,103 36,791 63,894 13,115 11,851 24,966 145,887 183,493<br />
THE INFORMATION CONTAINED IN THIS STATEWIDE SUMMARY REPORT REFLECTS DATA REPORTED BY USER AGENCIES ON THE HUMAN RESOURCE INFORMATION SYSTEM,<br />
THE STANDARDIZED PAYROLL/PERSONNEL REPORTING SYSTEM AND THE UNIFORM STATEWIDE PAYROLL/PERSONNEL SYSTEM. THE ACCURACY OF THE INFORMATION<br />
SUBMITTED BY THE USER AGENCIES IS SOLELY WITHIN EACH AGENCY'S CONTROL.<br />
*PRIOR TO 2005, THE PROTECTIVE SERVICES (R) AND PARAPROFESSIONAL (Q) CATEGORIES WERE EACH REPORTED AS SEPARATE GROUPS; HOWEVER, THESE<br />
JOB CATEGORIES ARE NOT CONTAINED IN THE BUREAU OF LABOR STATISTICS, GEOGRAPHIC PROFILE OF EMPLOYMENT AND UNEMPLOYMENT, 2007, AS SEPARATE JOB<br />
CATEGORIES. FOR THIS STATEWIDE SUMMARY, THESE JOB CATEGORIES ARE COMBINED WITH THE SERVICE/MAINTENANCE (M) CATEGORY.<br />
Attachment 1
State of Texas<br />
Statewide <strong>Report</strong>ing Group<br />
<strong>Equal</strong> <strong>Employment</strong> <strong>Opportunity</strong> <strong>Report</strong> – Statewide Workforce Summary<br />
Code Job Category Total<br />
Statewide Agencies Workforce<br />
(September 1, 2007 – August 31, 2008)<br />
Fiscal Year 2008<br />
Caucasian-<br />
American 55.03% African-American 17.47%<br />
Hispanic<br />
American 19.81% Other American 7.70% Total Total<br />
Employees Males Females Total Males Females Total Males Females Total Males Females Total Males Females<br />
A Officials/Administrators 14,916 5,700 5,321 11,021 562 788 1,350 936 972 1,908 362 275 637 7,560 7,356<br />
C Administrative Support 42,341 2,391 18,828 21,219 861 7,391 8,222 1,507 10,150 11,657 284 959 1,243 5,013 37,328<br />
M* Service <strong>and</strong> Maintenance 90,434 20,965 17,960 38,925 9,981 17,259 27,240 10,841 11,506 22,347 1,034 888 1,922 42,821 47,613<br />
P Professionals 150,097 43,649 48,782 92,431 5,076 11,823 16,899 8,903 13,399 22,302 9,672 8,793 18,465 67,300 82,797<br />
S Skilled Craft Workers 10,848 6,828 296 7,124 787 69 856 2,542 104 2,646 205 17 222 10,362 486<br />
T Technical 31,831 8,623 8,003 16,626 1,454 3,418 4,872 3,103 3,487 6,590 2,062 1,681 3,743 15,242 16,589<br />
TOTALS 340,467 88,156 99,190 187,346 18,721 40,748 59,439 27,832 39,618 67,450 13,619 12,613 26,232 148,298 192,169<br />
THE INFORMATION CONTAINED IN THIS STATEWIDE SUMMARY REPORT REFLECTS DATA REPORTED BY USER AGENCIES ON THE HUMAN RESOURCE INFORMATION SYSTEM,<br />
THE STANDARDIZED PAYROLL/PERSONNEL REPORTING SYSTEM AND THE UNIFORM STATEWIDE PAYROLL/PERSONNEL SYSTEM. THE ACCURACY OF THE INFORMATION<br />
SUBMITTED BY THE USER AGENCIES IS SOLELY WITHIN EACH AGENCY'S CONTROL.<br />
*PRIOR TO 2005, THE PROTECTIVE SERVICES (R) AND PARAPROFESSIONAL (Q) CATEGORIES WERE EACH REPORTED AS SEPARATE GROUPS; HOWEVER, THESE<br />
JOB CATEGORIES ARE NOT CONTAINED IN THE BUREAU OF LABOR STATISTICS, GEOGRAPHIC PROFILE OF EMPLOYMENT AND UNEMPLOYMENT, 2007, AS SEPARATE JOB<br />
CATEGORIES. FOR THIS STATEWIDE SUMMARY, THESE JOB CATEGORIES ARE COMBINED WITH THE SERVICE/MAINTENANCE (M) CATEGORY.<br />
Attachment 2
State of Texas<br />
Statewide <strong>Report</strong>ing Group<br />
<strong>Equal</strong> <strong>Employment</strong> <strong>Opportunity</strong> <strong>Report</strong> – Statewide New Hires Summary<br />
Code Job Category Total<br />
Caucasian-<br />
American 50.41%<br />
Statewide Agency New Hires<br />
(September 1, 2006 – August 31, 2007)<br />
Fiscal Year 2007<br />
African-<br />
American 19.21%<br />
Hispanic<br />
American 18.99% Other American 11.37% Total Total<br />
Employees Males Females Total Males Females Total Males Females Total Males Females Total Males Females<br />
A Officials/Administrators 1,086 380 379 759 31 58 89 70 71 141 53 44 97 534 552<br />
P Professionals 23,424 6,049 7,436 13,485 779 1,587 2,366 1,302 1,814 3,116 2,413 2,044 4,457 10,543 12,881<br />
T Technical 5,778 1,279 1,545 2,824 235 558 793 446 571 1,017 665 479 1,144 2,625 3,153<br />
C Administrative Support 7,676 509 3,240 3,749 185 1,319 1,504 325 1,706 2,031 101 291 392 1,120 6556<br />
S Skilled Craft Workers 1,112 704 32 736 87 8 95 234 8 242 31 8 39 1,056 56<br />
M* Service <strong>and</strong> Maintenance 19,083 3,796 3,969 7,765 2,183 4,143 6,326 1,995 2,508 4,503 257 2,32 489 8,231 10,852<br />
TOTALS 58,159 12,717 16,601 29,318 3,500 7673 11,173 4,372 6,678 11,050 3,520 3,098 6,618 24,109 34,050<br />
THE INFORMATION CONTAINED IN THIS STATEWIDE SUMMARY REPORT REFLECTS DATA REPORTED BY USER AGENCIES ON THE HUMAN RESOURCE INFORMATION SYSTEM,<br />
THE STANDARDIZED PAYROLL/PERSONNEL REPORTING SYSTEM AND THE UNIFORM STATEWIDE PAYROLL/PERSONNEL SYSTEM. THE ACCURACY OF THE INFORMATION<br />
SUBMITTED BY THE USER AGENCIES IS SOLELY WITHIN EACH AGENCY'S CONTROL.<br />
*PRIOR TO 2005, THE PROTECTIVE SERVICES (R) AND PARAPROFESSIONAL (Q) CATEGORIES WERE EACH REPORTED AS SEPARATE GROUPS; HOWEVER, THESE<br />
JOB CATEGORIES ARE NOT CONTAINED IN THE BUREAU OF LABOR STATISTICS, GEOGRAPHIC PROFILE OF EMPLOYMENT AND UNEMPLOYMENT, 2007, AS SEPARATE JOB<br />
CATEGORIES. FOR THIS STATEWIDE SUMMARY, THESE JOB CATEGORIES ARE COMBINED WITH THE SERVICE/MAINTENANCE (M) CATEGORY.<br />
Attachment 3
State of Texas<br />
Statewide <strong>Report</strong>ing Group<br />
<strong>Equal</strong> <strong>Employment</strong> <strong>Opportunity</strong> <strong>Report</strong> – Statewide New Hires Summary<br />
Code Job Category Total<br />
Caucasian-<br />
American 45.08%<br />
Statewide Agency New Hires<br />
(September 1, 2007 – August 31, 2008)<br />
Fiscal Year 2008<br />
African-<br />
American 14.98%<br />
Hispanic<br />
American 18.61% Other American 10.25% Total Total<br />
Employees Males Females Total Males Females Total Males Females Total Males Females Total Males Females<br />
A Officials/Administrators 1,200 368 410 778 51 73 124 79 107 186 63 49 112 561 639<br />
C Administrative Support 8,640 578 3,544 4,122 193 1,514 1,707 372 2,072 2,444 79 288 367 1 222 7 418<br />
M* Service <strong>and</strong> Maintenance 22,908 4,607 4,697 9,304 2,748 4,927 7,675 2,356 3,057 5,413 267 249 516 9978 12 930<br />
P Professionals 26,617 6,518 8,045 14,563 937 2,330 3,267 1,606 2,331 3,937 2,572 2,278 4 850 11 633 14 984<br />
S Skilled Craft Workers 970 581 38 619 71 7 78 233 7 240 31 2 33 916 54<br />
T Technical 6,365 1,379 1,601 2,980 272 644 916 522 719 1,241 693 535 1 228 2 866 3 499<br />
TOTALS 66,700 14,031 18,335 32,366 4,272 9, 495 13,767 5,168 8,293 13,461 3,705 3 401 7 106 27 176 3 524<br />
THE INFORMATION CONTAINED IN THIS STATEWIDE SUMMARY REPORT REFLECTS DATA REPORTED BY USER AGENCIES ON THE HUMAN RESOURCE INFORMATION SYSTEM,<br />
THE STANDARDIZED PAYROLL/PERSONNEL REPORTING SYSTEM AND THE UNIFORM STATEWIDE PAYROLL/PERSONNEL SYSTEM. THE ACCURACY OF THE INFORMATION<br />
SUBMITTED BY THE USER AGENCIES IS SOLELY WITHIN EACH AGENCY'S CONTROL.<br />
*PRIOR T0 2005, THE PROTECTIVE SERVICES (R) AND PARAPROFESSIONAL (Q) CATEGORIES WERE EACH REPORTED AS SEPARATE GROUPS; HOWEVER, THESE<br />
JOB CATEGORIES ARE NOT CONTAINED IN THE BUREAU OF LABOR STATISTICS, GEOGRAPHIC PROFILE OF EMPLOYMENT AND UNEMPLOYMENT, 2007, AS SEPARATE JOB<br />
CATEGORIES. FOR THIS STATEWIDE SUMMARY, THESE JOB CATEGORIES ARE COMBINED WITH THE SERVICE/MAINTENANCE (M) CATEGORY.<br />
Attachment 4
State of Texas<br />
Statewide <strong>Report</strong>ing Group<br />
<strong>Equal</strong> <strong>Employment</strong> <strong>Opportunity</strong> <strong>Report</strong> – Statewide Workforce Summary<br />
Code Job Category Total<br />
Institutions of Higher Education Workforce Summary<br />
Caucasian-<br />
American 57.51%<br />
(September 1, 2006 – August 31, 2007)<br />
Fiscal Year 2007<br />
African-<br />
American 12.13%<br />
Hispanic<br />
American 15.82% Other American 13.18% Total Total<br />
Employees Males Females Total Males Females Total Males Females Total Males Females Total Males Females<br />
1 Executive/Administrative <strong>and</strong> Managerial 9,468 3,514 3,546 7,060 295 491 786 540 619 1,159 255 208 463 4,604 4,864<br />
2 Faculty/Professional Nonfaculty 94,434 28,720 30,444 59,164 2,387 4,968 7,355 4,365 5,721 10,086 8,603 7,226 15,829 44,075 48,359<br />
3 Secretarial/Clerical 23,500 1,275 10,789 12,064 484 4,099 4,583 756 5,128 5,884 225 744 969 2,740 20,760<br />
4 Technical 19,970 4,639 5,169 9,808 868 2,462 3,330 1,496 1,943 3,439 1,777 1,436 3,213 8,780 11,010<br />
5 Skilled Craft Workers 3,708 2,080 116 2,196 323 65 388 890 63 953 151 29 171 3,444 264<br />
6 Service <strong>and</strong> Maintenance 11,350 2,058 1,071 3,129 1,529 1,735 3,264 2,071 2,118 4,189 446 322 768 6,104 5,246<br />
TOTALS 162,430 42,286 51,135 93,421 5,886 13,820 19,706 10,118 15,592 25,710 11,457 9,965 21.413 69,747 90,503<br />
THE INFORMATION CONTAINED IN THIS STATEWIDE SUMMARY REPORT REFLECTS DATA REPORTED BY USER AGENCIES ON THE HUMAN RESOURCE INFORMATION SYSTEM,<br />
THE STANDARDIZED PAYROLL/PERSONNEL REPORTING SYSTEM AND THE UNIFORM STATEWIDE PAYROLL/PERSONNEL SYSTEM. THE ACCURACY OF THE INFORMATION<br />
SUBMITTED BY THE USER AGENCIES IS SOLELY WITHIN EACH AGENCY'S CONTROL.<br />
*PRIOR TO 2005, THE PROTECTIVE SERVICES (R) AND PARAPROFESSIONAL (Q) CATEGORIES WERE EACH REPORTED AS SEPARATE GROUPS; HOWEVER, THESE<br />
JOB CATEGORIES ARE NOT CONTAINED IN THE BUREAU OF LABOR STATISTICS, GEOGRAPHIC PROFILE OF EMPLOYMENT AND UNEMPLOYMENT, 2007, AS SEPARATE JOB<br />
CATEGORIES. FOR THIS STATEWIDE SUMMARY, THESE JOB CATEGORIES ARE COMBINED WITH THE SERVICE/MAINTENANCE (M) CATEGORY.<br />
Attachment 5
State of Texas<br />
Statewide <strong>Report</strong>ing Group<br />
<strong>Equal</strong> <strong>Employment</strong> <strong>Opportunity</strong> <strong>Report</strong> – Statewide Workforce Summary<br />
Code Job Category Total<br />
Institutions of Higher Education Workforce Summary<br />
Caucasian-<br />
American 57.77%<br />
(September 1, 2007 – August 31, 2007)<br />
Fiscal Year 2008<br />
African-<br />
American 12.32%<br />
Hispanic<br />
American 16.27% Other American 13.62% Total Total<br />
Employees Males Females Total Males Females Total Males Females Total Males Females Total Males Females<br />
1 Executive/Administrative <strong>and</strong> Managerial 10,076 3,647 3,795 7,442 332 528 860 572 657 1,229 313 232 545 4,864 5,212<br />
2 Faculty/Professional Nonfaculty 95,824 29,461 31,283 60,744 2,525 5,302 7,827 4,525 6,024 10,549 8,919 7,785 16,704 45,430 50,394<br />
3 Secretarial/Clerical 23,554 1,251 10,676 11,927 510 4,117 4,627 785 5,250 6,035 233 732 965 2,779 20,775<br />
4 Technical 20,107 4,586 5,055 9,641 887 2,494 3,381 1,580 2,119 3,699 1,895 1,491 3,386 8,948 11,159<br />
5 Skilled Craft Workers 3,790 2,141 136 2,277 312 44 356 945 64 1,009 133 15 148 3,531 259<br />
6 Service <strong>and</strong> Maintenance 11,427 2,111 1,056 3,167 1,492 1,761 3,253 2,108 2,191 4,299 402 306 708 6,113 5,314<br />
TOTALS 164,778 43,197 52,001 95,198 6,058 14,246 20,304 10,515 16,305 26,820 11,895 10,561 22,456 71,665 93,113<br />
THE INFORMATION CONTAINED IN THIS STATEWIDE SUMMARY REPORT REFLECTS DATA REPORTED BY USER AGENCIES ON THE HUMAN RESOURCE INFORMATION SYSTEM,<br />
THE STANDARDIZED PAYROLL/PERSONNEL REPORTING SYSTEM AND THE UNIFORM STATEWIDE PAYROLL/PERSONNEL SYSTEM. THE ACCURACY OF THE INFORMATION<br />
SUBMITTED BY THE USER AGENCIES IS SOLELY WITHIN EACH AGENCY'S CONTROL.<br />
*PRIOR TO 2005, THE PROTECTIVE SERVICES (R) AND PARAPROFESSIONAL (Q) CATEGORIES WERE EACH REPORTED AS SEPARATE GROUPS; HOWEVER, THESE<br />
JOB CATEGORIES ARE NOT CONTAINED IN THE BUREAU OF LABOR STATISTICS, GEOGRAPHIC PROFILE OF EMPLOYMENT AND UNEMPLOYMENT, 2004, AS SEPARATE JOB<br />
CATEGORIES. FOR THIS STATEWIDE SUMMARY, THESE JOB CATEGORIES ARE COMBINED WITH THE SERVICE/MAINTENANCE (M) CATEGORY.<br />
Attachment 6
State of Texas<br />
Statewide <strong>Report</strong>ing Group<br />
<strong>Equal</strong> <strong>Employment</strong> <strong>Opportunity</strong> <strong>Report</strong> – Statewide New Hires Summary<br />
Code Job Category Total<br />
Institutions of Higher Education New Hires Summary<br />
Caucasian-<br />
American 52.55%<br />
(September 1, 2006 – August 31, 2007)<br />
Fiscal Year 2007<br />
African-<br />
American 12.10%<br />
Hispanic<br />
American 15.80% Other American 19.54% Total Total<br />
Employees Males Females Total Males Females Total Males Females Total Males Females Total Males Females<br />
1 Executive/Administrative <strong>and</strong> Managerial 807 261 282 543 20 43 63 48 59 107 51 43 94 380 427<br />
2 Faculty/Professional Nonfaculty 18,228 4,774 5,619 10,393 516 936 1,452 932 1,195 2,127 2,341 1,915 4,256 8,563 9,665<br />
3 Secretarial/Clerical 4,530 283 1,945 2,228 109 731 840 179 950 1,129 85 248 333 656 3,874<br />
4 Technical 4,639 925 1,237 2,162 186 468 654 304 419 723 640 460 1,100 2,055 2,584<br />
5 Skilled Craft Workers 405 218 12 230 25 5 30 105 6 111 27 7 34 375 30<br />
6 Service <strong>and</strong>/ Maintenance 2,403 447 295 742 345 370 715 355 348 703 136 107 243 1,283 1,120<br />
TOTALS 31,012 6,908 9,390 16,298 1,201 2,553 3,754 1,923 2,977 4,900 3,280 2,780 6,060 13,312 17,700<br />
THE INFORMATION CONTAINED IN THIS STATEWIDE SUMMARY REPORT REFLECTS DATA REPORTED BY USER AGENCIES ON THE HUMAN RESOURCE INFORMATION SYSTEM,<br />
THE STANDARDIZED PAYROLL/PERSONNEL REPORTING SYSTEM AND THE UNIFORM STATEWIDE PAYROLL/PERSONNEL SYSTEM. THE ACCURACY OF THE INFORMATION<br />
SUBMITTED BY THE USER AGENCIES IS SOLELY WITHIN EACH AGENCY'S CONTROL.<br />
*PRIOR TO 2005, THE PROTECTIVE SERVICES (R) AND PARAPROFESSIONAL (Q) CATEGORIES WERE EACH REPORTED AS SEPARATE GROUPS; HOWEVER, THESE<br />
JOB CATEGORIES ARE NOT CONTAINED IN THE BUREAU OF LABOR STATISTICS, GEOGRAPHIC PROFILE OF EMPLOYMENT AND UNEMPLOYMENT, 2004, AS SEPARATE JOB<br />
CATEGORIES. FOR THIS STATEWIDE SUMMARY, THESE JOB CATEGORIES ARE COMBINED WITH THE SERVICE/MAINTENANCE (M) CATEGORY.<br />
Attachment 7
Code Job Category Total<br />
State of Texas<br />
Statewide <strong>Report</strong>ing Group<br />
<strong>Equal</strong> <strong>Employment</strong> <strong>Opportunity</strong> <strong>Report</strong> – Statewide New Hires Summary<br />
Caucasian-<br />
American 51.41%<br />
Institutions of Higher Education New Hires Summary<br />
(September 1, 2007 – August 31, 2008)<br />
Fiscal Year 2008<br />
African-<br />
American 12.60%<br />
Hispanic<br />
American 16.52% Other American 19.45% Total Total<br />
Employees Males Females Total Males Females Total Males Females Total Males Females Total Males Females<br />
1 Executive/Administrative <strong>and</strong> Managerial 883 266 313 579 37 42 79 53 64 117 61 47 108 417 466<br />
2 Faculty/Professional Nonfaculty 19,098 5,005 5,592 10,597 565 1,077 1,642 1,058 1,259 2,317 2,474 2,068 4,542 9,102 9,996<br />
3 Secretarial/Clerical 4,572 299 1,937 2,236 104 722 826 190 1,014 1,204 74 232 306 667 3,905<br />
4 Technical 4,965 1,086 1,214 2,300 210 474 684 349 472 821 664 496 1,160 2,309 2,656<br />
5 Skilled Craft Workers 470 242 26 268 45 5 50 121 7 128 22 2 24 430 40<br />
6 Service <strong>and</strong> Maintenance 2,545 459 289 748 377 442 819 392 396 788 106 74 190 1,334 1,211<br />
TOTALS 32,533 7,357 9,371 16,728 1,338 2,762 4,100 2,163 3,212 5,375 3,401 2,919 6,330 14,259 18,274<br />
THE INFORMATION CONTAINED IN THIS STATEWIDE SUMMARY REPORT REFLECTS DATA REPORTED BY USER AGENCIES ON THE HUMAN RESOURCE INFORMATION SYSTEM,<br />
THE STANDARDIZED PAYROLL/PERSONNEL REPORTING SYSTEM AND THE UNIFORM STATEWIDE PAYROLL/PERSONNEL SYSTEM. THE ACCURACY OF THE INFORMATION<br />
SUBMITTED BY THE USER AGENCIES IS SOLELY WITHIN EACH AGENCY'S CONTROL.<br />
*PRIOR TO 2005, THE PROTECTIVE SERVICES (R) AND PARAPROFESSIONAL (Q) CATEGORIES WERE EACH REPORTED AS SEPARATE GROUPS; HOWEVER, THESE<br />
JOB CATEGORIES ARE NOT CONTAINED IN THE BUREAU OF LABOR STATISTICS, GEOGRAPHIC PROFILE OF EMPLOYMENT AND UNEMPLOYMENT, 2004, AS SEPARATE JOB<br />
CATEGORIES. FOR THIS STATEWIDE SUMMARY, THESE JOB CATEGORIES ARE COMBINED WITH THE SERVICE/MAINTENANCE (M) CATEGORY.<br />
Attachment 8
REPORT: F48BCOMB-R2 STATE OF TEXAS DATE: 10/29/2008<br />
STATEWIDE REPORTING GROUP<br />
FINAL STATISTICAL SUMMARY REPORT PAGE: 1<br />
CLASSIFIED STATE AGENCIES<br />
STATEWIDE SUMMARY<br />
-------------------- FISCAL YEAR 2007 --------------------- ---------------- FISCAL YEAR 2008 ---------------<br />
AVAILABILITY IN<br />
NEW HIRES AGENCY WORKFORCE NEW HIRES AGENCY WORKFORCE CIVILIAN LABOR FORCE<br />
JOB BLACK HISPANIC FEMALE BLACK HISPANIC FEMALE BLACK HISPANIC FEMALE BLACK HISPANIC FEMALE BLACK HSPANIC FEMALE<br />
CODE TOTAL % % % TOTAL % % % TOTAL % % % TOTAL % % % % % %<br />
---- ---------------------------- ------------------------------ ----------------------------- ----------------------------- --------------------<br />
A 279 9.31 12.18 44.80 4883 9.80 13.10 43.12 317 14.19 21.76 54.57 4840 10.12 14.02 44.29 9.00 23.70 38.80<br />
C 3146 21.10 28.67 85.25 17969 18.29 29.22 87.73 4068 21.65 30.48 86.35 18787 19.13 29.92 88.10 13.20 31.90 66.20<br />
M 5309 39.44 25.42 61.44 17840 37.65 25.36 59.65 6419 39.67 25.58 64.88 19491 37.80 25.47 61.08 5.10 46.90 5.10<br />
P 5196 17.59 19.03 61.89 52052 16.16 20.95 58.33 7519 21.61 21.55 66.33 54273 16.71 21.65 59.70 11.70 19.90 54.50<br />
Q 1870 18.93 33.47 66.63 11111 19.69 28.74 77.64 2386 19.40 32.73 67.89 11671 19.96 29.65 77.86 0.00 0.00 0.00<br />
R 9501 33.28 19.19 54.98 46219 29.67 19.93 43.67 11558 33.27 19.05 51.34 47845 29.86 20.10 44.52 0.00 0.00 0.00<br />
S 707 9.19 18.52 3.67 7541 7.66 22.71 3.30 500 5.60 22.40 2.80 7058 7.08 23.19 3.21 12.80 44.80 39.70<br />
T 1139 12.20 25.81 49.95 11515 12.04 23.76 43.83 1400 16.57 30.00 60.21 11724 12.71 24.65 46.31 17.00 27.00 55.60<br />
----------------------------- ------------------------------ ----------------------------- -----------------------------<br />
27147 27.32 22.65 60.22 169130 21.73 22.57 54.98 34167 28.29 23.66 62.19 175689 22.27 23.12 56.38<br />
EEO JOB CATEGORIES<br />
-------------------------------------------<br />
JOB CATEGORY CODE DESCRIPTION<br />
----------------- ------------------------<br />
A OFFICIALS/ADMINISTRATION<br />
C ADMINISTRATIVE SUPPORT<br />
M SERVICE/MAINTENANCE<br />
P PROFESSIONAL<br />
Q PARAPROFESSIONALS<br />
R PROTECTIVE SERVICES<br />
S SKILLED CRAFT<br />
T TECHNICAL<br />
THE INFORMATION CONTAINED IN THIS REPORT REFLECTS DATA REPORTED BY USER AGENCIES ON THE HUMAN RESOURCE INFORMATION SYSTEM,<br />
THE STANDARDIZED PAYROLL/PERSONNEL REPORTING SYSTEM AND THE UNIFORM STATEWIDE PAYROLL/PERSONNEL SYSTEM. THE ACCURACY<br />
OF THE INFORMATION SUBMITTED BY THE USER AGENCIES IS SOLELY WITHIN EACH AGENCY'S CONTROL.<br />
Attachment 9
REPORT: F48BCOMB-R3 STATE OF TEXAS DATE: 10/29/2008<br />
STATEWIDE REPORTING GROUP<br />
FINAL STATISTICAL SUMMARY REPORT PAGE: 1<br />
INSTITUTIONS OF HIGHER EDUCATION<br />
STATEWIDE SUMMARY<br />
-------------------- FISCAL YEAR 2007 --------------------- --------------------- FISCAL YEAR 2008 ---------------------<br />
AVAILABILITY IN<br />
NEW HIRES AGENCY WORKFORCE NEW HIRES AGENCY WORKFORCE CIVILIAN LABOR FORCE<br />
JOB BLACK HISPANIC FEMALE BLACK HISPANIC FEMALE BLACK HISPANIC FEMALE BLACK HISPANIC FEMALE BLACK HSPANIC FEMALE<br />
CODE TOTAL % % % TOTAL % % % TOTAL % % % TOTAL % % % % % %<br />
---- ---------------------------- ------------------------------ ----------------------------- ----------------------------- --------------------<br />
A 807 7.80 13.25 52.91 9469 8.30 12.23 51.37 884 8.93 13.23 52.82 10077 8.53 12.19 51.73 9.00 23.70 38.80<br />
C 4530 18.54 24.92 85.51 23500 19.50 25.03 88.34 4571 18.07 26.33 85.40 23552 19.64 25.61 88.20 13.20 31.90 66.20<br />
M 1883 20.92 32.39 42.59 9412 23.41 39.08 43.31 2025 26.41 33.23 44.00 9478 23.29 39.79 43.40 5.10 46.90 5.10<br />
P 18232 7.96 11.66 53.02 92439 7.95 10.91 52.31 19101 8.58 12.12 52.33 95833 8.16 11.00 52.59 11.70 19.90 54.50<br />
R 520 61.73 17.88 61.15 1938 54.69 26.31 60.31 516 54.65 22.09 61.43 1946 53.59 27.08 61.51 0.00 0.00 0.00<br />
S 405 7.40 27.40 7.40 3708 10.46 25.70 7.11 470 10.63 27.23 8.51 3790 9.39 26.62 6.83 12.80 44.80 39.70<br />
T 4638 14.10 15.58 55.69 19789 16.82 17.37 55.63 4962 13.74 16.54 53.48 20105 16.80 18.39 55.49 17.00 27.00 55.60<br />
----------------------------- ------------------------------ ----------------------------- -----------------------------<br />
31015 12.10 15.79 57.07 160255 12.29 16.04 56.47 32529 12.58 16.51 56.16 164781 12.31 16.27 56.50<br />
EEO JOB CATEGORIES<br />
--------------------------------------------------------<br />
JOB CATEGORY CODE DESCRIPTION<br />
----------------- -------------------------------------<br />
1 EXECUTIVE/ADMINISTRATIVE & MANAGERIAL<br />
2 * FACULTY/PROFESSIONAL NONFACULTY<br />
3 SECRETARIAL/CLERICAL<br />
4 ** TECHNICAL/PARAPROFESSIONAL<br />
5 SKILLED CRAFT WORKERS<br />
6 SERVICE/MAINTENANCE<br />
* PERCENTAGES REFLECT THE COMBINED UNWEIGHTED AVERAGES FOR THE FACULTY AND PROFESSIONAL NON-FACULTY JOB CODE EMPLOYEES.<br />
** PERCENTAGES REFLECT THE COMBINED UNWEIGHTED AVERAGES FOR THE TECHNICAL AND PARAPROFESSIONAL JOB CODE EMPLOYEES.<br />
THE INFORMATION CONTAINED IN THIS REPORT REFLECTS DATA REPORTED BY USER AGENCIES ON THE HUMAN RESOURCE INFORMATION SYSTEM,<br />
THE STANDARDIZED PAYROLL/PERSONNEL REPORTING SYSTEM AND THE UNIFORM STATEWIDE PAYROLL/PERSONNEL SYSTEM. THE ACCURACY<br />
OF THE INFORMATION SUBMITTED BY THE USER AGENCIES IS SOLELY WITHIN EACH AGENCY'S CONTROL.<br />
Attachment 10
Attachment 11


