Chapter 4 Climate of Texas - Texas Water Development Board
Chapter 4 Climate of Texas - Texas Water Development Board
Chapter 4 Climate of Texas - Texas Water Development Board

You also want an ePaper? Increase the reach of your titles
YUMPU automatically turns print PDFs into web optimized ePapers that Google loves.
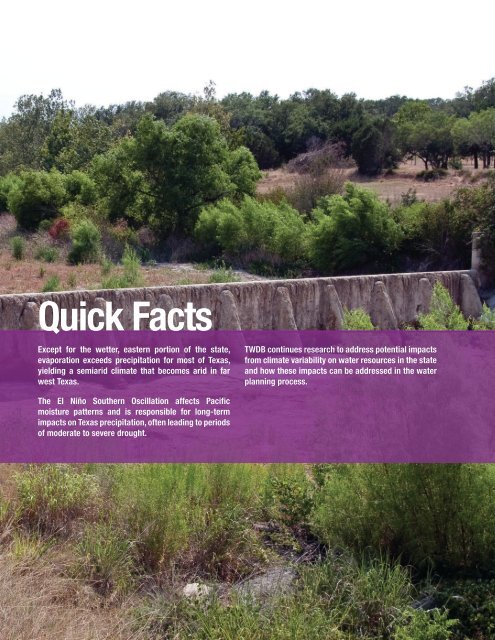
Quick Facts<br />
Except for the wetter, eastern portion <strong>of</strong> the state,<br />
evaporation exceeds precipitation for most <strong>of</strong> <strong>Texas</strong>,<br />
yielding a semiarid climate that becomes arid in far<br />
west <strong>Texas</strong>.<br />
TWDB continues research to address potential impacts<br />
from climate variability on water resources in the state<br />
and how these impacts can be addressed in the water<br />
planning process.<br />
The El Niño Southern Oscillation affects Pacific<br />
moisture patterns and is responsible for long-term<br />
impacts on <strong>Texas</strong> precipitation, <strong>of</strong>ten leading to periods<br />
<strong>of</strong> moderate to severe drought.<br />
144<br />
<strong>Chapter</strong> 4 : climate <strong>of</strong> <strong>Texas</strong><br />
WAT E R FOR TEXAS 2012 STATE WATER PLAN
4<br />
<strong>Climate</strong><br />
<strong>of</strong> <strong>Texas</strong><br />
Average annual temperature gradually increases from about 52°F<br />
in the northern Panhandle <strong>of</strong> <strong>Texas</strong> to about 68°F in the Lower Rio<br />
Grande Valley. Average annual precipitation decreases from over<br />
55 inches in Beaumont to less than 10 inches in El Paso.<br />
Because <strong>of</strong> its size—spanning over 800 miles both north<br />
to south and east to west—<strong>Texas</strong> has a wide range <strong>of</strong><br />
climatic conditions over several diverse geographic<br />
regions. <strong>Climate</strong> is an important consideration<br />
in water supply planning because it ultimately<br />
determines the state’s weather and, consequently, the<br />
probability <strong>of</strong> drought and the availability <strong>of</strong> water for<br />
various uses. The variability <strong>of</strong> the state’s climate also<br />
represents both a risk and an uncertainty that must<br />
be considered by the regional water planning groups<br />
when developing their regional water plans (<strong>Chapter</strong><br />
10, Risk and Uncertainty).<br />
4.1 OVERVIEW OF THE STATE’S CLIMATE<br />
The variability <strong>of</strong> <strong>Texas</strong>’ climate is a consequence <strong>of</strong><br />
interactions between the state’s unique geographic<br />
location on the North American continent and several<br />
factors that result because <strong>of</strong> the state’s location<br />
(Figure 4.1):<br />
• the movements <strong>of</strong> seasonal air masses such as<br />
arctic fronts from Canada<br />
• subtropical west winds from the Pacific Ocean<br />
and northern Mexico<br />
• tropical cyclones or hurricanes from the Gulf <strong>of</strong><br />
Mexico<br />
• a high pressure system in the Atlantic Ocean<br />
known as the Bermuda High<br />
• the movement <strong>of</strong> the jet streams<br />
WAT E R FOR TEXAS 2012 STATE WATER PLAN<br />
145<br />
<strong>Chapter</strong> 4 : climate <strong>of</strong> <strong>Texas</strong>
FIGURE 4.1. THE GEOGRAPHIC LOCATION OF TEXAS WITHIN NORTH AMERICA AND ITS<br />
INTERACTION WITH SEASONAL AIR MASSES AFFECTS THE STATE’S UNIQUE CLIMATE VARIABILITY<br />
(SOURCE DIGITAL ELEVATION DATA FOR BASE MAP FROM USGS, 2000).<br />
Pacific<br />
Ocean<br />
Arctic fronts<br />
Atlantic<br />
Ocean<br />
Rocky Mountains<br />
Polar jet stream<br />
West winds<br />
Subtropical jet stream<br />
Mexican<br />
Highlands<br />
Gulf air<br />
H<br />
Bermuda<br />
High<br />
El Niño<br />
Southern<br />
Oscillation<br />
West winds<br />
Gulf<br />
<strong>of</strong><br />
Mexico<br />
Tropical<br />
storms<br />
The Gulf <strong>of</strong> Mexico is the predominant geographical<br />
feature affecting the state’s climate, moderating<br />
seasonal temperatures along the Gulf Coast and<br />
more importantly, providing the major source <strong>of</strong><br />
precipitation for most <strong>of</strong> the state (TWDB, 1967;<br />
Larkin and Bomar, 1983). However, precipitation in<br />
the Trans-Pecos and the Panhandle regions <strong>of</strong> <strong>Texas</strong><br />
originates mostly from the eastern Pacific Ocean and<br />
from land-recycled moisture (TWDB, 1967; Slade<br />
and Patton, 2003). The 370 miles <strong>of</strong> <strong>Texas</strong> Gulf Coast<br />
creates a significant target for tropical cyclones that<br />
make their way into the Gulf <strong>of</strong> Mexico during the<br />
hurricane season. The Rocky Mountains guide polar<br />
fronts <strong>of</strong> cold arctic air southward into the state during<br />
the fall, winter, and spring.<br />
During the summer, the dominant weather feature<br />
in extreme west <strong>Texas</strong> is the North American (or<br />
Southwest) Monsoon, as the warm desert southwest<br />
draws moist air northward from the Gulf <strong>of</strong> California<br />
and the Gulf <strong>of</strong> Mexico to produce summertime<br />
thunderstorms. In the rest <strong>of</strong> <strong>Texas</strong>, summertime<br />
thunderstorms form along the sea breeze or in response<br />
to tropical or subtropical disturbances. Warm dry<br />
air masses from the high plains <strong>of</strong> northern Mexico<br />
are pulled into the state by the jet stream during the<br />
spring and fall seasons, colliding with humid air from<br />
146<br />
<strong>Chapter</strong> 4 : climate <strong>of</strong> <strong>Texas</strong><br />
WAT E R FOR TEXAS 2012 STATE WATER PLAN
FIGURE 4.2. CLIMATE DIVISIONS OF TEXAS WITH CORRESPONDING CLIMOGRAPHS (SOURCE DATA<br />
FROM NCDC, 2011).<br />
6<br />
90<br />
2<br />
P = Precipitation in inches<br />
4<br />
60<br />
P<br />
T<br />
T = Temperature in degrees Fahrenheit<br />
2<br />
30 6<br />
90<br />
3<br />
6<br />
0<br />
0 4<br />
60<br />
90<br />
J F M A M J J A S O N D<br />
1<br />
P<br />
T<br />
4<br />
60<br />
2<br />
30<br />
P<br />
T<br />
0<br />
2<br />
30<br />
J F M A M J J A S O N D<br />
0<br />
6<br />
0<br />
0<br />
1<br />
J F M A M J J A S O N D<br />
4<br />
2<br />
4<br />
6<br />
90<br />
P<br />
5<br />
3<br />
2<br />
4<br />
60<br />
P<br />
T<br />
4 0<br />
2<br />
30<br />
J F M A M J J A S O N D<br />
5<br />
6<br />
6<br />
0<br />
0<br />
8<br />
J F M A M J J A S O N D<br />
7 8<br />
4<br />
P<br />
6<br />
90<br />
6<br />
2<br />
4<br />
60<br />
9<br />
P<br />
T<br />
0<br />
J F M A M J J A S O N D<br />
2<br />
30<br />
0<br />
10<br />
6<br />
90<br />
7<br />
0<br />
J F M A M J J A S O N D<br />
4<br />
60<br />
6<br />
4<br />
9<br />
90<br />
60<br />
P<br />
T<br />
2<br />
30<br />
P<br />
T<br />
0<br />
J F M A M J J A S O N D<br />
0<br />
2<br />
30<br />
6<br />
10<br />
90<br />
0<br />
J F M A M J J A S O N D<br />
0<br />
4<br />
60<br />
P<br />
T<br />
2<br />
30<br />
90<br />
60<br />
T<br />
30<br />
0<br />
90<br />
60<br />
T<br />
30<br />
0<br />
0<br />
J F M A M J J A S O N D<br />
0<br />
the Gulf <strong>of</strong> Mexico, funneled by the western limb <strong>of</strong><br />
the Bermuda High system—producing destabilized<br />
inversions between the dry and humid air masses and<br />
generating severe thunderstorms and tornadoes.<br />
4.2 CLIMATE DIVISIONS<br />
The National Climatic Data Center divides <strong>Texas</strong> into<br />
10 climate divisions (Figure 4.2). <strong>Climate</strong> divisions<br />
represent regions with similar characteristics such<br />
as vegetation, temperature, humidity, rainfall, and<br />
seasonal weather changes. <strong>Climate</strong> data collected at<br />
locations throughout the state are averaged within<br />
each <strong>of</strong> the divisions. These divisions are commonly<br />
used to assess climate characteristics across the state:<br />
• Division 1 (High Plains): Continental steppe or<br />
semi-arid savanna<br />
• Division 2 (Low Rolling Plains): Sub-tropical<br />
steppe or semi-arid savanna<br />
• Division 3 (Cross Timbers): Sub-tropical subhumid<br />
mixed savanna and woodlands<br />
• Division 4 (Piney Woods): Sub-tropical humid<br />
mixed evergreen-deciduous forestland<br />
• Division 5 (Trans-Pecos): Except for the slightly<br />
wetter high desert mountainous areas, subtropical<br />
arid desert<br />
• Division 6 (Edwards Plateau): Sub-tropical steppe<br />
or semi-arid brushland and savanna<br />
WAT E R FOR TEXAS 2012 STATE WATER PLAN<br />
147<br />
<strong>Chapter</strong> 4 : climate <strong>of</strong> <strong>Texas</strong>
• Division 7 (Post Oak Savanna): Sub-tropical subhumid<br />
mixed prairie, savanna, and woodlands<br />
• Division 8 (Gulf Coastal Plains): Sub-tropical<br />
humid marine prairies and marshes<br />
• Division 9 (South <strong>Texas</strong> Plains): Sub-tropical<br />
steppe or semi-arid brushland<br />
• Division 10 (Lower Rio Grande Valley): Subtropical<br />
sub-humid marine<br />
4.3 TEMPERATURE, PRECIPITATION, AND<br />
EVAPORATION<br />
Average annual temperature gradually increases from<br />
about 52°F in the northern Panhandle <strong>of</strong> <strong>Texas</strong> to<br />
about 68°F in the Lower Rio Grande Valley, except for<br />
isolated mountainous areas <strong>of</strong> far west <strong>Texas</strong>, where<br />
temperatures are cooler than the surrounding arid<br />
valleys and basins (Figure 4.3). In Far West <strong>Texas</strong>, the<br />
average annual temperature sharply increases from<br />
about 56°F in the Davis and Guadalupe mountains<br />
to about 64°F in the Presidio and Big Bend areas.<br />
Average annual precipitation decreases from over 55<br />
inches in Beaumont to less than 10 inches in El Paso<br />
(Figure 4.4). Correspondingly, average annual gross<br />
lake evaporation is less than 50 inches in east <strong>Texas</strong><br />
and more than 75 inches in far west <strong>Texas</strong> (Figure 4.5).<br />
Although most <strong>of</strong> the state’s precipitation occurs in<br />
the form <strong>of</strong> rainfall, small amounts <strong>of</strong> ice and snow<br />
can occur toward the north and west, away from<br />
the moderating effects <strong>of</strong> the Gulf <strong>of</strong> Mexico. The<br />
variability <strong>of</strong> both daily temperature and precipitation<br />
generally increases inland across the state and away<br />
from the Gulf, while relative humidity generally<br />
decreases from east to west and inland away from the<br />
coast. The range between summer and winter average<br />
monthly temperatures increases with increased<br />
distance from the Gulf <strong>of</strong> Mexico. Except for climatic<br />
divisions 1 and 5 in far west <strong>Texas</strong>, the state climate<br />
divisions show two pronounced rainy seasons in the<br />
spring and fall. Both rainy seasons are impacted by<br />
polar fronts interacting with moist Gulf air during<br />
those seasons, with the fall rainy season also impacted<br />
by hurricanes and tropical depressions.<br />
Most <strong>of</strong> the annual rainfall in <strong>Texas</strong> occurs during rain<br />
storms, when a large amount <strong>of</strong> precipitation falls<br />
over a short period <strong>of</strong> time. Except for the subtropical<br />
humid climate <strong>of</strong> the eastern quarter <strong>of</strong> the state,<br />
evaporation exceeds precipitation—yielding a semiarid<br />
or steppe climate that becomes arid in far west<br />
<strong>Texas</strong>.<br />
4.4 CLIMATE INFLUENCES<br />
<strong>Texas</strong> climate is directly influenced by prominent<br />
weather features such as the Bermuda High and the jet<br />
streams. These weather features are in turn influenced<br />
by cyclical changes in sea surface temperature patterns<br />
associated with the El Niño Southern Oscillation, the<br />
Pacific Decadal Oscillation, the Atlantic Multidecadal<br />
Oscillation, and the atmospheric pressure patterns <strong>of</strong><br />
the North Atlantic Oscillation.<br />
The Bermuda High, a dominant high pressure<br />
system <strong>of</strong> the North Atlantic Oscillation, influences<br />
the formation and path <strong>of</strong> tropical cyclones as well<br />
as climate patterns across <strong>Texas</strong> and the eastern<br />
United States. During periods <strong>of</strong> increased intensity<br />
<strong>of</strong> the Bermuda High system, precipitation extremes<br />
also tend to increase. The jet streams are narrow,<br />
high altitude, and fast-moving air currents with<br />
meandering paths from west to east. They steer large<br />
air masses across the earth’s surface and their paths<br />
and locations generally determine the climatic state<br />
between drought and unusually wet conditions.<br />
The El Niño Southern Oscillation, a cyclical fluctuation<br />
<strong>of</strong> ocean surface temperature and air pressure in the<br />
tropical Pacific Ocean, affects Pacific moisture patterns<br />
148<br />
<strong>Chapter</strong> 4 : climate <strong>of</strong> <strong>Texas</strong><br />
WAT E R FOR TEXAS 2012 STATE WATER PLAN
FIGURE 4.3. AVERAGE ANNUAL TEMPERATURE FOR 1981 TO 2010 (DEGREES FAHRENHEIT)<br />
(SOURCE DATA FROM TWDB, 2005 AND PRISM CLIMATE GROUP, 2011).<br />
52<br />
52<br />
54<br />
54<br />
56<br />
54<br />
58<br />
56<br />
58<br />
56<br />
60 58<br />
58<br />
60<br />
56<br />
60<br />
60<br />
62<br />
62<br />
64<br />
64 64<br />
62<br />
64<br />
64<br />
66<br />
66<br />
68<br />
68<br />
FIGURE 4.4. AVERAGE ANNUAL PRECIPITATION<br />
FOR 1981 TO 2010 (INCHES) (SOURCE DATA<br />
FROM TWDB, 2005 AND PRISM CLIMATE<br />
GROUP, 2011).<br />
FIGURE 4.5. AVERAGE ANNUAL GROSS LAKE<br />
EVAPORATION FOR 1971 TO 2000 (INCHES)<br />
(SOURCE DATA FROM TWDB, 2005).<br />
20<br />
60<br />
65<br />
60<br />
65<br />
65<br />
65<br />
25<br />
30<br />
35<br />
40 45<br />
50<br />
50<br />
50<br />
70<br />
65<br />
60<br />
55<br />
50<br />
10 15<br />
10<br />
55<br />
65<br />
60<br />
65<br />
70<br />
60 70<br />
75<br />
50<br />
50<br />
15<br />
20<br />
55<br />
50<br />
45<br />
40<br />
35<br />
30<br />
60<br />
60<br />
70<br />
70<br />
60<br />
55<br />
50<br />
50<br />
25<br />
65<br />
65<br />
WAT E R FOR TEXAS 2012 STATE WATER PLAN<br />
149<br />
<strong>Chapter</strong> 4 : climate <strong>of</strong> <strong>Texas</strong>
TABLE 4.1. RANKINGS OF PALMER DROUGHT SEVERITY INDICES BASED ON DROUGHT DURATION<br />
AND DROUGHT INTENSITY FOR CLIMATE DIVISIONS OF TEXAS<br />
<strong>Climate</strong> Division<br />
Duration Ranking<br />
Intensity Ranking<br />
1 2 3 1 2 3<br />
1 1950 to 1956 1962 to 1967 1933 to 1936 1950 to 1956 1909 to 1911 1933 to 1936<br />
2 1950 to 1956 1909 to 1913 1963 to 1967 1950 to 1956 1909 to 1913 1916 to 1918<br />
3 1951 to 1956 1909 to 1913 1916 to 1918 1951 to 1956 1916 to 1918 2005 to 2006<br />
4 1962 to 1967 1915 to 1918 1936 to 1939 1915 to 1918 1954 to 1956 1951 to 1952<br />
5 1950 to 1957 1998 to 2003 1962 to 1967 1950 to 1957 1933 to 1937 1998 to 2003<br />
6 1950 to 1956 1909 to 1913 1993 to 1996 1950 to 1956 1916 to 1918 1962 to 1964<br />
7 1948 to 1956 1909 to 1912 1896 to 1899 1948 to 1956 1916 to 1918 1962 to 1964<br />
8 1950 to 1956 1915 to 1918 1962 to 1965 1950 to 1956 1915 to 1918 1962 to 1965<br />
9 1950 to 1956 1909 to 1913 1962 to 1965 1950 to 1956 1916 to 1918 1988 to 1990<br />
10 1945 to 1957 1960 to 1965 1988 to 1991 1945 to 1957 1999 to 2002 1988 to 1991<br />
4.1<br />
and is responsible for long-term impacts on <strong>Texas</strong><br />
precipitation, <strong>of</strong>ten leading to periods <strong>of</strong> moderate to<br />
severe drought. During a weak or negative oscillation,<br />
known as a La Niña phase, precipitation will<br />
generally be below average in <strong>Texas</strong> and some degree<br />
<strong>of</strong> drought will occur. (The State Climatologist and the<br />
National Atmospheric and Oceanic Administration<br />
both attribute drought conditions experienced in<br />
<strong>Texas</strong> in 2010 and 2011 to La Niña conditions in the<br />
Pacific.) During a strong positive oscillation or El Niño<br />
phase, <strong>Texas</strong> will usually experience above average<br />
precipitation.<br />
The Pacific Decadal Oscillation affects sea surface<br />
temperatures in the northern Pacific Ocean, while the<br />
Atlantic Multidecadal Oscillation affects the sea<br />
surface temperature gradient from the equator<br />
poleward (Nielson-Gammon, 2011a). These two longterm<br />
oscillations can enhance or dampen the effects <strong>of</strong><br />
the El Niño Southern Oscillation phases and therefore<br />
long-term patterns <strong>of</strong> wet and dry cycles <strong>of</strong> the climate.<br />
Generally, drought conditions are enhanced by cool<br />
sea surface temperatures <strong>of</strong> the Pacific Decadal<br />
Oscillation and also warm sea surface temperatures <strong>of</strong><br />
the Atlantic Multidecadal Oscillation.<br />
FIGURE 4.6. ANNUAL PRECIPITATION BASED ON<br />
POST OAK TREE RINGS FOR THE SAN ANTONIO<br />
AREA (DATA FROM CLEAVELAND, 2006).<br />
Precipitation (Percent <strong>of</strong> Average)<br />
220<br />
200<br />
180<br />
160<br />
140<br />
120<br />
100<br />
80<br />
60<br />
40<br />
20<br />
1600 1650 1700 1750 1800 1850 1900 1950 2000<br />
FIGURE 4.7. SEVEN-YEAR RUNNING AVERAGE<br />
OF PRECIPITATION BASED ON POST OAK TREE<br />
RINGS FOR THE SAN ANTONIO AREA (DATA<br />
FROM CLEAVELAND, 2006).<br />
Precipitation (Percent <strong>of</strong> Average)<br />
220<br />
200<br />
180<br />
160<br />
140<br />
120<br />
100<br />
80<br />
60<br />
40<br />
20<br />
1600 1650 1700 1750 1800 1850 1900 1950 2000<br />
150<br />
<strong>Chapter</strong> 4 : climate <strong>of</strong> <strong>Texas</strong><br />
WAT E R FOR TEXAS 2012 STATE WATER PLAN
4.5 DROUGHT SEVERITY IN TEXAS<br />
Droughts are periods <strong>of</strong> less than average precipitation<br />
over a period <strong>of</strong> time. The Palmer Drought Severity<br />
Index is <strong>of</strong>ten used to quantify long-term drought<br />
conditions and is commonly used by the U.S.<br />
Department <strong>of</strong> Agriculture to help make policy<br />
decisions such as when to grant emergency drought<br />
assistance. The severity <strong>of</strong> drought depends upon<br />
several factors, though duration and intensity are<br />
the two primary components. The drought <strong>of</strong> record<br />
during the 1950s ranks the highest in terms <strong>of</strong> both<br />
duration and intensity (Table 4.1). However, it should<br />
be noted that drought rankings can be misleading<br />
since a single year <strong>of</strong> above average rainfall can<br />
interrupt a prolonged drought, reducing its ranking.<br />
Nonetheless, on a statewide basis, the drought <strong>of</strong> the<br />
1950s still remains the most severe drought the state<br />
has ever experienced based on recorded measurements<br />
<strong>of</strong> precipitation. Other significant droughts in <strong>Texas</strong><br />
occurred in the late 1800s and the 1910s, 1930s, and<br />
1960s. At the end <strong>of</strong> 2011, the 2011 drought may rank<br />
among the most intense one-year droughts on record<br />
in many climatic divisions.<br />
4.6 CLIMATE VARIABILITY<br />
The climate <strong>of</strong> <strong>Texas</strong> is, has been, and will continue<br />
to be variable. Since variability affects the availability<br />
<strong>of</strong> the state’s water resources, it is recognized by the<br />
regional water planning groups when addressing<br />
needs for water during a repeat <strong>of</strong> the drought <strong>of</strong><br />
record. More discussion on how planning groups<br />
address climate variability and other uncertainties can<br />
be found in <strong>Chapter</strong> 10, Challenges and Uncertainty.<br />
<strong>Climate</strong> data are generally available in <strong>Texas</strong> from the<br />
late 19th century to the present, but this is a relatively<br />
short record that can limit our understanding <strong>of</strong><br />
long-term climate variability. Besides the variability<br />
measured in the record, historic variability can be<br />
estimated through environmental proxies by the study<br />
<strong>of</strong> tree rings, while future variability can be projected<br />
through the analysis <strong>of</strong> global climate models. Annual<br />
tree growth, expressed in a tree growth ring, is strongly<br />
influenced by water availability. A dry year results in<br />
a thin growth ring, and a wet year results in a thick<br />
growth ring. By correlating tree growth ring thickness<br />
with precipitation measured during the period <strong>of</strong><br />
record, scientists can extend the climatic record back<br />
hundreds <strong>of</strong> years.<br />
In <strong>Texas</strong>, scientists have completed precipitation<br />
data reconstructions using post oak and bald cypress<br />
trees. In the San Antonio area (Cleaveland, 2006),<br />
reconstruction <strong>of</strong> precipitation using post oak trees<br />
from 1648 to 1995 (Figure 4.6) indicates that the highest<br />
annual precipitation was in 1660 (about 212 percent <strong>of</strong><br />
average) and the lowest annual precipitation was in<br />
1925 (about 27 percent <strong>of</strong> average).<br />
Drought periods in this dataset can also be evaluated<br />
with seven-year running averages (Figure 4.7). The<br />
drought <strong>of</strong> record that ended in 1956 can be seen in<br />
this reconstruction, with the seven-year precipitation<br />
during this period about 79 percent <strong>of</strong> average. This<br />
record shows two seven-year periods that were drier<br />
than the drought <strong>of</strong> record: the seven-year period that<br />
ended in 1717 had precipitation <strong>of</strong> about 73 percent <strong>of</strong><br />
average, and the seven-year period that ended in 1755<br />
had a seven-year average precipitation <strong>of</strong> about 78<br />
percent. There have been about 15 seven-year periods<br />
where precipitation was below 90 percent <strong>of</strong> average,<br />
indicating an extended drought.<br />
4.7 FUTURE VARIABILITY<br />
<strong>Climate</strong> scientists have developed models to project<br />
what the Earth’s climate may be like in the future under<br />
WAT E R FOR TEXAS 2012 STATE WATER PLAN<br />
151<br />
<strong>Chapter</strong> 4 : climate <strong>of</strong> <strong>Texas</strong>
certain assumptions, including the composition <strong>of</strong> the<br />
atmosphere. In simple terms, the models simulate<br />
incoming solar energy and the outgoing energy in the<br />
form <strong>of</strong> long-wave radiation. The models also simulate<br />
interactions between the atmosphere, oceans, land,<br />
and ice using well-established physical principles. The<br />
models are capable <strong>of</strong> estimating future climate based<br />
on assumed changes in the atmosphere that change<br />
the balance between incoming and outgoing energy.<br />
These models can provide quantitative estimates <strong>of</strong><br />
future climate variability, particularly at continental<br />
and larger scales (IPCC, 2007). Confidence in these<br />
estimates is higher for some climate variables, such as<br />
temperature, than for others, such as precipitation.<br />
While the climate models provide a framework<br />
for understanding future changes on a global or<br />
continental scale, scientists have noted that local<br />
temperature changes, even over decades to centuries,<br />
may also be strongly influenced by changes in<br />
regional climate patterns and sea surface temperature<br />
variations, making such changes inherently more<br />
complex. According to John W. Nielsen-Gammon,<br />
“If temperatures rise and precipitation decreases as<br />
projected by climate models, droughts as severe as<br />
those in the beginning or middle <strong>of</strong> the 20th Century<br />
would become increasingly likely” (2011b). However,<br />
the temperature increase began during a period <strong>of</strong><br />
unusually cold temperatures. It is only during the last<br />
10 to 15 years that temperatures have become as warm<br />
as during earlier parts <strong>of</strong> the 20th century, such as the<br />
Dust Bowl <strong>of</strong> the 1930s and the drought <strong>of</strong> the 1950s.<br />
<strong>Climate</strong> scientists have also reported results <strong>of</strong> model<br />
projections specific to <strong>Texas</strong>, with the projected<br />
temperature trends computed relative to a simulated<br />
1980 to 1999 average. The projections indicate an<br />
increase <strong>of</strong> about 1°F for the 2000 to 2019 period, 2°F<br />
for the 2020 to 2039 period, and close to 4°F for the<br />
2040 to 2059 period (Nielsen-Gammon, 2011c).<br />
Precipitation trends over the 20th century are not<br />
always consistent with climate model projections.<br />
The model results for precipitation indicate a decline<br />
in precipitation toward the middle <strong>of</strong> the 21st<br />
century. However, the median rate <strong>of</strong> decline (about<br />
10 percent per century) is smaller than the observed<br />
rate <strong>of</strong> increase over the past century. Furthermore,<br />
there is considerable disagreement among models<br />
whether there will be an increase or a decrease in<br />
precipitation prior to the middle <strong>of</strong> the 21st century.<br />
While the climate models tend to agree on the overall<br />
global patterns <strong>of</strong> precipitation changes, they produce<br />
a wide range <strong>of</strong> precipitation patterns on the scale <strong>of</strong><br />
<strong>Texas</strong> itself, so that there is no portion <strong>of</strong> the state that<br />
is more susceptible to declining precipitation in the<br />
model projections than any other.<br />
<strong>Climate</strong> scientists have reported that drought is<br />
expected to increase in general worldwide because<br />
<strong>of</strong> the increase <strong>of</strong> temperatures and the trend toward<br />
concentration <strong>of</strong> rainfall into events <strong>of</strong> shorter duration<br />
(Nielsen-Gammon, 2011c). In <strong>Texas</strong>, temperatures<br />
are likely to rise; however, future precipitation<br />
trends are difficult to project. If temperatures rise<br />
and precipitation decreases, as projected by climate<br />
models, <strong>Texas</strong> would begin seeing droughts in the<br />
middle <strong>of</strong> the 21st century that are as bad or worse as<br />
those in the beginning or middle <strong>of</strong> the 20th century.<br />
While the study <strong>of</strong> climate models can certainly<br />
be informative during the regional water planning<br />
process, there is a considerable degree <strong>of</strong> uncertainty<br />
associated with use <strong>of</strong> the results at a local or regional<br />
scale. The large-scale spatial resolution <strong>of</strong> most<br />
climate models (typically at a resolution <strong>of</strong> 100 to<br />
152<br />
<strong>Chapter</strong> 4 : climate <strong>of</strong> <strong>Texas</strong><br />
WAT E R FOR TEXAS 2012 STATE WATER PLAN
200 miles by 100 to 200 miles) are <strong>of</strong> limited use for<br />
planning regions since most hydrological applications<br />
require information at a 30-mile scale or less. Recent<br />
research, including some funded by TWDB, has been<br />
focused in the area <strong>of</strong> “downscaling” climate models,<br />
or converting the global-scale output to regionalscale<br />
conditions. The process to produce a finer-scale<br />
climate model can be resource-intensive and can only<br />
be done one region at a time, thus making it difficult to<br />
incorporate the impacts <strong>of</strong> climate variability in local<br />
or region-specific water supply projections.<br />
4.8 TWDB ONGOING RESEARCH<br />
TWDB has undertaken several efforts to address<br />
potential impacts from climate variability to water<br />
resources in the state and how these impacts can be<br />
addressed in the water planning process. In response<br />
to state legislation, TWDB co-hosted a conference<br />
in El Paso on June 17, 2008, to address the possible<br />
impact <strong>of</strong> climate change on surface water supplies<br />
from the Rio Grande (Sidebar: The Far West <strong>Texas</strong><br />
<strong>Climate</strong> Change Conference). The agency also hosted<br />
two <strong>Water</strong> Planning and <strong>Climate</strong> Change Workshops<br />
THE FAR WEST TEXAS CLIMATE CHANGE CONFERENCE<br />
As a result <strong>of</strong> legislation passed during the 80th<br />
<strong>Texas</strong> Legislative Session, TWDB, in coordination<br />
with the Far West <strong>Texas</strong> Regional <strong>Water</strong> Planning<br />
Group, conducted a study regarding the possible<br />
impact <strong>of</strong> climate change on surface water supplies<br />
from the portion <strong>of</strong> the Rio Grande in <strong>Texas</strong> subject<br />
to the Rio Grande Compact. In conducting the study,<br />
TWDB was directed to a convene a conference<br />
within the Far West <strong>Texas</strong> regional water planning<br />
area to review<br />
The Far West <strong>Texas</strong> <strong>Climate</strong> Change Conference<br />
was held June 17, 2008, in El Paso. Over 100<br />
participants attended, including members <strong>of</strong> the<br />
Far West <strong>Texas</strong> Regional <strong>Water</strong> Planning Group<br />
and representatives from state and federal agencies,<br />
environmental organizations, water providers,<br />
universities, and other entities. TWDB published a<br />
report on the results <strong>of</strong> the conference in December<br />
2008. General policy recommendations from the<br />
conference included<br />
• any analysis conducted by a state located west<br />
<strong>of</strong> <strong>Texas</strong> regarding the impact <strong>of</strong> climate change<br />
• continuing a regional approach to considering<br />
climate change in regional water planning;<br />
on surface water supplies in that state;<br />
• establishing a consortium to provide a<br />
• any other current analysis <strong>of</strong> potential impacts framework for further research and discussion;<br />
<strong>of</strong> climate change on surface water resources; • reconsidering the drought <strong>of</strong> record as the<br />
and<br />
benchmark scenario for regional water<br />
• recommendations for incorporating potential planning; and<br />
impacts <strong>of</strong> climate change into the Far West • providing more funding for research,<br />
<strong>Texas</strong> Regional <strong>Water</strong> Plan, including potential<br />
impacts to the Rio Grande in <strong>Texas</strong> subject<br />
data collection, and investments in water<br />
infrastructure.<br />
to the Rio Grande Compact, and identifying<br />
feasible water management strategies to <strong>of</strong>fset<br />
any potential impacts.<br />
WAT E R FOR TEXAS 2012 STATE WATER PLAN<br />
153<br />
<strong>Chapter</strong> 4 : climate <strong>of</strong> <strong>Texas</strong>
in 2008 and 2009 to address the issue <strong>of</strong> climate on<br />
a state level. The workshops convened experts in<br />
the fields <strong>of</strong> climate variability and water resources<br />
planning to discuss possible approaches to estimating<br />
the impact <strong>of</strong> climate variability on water demand and<br />
availability and how to incorporate these approaches<br />
into regional water planning efforts.<br />
In response to recommendations from these experts,<br />
TWDB initiated two research studies. The Uncertainty<br />
and Risk in the Management <strong>of</strong> <strong>Water</strong> Resources (INTERA<br />
Incorporated and others, 2010) study developed<br />
a generalized methodology that allows various<br />
sources <strong>of</strong> uncertainty to be incorporated into the<br />
regional water planning framework. Using estimates<br />
<strong>of</strong> the probability <strong>of</strong> specific events, planners will<br />
be able to use this model to analyze a range <strong>of</strong><br />
scenarios and potential future outcomes. A second,<br />
on-going research study assessing global climate<br />
models for water resource planning applications<br />
is comparing global climate models to determine<br />
which are most suitable for use in <strong>Texas</strong>. The study<br />
is also comparing regionalization techniques used<br />
in downscaling <strong>of</strong> global climate models and will<br />
provide recommendations on the best methodology<br />
for a given region.<br />
The agency also formed a staff workgroup that leads<br />
the agency’s efforts to<br />
• monitor the status <strong>of</strong> climate science, including<br />
studies for different regions <strong>of</strong> <strong>Texas</strong>;<br />
• assess changes predicted by climate models;<br />
• analyze and report data regarding natural climate<br />
variability; and<br />
• evaluate how resilient water management<br />
strategies are in adapting to climate variability<br />
and how regional water planning groups might<br />
address the impacts.<br />
Until better information is available to determine the<br />
impacts <strong>of</strong> climate variability on water supplies and<br />
water management strategies evaluated during the<br />
planning process, regional water planning groups<br />
can continue to use safe yield (the annual amount <strong>of</strong><br />
water that can be withdrawn from a reservoir for a<br />
period <strong>of</strong> time longer than the drought <strong>of</strong> record) and<br />
to plan for more water than required to meet needs,<br />
as methods to address uncertainty and reduce risks.<br />
TWDB will continue to monitor climate policy and<br />
science and incorporate new developments into the<br />
cyclical planning process when appropriate. TWDB<br />
will also continue stakeholder and multi-disciplinary<br />
involvement on a regular basis to review and assess<br />
the progress <strong>of</strong> the agency’s efforts.<br />
REFERENCES<br />
Cleaveland, M.K., 2006, Extended Chronology<br />
<strong>of</strong> Drought in the San Antonio Area: Tree Ring<br />
Laboratory, Geosciences Department, University <strong>of</strong><br />
Arkansas.<br />
INTERA Incorporated, Richard H<strong>of</strong>fpauir Consulting,<br />
and Jackson, C.S., 2010, Analyzing Uncertainty<br />
and Risk in the Management <strong>of</strong> <strong>Water</strong> Resources<br />
for the State <strong>of</strong> <strong>Texas</strong>: Prepared for the <strong>Texas</strong> <strong>Water</strong><br />
<strong>Development</strong> <strong>Board</strong>, http://www.twdb.state.tx.us<br />
/RWPG/rpgm_rpts/0904830857_Uncertainty_<br />
waterResourcemgmt.pdf.<br />
IPCC (International Panel on <strong>Climate</strong> Change), 2007,<br />
<strong>Climate</strong> Change 2007: Synthesis Report: Cambridge<br />
University Press, http://www.ipcc.ch/publications_<br />
and_data/publications_ipcc_fourth_assessment_<br />
report_synthesis_report.htm.<br />
154<br />
<strong>Chapter</strong> 4 : climate <strong>of</strong> <strong>Texas</strong><br />
WAT E R FOR TEXAS 2012 STATE WATER PLAN
Larkin, T.J. and Bomar, G.W., 1983, Climatic<br />
Atlas <strong>of</strong> <strong>Texas</strong>: <strong>Texas</strong> <strong>Water</strong> <strong>Development</strong> <strong>Board</strong><br />
Limited Publication 192, http://www.twdb.state.tx.us/<br />
publications/reports/limited_printing/doc/LP192.pdf.<br />
NCDC (National Climatic Data Center), 2011,<br />
<strong>Climate</strong> data: Asheville, NC, National Climatic Data<br />
Center, National Environmental Satellite Data<br />
and Information Services, National Oceanic and<br />
Atmospheric Administration, U.S. Department <strong>of</strong><br />
Commerce, ASCII tabular data files, http://www7.<br />
ncdc.noaa.gov/CDO/CDODivisionalSelect.jsp#.<br />
Nielsen-Gammon, J.W., 2011a, The Drought <strong>of</strong> Record<br />
was Made to Be Broken, Houston Chronicle, http://<br />
blog.chron.com/climateabyss/2011/09/the-drought-<strong>of</strong>record-was-made-to-be-broken/.<br />
Nielsen-Gammon, J.W., 2011b, written communication:<br />
comments on the Draft 2012 State <strong>Water</strong> Plan.<br />
Nielsen-Gammon, J.W., 2011c., The Changing <strong>Climate</strong><br />
<strong>of</strong> <strong>Texas</strong> in Schmandt and others, eds., The Impact <strong>of</strong><br />
Global Warming on <strong>Texas</strong>, Second Edition: University<br />
<strong>of</strong> <strong>Texas</strong> Press, http://www.texasclimate.org/Home/<br />
Impact<strong>of</strong>GlobalWarmingon<strong>Texas</strong>/tabid/481/Default.<br />
aspx.<br />
2002: U.S. Geological Survey <strong>Water</strong> Resources Division<br />
Open-File Report 03-193.<br />
TWDB (<strong>Texas</strong> <strong>Water</strong> <strong>Development</strong> <strong>Board</strong>), 1967, The<br />
<strong>Climate</strong> and Physiography <strong>of</strong> <strong>Texas</strong>: <strong>Texas</strong> <strong>Water</strong><br />
<strong>Development</strong> <strong>Board</strong> Report 53, http://www.twdb.<br />
state.tx.us/publications/reports/numbered_reports/<br />
doc/R53/report53.asp.<br />
TWDB (<strong>Texas</strong> <strong>Water</strong> <strong>Development</strong> <strong>Board</strong>), 2005, Digital<br />
Climatic Atlas <strong>of</strong> <strong>Texas</strong>: <strong>Texas</strong> <strong>Water</strong> <strong>Development</strong><br />
<strong>Board</strong>, Annual high-resolution climate data sets for<br />
the state <strong>of</strong> <strong>Texas</strong> (2.5-arc minute 1981–1990 and 1991–<br />
2000 10-year mean annual grids for <strong>Texas</strong>) raster grid<br />
files, http://www.twdb.state.tx.us/GAM/resources/<br />
Digital_<strong>Climate</strong>_Atlas_TX.zip.<br />
USGS (U.S. Geological Survey), 2000, Hydro 1K digital<br />
elevation model (DEM) for North America: Sioux<br />
Falls, SD, Earth Resources Observation and Science<br />
Center, U.S. Geological Survey, U.S. Department <strong>of</strong><br />
the Interior, DEM file, http://edc.usgs.gov/products/<br />
elevation/gtopo30/hydro/na_dem.html.<br />
PRISM <strong>Climate</strong> Group, 2011, Annual high-resolution<br />
climate data sets for the conterminous United States<br />
(2.5-arc minute 2001–2010 mean annual grids for the<br />
conterminous United States): Corvallis, OR, PRISM<br />
<strong>Climate</strong> Group, Oregon State University, Arc/INFO<br />
ASCII raster grid files, http://www.prism.oregonstate.<br />
edu.<br />
Slade, R.M., Jr. and Patton, J., 2003, Major and<br />
catastrophic storms and floods in <strong>Texas</strong> – 215 major<br />
and 41 catastrophic events from 1853 to September 1,<br />
WAT E R FOR TEXAS 2012 STATE WATER PLAN<br />
155<br />
<strong>Chapter</strong> 4 : climate <strong>of</strong> <strong>Texas</strong>