

Chapter 2 Regional Summaries - Texas Water Development Board
Chapter 2 Regional Summaries - Texas Water Development Board
Chapter 2 Regional Summaries - Texas Water Development Board

Create successful ePaper yourself
Turn your PDF publications into a flip-book with our unique Google optimized e-Paper software.
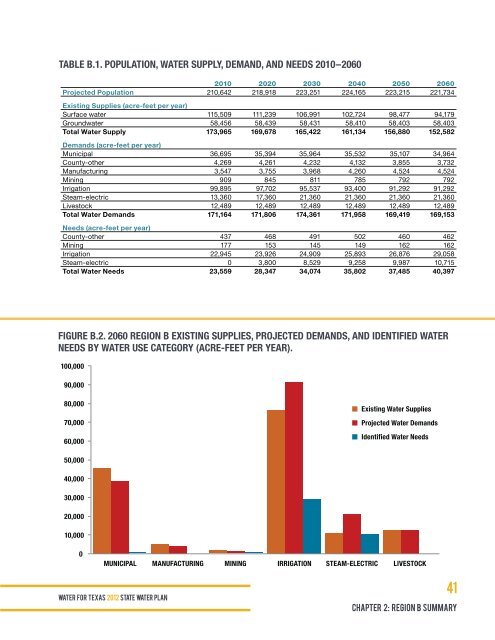
TABLE B.1. POPULATION, WATER SUPPLY, DEMAND, AND NEEDS 2010–2060<br />
Projected Population<br />
2010 2020 2030 2040 2050 2060<br />
210,642 218,918 223,251 224,165 223,215 221,734<br />
Existing Supplies (acre-feet per year)<br />
Surface water 115,509 111,239 106,991 102,724 98,477 94,179<br />
Groundwater 58,456 58,439 58,431 58,410 58,403 58,403<br />
Total <strong>Water</strong> Supply 173,965 169,678 165,422 161,134 156,880 152,582<br />
Demands (acre-feet per year)<br />
Municipal 36,695 35,394 35,964 35,532 35,107 34,964<br />
County-other 4,269 4,261 4,232 4,132 3,855 3,732<br />
Manufacturing 3,547 3,755 3,968 4,260 4,524 4,524<br />
Mining 909 845 811 785 792 792<br />
Irrigation 99,895 97,702 95,537 93,400 91,292 91,292<br />
Steam-electric 13,360 17,360 21,360 21,360 21,360 21,360<br />
Livestock 12,489 12,489 12,489 12,489 12,489 12,489<br />
Total <strong>Water</strong> Demands 171,164 171,806 174,361 171,958 169,419 169,153<br />
Needs (acre-feet per year)<br />
County-other 437 468 491 502 460 462<br />
Mining 177 153 145 149 162 162<br />
Irrigation 22,945 23,926 24,909 25,893 26,876 29,058<br />
Steam-electric 0 3,800 8,529 9,258 9,987 10,715<br />
Total <strong>Water</strong> Needs 23,559 28,347 34,074 35,802 37,485 40,397<br />
B<br />
FIGURE B.2. 2060 REGION B EXISTING SUPPLIES, PROJECTED DEMANDS, AND IDENTIFIED WATER<br />
NEEDS BY WATER USE CATEGORY (ACRE-FEET PER YEAR).<br />
100,000<br />
90,000<br />
80,000<br />
70,000<br />
60,000<br />
50,000<br />
Existing <strong>Water</strong> Supplies<br />
Projected <strong>Water</strong> Demands<br />
Identified <strong>Water</strong> Needs<br />
B-2<br />
40,000<br />
30,000<br />
20,000<br />
10,000<br />
0<br />
MUNICIPAL MANUFACTURING MINING IRRIGATION STEAM-ELECTRIC LIVESTOCK<br />
WAT E R FOR TEXAS 2012 STATE WATER PLAN<br />
41<br />
<strong>Chapter</strong> 2: region B summary


