

Chapter 2 Regional Summaries - Texas Water Development Board
Chapter 2 Regional Summaries - Texas Water Development Board
Chapter 2 Regional Summaries - Texas Water Development Board

Create successful ePaper yourself
Turn your PDF publications into a flip-book with our unique Google optimized e-Paper software.
TABLE A.1. POPULATION, WATER SUPPLY, DEMAND, AND NEEDS 2010–2060<br />
Projected Population<br />
2010 2020 2030 2040 2050 2060<br />
388,104 423,380 453,354 484,954 516,729 541,035<br />
Existing Supplies (acre-feet per year)<br />
Surface water 40,636 47,381 47,348 47,284 47,189 47,043<br />
Groundwater 1,131,151 1,018,554 951,799 877,961 790,795 714,438<br />
Reuse 25,129 28,928 30,620 32,528 34,598 37,577<br />
Total <strong>Water</strong> Supply 1,196,916 1,094,863 1,029,767 957,773 872,582 799,058<br />
Demands (acre-feet per year)<br />
Municipal 68,137 72,793 76,638 80,648 84,614 87,658<br />
County-other 9,468 11,097 12,550 14,035 15,516 16,584<br />
Manufacturing 43,930 47,275 49,998 52,612 54,860 58,231<br />
Mining 14,012 14,065 13,218 11,696 10,495 9,542<br />
Irrigation 1,429,990 1,311,372 1,271,548 1,203,332 1,066,736 936,929<br />
Steam-electric 25,139 26,996 29,116 30,907 33,163 37,415<br />
Livestock 37,668 43,345 45,487 47,842 50,436 53,285<br />
Total <strong>Water</strong> Demands 1,628,344 1,526,943 1,498,555 1,441,072 1,315,820 1,199,644<br />
Needs (acre-feet per year)<br />
Municipal 0 967 7,354 13,968 20,492 25,712<br />
County-other 0 108 1,190 2,663 4,235 5,502<br />
Manufacturing 173 800 1,317 2,845 4,212 5,866<br />
Irrigation 454,628 452,144 477,338 482,226 433,155 381,180<br />
Steam-electric 75 99 117 128 136 154<br />
Total <strong>Water</strong> Needs 454,876 454,118 487,316 501,830 462,230 418,414<br />
A<br />
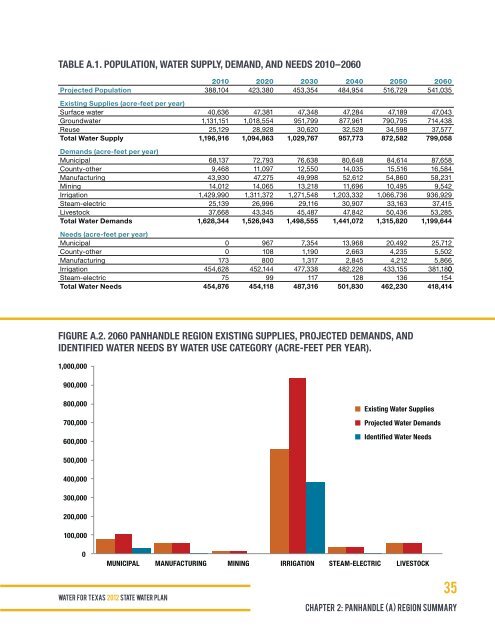
FIGURE A.2. 2060 PANHANDLE REGION EXISTING SUPPLIES, PROJECTED DEMANDS, AND<br />
IDENTIFIED WATER NEEDS BY WATER USE CATEGORY (ACRE-FEET PER YEAR).<br />
1,000,000<br />
900,000<br />
800,000<br />
700,000<br />
600,000<br />
500,000<br />
400,000<br />
Existing <strong>Water</strong> Supplies<br />
Projected <strong>Water</strong> Demands<br />
Identified <strong>Water</strong> Needs<br />
A-2<br />
300,000<br />
200,000<br />
100,000<br />
0<br />
MUNICIPAL MANUFACTURING MINING IRRIGATION STEAM-ELECTRIC LIVESTOCK<br />
WAT E R FOR TEXAS 2012 STATE WATER PLAN<br />
35<br />
<strong>Chapter</strong> 2: Panhandle (A) region summary


