Evaluation Template 3.26.xlsx - Texas Solar Power Company
Evaluation Template 3.26.xlsx - Texas Solar Power Company
Evaluation Template 3.26.xlsx - Texas Solar Power Company

You also want an ePaper? Increase the reach of your titles
YUMPU automatically turns print PDFs into web optimized ePapers that Google loves.
Independent <strong>Solar</strong> Financial <strong>Evaluation</strong><br />
Commissioned by: <strong>Texas</strong> <strong>Solar</strong> <strong>Power</strong><br />
Property: Mueller<br />
Exclusively for: Mueller Customer<br />
Utility: Austin Energy<br />
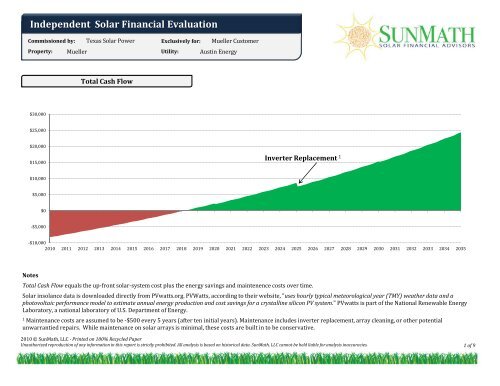
Total Cash Flow<br />
$30,000<br />
$25,000<br />
$20,000<br />
$15,000<br />
Inverter Replacement 1<br />
$10,000<br />
$5,000<br />
$0<br />
‐$5,000<br />
‐$10,000<br />
2010 2011 2012 2013 2014 2015 2016 2017 2018 2019 2020 2021 2022 2023 2024 2025 2026 2027 2028 2029 2030 2031 2032 2033 2034 2035<br />
Notes<br />
Total Cash Flow equals the up‐front solar‐system cost plus the energy savings and maintenence costs over time.<br />
<strong>Solar</strong> insolance data is downloaded directly from PVwatts.org. PVWatts, according to their website, "uses hourly typical meteorological year (TMY) weather data and a<br />
photovoltaic performance model to estimate annual energy production and cost savings for a crystalline silicon PV system." PVwatts is part of the National Renewable Energy<br />
Laboratory, a national laboratory of U.S. Department of Energy.<br />
1<br />
Maintenance costs are assumed to be ‐$500 every 5 years (after ten initial years). Maintenance includes inverter replacement, array cleaning, or other potential<br />
unwarrantied repairs. While maintenance on solar arrays is minimal, these costs are built in to be conservative.<br />
2010 © SunMath, LLC · Printed on 100% Recycled Paper<br />
Unauthorized reproduction of any information in this report is strictly prohibited. All analysis is based on historical data. SunMath, LLC cannot be held liable for analysis inaccuracies.<br />
1 of 9
Lifetime Energy Cost: No <strong>Solar</strong> System vs. Proposed <strong>Solar</strong> System<br />
Most people who consider purchasing a solar array only have one alternative: Continuing to purchase power from<br />
their local utility. The below graph shows how much money you would save if you choose to invest in a solar system.<br />
While solar systems have a large up‐front cost, they typically result in lower total power costs over their lifetime;<br />
Meaning, in this case, purchasing a solar system makes financial sense.<br />
BreakEven Payback<br />
Years 8.2<br />
$90,000<br />
$80,000<br />
$70,000<br />
$60,000<br />
Lifetime Savings from <strong>Solar</strong><br />
$24,360<br />
4<br />
$50,000<br />
$40,000<br />
$30,000<br />
$20,000<br />
Up‐front <strong>Solar</strong> System<br />
Expense 2<br />
Break‐Even Payback 3<br />
$10,000<br />
$0<br />
2010 2012 2014 2016 2018 2020 2022 2024 2026 2028 2030 2032 2034<br />
Without <strong>Solar</strong> System<br />
With <strong>Solar</strong> System<br />
Notes<br />
2<br />
The "With <strong>Solar</strong> System" Scenario starts out above zero because there is an up‐front cost to install a solar system.<br />
3<br />
The break‐even is the point at which you would have spent the same amount of money whether you had bought a solar system or if you had not. After this point, your<br />
solar system will have paid for itself and would continue to offset your energy consumption for free.<br />
4<br />
"Lifetime Savings from <strong>Solar</strong>" equals the total amount of money you would save over the lifetime of the solar system vs. not having a solar system<br />
2010 © SunMath, LLC · Printed on 100% Recycled Paper<br />
Unauthorized reproduction of any information in this report is strictly prohibited. All analysis is based on historical data. SunMath, LLC cannot be held liable for analysis inaccuracies.<br />
2 of 9<br />
2 of 15
Investment Statistics<br />
Net Out‐of<br />
Pocket<br />
$8,199<br />
31%<br />
Sources of System Payment<br />
Return Statistics<br />
5<br />
Net Present Value (NPV) of Array $10,081<br />
Internal Rate of Return (IRR) 6 13.4%<br />
Approximate "taxable bond‐equivalent" Yield 7 18.6%<br />
Tax Credits<br />
$3,514<br />
13%<br />
Rebates<br />
$14,652<br />
56%<br />
Total Production<br />
Energy Production (kWh)<br />
184,292<br />
Energy Savings ($) $34,158<br />
BreakEven Payback<br />
Years 8.2<br />
Notes<br />
5<br />
Net Present Value (NPV) is: the difference between the present value of cash inflows and the present value of cash outflows. NPV is used in capital budgeting to analyze the<br />
profitability of an investment or project.<br />
6<br />
Internal Rate or Return (IRR or RoR) is: the discount rate used in capital budgeting that makes the net present value of all cash flows from a project equal to zero. Generally<br />
speaking, the higher a project's internal rate of return, the more desirable it is to undertake the project.<br />
7<br />
The "taxable bond‐equivalent" Yield allows a customer to compare a solar installation to a normal taxable bond. Simply comparing the IRR is not fair because individuals<br />
do not pay taxes on money they save, only on money they earn (in the case of a corporate bond).<br />
Salvage Value is assumed to be $0. In reality, the entire solar array will likely still be producing electricity, and would therefore have some value. To be conservative, we<br />
assume they are useless.<br />
2010 © SunMath, LLC · Printed on 100% Recycled Paper<br />
Unauthorized reproduction of any information in this report is strictly prohibited. All analysis is based on historical data. SunMath, LLC cannot be held liable for analysis inaccuracies.<br />
3 of 9
Electricity Bill Savings in First Year<br />
Nov Dec Jan Feb Mar Apr May Jun Jul Aug Sep Oct Annual<br />
kWh Usage 1,211 1,161 1,070 985 925 1,002 1,315 1,870 2,226 2,320 2,225 1,690 18,000<br />
kWh Produced 574 527 580 592 715 680 692 709 756 756 697 709 7,988<br />
Nov Dec Jan Feb Mar Apr May Jun Jul Aug Sep Oct Annual<br />
Old Utility Bill<br />
8<br />
$112 $107 $98 $90 $84 $92 $141 $211 $256 $269 $257 $168 $1,885<br />
Energy Savings $60 $55 $60 $59 $67 $67 $86 $88 $94 $95 $87 $76 $894<br />
New Utility Bill $53 $53 $38 $31 $17 $25 $55 $122 $162 $174 $170 $92 $992<br />
% of Usage Offset 53% 51% 61% 66% 80% 72% 61% 42% 37% 35% 34% 45% 47%<br />
$300<br />
$250<br />
$200<br />
$150<br />
$100<br />
$50<br />
$60 $55 $60 $59<br />
$67 $67<br />
$86 $88<br />
$94 $95<br />
$87<br />
$76<br />
$0<br />
Nov Dec Jan Feb Mar Apr May Jun Jul Aug Sep Oct<br />
Old Utility Bill New Utility Bill Monthly Savings<br />
Notes<br />
8<br />
"Old Utility Bill" estimated based on information submitted to SunMath. Additional utility costs including gas consumption, and other fees are not included for the<br />
purpose of this analysis. If we estimated your electricity consumption and were off by >25%, please email us at support@sunmath.com with your correct usage and we'll<br />
resend your evaluation.<br />
2010 © SunMath, LLC · Printed on 100% Recycled Paper<br />
Unauthorized reproduction of any information in this report is strictly prohibited. All analysis is based on historical data. SunMath, LLC cannot be held liable for analysis inaccuracies.<br />
4 of 9
Annual Cash Flow Summary (Years 112)<br />
Year 0 1 2 3 4 5 6 7 8 9 10 11 12<br />
System Cost ‐$26,365 ‐ ‐ ‐ ‐ ‐ ‐ ‐ ‐ ‐ ‐ ‐ ‐<br />
Loan ‐ ‐ ‐ ‐ ‐ ‐ ‐ ‐ ‐ ‐ ‐ ‐ ‐<br />
Total Rebates $14,652 ‐ ‐ ‐ ‐ ‐ ‐ ‐ ‐ ‐ ‐ ‐ ‐<br />
Total Tax Credits $3,514 ‐ ‐ ‐ ‐ ‐ ‐ ‐ ‐ ‐ ‐ ‐ ‐<br />
Total Cost $8,199 <br />
Other Incentives<br />
Feed‐In Tariffs ‐ ‐ ‐ ‐ ‐ ‐ ‐ ‐ ‐ ‐ ‐ ‐ ‐<br />
9<br />
Ren. Energy Credits ‐ ‐ ‐ ‐ ‐ ‐ ‐ ‐ ‐ ‐ ‐ ‐ ‐<br />
Energy Savings ‐ $894 $924 $955 $987 $1,020 $1,054 $1,090 $1,126 $1,164 $1,203 $1,244 $1,285<br />
Total Other Incentives $894 $924 $955 $987 $1,020 $1,054 $1,090 $1,126 $1,164 $1,203 $1,244 $1,285<br />
Costs<br />
Loan Service ‐ ‐ ‐ ‐ ‐ ‐ ‐ ‐ ‐ ‐ ‐ ‐ ‐<br />
Maintenance ‐ ‐ ‐ ‐ ‐ ‐ ‐ ‐ ‐ ‐ ‐ ‐$200 ‐<br />
Total Costs ‐ ‐ ‐ ‐ ‐ ‐ ‐ ‐ ‐ ‐ ‐ ‐$200 ‐<br />
Total Cash Flows $8,199 $894 $924 $955 $987 $1,020 $1,054 $1,090 $1,126 $1,164 $1,203 $1,044 $1,285<br />
Annual Rate of Return<br />
10<br />
11% 11% 12% 12% 12% 13% 13% 14% 14% 15% 13% 16%<br />
Notes<br />
9<br />
All solar arrays are eligible for Renewable Energy Credits (RECs), however, many utilities require that all RECs be transferred in exchange for any incentive offered.<br />
Check the fine print of your agreement to determine if you own your RECs.<br />
10<br />
"Annual Rate of Return" divides the nominal annual cash flow in each respective year by the net cost of the system .<br />
2010 © SunMath, LLC · Printed on 100% Recycled Paper<br />
Unauthorized reproduction of any information in this report is strictly prohibited. All analysis is based on historical data. SunMath, LLC cannot be held liable for analysis inaccuracies.<br />
5 of 9
Alternative Investment Analysis 11<br />
Considering other uses for the money needed for a solar installation is<br />
important and often enlightening. Below, you will see the value of your solar<br />
array cost ($8,199) after 25 years if you chose to invest in a<br />
financial asset instead of solar.<br />
If you install a solar array and then invest your energy savings in financial<br />
assets over the next 25 years, you will have the below amounts of money.<br />
Additionally, you will have reduced your total risk by getting<br />
the large portion of your return from energy savings, instead of a financial asset.<br />
Certificate of Deposit<br />
$19,808<br />
Certificate of Deposit<br />
$51,426<br />
RISK<br />
Corporate Bonds<br />
$31,140<br />
<strong>Solar</strong> Array<br />
Cost<br />
z<br />
Corporate Bonds<br />
$66,424<br />
$8,199<br />
Stocks<br />
$48,956<br />
Stocks<br />
$86,960<br />
Notes<br />
11<br />
Approximate expected returns for different financial assetsbased on historical returns. Return assumptions are on page nine.<br />
= $10,000<br />
= $5,000<br />
2010 © SunMath, LLC · Printed on 100% Recycled Paper<br />
Unauthorized reproduction of any information in this report is strictly prohibited. All analysis is based on historical data. SunMath, LLC cannot be held liable for analysis inaccuracies.<br />
6 of 9
Property Value Increase<br />
<strong>Solar</strong> panels add value to structures by reducing monthly carrying costs (reducing energy costs). Everyone quotes an Appraiser's Journal Article: Evidence<br />
of Rational Market Valuations for Home Energy Efficiency that says: "the selling price of homes increases by $20.73 for every $1 decrease in annual fuel<br />
bills". Rather than multiplying your expected annual energy savings times 20.73, we have supplied you with a real‐world example of how much more a<br />
Home without <strong>Solar</strong> Panels<br />
Home with <strong>Solar</strong> Panels<br />
The Smith family has decided<br />
to buy a house. They believe<br />
they can afford to spend<br />
$1,800 a month.<br />
After deducting all fixed and<br />
variable costs, the Smith's<br />
know how large a mortgage<br />
payment they can afford.<br />
Monthly Budget $1,800 Monthly Budget $1,800<br />
‐ Cable, HOA, Security, Etc. ‐$300 ‐ Cable, HOA, Security, Etc. ‐$300<br />
Average Monthly Energy Costs $157 Average Monthly Energy Costs $83<br />
12<br />
= Available for Mortgage Payment $1,343 = Available for Mortgage Payment $1,417<br />
The Smith's are willing to<br />
spend $13,875 more for a<br />
house with your size solar<br />
array.<br />
If the Smith's have $1,343 a month,<br />
they can afford to spend $250,156<br />
on a house.<br />
If the Smith's have $1,417 a month,<br />
they can afford to spend $264,031<br />
on a house.<br />
The Average Monthly Energy Costs above have been estimated based on your current energy consumption, as well as the size array the contractor has proposed for you.<br />
Therefore, the home value increase calculated above is how much more your house should be worth. If you have a more or less valuable house, it will not affect the<br />
property value difference, i.e. If you own a $100,000 or $1,000,000 house, the value of your house should still increase by $13,875.<br />
Notes<br />
12<br />
The mortgage for both houses is assumed to be a 30 year fixed mortgage at today's prevailing rates (4.50%)<br />
2010 © SunMath, LLC · Printed on 100% Recycled Paper<br />
Unauthorized reproduction of any information in this report is strictly prohibited. All analysis is based on historical data. SunMath, LLC cannot be held liable for analysis inaccuracies.<br />
7 of 9
CO2 Reduction Snapshot 13<br />
In addition to reducing your energy bills, a solar array reduces your carbon footprint.<br />
Below are various actions with equal CO 2 emission reductions.<br />
kWh Produced per Year<br />
Trees Planted<br />
6.1 kW Array<br />
kWh Produced per Year<br />
kWh Produced per Year by<br />
kWh Produced per Year<br />
of CO 2 Offset Annually<br />
kWh Produced per Year<br />
Cars Taken off the Road for One Year<br />
Notes<br />
13<br />
Average of 1.5 pounds of carbon emissions per kilowatt‐hour for US ,based on Department of Energy, for Canada, the Ontario Ministry for Energy; for the UK, UK<br />
Environment Watch and for Australia, various state government environmental departments (averaged)<br />
2010 © SunMath, LLC · Printed on 100% Recycled Paper<br />
Unauthorized reproduction of any information in this report is strictly prohibited. All analysis is based on historical data. SunMath, LLC cannot be held liable for analysis inaccuracies.<br />
8 of 9
Inputs & Assumptions<br />
System Specs<br />
Total Cost<br />
$26,365<br />
Cost / Watt $4.32<br />
Total Watts 6,105<br />
Orientation South (180)<br />
System Life<br />
25 Years<br />
Installation Date<br />
Oct‐2010<br />
Expected Investment Returns<br />
Certificate of Deposit<br />
4%<br />
Corporate Bonds 6%<br />
Stocks 8%<br />
Other Statistics<br />
Panel Efficiency in 25 years<br />
14<br />
85%<br />
Discount Rate 4.5%<br />
Annual Energy Increase 4.0%<br />
Tax Rate 28%<br />
15<br />
Average Electricty Cost (kWh) $0.0940<br />
Notes<br />
14<br />
Photovoltaic panels decline in efficiency due to UV exposure. Sandia National Laboratories published a paper titled: Photovoltaic Module Performance and Durability<br />
Following LongTerm Field Exposure, that states the annual photovoltaic output decline is 0.4% annually.<br />
15<br />
Electricity Cost is estimated based on bills submitted or regional average. Includes applicable taxes.<br />
2010 © SunMath, LLC · Printed on 100% Recycled Paper<br />
Unauthorized reproduction of any information in this report is strictly prohibited. All analysis is based on historical data. SunMath, LLC cannot be held liable for analysis inaccuracies.<br />
9 of 9