Understanding Electroencephalography - University of Arkansas for ...
Understanding Electroencephalography - University of Arkansas for ...
Understanding Electroencephalography - University of Arkansas for ...
Create successful ePaper yourself
Turn your PDF publications into a flip-book with our unique Google optimized e-Paper software.
B. Sharp, M.D.<br />
Gregory<br />
<strong>of</strong> Pediatric Neurology<br />
Chief<br />
<strong>of</strong> <strong>Arkansas</strong> For Medical Sciences<br />
<strong>University</strong><br />
Director, Neuroscience Center <strong>of</strong> Excellence<br />
Medical<br />
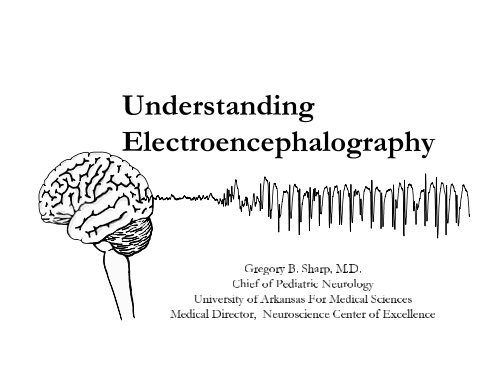
<strong>Understanding</strong><br />
<strong>Electroencephalography</strong>
The Source <strong>of</strong> EEG<br />
EEG = a measure <strong>of</strong> cerebral electrical activity<br />
The generator sources <strong>for</strong> EEG waves are within the<br />
cerebral cortex<br />
Electrical activity recorded on the scalp is produced<br />
by extracellular current flow associated with<br />
summated excitatory and inhibitory postsynaptic<br />
potentials (EPSPs(<br />
and IPSPs)<br />
Individual action potentials do not contribute<br />
directly to EEG activity
Synaptic Potentials:<br />
The Basis <strong>of</strong> EEG Activity<br />
Synaptic potentials are <strong>of</strong> much lower voltage<br />
than action potentials, but the produced current<br />
has a much larger distribution<br />
PSPs have a longer duration and involve a larger<br />
amount <strong>of</strong> membrane surface area than APs
EPSPs and IPSPs<br />
EPSP – produces a change in membrane<br />
permeability within a select portion <strong>of</strong> the cell<br />
membrane resulting in a net influx <strong>of</strong> + ions that<br />
depolarizes the cell<br />
IPSP – selective activation <strong>of</strong> either Cl or K channels resulting in a net outward ionic +<br />
- current<br />
with hyperpolarization <strong>of</strong> the cell
EEG: A Reflection <strong>of</strong> Current<br />
Spontaneous EEG activity occurs when currents<br />
flow across charged neuronal membranes<br />
An EEG wave<strong>for</strong>m reflects a summation <strong>of</strong><br />
PSPs from thousands or even millions <strong>of</strong><br />
cortical neurons<br />
The EEG represents the “average” behavior <strong>of</strong><br />
large neuronal aggregates<br />
The current flow from positive to negative is<br />
arranged in a dipole
The Dipole<br />
Theoretically, the current flows in a 3-3<br />
dimensional ellipse with the greatest current<br />
density along a straight line connecting the<br />
positive pole to the negative pole<br />
The complex arrangement <strong>of</strong> the brain and<br />
head, differences in cell type and function within<br />
a region, and physical differences between brain<br />
areas result in an approximate dipole that is not<br />
a perfect model.
Rhythmical vs. Arrhythmical<br />
EEG Activity<br />
When EEG waves are rhythmical, most <strong>of</strong> the<br />
cells within the given neuronal pool are<br />
behaving similarly<br />
With arrhythmic activity, there is less correlation<br />
with individual cell behavior
Pyamidal Cells:<br />
Principal Current Generators <strong>of</strong> EEG<br />
Topographical organization within the cortical<br />
mantle corresponds to a dipoles oriented<br />
perpendicular to the cortical surface
Factors Affecting EEG Wave<strong>for</strong>ms<br />
Voltage <strong>of</strong> the cortical discharge<br />
Area involved in synchronous activity<br />
Degree <strong>of</strong> synchrony<br />
Location <strong>of</strong> the dipole generators in relation to<br />
the convolutions <strong>of</strong> the cortical mantle.
Factors that Attenuate Voltage<br />
Primarily overlying spinal fluid and dura<br />
Scalp to a lesser extent<br />
Scalp recorded activity represents “spatial averaging” <strong>of</strong><br />
electrical activity from a limited area <strong>of</strong> cortex<br />
20-70% <strong>of</strong> epilepti<strong>for</strong>m activity may not be seen on<br />
scalp EEG<br />
Involvement <strong>of</strong> small areas <strong>of</strong> tissue is associated with much<br />
greater attenuation <strong>of</strong> activity<br />
Activity arising from cortex within the walls or depths <strong>of</strong> sulci<br />
may not be recorded
Origin <strong>of</strong> EEG Rhythmicity<br />
Rhythmical activity – sequences <strong>of</strong> regularly recurring<br />
wave<strong>for</strong>ms <strong>of</strong> similar shape and duration<br />
Rhythmical activity may be locally generated or occur<br />
via projected synaptic inputs from deeper structures<br />
The thalamus, via an anatomic cellular organization,<br />
thalamocortical projections and mechansims that are<br />
not fully understood, governs different types <strong>of</strong><br />
rhythmical activity<br />
Sleep spindles<br />
Alpha rhythm in the occipital cortex<br />
3 per second spike and wave associated with absence seizures
Vertex Wave and Sleep Spindles<br />
Fp1-F3<br />
F3-C3<br />
Fp1-F3<br />
C3-P3<br />
P3-O1<br />
F3-C3<br />
Fp2-F4<br />
C3-P3<br />
F4-C4<br />
C4-P4<br />
P3-O1<br />
P4-O2<br />
Fp2-F4<br />
Fp1-F7<br />
F7-T 3<br />
F4-C4<br />
T3-T5<br />
C4-P4<br />
T5-O1<br />
P4-O2<br />
Fp2-F8<br />
F8-T 4<br />
T4-T6<br />
T6-O2
Posterior Alpha Rhythm<br />
Fp1-F3<br />
F3-C3<br />
C3-P3<br />
P3-O1<br />
Fp2-F4<br />
F4-C4<br />
C4-P4<br />
P4-O2
Epilepti<strong>for</strong>m Discharges: Spikes<br />
Indicate susceptibility to seizures<br />
May be generalized or focal<br />
Focal spikes – cortical spikes are associated<br />
with synchronous paroxysmal depolarizing<br />
bursts occurring in neurons within the focus<br />
resulting in extracellular current flow that is<br />
recorded as surface spikes
The Spike and Wave Complex<br />
The cellular depolarizing bursts are followed by<br />
long-lasting<br />
lasting afterhyperpolarization in cells within<br />
the focus<br />
Additional inhibition occurs in surrounding<br />
cortex, thalamus and other subcortical areas<br />
This results in a surface slow wave that follows<br />
the individual spike
Left Temporal Spikes<br />
Fp1-F7<br />
F7-T3<br />
T3-T5<br />
Spike and slow wave complex
Neuronal Synchronization<br />
The interictal spike may be initiated by a<br />
spontaneous burst in one or a few cells<br />
Each cell has excitatory connections to a<br />
number <strong>of</strong> other cells<br />
Excitatory connections will allow burst<br />
propagation if inhibition is decreased, absent or<br />
simply overcome<br />
Loss <strong>of</strong> effective dendritic inhibitory synapses<br />
may occur over time
Generalized Spike-and<br />
and-Wave<br />
A pathological exaggeration <strong>of</strong> cortical excitability is the<br />
basic disturbance and appears to initiate the process<br />
Cortical spikes precede epilepti<strong>for</strong>m discharges in<br />
depths<br />
Thalamocortical connections are necessary <strong>for</strong><br />
triggering and phasing the spike-and<br />
and-wave bursts<br />
The brainstem reticular <strong>for</strong>mation appears to modulate<br />
spike-and<br />
and-wave activity by modifying the level <strong>of</strong><br />
cortical excitability.<br />
Substantia nigra involvement in some way is essential in<br />
the production <strong>of</strong> generalized convulsions.
EEG Frequencies<br />
Delta<br />
Theta<br />
Alpha 8 - 13<br />
Beta<br />
0 - 4 Hertz<br />
4 - 7 Hertz<br />
13 Hetrz<br />
> 13 Hertz
EEG in Neonates<br />
Premature newborn – due to the incomplete<br />
development <strong>of</strong> neuronal connections, synapse<br />
<strong>for</strong>mation, myelination, , etc., EEG activity prior<br />
to 30 weeks estimated gestational age (EGA) is<br />
disccontinuous and very “abnormal” appearing<br />
Focal sharp discharges in frontal and temporal<br />
regions are normal to some extent until about<br />
44 weeks EGA
Trace Discontinue in 27 week EGA Neonate<br />
Fp1-F7<br />
F7-T5<br />
T5-O1<br />
Fp1-F3<br />
F3-P3<br />
P3-O1<br />
Fp2-F4<br />
F4-P4<br />
P4-O2<br />
Fp2-F8<br />
F8-T6<br />
T6-O2
2 month old with Enterococcal meningitis and left posterior<br />
temporal focal electrographic seizure<br />
FP1-F7<br />
F7-T5<br />
T5-O1<br />
FP1-F3<br />
F3-P3<br />
P3-O1<br />
Fp2-F4<br />
F4-P4<br />
P4-O2<br />
Fp2-F8<br />
F8-T6<br />
T6-O2<br />
1 sec<br />
50 µV
2 month old with Enterococcal meningitis with an<br />
electrographic seizure discharge, maximal right frontal<br />
FP1-F7<br />
F7-T5<br />
T5-O1<br />
FP1-F3<br />
F3-P3<br />
P3-O1<br />
Fp2-F4<br />
F4-P4<br />
P4-O2<br />
Fp2-F8<br />
F8-T6<br />
T6-O2<br />
1 sec<br />
50 µV
2 month old with Enterococcal meningitis and right posterior<br />
temporal focal electrographic seizure<br />
FP1-F7<br />
F7-T5<br />
T5-O1<br />
FP1-F3<br />
F3-P3<br />
P3-O1<br />
Fp2-F4<br />
F4-P4<br />
P4-O2<br />
Fp2-F8<br />
F8-T6<br />
T6-O2<br />
1 sec<br />
50 µV
2 month old with Enterococcal meningitis and bilateral<br />
independent focal electrographic seizures<br />
FP1-F7<br />
F7-T5<br />
T5-O1<br />
FP1-F3<br />
F3-P3<br />
P3-O1<br />
Fp2-F4<br />
F4-P4<br />
P4-O2<br />
Fp2-F8<br />
F8-T6<br />
T6-O2<br />
1 sec<br />
50 µV
Progression <strong>of</strong> EEG in Childhood<br />
Occipital rhythmical activity = Alpha rhythm<br />
3-55 months 3.5-4.5 Hertz<br />
12 months 5-66 Hertz<br />
3 years 7.5-9.5 Hertz<br />
9 years >9 Hertz
EEG During Sleep<br />
Stage I sleep<br />
Dropout <strong>of</strong> alpha rhythm<br />
Intermixed slowing<br />
Stage II sleep<br />
Increased intermixed theta and delta slowing<br />
Vertex waves, sleep spindles and K-complexesK<br />
Positive occipital sharp transients <strong>of</strong> sleep (POSTs(<br />
POSTs)
Progression <strong>of</strong> Sleep<br />
Stage III sleep<br />
Increased delta slowing<br />
Central vertex activity diminishes<br />
Stage IV sleep<br />
Marked delta slowing<br />
Absence <strong>of</strong> vertex activity<br />
Stage III and IV = Slow wave sleep
Stage 3-43<br />
4 Sleep<br />
Fp1-F3<br />
F3-C3<br />
C3-P3<br />
P3-O1<br />
Fp2-F4<br />
F4-C4<br />
C4-P4<br />
P4-O2<br />
Fp1-F7<br />
F7-T3<br />
T3-T5<br />
T5-O1<br />
Fp2-F8<br />
F8-T4<br />
T4-T6<br />
T6-O2
REM Sleep<br />
Low voltage mixed frequency activity with faster<br />
components<br />
Absent vertex activity<br />
Decreased EMG activity
Focal Epilepti<strong>for</strong>m Discharges<br />
and Abnormalities<br />
Spikes and sharp waves<br />
Phase reversal localizes the focus<br />
Recorded seizures<br />
Focal slowing may indicate an underlying<br />
epileptogenic focus, structural lesion or injury,<br />
or postictal effect
Localization: Phase Reversal<br />
Each channel records the<br />
potential difference between<br />
two electrodes<br />
G1 – G2<br />
Negative is up<br />
If G1 is more negative than<br />
G2, the deflection will be up<br />
If G2 is more negative, the<br />
deflection will be down<br />
FP1-F7<br />
F7-T3<br />
T3-T5<br />
FP1-F7
Generalized EEG Abnormalities<br />
Generalized spike and wave<br />
Generalized polyspike-wave or multispike-wave<br />
Generalized slow spike and wave<br />
Generalized 3 Hertz spike-wave<br />
Generalized slowing<br />
Generalized suppression<br />
Generalized burst suppression<br />
Electrocerebral silence
Generalized Spike-Wave<br />
Fp1-F3<br />
F3-C3<br />
C3-P3<br />
P3-O1<br />
Fp2-F4<br />
F4-C4<br />
C4-P4<br />
P4-O2<br />
Fp1-F7<br />
F7-T3<br />
T3-T5<br />
T5-O1<br />
Fp2-F8<br />
F8-T4<br />
T4-T6<br />
T6-O2
Generalized Polyspike Wave<br />
Fp1-F3<br />
F3-C3<br />
C3-P3<br />
P3-O1<br />
Fp2-F4<br />
F4-C4<br />
C4-P4<br />
P4-O2<br />
Fp1-F7<br />
F7-T3<br />
T3-T5<br />
T5-O1<br />
Fp2-F8<br />
F8-T4<br />
T4-T6<br />
T6-O2
3 Hertz Spike and Wave<br />
Fp1-F3<br />
F3-C3<br />
C3-P3<br />
P3-O1<br />
Fp2-F4<br />
F4-C4<br />
C4-P4<br />
P4-O2<br />
1 sec<br />
50 µV
Generalized Delta Slowing<br />
Fp1-F3<br />
F3-C3<br />
C3-P3<br />
P3-O1<br />
Fp2-F4<br />
F4-C4<br />
C4-P4<br />
P4-O2<br />
Fp1-F7<br />
F7-T3<br />
T3-T5<br />
T5-O1<br />
Fp2-F8<br />
F8-T4<br />
T4-T6<br />
T6-O2
EEG in the Evaluation <strong>of</strong><br />
Possible Epilepsy<br />
For patients with epilepsy, a single EEG will<br />
reveal epilepti<strong>for</strong>m activity in:<br />
30-40% with an awake EEG only<br />
60-70% with wakefulness and sleep<br />
Some patients will only have an abnormality<br />
detected if an actual seizure is recorded<br />
A normal EEG does not rule out a diagnosis <strong>of</strong><br />
epilepsy
EEG Monitoring in Critical Care<br />
Many patients with head injury, any <strong>for</strong>m <strong>of</strong><br />
encephalopathy, or severe illness are at risk <strong>for</strong> seizures<br />
Patients who are mechanically ventilated are <strong>of</strong>ten<br />
sedated and pharmacologically paralyzed and seizures<br />
can only be diagnosed with EEG<br />
The diagnosis <strong>of</strong> nonconvulsive status epilepticus can<br />
only be detected and monitored with EEG<br />
Monitoring progression <strong>of</strong> coma and potentially<br />
cerebral death
11 y/o boy with severe cardiomyopathy on ECMO following<br />
cardiac electromechanical disassociation<br />
Fp1-F7<br />
F7-T3<br />
T3-T5<br />
T5-O1<br />
Fp2-F8<br />
F8-T4<br />
T4-T6<br />
T6-O2<br />
Fp1-F3<br />
F3-C3<br />
C3-P3<br />
P3-O1<br />
Fp2-F4<br />
F4-C4<br />
C4-P4<br />
P4-O2<br />
1 sec<br />
50 µV
11 y/o boy with severe cardiomyopathy on ECMO with right temporal<br />
electrographic seizure<br />
Fp1-F7<br />
F7-T3<br />
T3-T5<br />
T5-O1<br />
Fp2-F8<br />
F8-T4<br />
T4-T6<br />
T6-O2<br />
Fp1-F3<br />
F3-C3<br />
C3-P3<br />
P3-O1<br />
Fp2-F4<br />
F4-C4<br />
C4-P4<br />
P4-O2<br />
1 sec<br />
50 µV
Focal Status Epilepticus<br />
Fp1-F7<br />
F7-T3<br />
T3-T5<br />
T5-O1<br />
Fp2-F8<br />
F8-T4<br />
T4-T6<br />
T6-O2<br />
Fp1-F3<br />
F3-C3<br />
C3-P3<br />
P3-O1<br />
Fp2-F4<br />
F4-C4<br />
C4-P4<br />
P4-O2<br />
1 sec<br />
50 µV
11 y/o boy with severe cardiomyopathy on ECMO with left<br />
hemispheric suppression due to infarction<br />
Fp1-F7<br />
F7-T3<br />
T3-T5<br />
T5-O1<br />
Fp2-F8<br />
F8-T4<br />
T4-T6<br />
T6-O2<br />
Fp1-F3<br />
F3-C3<br />
C3-P3<br />
P3-O1<br />
Fp2-F4<br />
F4-C4<br />
C4-P4<br />
P4-O2<br />
1 sec<br />
50 µV
EEG Monitoring and<br />
Epilepsy Surgery<br />
20% <strong>of</strong> patients with epilepsy cannot be<br />
controlled with medications<br />
Focal onset seizures can sometimes be selected<br />
and treated with surgical resection <strong>of</strong> the<br />
epileptogenic focus<br />
Multiple methods are can be employed
Clinical Case<br />
8.5 year old boy with onset <strong>of</strong> seizures at age 7<br />
Seizures begin with a tingling sensation in the R hand<br />
followed by extension and posturing <strong>of</strong> the R arm<br />
Seizures were never completely controlled with about 1<br />
seizure per week <strong>for</strong> the first year<br />
December, 2001: Seizures began to dramatically<br />
increase<br />
January-March, 2002: Numerous seizures per day with<br />
up to 100 in a single day, and episodes <strong>of</strong> status<br />
epilepticus lasting up to 1 hour
Typical Seizure
EEG: Recorded Seizure<br />
*Fp1-F3<br />
*F3-C3<br />
*C3-P3<br />
*P3-O1<br />
Fp2-F4<br />
F4-C4<br />
C4-P4<br />
*P4-O2<br />
1 sec<br />
50 µV
*Fp1-F3<br />
*F3-C3<br />
*C3-P3<br />
*P3-O1<br />
Fp2-F4<br />
F4-C4<br />
1 sec<br />
50 µV<br />
C4-P4<br />
*P4-O2
*Fp1-F3<br />
*F3-C3<br />
*C3-P3<br />
*P3-O1<br />
Fp2-F4<br />
F4-C4<br />
1 sec<br />
50 µV<br />
C4-P4<br />
*P4-O2
MRI Findings
3D-MRI Image
3D-MRI with Coronal Cut
Craniotomy with Lesion Localization
Grid Placement
Cortical Grid Map
Craniotomy Closure
Electrocortical Seizure Recording<br />
41-42<br />
42-43<br />
43-44<br />
44-45<br />
45-46<br />
49-50<br />
50-51<br />
51-52<br />
52-53<br />
53-54<br />
1 sec<br />
50 µV<br />
54-55
41-42<br />
42-43<br />
43-44<br />
44-45<br />
45-46<br />
49-50<br />
50-51<br />
51-52<br />
52-53<br />
53-54<br />
1 sec<br />
50 µV<br />
54-55
41-42<br />
42-43<br />
43-44<br />
44-45<br />
45-46<br />
49-50<br />
50-51<br />
51-52<br />
52-53<br />
53-54<br />
1 sec<br />
50 µV<br />
54-55
Functional Cortical Mapping
Cortical Stimulation: Arm
Functional Cortical Map
Cortical Resection
Second Surgery: Stereotactic Lesion Localization
Depth EEG Recording<br />
33-34<br />
34-35<br />
35-36<br />
100 uV<br />
1 sec
Outcome
2 month old with Enterococcal meningitis with an<br />
electrographic seizure discharge, maximal right frontal<br />
FP1-F7<br />
F7-T5<br />
T5-O1<br />
FP1-F3<br />
F3-P3<br />
P3-O1<br />
Fp2-F4<br />
F4-P4<br />
P4-O2<br />
Fp2-F8<br />
F8-T6<br />
T6-O2<br />
1 sec<br />
50 µV


