Suspension bridges with paper clips
Suspension bridges with paper clips
Suspension bridges with paper clips

Create successful ePaper yourself
Turn your PDF publications into a flip-book with our unique Google optimized e-Paper software.
Talk at the 3rd international GIREP Seminar, 5 – 9 Sept. 2005 in Ljubljana, Slovenia<br />
© C. Ucke<br />
cables hang. With real suspension <strong>bridges</strong>, the horizontal<br />
distances of the vertical cables are the same. The – constant<br />
– weight ratio is between about 10 to 1 and 15 to 1. Since<br />
there is no ideal weightless main cable, the shape of a real<br />
main cable is a mixture of a catenary and a parabola. In<br />
reality, this does not pose a problem for the design<br />
engineers, because a small sag makes the difference between<br />
a catenary and a parabola negligible.<br />
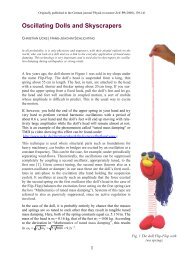
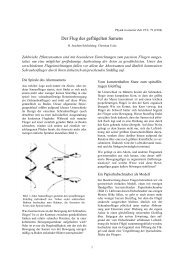
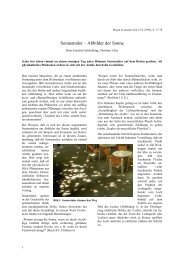
The shape of the curve in figure 3 is that of an ideal parabola<br />
to <strong>with</strong>in a very small margin of error.<br />
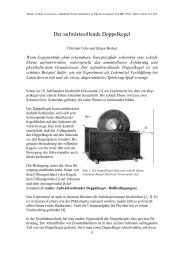
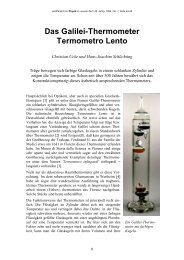
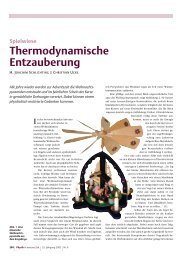
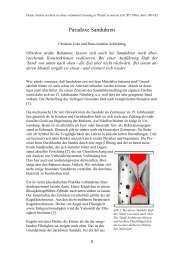
With physics simulation programs like Interactive Physics<br />
[1] or XYZet [2] you can also very nicely illustrate the<br />
situations described above. In figure 4, you can see the<br />
simulation of a catenary curve <strong>with</strong> 16 unweighted links<br />
(grey line) and a 'suspension bridge' equipped <strong>with</strong><br />
corresponding weights (black parabola), both superimposed<br />
on one another. With a real suspension bridge, the vertical<br />
suspender cables are equidistant from one another (this can<br />
also be simulated <strong>with</strong> the program). In figure 4, however,<br />
the points on the main suspension cable where the vertical<br />
suspender cables are fastened are equidistant from one<br />
another.<br />
Fig. 3: Parabola <strong>with</strong> 16 <strong>clips</strong> and<br />
weights. The complete weights <strong>with</strong><br />
the clip chains are not shown here.<br />
In the WEB you can find many links under the term<br />
‘catenary curve’, and also historical remarks and derivations.<br />
Furthermore, there are very descriptive applets that clarify<br />
the difference between the catenary curve and the parabola.<br />
Info-box (suspension bridge parabola)<br />
Overly simplified and idealized, the form of the curve of the<br />
main cable of a suspension bridge can be derived in the<br />
following way:<br />
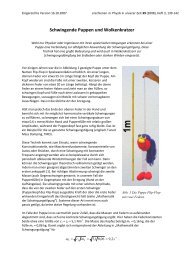
Three forces, whose vectorial sum must yield exactly zero<br />
(figure 5), act in a point P of the main cable of a suspension<br />
bridge. First, the force G of a part of the road <strong>with</strong> the<br />
length x acts vertically downward. Secondly, a<br />
horizontal force S is exerted by the tension of the<br />
cable. This force is constant over the whole cable.<br />
Thirdly, a force F acts in the direction of the tangent to<br />
the cable. This tangential force corresponds exactly to<br />
the slope at point P.<br />
Let’s take µ as the weight per unit of length of the<br />
roadway suspended at the cable. The coordinate origin<br />
0 is located at the vertex of the curve. The weight G<br />
acting at the point P is then exactly G = µ·x. If we<br />
denote the height of the cable at the point x by y, then<br />
the slope at this point is<br />
- 2 -<br />
Fig. 4: Simulation of a catenary<br />
curve (grey) and a parabola<br />
(black) using ‘Interactive Physics’<br />
y<br />
0<br />
suspended roadway<br />
Fig. 5: A parabola emerges as a curve<br />
form for the main cable of a suspension<br />
bridge.<br />
G<br />
x<br />
S<br />
F<br />
S<br />
P<br />
G<br />
F<br />
x