Planning to avoid flood damage - pdf article
Planning to avoid flood damage - pdf article
Planning to avoid flood damage - pdf article

Create successful ePaper yourself
Turn your PDF publications into a flip-book with our unique Google optimized e-Paper software.
Water & Atmosphere 15(3) 2007<br />
Weathering the S<strong>to</strong>rm<br />
<strong>Planning</strong> <strong>to</strong> <strong>avoid</strong> <strong>flood</strong> <strong>damage</strong><br />
Alistair McKerchar and Graeme Smart explain how<br />
new models are refining the process of predicting<br />
damaging <strong>flood</strong>s.<br />
To <strong>avoid</strong> <strong>flood</strong> <strong>damage</strong> we need <strong>to</strong> keep people and<br />
property out of the path of <strong>flood</strong>s. There are well known<br />
strategies <strong>to</strong> do this:<br />
•<br />
•<br />
•<br />
•<br />
12<br />
control <strong>flood</strong> flows using <strong>flood</strong> detention dams<br />
protect vulnerable areas with engineering works<br />
such as s<strong>to</strong>pbanks or <strong>flood</strong>ways<br />
exclude property development from vulnerable<br />
areas and<br />
give warnings of pending <strong>flood</strong>s (see ‘Flood forecasts<br />
for New Zealand communities’, pp. 14–15).<br />
These strategies all require that we know the size of the<br />
<strong>flood</strong> that is <strong>to</strong> be controlled, protected against, <strong>avoid</strong>ed, or<br />
forecast. This means we must estimate <strong>flood</strong> peak flow rates<br />
and how often these <strong>flood</strong>s can be expected.<br />
Predicting flow<br />
Hydrologists define the likelihood of <strong>flood</strong> peak flows by their<br />
annual exceedence probability (AEP). A so-called 100-year<br />
<strong>flood</strong> does not mean that there is exactly one <strong>flood</strong> of this size<br />
every 100 years. It means that there is a 1 in 100 chance in any<br />
given year that a <strong>flood</strong> of this size or bigger will happen; it is<br />
therefore more correctly called a 1% AEP <strong>flood</strong>. In any given<br />
year, there is about a 65% chance that there will be at least<br />
one 1% AEP <strong>flood</strong> in populated catchments of New Zealand.<br />
Where sufficiently long records of <strong>flood</strong> flows are available<br />
for a river or stream, hydrologists can estimate the AEP of<br />
different <strong>flood</strong> sizes by determining how often <strong>flood</strong>s of a given<br />
size occur. When records of previous <strong>flood</strong>s are not available,<br />
we use two alternative methods <strong>to</strong> estimate <strong>flood</strong> sizes. The<br />
regional method looks at <strong>flood</strong> magnitudes for other similar<br />
streams with longer records, and design estimates are scaled<br />
<strong>to</strong> match the site in question. The second method, the rainfallrunoff<br />
model, uses information about rainfall frequency over<br />
a drainage basin (or catchment) <strong>to</strong> estimate a corresponding<br />
peak <strong>flood</strong> flow. The model translates the rainfall information<br />
in<strong>to</strong> <strong>flood</strong> information.<br />
Staying high and dry<br />
• Floods are our most frequent and damaging hazard.<br />
• Past records tell us how often <strong>to</strong> expect damaging<br />
<strong>flood</strong> flows.<br />
• Inundation modelling shows areas that are at risk and<br />
need long-term protection from <strong>flood</strong>s.<br />
In our experience, regional methods that interpolate<br />
<strong>flood</strong> frequency information are generally more reliable than<br />
rainfall-runoff models. With funding from the Foundation for<br />
Research, Science & Technology, NIWA scientists are revising<br />
and updating <strong>flood</strong> estimates for all New Zealand regions.<br />
Calculating the frequency, size, and duration of <strong>flood</strong> flows<br />
in rivers is not sufficient <strong>to</strong> know whether particular areas will<br />
be <strong>flood</strong>ed or not. We still need <strong>to</strong> determine how far waters<br />
may spread when <strong>flood</strong>s spill out of their normal river course;<br />
this is known as inundation.<br />
Predicting inundation<br />
Traditionally, the extent of <strong>flood</strong> inundation has been<br />
estimated by recalling data on his<strong>to</strong>ric <strong>flood</strong> levels, or else<br />
calculated by surveying <strong>flood</strong>plain sections and assuming that<br />
these have horizontal water surfaces. These methods may<br />
lead <strong>to</strong> considerable errors in predicted areas and depths of<br />
inundation. While the prediction of peak flow and timing of<br />
river <strong>flood</strong>s is a relatively mature science, precise calculation<br />
of inundated areas and local <strong>flood</strong> depths is a relatively new<br />
undertaking.<br />
Reliable inundation calculations require massive amounts<br />
of very detailed <strong>to</strong>pographic data and large computing<br />
resources. Airborne surveys using LiDAR (laser radar) can now<br />
provide maps of the ground surface that have a ground level<br />
measurement for every square metre of terrain over areas of<br />
tens of square kilometre. Because such datasets contain<br />
enormous volumes of data (typically, a model uses 5 000 000<br />
ground elevations) and the data are collected with little manual<br />
intervention, identification of any errors in the data is difficult.<br />
In addition, parts of the <strong>to</strong>pography, including the river<br />
bed, can change during the passage of a <strong>flood</strong>, due<br />
<strong>to</strong> scour and deposition, and the resistance <strong>to</strong> flow<br />
caused by vegetation along the river bank or sediment<br />
movement increases or decreases as <strong>flood</strong>waters rise<br />
and fall.<br />
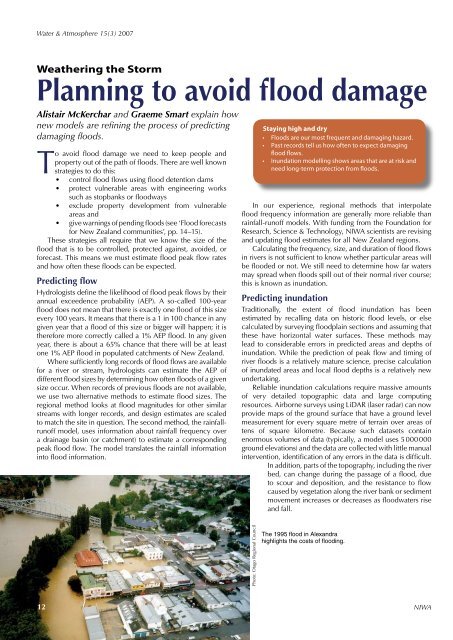
Pho<strong>to</strong>: Otago Regional Council<br />
The 1995 <strong>flood</strong> in Alexandra<br />
highlights the costs of <strong>flood</strong>ing.<br />
12<br />
NIWA
Water & Atmosphere 15(3) 2007<br />
High-resolution modelling<br />
can find the weakness in a<br />
<strong>to</strong>wn’s <strong>flood</strong> defences.<br />
Even with these complications, we have completed several<br />
high-resolution inundation models. Before they can be used<br />
<strong>to</strong> predict future inundation depths, the models must be tested<br />
<strong>to</strong> see whether they can accurately reproduce water levels<br />
measured in his<strong>to</strong>rical <strong>flood</strong>s.<br />
Model results<br />
We can see the accuracy of our models when we compare<br />
predicted inundation with actual <strong>flood</strong>ing. The river images<br />
below show the Mosley Road meander of the Matau Branch<br />
of the Clutha River in Otago. The first image shows computerpredicted<br />
water levels for a river flow of 5100 cumecs (m 3 per<br />
second; the average flow in this part of the river is 600 cumecs).<br />
The second image is an aerial pho<strong>to</strong> of the Clutha River taken in<br />
November 1999 during a <strong>flood</strong> when the flow was 5100 cumecs.<br />
The average difference between computer-predicted and fieldmeasured<br />
water levels was less than 20 cm.<br />
An example of application of a high-resolution inundation<br />
model <strong>to</strong> a New Zealand <strong>to</strong>wn is shown above. Water levels<br />
were calculated every 4 m throughout the <strong>to</strong>wn. Grey<br />
areas show the surface of the ground, houses, and trees as<br />
detected by LiDAR. Rainbow-coloured areas represent the<br />
inundation from a 1% AEP <strong>flood</strong>. The red areas are deepest<br />
and occur in the river channel. Green and blue zones are<br />
progressively shallower. The model indicates that this <strong>to</strong>wn’s<br />
<strong>flood</strong> protection banks would be over<strong>to</strong>pped in the event of<br />
a 1% AEP <strong>flood</strong>.<br />
Putting the models <strong>to</strong> use<br />
In New Zealand, the current Building Act (2004) specifies<br />
that surface water from 2% AEP events (50-year <strong>flood</strong>s) shall<br />
not enter housing. However, there is about a 90% chance<br />
that there will be at least one 2% AEP <strong>flood</strong> in populated<br />
catchments of New Zealand in any given year. Given these<br />
statistics, it’s not surprising that we often hear news of <strong>flood</strong><br />
disasters in our country. Though we can’t s<strong>to</strong>p the rain, new<br />
technologies and our improved models can help refine <strong>flood</strong><br />
predictions. With more accurate information, councils and<br />
other land managers can be prepared for the inevitable. W&A<br />
Pho<strong>to</strong>: Otago Regional Council<br />
Close match between modelled (<strong>to</strong>p image) and actual <strong>flood</strong>ing<br />
in a bend of the Clutha River.<br />
Dr Alistair McKerchar and Dr Graeme Smart<br />
study hydrology and hydraulics; they are based<br />
at NIWA in Christchurch.<br />
www.niwa.co.nz 13