pdf, 2.0mb - Public Schools of North Carolina
pdf, 2.0mb - Public Schools of North Carolina
pdf, 2.0mb - Public Schools of North Carolina

Create successful ePaper yourself
Turn your PDF publications into a flip-book with our unique Google optimized e-Paper software.
STATE ADVISORY COUNCIL ON<br />
INDIAN EDUCATION<br />
2004 REPORT TO THE STATE BOARD OF EDUCATION<br />
OUR VOICE, YOUR VOICE, ONE VOICE<br />
NURTURING AMERICAN INDIAN FAMILIES FOR SCHOOL SUCCESS
SAPPONY YOUTH CAMP Provided by High Plains Indians, Inc., for the Sappony
TABLE OF CONTENTS<br />
Foreword ......................................................................................................................................8<br />
State Advisory Council on Indian Education – Legislation and Purpose.............................10<br />
State Advisory Council on Indian Education – Strategic Priorities.......................................11<br />
<strong>North</strong> <strong>Carolina</strong> Tribes, Locations, and Title VII Grantees.......................................................12<br />
EXECUTIVE SUMMARY..............................................................................................16<br />
SECTION I: Student Performance.............................................................................22<br />
American Indian Families and Communities ......................................................................24<br />
American Indian Student Performance ...............................................................................26<br />
GRAPH 1: Percent <strong>of</strong> Students Grades 3-8 At or Above Grade Level on<br />
Both EOG Reading and Math: American Indian students<br />
compared to all students<br />
GRAPH 2: Percent <strong>of</strong> Students Grades 3-8 At or Above Grade Level on<br />
Both EOG Reading and Math: American Indian students<br />
compared to White students<br />
GRAPH 3: EOG reading and math trends, 1992-93 through 2002-03<br />
GRAPH 4: EOC five core courses trends, 1994-95 through 2002-03<br />
Dropout Rates for American Indian Students .....................................................................30<br />
TABLE 1: American Indian Student Dropout Events in Grades 1-12<br />
GRAPH 5: Percent <strong>of</strong> American Indian Students Who Drop Out Compared<br />
to State Average Dropout Rate<br />
Advanced Course Taking.......................................................................................................32<br />
TABLE 2: NC <strong>Public</strong> <strong>Schools</strong> AP Participation and Performance, 2002-03<br />
College Completion ...............................................................................................................33<br />
TABLE 3: Four-Year Graduation Rates <strong>of</strong> First-time Full-time Freshman<br />
Entering UNC, All Students Compared to American Indian Students<br />
<strong>Public</strong> Education and Tribal Education: Living in Two Worlds ..........................................34<br />
SECTION II: Family Involvement ..............................................................................38<br />
SECTION III: Recommendations ...............................................................................46<br />
SECTION IV: Student Performance Data .................................................................51<br />
Title VII Cohorts......................................................................................................................51<br />
4
Student Achievement Data . . . . . . . . . . . . . . . . . . . . . . . . . . . . . . . . . . . . . . . . . . . . . . . . . . 52<br />
TABLE 4: End-<strong>of</strong>-Grade Reading Test: Percent Students At or Above<br />
Grade Level (Achievement Level III or higher)<br />
TABLE 5: End-<strong>of</strong>-Grade Mathematics Test: Percent Students At or Above<br />
Grade Level (Achievement Level III or higher)<br />
TABLE 6: End-<strong>of</strong>-Course Tests: Percent Students Pr<strong>of</strong>icient or Above<br />
(Achievement Level III or higher)<br />
LEA Level Charts & Graphs for Title VII Grantees . . . . . . . . . . . . . . . . . . . . . . . . . . . . . . . . 53<br />
“Percent <strong>of</strong> Students At/Above Grade Level, EOG Reading”<br />
“Percent <strong>of</strong> Students At/Above Grade Level, EOG Mathematics”<br />
“Percent <strong>of</strong> Students At/Above Grade Level, EOC High School Subjects”<br />
“Trend <strong>of</strong> American Indian Students At/Above Grade level in EOG Reading,<br />
Grades 3-8”<br />
“Trend <strong>of</strong> American Indian Students At/Above Grade level in EOG Mathematics,<br />
Grades 3-8”<br />
Dropout Data . . . . . . . . . . . . . . . . . . . . . . . . . . . . . . . . . . . . . . . . . . . . . . . . . . . . . . . . . . . . . . 88<br />
TABLE 7: Percentages <strong>of</strong> Dropouts within Ethnic/Gender Groups, grades 1-12<br />
TABLE 8: Dropout Events by Ethnicity, Grades 1-12<br />
TABLE 9: <strong>North</strong> <strong>Carolina</strong> <strong>Public</strong> <strong>Schools</strong> Dropout Data for Grades 7-12<br />
(Duplicated Count)<br />
AP Scores. . . . . . . . . . . . . . . . . . . . . . . . . . . . . . . . . . . . . . . . . . . . . . . . . . . . . . . . . . . . . . . . . 92<br />
TABLE 10: Percent <strong>of</strong> AP Test Takers Scoring 3 or Higher by Ethnicity,<br />
NC and the Nation, 2000-2003<br />
TABLE 11: Number and Percentage <strong>of</strong> AP Test Takers by Ethnicity,<br />
NC and the Nation, 2001-2003<br />
SAT Scores . . . . . . . . . . . . . . . . . . . . . . . . . . . . . . . . . . . . . . . . . . . . . . . . . . . . . . . . . . . . . . . 93<br />
GRAPH 6: Mean NC SAT Scores by Ethnicity, 1994-2003<br />
GRAPH 7: Mean NC SAT Scores by Family Income Level, 2003<br />
APPENDICES<br />
Appendix A: Updates on Mascots and American Indian Studies Elective . . . . . . . . . . 96<br />
Appendix B: A Decade <strong>of</strong> Progress in Education . . . . . . . . . . . . . . . . . . . . . . . . . . . . . . 98<br />
Appendix C: Understanding Education Accountability in <strong>North</strong> <strong>Carolina</strong>:<br />
The ABCs <strong>of</strong> <strong>Public</strong> Education. . . . . . . . . . . . . . . . . . . . . . . . . . . . . . . . . . . 99<br />
Appendix D: No Child Left Behind: Our <strong>Schools</strong> and the Federal Education Law. . . 102<br />
Appendix E: List <strong>of</strong> Parent Interviewees . . . . . . . . . . . . . . . . . . . . . . . . . . . . . . . . . . . . 105<br />
Appendix F: List <strong>of</strong> Resources for Parents and Communities . . . . . . . . . . . . . . . . . . . 106<br />
Appendix G: Tribal Organizations in <strong>North</strong> <strong>Carolina</strong>. . . . . . . . . . . . . . . . . . . . . . . . . . . 109<br />
Appendix H: Council Members and Staff. . . . . . . . . . . . . . . . . . . . . . . . . . . . . . . . . . . . 110<br />
Appendix I: References. . . . . . . . . . . . . . . . . . . . . . . . . . . . . . . . . . . . . . . . . . . . . . . . . . 111<br />
5
The State Advisory Council on Indian Education<br />
dedicates its 2004 Annual Report to<br />
WINFORD DEREK LOWRY<br />
(1953-2004)<br />
• Cultural Enrichment Specialist<br />
• Title VII Indian Education Program Director<br />
• American Indian Studies Curriculum Consultant<br />
• Lecturer<br />
• American Indian Traditional Dancer and Singer Flutist<br />
• Spiritual Leader<br />
• Keeper <strong>of</strong> Legends<br />
• Mentor and Friend<br />
“WHY WE DANCE”<br />
“We dance to honor our way <strong>of</strong> life given to us by<br />
the Creator, we dance to honor Mother Earth and<br />
our ancestors.<br />
We dance so that the youth might not forget the<br />
price their ancestors had to pay and for the coming<br />
generations.<br />
To some dancers each step is like a prayer, to others<br />
it’s a way <strong>of</strong> combining the past with the future and<br />
yet to others it is just plain fun.”<br />
-Derek Lowry-<br />
These words by Derek were excerpted from notes for American<br />
Indian Students’ cultural exhibit and performances held in November<br />
1996, at Ben L. Smith High School, in Greensboro, <strong>North</strong> <strong>Carolina</strong>.<br />
“American Indian Students were inspired by<br />
Derek’s wisdom and leadership”<br />
- A Colleague -<br />
6
INDIAN<br />
<br />
<br />
<br />
<br />
<br />
<br />
<br />
<br />
<br />
<br />
<br />
<br />
<br />
<br />
<br />
<br />
<br />
<br />
<br />
<br />
<br />
<br />
<br />
<br />
<br />
<br />
<br />
<br />
<br />
<br />
<br />
<br />
<br />
<br />
<br />
<br />
<br />
<br />
<br />
<br />
<br />
<br />
<br />
<br />
<br />
<br />
<br />
<br />
<br />
<br />
<br />
<br />
<br />
<br />
<br />
<br />
<br />
<br />
<br />
<br />
<br />
<br />
<br />
<br />
<br />
<br />
<br />
EDUCATION<br />
<br />
<br />
<br />
<br />
<br />
STATE ADVISORY COUNCIL ON INDIAN EDUCATION<br />
6301 Mail Service Center<br />
Raleigh, <strong>North</strong> <strong>Carolina</strong> 27699-6301<br />
919.807.3430<br />
FOREWORD<br />
The State Advisory Council on Indian Education has served for sixteen years as an advisory<br />
board to the <strong>North</strong> <strong>Carolina</strong> State Board <strong>of</strong> Education and the Department <strong>of</strong> <strong>Public</strong> Instruction.<br />
Established in 1988 to identify issues that affect the academic achievement <strong>of</strong> American Indian<br />
students, the Council submits a yearly report to the State Board <strong>of</strong> Education that describes<br />
achievement data <strong>of</strong> school children from American Indian tribes in the state’s public schools.<br />
The annual report has been beneficial to state policymakers, public school administrators,<br />
teachers, local tribal communities, and parents <strong>of</strong> school children by informing them <strong>of</strong> historical<br />
facts, current demographics, and educational achievement data that focuses specifically on<br />
<strong>North</strong> <strong>Carolina</strong>’s indigenous people. In addition, the work <strong>of</strong> the State Advisory Council has<br />
become a model for other states that have sizable indigenous populations. For sixteen years,<br />
the efforts undertaken by this Council in conjunction with the State Board <strong>of</strong> Education have<br />
generated many positive outcomes for American Indian school children in this state.<br />
This 2004 annual report, “Our Voice, Your Voice, One Voice: Nurturing American Indian Families<br />
for School Success” continues to investigate the complexities <strong>of</strong> low achievement that evidently<br />
leads to the pernicious dropout problem that <strong>North</strong> <strong>Carolina</strong>’s American Indian students are<br />
experiencing. Although students in grades three through eight are showing gains on the End<strong>of</strong>-Grade<br />
tests and high school students have continued to improve on these tests, the dropout<br />
rate has not improved. American Indian students continue to drop out at a higher rate than<br />
other groups in the state, with American Indian males having the worst rate. Last year the<br />
Council suggested that this dropout problem was multifaceted, perhaps being influenced by<br />
the cultural duality that American Indian students bear. This identity issue may become a<br />
concrete problem by the time a student becomes an adolescent. Even though we have not had<br />
sufficient time to test this hypothesis, it is our hope that including the American Indian studies<br />
elective in the secondary curriculum and focusing more specifically on American Indian history<br />
where appropriate will serve as strategies to build students’ self-esteem and to share more<br />
accurate information about American Indians attending our schools.<br />
This year we investigate another avenue for improving student achievement—the role <strong>of</strong><br />
parents in the child’s educational progress. The importance <strong>of</strong> parental involvement in student<br />
success is well documented for the mainstream population; moreover, in American Indian<br />
households where there are educated parents at higher socio-economic levels, these parents<br />
practice similar strategies for helping their children to achieve to those <strong>of</strong> the mainstream<br />
parents. But, how do we reach the parents <strong>of</strong> our most vulnerable students represented in the<br />
statistics in this report? Our efforts here include interviews with American Indian parents in an<br />
attempt to find out the extent to which they are involved in their children’s education. Our<br />
mission is to find out what works and to implement those best practices throughout our tribal<br />
communities. With the support <strong>of</strong> the State Board <strong>of</strong> Education and state leaders, we can<br />
initiate some <strong>of</strong> these practices. We <strong>of</strong>fer the most current statistical pr<strong>of</strong>ile <strong>of</strong> <strong>North</strong> <strong>Carolina</strong>’s<br />
American Indian students, and we make recommendations that we believe will advance the<br />
academic achievement <strong>of</strong> these children, if implemented.<br />
Louise C. Maynor, Chair, State Advisory Council on Indian Education<br />
8
LEGISLATION AND PURPOSE<br />
Background<br />
In 1988, the State Board <strong>of</strong> Education adopted an Indian education policy to provide a process<br />
for identifying issues pertaining to the education <strong>of</strong> Indian students in grades K-12. In the<br />
same year, the General Assembly passed House Bill 2560, which established a fifteen-member<br />
State Advisory Council on Indian Education to serve as the mechanism for deliberating on and<br />
advocating for American Indian students in <strong>North</strong> <strong>Carolina</strong>.<br />
While the Council has no governance responsibilities, it serves as a mechanism for advising<br />
the SBE on issues pertaining to the education <strong>of</strong> American Indian students in grades K-12.<br />
More specifically, House Bill 2560 charges the Council with the following duties:<br />
• to advise the State Board <strong>of</strong> Education on effective educational practices for<br />
American Indian students;<br />
• to explore programs that raise academic achievement and reduce the dropout rate<br />
among American Indian students;<br />
• to advise the State Board <strong>of</strong> Education and the Department <strong>of</strong> <strong>Public</strong> Instruction on<br />
ways to improve coordination and communication for the benefit <strong>of</strong> American Indian<br />
students affected by state and federal programs administered at the state level;<br />
• to prepare and present an annual report to the SBE, tribal organizations, and to<br />
conferees at the annual <strong>North</strong> <strong>Carolina</strong> Indian Unity Conference; and<br />
• to advise the SBE on any other aspect <strong>of</strong> American Indian education when requested<br />
by the State Board, educators, parents, students, business leaders, and other<br />
constituents.<br />
Council Membership<br />
The composition <strong>of</strong> the Council ensures that multiple perspectives are raised and resolved<br />
in a procedural manner. The Department <strong>of</strong> <strong>Public</strong> Instruction provides assistance to the<br />
Council in carrying out its annual goals.<br />
A chairperson is elected to:<br />
1) coordinate the annual meeting schedule,<br />
2) ensure that annual goals are achieved, and<br />
3) communicate with American Indian communities on critical issues affecting<br />
American Indian students in <strong>North</strong> <strong>Carolina</strong> public schools.<br />
The Council represents the following constituent groups:<br />
• NC Legislature one member appointed by the Senate President and another by the<br />
House Speaker<br />
• UNC Board <strong>of</strong> Governors two members representing institutions <strong>of</strong> higher education<br />
• Local School Districts ten American Indian parents <strong>of</strong> students in grades K-12<br />
• NC Commission <strong>of</strong> Indian Affairs one representative from the Commission<br />
• The State Superintendent’s Representative, NC Department <strong>of</strong> <strong>Public</strong> Instruction<br />
10
11<br />
State Advisory Council on Indian Education<br />
Strategic Pathway for Strengthening Indian Education in <strong>North</strong> <strong>Carolina</strong><br />
Mission Statement: The State Advisory Council on Indian Education will create a system that will involve parents and the community to<br />
provide educational and cultural opportunities with high levels <strong>of</strong> expectations <strong>of</strong> accountability in areas <strong>of</strong> American Indian student achievement.<br />
Strategic Priority:<br />
High Student Performance<br />
Strategic Priority:<br />
Healthy Students in Safe,<br />
Orderly, and Caring <strong>Schools</strong><br />
Strategic Priority:<br />
Quality Teachers,<br />
Administrators, and Staff<br />
Strategic Priority:<br />
Strong Family, Community,<br />
and Business Support<br />
Strategic Priority:<br />
Effective and Efficient<br />
Operations<br />
Strategic Goals Strategic Goals Strategic Goals Strategic Goals Strategic Goals<br />
Goal 1: Every child ready<br />
for school<br />
Goal 2: Rigorous and relevant<br />
academic standards<br />
and assessment systems<br />
for every student<br />
Goal 3: Every student<br />
masters essential<br />
knowledge and skills<br />
Goal 4: Every student<br />
graduates from high school<br />
Goal 5: Every student a<br />
life long learner and ready<br />
for work<br />
Goal 1: Learning<br />
environments inviting and<br />
supportive <strong>of</strong> high student<br />
performance<br />
Goal 2: <strong>Schools</strong> free <strong>of</strong><br />
controlled and illegal<br />
substances and all harmful<br />
behavior<br />
Goal 3: Mutual respect<br />
<strong>of</strong> students, teachers,<br />
administrators, and parents<br />
Goal 4: Adequate, safe<br />
education facilities that<br />
support high student<br />
performance<br />
NC Department <strong>of</strong> <strong>Public</strong> Instruction<br />
6301 Mail Service Center<br />
Raleigh, NC 27699-6301 04-02-04<br />
Goal 1: Pr<strong>of</strong>essional<br />
preparation aligned with<br />
state priorities<br />
Goal 2: A system to<br />
develop, train, and license<br />
a BK pr<strong>of</strong>essional staff for<br />
public schools<br />
Goal 3: A system to recruit,<br />
retain, and compensate a<br />
diverse corps <strong>of</strong> quality<br />
teachers, administrators,<br />
and staff<br />
Goal 4: A system <strong>of</strong><br />
continuous learning and<br />
pr<strong>of</strong>essional development<br />
to support high performance<br />
<strong>of</strong> all employees<br />
Goal 5: High ethical and<br />
pr<strong>of</strong>essional standards for<br />
all employees<br />
Goal 1: State education<br />
priorities responsive to<br />
the needs <strong>of</strong> the family,<br />
community, and<br />
business customers<br />
Goal 2: A comprehensive<br />
and aligned system <strong>of</strong><br />
support for the academic<br />
success and general wellbeing<br />
<strong>of</strong> all children that<br />
promotes:<br />
• Meaningful involvement<br />
in schools,<br />
• Interagency collaboration<br />
for health, nutrition,<br />
and social services, and<br />
• State and local<br />
partnerships<br />
Goal 3: A system to build<br />
the capacity <strong>of</strong> local districts<br />
to create, respond to<br />
and sustain meaningful<br />
partnerships<br />
Goal 1: Components <strong>of</strong> the<br />
education system aligned to<br />
achieve high performance<br />
Goal 2: Decision making<br />
authority and control at the<br />
most appropriate level<br />
closest to the classroom<br />
Goal 3: Information and<br />
accountability systems<br />
capable <strong>of</strong> reporting strategic<br />
and operational results<br />
Goal 4: A funding system<br />
that provides adequate<br />
and aligned financial and<br />
personnel resources to maximize<br />
educational achievement
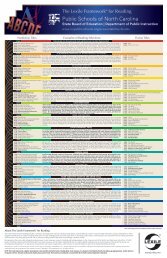
NORTH CAROLINA TRIBES, LOCATIONS, AND TITLE VII GRANTEES<br />
HERTFORD<br />
PERSON<br />
WARREN<br />
Gates<br />
HALIFAX<br />
ORANGE<br />
Bertie<br />
GRAHAM<br />
SWAIN<br />
HARNETT<br />
JACKSON<br />
HOKE<br />
CUMBER-<br />
LAND<br />
SAMPSON<br />
SCOTLAND<br />
ROBESON<br />
BLADEN<br />
COLUMBUS<br />
COUNTIES WITH BOLD OUTLINES & BOLD UPPERCASE NAMES<br />
Locations <strong>of</strong> <strong>North</strong> <strong>Carolina</strong> Tribes<br />
COHARIE – Sampson and Harnett<br />
EASTERN BAND OF THE CHEROKEE – Graham, Swain, and Jackson<br />
HALIWA-SAPONI – Halifax and Warren<br />
LUMBEE – Robeson, Hoke, Scotland, and Cumberland<br />
MEHERRIN – Hertford<br />
OCCANEECHI – Orange<br />
SAPPONY – Person<br />
WACCAMAW-SIOUAN – Columbus and Bladen<br />
Shaded Counties – Title VII Grantees<br />
Columbus<br />
Cumberland<br />
Graham<br />
Guilford<br />
Halifax<br />
Hertford<br />
Hoke<br />
Jackson<br />
Person<br />
Richmond<br />
Robeson<br />
Sampson<br />
Clinton City<br />
Scotland<br />
Swain<br />
Wake<br />
Warren<br />
12
EXECUTIVE SUMMARY
EXECUTIVE SUMMARY<br />
American Indian students’ education may be approaching a critical juncture between<br />
demonstrated progress and the state-level support that can move American Indian children<br />
decisively to parity with children statewide. This year, American Indian 3rd though 8th graders<br />
came within 9 percentage points <strong>of</strong> completely closing the achievement gap between<br />
themselves and the state average on the ABCs End-<strong>of</strong>-Grade reading and math tests. American<br />
Indian high school students continue to improve their pr<strong>of</strong>iciency in five core high school<br />
courses and are the fastest improving ethnic group on ABCs End-<strong>of</strong>-Course test performance.<br />
• In 2002-03, the percentage <strong>of</strong> American Indian students in grades 3-8 performing at<br />
or above grade level (Level III) on reading and mathematics End-<strong>of</strong>-Grade tests<br />
jumped almost 10 percentage points, from 62.7 percent to 72.3 percent, the highest<br />
point yet. Statewide, 80.8 percent <strong>of</strong> students in grades 3-8 performed at or above<br />
grade level on reading and mathematics End-<strong>of</strong>-Grade tests.<br />
• At the high school level, American Indian student performance on End-<strong>of</strong>-Course<br />
tests continued to improve in 2002-03, reaching 58.2 <strong>of</strong> students pr<strong>of</strong>icient<br />
(Level III or higher) in five core courses as compared to the state average <strong>of</strong> 70.1<br />
percent pr<strong>of</strong>iciency.<br />
• American Indian student performance on the five core End-<strong>of</strong>-Course tests has<br />
improved 20 percentage points since 1994-95.<br />
Despite these substantial testing gains, American Indian student dropout rates are still among<br />
the highest in the state and American Indian males have the worst dropout rate <strong>of</strong> any group<br />
according to state reports. State data shows American Indian students drop out at a rate that is<br />
almost twice the state average, and a recently published national report finds that in 2000-01,<br />
just 33.8 percent <strong>of</strong> American Indian students in <strong>North</strong> <strong>Carolina</strong> graduated from high school as<br />
compared with 63.5 percent statewide (Orfield, et.al., 2004). The same report finds that the gap<br />
between White and American Indian graduation rates in <strong>North</strong> <strong>Carolina</strong> was 35.4 percent in<br />
2000-01. The size <strong>of</strong> this gap is <strong>of</strong> enormous concern as the gap itself is larger than the actual<br />
graduation rate <strong>of</strong> American Indian (33.8 percent) young people.<br />
American Indian participation in high school Advanced Placement (AP) courses, a measure <strong>of</strong><br />
advanced levels <strong>of</strong> study, is fairly low and performance on AP exams continues to be among<br />
the weakest <strong>of</strong> any ethnic group in the state with just 39 percent <strong>of</strong> American Indian test takers<br />
in 2002-03 scoring a grade <strong>of</strong> 3, 4 or 5 (the highest score) compared to 56 percent <strong>of</strong> all test<br />
takers. Nationally, 45 percent <strong>of</strong> American Indian test takers scored a grade <strong>of</strong> 3 or higher in<br />
2002-03.<br />
A preliminary look at American Indian completion rates at University <strong>of</strong> <strong>North</strong> <strong>Carolina</strong> (UNC)<br />
institutions shows a noticeably lower graduation rate between American Indian students<br />
(22-24 percent) and the general population (33-35 percent) within the last two years. There<br />
is also a wide range <strong>of</strong> graduation rates (0 percent to 44 percent) across the UNC institutions<br />
(enrollment numbers also varied widely). A total <strong>of</strong> 241 American Indian students (23.7 percent)<br />
who entered a UNC institution in 1999 graduated in 2003.<br />
16
FAMILY INVOLVEMENT IN EDUCATION<br />
Members <strong>of</strong> the State Advisory Council on Indian Education interviewed 21 parents and<br />
grandparents <strong>of</strong> school-aged children about their involvement in their children’s education<br />
(See Appendix E). Because the family members interviewed for this report share some key<br />
characteristics – they are involved in their children’s education already and they describe<br />
having a good relationship with their schools – the Council is not able to draw conclusions<br />
about parent involvement across all American Indian families. However, this report does<br />
some diversity in viewpoints. Our interviewees are a varied group in terms <strong>of</strong> occupation,<br />
socio-economic background and education levels.<br />
Generally, the parents and grandparents interviewed felt their role was to support their child<br />
and their school’s educational objectives. They are united in their strong belief that education<br />
is the primary tool for success in life. While they talked about education as a means to a<br />
better standard <strong>of</strong> living, they also talked about education as providing their children with the<br />
flexibility to understand how to be successful in a changing world. Parents felt that their<br />
child’s exposure to and understanding <strong>of</strong> American Indian culture came from the home and<br />
the tribal environment and not from the school. Overall, the parents who were interviewed<br />
by the Council are very attuned to their role in and responsibility for teaching their children<br />
about their culture and heritage as American Indians. They access community and tribal<br />
resources in educating their children and many talk about this education as an integral part<br />
<strong>of</strong> their family lives. Families were also keenly aware <strong>of</strong> the cultural dualities their children<br />
face in public schools and the additional challenge their children confront in reconciling the<br />
mainstream culture <strong>of</strong> their schools with their own identities as American Indians.<br />
The interviews produced the following additional findings:<br />
• Parents are concerned about both teachers’ and administrators’ levels <strong>of</strong> awareness<br />
regarding their children’s cultural diversity. Many parents address their concerns<br />
directly by talking to their child’s teacher about stereotypes that American Indians<br />
encounter. They also try to provide teachers with additional information or<br />
resources about American Indians in <strong>North</strong> <strong>Carolina</strong> and to promote increased<br />
awareness about stereotypes and common misconceptions about modern<br />
American Indians.<br />
• In addition, parents would like to see more active attention given to <strong>North</strong> <strong>Carolina</strong><br />
Indians in social studies and history curriculums and textbooks. They are concerned<br />
about the damaging effects that un-informed comments like, “You can’t be an<br />
Indian, they’re all dead,” “you don’t wear a feather in your hair,” or “you don’t<br />
have black hair,” can cause for their own children who are struggling to understand<br />
their heritage and identity in a mainstream culture that already sets them apart as<br />
different or “minority.” Non-Indian children must be exposed to accurate information<br />
about <strong>North</strong> <strong>Carolina</strong>’s American Indians – both historically and in a modern<br />
context – in order to eliminate these harmful stereotypes.<br />
• The family members interviewed were very focused on encouraging their children<br />
to be involved in school activities. One grandmother, who had worked with<br />
American Indian children for years, provided an interesting context for this: she felt<br />
that American Indian children <strong>of</strong>ten thought school activities weren’t really meant<br />
“for them.” It may be that schools can promote higher levels <strong>of</strong> involvement and<br />
school engagement among American Indian students if they deliberately recruit<br />
and invite American Indian students to join school-sponsored programs and<br />
activities. This recruitment might be done through tribal centers and organizations,<br />
cultural centers, Indian Education Programs, and local churches.<br />
17
• Families and schools might partner to incorporate American Indian traditions and<br />
culture into their schools. At one school, a parent we interviewed was organizing a<br />
powwow as both a fund raising event and as an opportunity to share his culture<br />
with the school community. Activities like this one – that integrate a regular school<br />
need with an opportunity for cultural enrichment – may be a very effective means<br />
<strong>of</strong> educating children and communities about American Indian heritage.<br />
• Families value their relationships with schools and they want those connections to<br />
be close and comfortable. They want to be actively welcomed by schools and they<br />
want to know, or at least be comfortable in greeting, all the adults working in their<br />
child’s school regardless <strong>of</strong> their child’s age. Parental confidence in and support for<br />
schools and their programs appeared to be stronger when the parent we interviewed<br />
had good communications with his or her school.<br />
• Finally, interviews indicated that families are learning about their children’s academic<br />
performance primarily through written communications like notes, progress<br />
reports, and performance reports. When schools communicate with families in<br />
writing, they are inadvertently excluding a sector <strong>of</strong> their parent/family population.<br />
If schools can find a way to communicate more with families through personal<br />
phone calls, visits, or other non-written means – particularly among those families<br />
who appear to be entirely disengaged from education – they may be far more<br />
effective in increasing family participation in education.<br />
RECOMMENDATIONS<br />
American Indian students are making impressive strides in academic achievement according<br />
to our primary statewide indicator, the ABCs End-<strong>of</strong>-Grade and End-<strong>of</strong>-Course tests. With that<br />
base <strong>of</strong> academic success, American Indian students have the foundation necessary to<br />
improve in other measures <strong>of</strong> performance: advanced course-taking, high school graduation,<br />
and post-secondary enrollment and completion. With resources targeted through the following<br />
recommendations, American Indian students in <strong>North</strong> <strong>Carolina</strong> are poised to reach higher<br />
levels <strong>of</strong> educational success than ever before.<br />
Recommendation 1:<br />
Improve the quality and quantity <strong>of</strong> data available regarding American Indian students and<br />
their educational trajectories. While the state has excellent data to measure the academic performance<br />
and growth <strong>of</strong> public school students in grades 3 – 12, it does not have adequate disaggregated<br />
data to explore questions about the degree to which American Indian students<br />
excel in their studies and are recommended for and enroll in upper level classes. In addition,<br />
further study <strong>of</strong> data extending beyond grade 12 will provide important insight into the<br />
employability and the prospects for long-term economic security <strong>of</strong> American Indian young<br />
people.<br />
• Require that enrollment data in advanced courses be disaggregated for American<br />
Indian students, particularly on the statewide School and District Report Cards.<br />
Begin collecting data on course taking patterns <strong>of</strong> American Indian students –<br />
especially advanced courses as defined by the school report card – if this data is<br />
not currently collected at the state level.<br />
• Request the NC Department <strong>Public</strong> Instruction identify and charge personnel to<br />
study American Indian dropout issues and define lessons that can be learned from<br />
states with much better high school graduation rates for American Indian students<br />
(Alabama, Arkansas, Hawaii, New Mexico, Oklahoma, and Virginia). Selection <strong>of</strong><br />
states based on data from “Losing Our Future: How Minority Youth are Being Left<br />
Behind by the Graduation Rate Crisis,” published by the Harvard Civil Rights Project.<br />
18
• With the findings from this study <strong>of</strong> American Indian high school graduation rates,<br />
appoint selected individuals to develop and apply results and new strategies to a<br />
pilot group <strong>of</strong> high schools serving American Indian students. Consider connecting<br />
the pilot to work currently underway in the New <strong>Schools</strong> Project, a high school<br />
innovation project grant supported by the Gates Foundation.<br />
• Develop a partnership among the University <strong>of</strong> <strong>North</strong> <strong>Carolina</strong> system, the <strong>North</strong><br />
<strong>Carolina</strong> Community College system and the Office <strong>of</strong> the Superintendent <strong>of</strong> the NC<br />
Department <strong>of</strong> <strong>Public</strong> Instruction to conduct a review <strong>of</strong> American Indian enrollment,<br />
retention, and graduation rates, and a review <strong>of</strong> the courses <strong>of</strong> study and degree<br />
programs American Indian students pursue in higher education. Information from<br />
this review will be provided to the State Advisory Council on Indian Education<br />
who will disseminate its findings to Tribal governments, Title VII Indian Education<br />
program directors, LEA superintendents, and academic <strong>of</strong>ficers <strong>of</strong> statewide<br />
institutions <strong>of</strong> higher education.<br />
Recommendation 2:<br />
Foster partnerships between high schools and the local business community with a specific<br />
focus on American Indian students’ preparation for and attainment <strong>of</strong> skilled, year-round<br />
employment. While we work hard to encourage American Indian students to stay in school<br />
and graduate with at least a high school diploma, are we sure that jobs exist for them when<br />
they leave school? And, do American Indian young people find jobs available in their tribal<br />
communities?<br />
• Develop formal partnerships between school guidance departments and Title VII<br />
Indian Education program directors aimed at aligning American Indian student<br />
course taking and academic preparation with the skill requirements for jobs students<br />
are interested in seeking.<br />
• Invite representatives from local chambers <strong>of</strong> commerce, local job services or<br />
employment <strong>of</strong>fices, and local human resources pr<strong>of</strong>essionals to work with Title VII<br />
Indian Education program directors, guidance counselors, and tribal elders to review<br />
current job markets, determine in what sectors American Indians are currently<br />
employed, and to explore ways to broaden employment opportunities, particularly<br />
within tribal territories. In addition, ask groups to work with school administrators<br />
to formulate action plans for strengthening American Indian students’ preparation<br />
for future employment opportunities.<br />
Recommendation 3:<br />
Actively support pr<strong>of</strong>essional development for teachers to enhance their knowledge <strong>of</strong><br />
American Indian history and culture. Given the recent establishment <strong>of</strong> a high school<br />
American Indian studies elective, and growing focus on raising the performance <strong>of</strong> student<br />
demographic<br />
subgroups including American Indians, the time is ripe for high quality, pr<strong>of</strong>essionally organized,<br />
and systematic development <strong>of</strong> educators’ knowledge and understanding <strong>of</strong> American<br />
Indian history and culture. While many individual efforts to deliver American Indian-related<br />
pr<strong>of</strong>essional development exist across the state, there is no central organization or means <strong>of</strong><br />
communicating the opportunities available to educators (see Appendix A).<br />
• Request the NC Department <strong>of</strong> <strong>Public</strong> Instruction conduct an inventory <strong>of</strong> all<br />
educational resources and pr<strong>of</strong>essional development related to American Indian<br />
studies currently available to educators in <strong>North</strong> <strong>Carolina</strong>. Partner with the State<br />
Advisory Council on Indian Education to disseminate information about how and<br />
where to access these pr<strong>of</strong>essional development resources to K-12 teachers and<br />
19
teacher training programs statewide.<br />
• Request that <strong>Schools</strong> <strong>of</strong> Education insert an American Indian history and culture<br />
requirement for pre-service teachers.<br />
• Actively seek business and foundation partners who are willing to provide annual<br />
sponsorship grants to 150 social studies educators and others who are interested<br />
in becoming more expert on <strong>North</strong> <strong>Carolina</strong> American Indian history, culture, and<br />
current affairs.<br />
• Continue efforts that require all public school administrators and local boards <strong>of</strong><br />
education to review their policies and procedures toward the use <strong>of</strong> American<br />
Indian sports mascots, logos, and all demeaning imagery; and educate public<br />
school personnel about the educational, curricular, and psychological effects <strong>of</strong><br />
using American Indian sports mascots and logos.<br />
Recommendation 4:<br />
Actively support programs that nurture American Indian families for school success.<br />
• Develop a partnership between the Department <strong>of</strong> <strong>Public</strong> Instruction Communications<br />
Division and other state agencies and organizations to compile parent involvement<br />
resources particularly geared towards American Indian families. Publish and disseminate<br />
these materials for use by tribal organizations, American Indian churches, and<br />
schools serving relatively large populations <strong>of</strong> American Indian students.<br />
• Request that LEAs publish and distribute grade appropriate information to families<br />
on how to support children’s education in the home. These publications might<br />
include grade-level specific tips for helping with homework, grade specific<br />
guidelines on how much or how little to assist children with schoolwork, and how<br />
to help a child learn to read.<br />
• Support tribal and LEA efforts to improve American Indian family involvement in<br />
their children’s education. <strong>Public</strong>ly recognize tribes and LEAs that create effective<br />
programmatic responses to improving family-school relations.<br />
• Establish a formal partnership between the Department <strong>of</strong> <strong>Public</strong> Instruction’s<br />
parent involvement coordinator and the state’s Title VII Indian Education program<br />
directors. Create an American Indian family involvement advisory group at the state<br />
level, meeting the state parent involvement coordinator on a quarterly basis, and<br />
charged with improving American Indian family-school connections.<br />
20
SECTION I<br />
STUDENT PERFORMANCE<br />
John Jacobs, Lumbee<br />
Southeast High School, Guilford County
AMERICAN INDIAN FAMILIES<br />
AND COMMUNITIES<br />
American Indians in <strong>North</strong> <strong>Carolina</strong> are as diverse as any other ethnic group. Families live in<br />
rural and urban communities; they can be two-parent, one-parent, or multi-generational, and<br />
they work in occupations ranging from doctors and college pr<strong>of</strong>essors to farmers, waitresses,<br />
and business pr<strong>of</strong>essionals. <strong>North</strong> <strong>Carolina</strong>’s recognized tribes<br />
range in size from 50 people to well over 40,000 and each tribe<br />
has its own stories, histories, and celebrations.<br />
“At one time, Native people had<br />
only three career choices to be: There are approximately 100,000 American Indians living in<br />
a farmer, a school teacher, or a <strong>North</strong> <strong>Carolina</strong> today. Of those, 40,000 are children under the age<br />
preacher, because that was all <strong>of</strong> 18 (Snipp, 2002). Based on rough calculations <strong>of</strong> the 2000 Census<br />
data, American Indian children are less likely to live in two parent<br />
the future held for them. Today<br />
homes than other children statewide. Just over 20 percent<br />
we are lawyers, district supreme<br />
<strong>of</strong> American Indians statewide have incomes below the poverty<br />
court judges, state senators, level compared with just over 10 percent <strong>of</strong> all <strong>North</strong> Carolinians.<br />
doctors, engineers, and yes,<br />
soldiers (no group <strong>of</strong> minorities<br />
has a higher percentage serving<br />
in the military than Native<br />
Americans). Yet our culture is<br />
still being handed down by our<br />
Elders, and we take pride in their<br />
teachings and direction.”<br />
DEREK LOWRY,<br />
Tuscarora Nation <strong>of</strong> <strong>North</strong><br />
<strong>Carolina</strong><br />
American Indian communities have faced many <strong>of</strong> the same<br />
changes that communities across <strong>North</strong> <strong>Carolina</strong> are facing. With<br />
the decline <strong>of</strong> farming and the demise <strong>of</strong> manufacturing, many<br />
American Indians have had to leave their local areas to gain new<br />
job skills and additional education. While some American Indians<br />
are fortunate enough to find work within commuting “distance <strong>of</strong><br />
their ancestral homes, increasing numbers are forced to live and<br />
work outside their tribal communities. Many families who remain<br />
at home suffer hardships in order to stay in their communities.<br />
Migration continues to be a significant issue for Native<br />
communities, heightening anxieties, economic instability, and<br />
feelings <strong>of</strong> dislocation.<br />
Adjusting to urban life is difficult for American Indians who <strong>of</strong>ten feel alone, alienated and<br />
unhappy in strange cities, so different from their rural “home” community. Interestingly,<br />
the Native American population in urban <strong>North</strong> <strong>Carolina</strong> is quite diverse. American Indians<br />
living in urban centers represent at least 25 different tribes who have migrated from inside<br />
and outside <strong>of</strong> <strong>North</strong> <strong>Carolina</strong>, including: Catawba, Eastern Band <strong>of</strong> Cherokee, Western<br />
Cherokee, Chippewa, Coharie, Creek, Haliwa-Saponi, Lakota, Lumbee, Meherrin, Mohawk,<br />
Navajo, Occaneechi, Sappony, Seminole, Sheraw, Sioux, Tuscarora, Waccamaw-Siouan, and<br />
Alaska Natives. Urban Indian Centers and Tribal Associations across <strong>North</strong> <strong>Carolina</strong> serve as<br />
a “home away from home” for the American Indians who have left the reservations and rural<br />
Indian communities for the cities.<br />
Traditionally, in most <strong>of</strong> <strong>North</strong> <strong>Carolina</strong>, the church is the center <strong>of</strong> community life and tribal<br />
leadership. A key component for connecting American Indian tribal traditions to the “urban<br />
world” is the role <strong>of</strong> spirituality. Affiliation with the church has played an integral part in<br />
maintaining American Indian values and preferences.<br />
Most <strong>of</strong> <strong>North</strong> <strong>Carolina</strong>’s tribes have a central government and retain limited sovereignty.<br />
Presently, tribal governments and urban Native American organizations serve as the center<br />
for the practice <strong>of</strong> ceremonial traditions, for administering cultural programs, and as an<br />
advocate for housing and economic development. At the state level, The NC Commission <strong>of</strong><br />
Indian Affairs is the principle advocate for most <strong>of</strong> the state’s American Indian population. The<br />
federally-recognized Eastern Band <strong>of</strong> the Cherokee reside on the Qualla Boundary in western<br />
<strong>North</strong> <strong>Carolina</strong>, maintain limited sovereignty, and operate schools and other institutions under<br />
the sponsorship <strong>of</strong> the Bureau <strong>of</strong> Indian Affairs.<br />
24
“True our appearance may not be<br />
much different than yours, but<br />
being Native American was never<br />
just a race <strong>of</strong> people...We have the<br />
same moral values as our ancestors,<br />
and we will teach them to our<br />
young. These values include our<br />
love for our Creator, our families,<br />
and the respect we have for the<br />
land. The caring attitude we have<br />
for our fellow man, and a desire<br />
to be who we are, the Native<br />
people <strong>of</strong> this land.”<br />
Despite the movement out <strong>of</strong> traditional communities for<br />
employment or educational opportunities, many American<br />
Indians maintain strong ties to their tribal community.<br />
American Indians describe their families as very close knit<br />
with intricate networks that extend beyond the nuclear<br />
family. Households are <strong>of</strong>ten multi-generational and tend<br />
toward a matriarchal hierarchy. Because <strong>of</strong> the central role<br />
that family and tribe play in American Indian life, and<br />
because <strong>of</strong> the importance <strong>of</strong> family and community<br />
involvement in student achievement, this year’s report <strong>of</strong><br />
the State Advisory Council on Indian Education will give<br />
specific attention to the role <strong>of</strong> American Indian families<br />
and communities in their children’s education.<br />
DEREK LOWRY,<br />
Tuscarora Nation <strong>of</strong> <strong>North</strong> <strong>Carolina</strong><br />
25
AMERICAN INDIAN STUDENT<br />
PERFORMANCE<br />
Both American Indian students and NC students statewide are performing at or above grade<br />
level in greater numbers than ever before.<br />
Even as the average percentage <strong>of</strong> students at or above grade level has increased across the<br />
state, the difference between American Indian student performance and the average student<br />
performance statewide is disappearing. Specifically, the difference - or gap - between the<br />
percentage <strong>of</strong> American Indian students performing at or above grade level on state End-<strong>of</strong>-<br />
Grade/End-<strong>of</strong>-Course tests and the percentage <strong>of</strong> students statewide performing at or above<br />
grade level on state tests is getting smaller and smaller.<br />
• American Indian students in grades 3 – 8 have reduced gaps in academic<br />
achievement to half <strong>of</strong> the size they were ten years ago, as seen below.<br />
GRAPH 1<br />
Percent <strong>of</strong> Students Grades 3-8 At or Above Grade<br />
Level on Both EOG Reading and Math<br />
Percentage<br />
100<br />
80<br />
60<br />
40<br />
20<br />
0<br />
22 pt.<br />
} Gap<br />
14 pt.<br />
} Gap<br />
} 9 pt. Gap<br />
1993-94 1998-99 2002-03<br />
Year<br />
All NC Students<br />
Am.Indian<br />
• The gap closing trends in grades 3 – 8 are equally dramatic between American<br />
Indian students and majority ethnic groups like White students.<br />
GRAPH 2<br />
Percent Students Grades 3-8 At or Above Grade Level<br />
on Both EOG Reading and Math<br />
100<br />
80<br />
60<br />
40<br />
20<br />
0<br />
33 pt.<br />
} Gap<br />
24 pt.<br />
} Gap<br />
17 pt.<br />
} Gap<br />
1993-94 1998-99 2002-03<br />
Year<br />
White<br />
Am.Indian<br />
26
• American Indian student performance on End-<strong>of</strong>-Grade tests improved substantially<br />
in the last school year (2002-03). See Graph 3.<br />
• In 2002-03, the percentage <strong>of</strong> American Indian students in grades 3-8 performing at<br />
or above grade level (Level III) on reading and mathematics End-<strong>of</strong>-Grade tests<br />
jumped almost 10 percentage points, from 62.7 percent to 72.3 percent, the highest<br />
rate yet.<br />
• Between 2001-02 and 2002-03, American Indian students in grades 3-8 improved on<br />
End-<strong>of</strong>-Grade tests at a rate similar to Black and Hispanic students.<br />
• At the high school level, American Indian student performance on End-<strong>of</strong>-Course<br />
tests continued to improve in 2002-03, reaching 58.2 <strong>of</strong> students pr<strong>of</strong>icient (Level III<br />
or higher) in five core courses as compared to the state average <strong>of</strong> 70.1 percent<br />
pr<strong>of</strong>iciency. See Graph 4.<br />
• Notably, American Indian high school student achievement has increased faster<br />
than that <strong>of</strong> any other ethnic group in <strong>North</strong> <strong>Carolina</strong>.<br />
• American Indian student performance on the five core End-<strong>of</strong>-Course tests has<br />
improved 20 percentage points since 1994-95.<br />
27
GRAPH 3: EOG Reading and Math Trends, 1992-93 through 2002-03<br />
100<br />
1992-93 to 2002-03 End-<strong>of</strong>-Grade Multiple Choice Test Results; Grade 3-8, by Ethnicity<br />
Percent <strong>of</strong> Students At or Above Level III in Both Reading and Mathematics<br />
90<br />
88.8<br />
87.4<br />
N= 365,556<br />
N= 11,547<br />
80<br />
83.9<br />
80.8<br />
N= 11,778<br />
N= 615,635<br />
PERCENT OF STUDENTS<br />
70<br />
60<br />
50<br />
Asian<br />
White<br />
STATE<br />
Hispanic<br />
Multi-Racial<br />
72.3<br />
70.2<br />
66.9<br />
N= 8,833<br />
N= 32,296<br />
N= 185,624<br />
40<br />
30<br />
0<br />
American<br />
Indian<br />
Black<br />
1992-93 1993-94<br />
1994-95 1995-96 1996-97 1997-98 1998-99 1999-00 2000-01 2001-02 2002-03<br />
28
29<br />
GRAPH 4: EOC Five Core Courses Trends, 1994-95 through 2002-03<br />
100<br />
1994-95 to 2002-03 End-<strong>of</strong>-Course Multiple Choice Test Results;<br />
Percent <strong>of</strong> Students At or Above Level III Across the Five Core Courses by Ethnicity<br />
(Algebra I; Biology; Economic, Legal, and Political Systems; English I; and U.S. History)<br />
90<br />
PERCENT OF STUDENTS<br />
80<br />
70<br />
60<br />
50<br />
40<br />
30<br />
Asian<br />
68.1<br />
66.4<br />
White<br />
STATE<br />
56.2<br />
Hispanic<br />
50.7<br />
Multi-racial 61.0<br />
American Indian<br />
38.2<br />
Black<br />
33.5<br />
65.5<br />
65.2<br />
54.9<br />
45.4<br />
33.6<br />
32.0<br />
67.1<br />
65.6<br />
62.3<br />
56.9<br />
47.0<br />
34.4<br />
33.7<br />
69.8<br />
66.2<br />
61.9<br />
59.8<br />
50.5<br />
41.5<br />
37.7<br />
71.4<br />
66.4<br />
66.1<br />
61.6<br />
51.6<br />
45.0<br />
39.9<br />
72.2<br />
66.6<br />
66.3<br />
62.5<br />
51.1<br />
42.4<br />
40.9<br />
75.7<br />
69.5<br />
68.9<br />
65.9<br />
54.6<br />
51.8<br />
44.7<br />
77.9<br />
73.3<br />
72.9<br />
68.2<br />
57.0<br />
54.6<br />
48.2<br />
79.4<br />
75.7<br />
74.5<br />
70.1<br />
59.0<br />
58.2<br />
51.5<br />
N= 289,233<br />
N= 9,859<br />
N= 5,615<br />
N= 463,181<br />
N= 18,105<br />
N= 5,645<br />
N= 134,717<br />
0<br />
1994-95 1995-96 1996-97 1997-98 1998-99 1999-00 2000-01 2001-02 2002-03
DROPOUT RATES FOR<br />
AMERICAN INDIAN STUDENTS<br />
While dropout rates for American Indian males and females appear to be decreasing overall,<br />
they did increase slightly in the past year, at a time when state dropout rates have continued<br />
to decline. Despite this overall improvement in dropout rates, American Indian students<br />
continue to drop out <strong>of</strong> school in disproportionate numbers. While 1.45 percent <strong>of</strong> students<br />
enrolled in grades 1-12 are American Indian, 2.48 percent <strong>of</strong> all dropouts recorded in 2002-03<br />
were American Indian students.<br />
Within the American Indian population in grades 1-12, students dropped out at a rate <strong>of</strong> 2.85<br />
percent in 2002-03 while the state average was 1.66 percent. American Indian males dropped<br />
out at a rate <strong>of</strong> 3.21 percent in 2002-03, higher than the average male student statewide (1.92<br />
percent). American Indian females didn’t fare any better: they were almost twice as likely to<br />
drop out (2.45 percent) as their female peers statewide (1.39 percent). At this rate, approximately<br />
one out <strong>of</strong> every 30 American Indian young men and one out <strong>of</strong> every 40 American Indian<br />
young women in <strong>North</strong> <strong>Carolina</strong> drop out <strong>of</strong> school each year. The cumulative effect <strong>of</strong> this<br />
annual dropout rate contributes to the fact that approximately 7 out <strong>of</strong> 10 males and 6 out <strong>of</strong><br />
10 females fail to graduate from high school (see below).<br />
TABLE 1<br />
AMERICAN INDIAN STUDENT DROPOUT EVENTS<br />
IN GRADES 1-12 2002-03 2001-02 2000-01 1999-00<br />
What is the total percentage <strong>of</strong> American Indian<br />
students dropping out? 2.85% 2.73% 3.55% 3.80%<br />
What percent <strong>of</strong> American Indian males are dropping out? 3.21% 3.11% 3.89% 3.98%<br />
What percent <strong>of</strong> American Indian females are dropping out? 2.45% 2.33% 3.20% 3.61%<br />
State average dropout rate among all students grades 1-12 1.66% 1.81% 1.97% 2.18%<br />
GRAPH 5<br />
Percent <strong>of</strong> American Indian Students Who Drop<br />
Out Compared to State Average Dropout Rate<br />
4.50%<br />
4.00%<br />
3.50%<br />
3.00%<br />
2.50%<br />
2.00%<br />
1.50%<br />
1.00%<br />
0.50%<br />
0.00%<br />
1999-00 2000-01 2001-02 2002-03<br />
Year<br />
% AI Males<br />
% AI Females<br />
Overall % AI drop out<br />
State Average<br />
Dropout Rate<br />
30
In 2002-03, American Indian males and females continue to be more likely to drop out than<br />
members <strong>of</strong> any other ethnic group (Hispanic males 2.21%, Black males 2.14%, Hispanic<br />
females 1.87%, and White males 1.74%). See Section IV, Tables 7- 9 for additional information.<br />
A recent report, “Losing Our Future: How Minority Youth are Being Left Behind by the<br />
Graduation Rate Crisis,” written by a team <strong>of</strong> national experts on high school dropout and published<br />
by the Harvard Civil Rights Project, provides another look at American Indian high school<br />
dropout rates both in <strong>North</strong> <strong>Carolina</strong> and nationwide. The authors <strong>of</strong> this report calculate<br />
dropouts differently than does <strong>North</strong> <strong>Carolina</strong>: briefly, <strong>North</strong> <strong>Carolina</strong> counts the number <strong>of</strong><br />
times students are reported as having left school, and the Civil Rights Project reports the percentage<br />
<strong>of</strong> students who enrolled in 9th grade and graduated with a regular diploma in 12th<br />
grade. As a result <strong>of</strong> these different procedures for defining and collecting data, the following<br />
dropout data differs considerably from the state-level data we traditionally report.<br />
The Civil Rights Project found the following:<br />
• Nationally, 51.1 percent – only half – <strong>of</strong> Native American students who enter<br />
9th grade graduate with a regular diploma in 12th grade. Native American males<br />
fare even worse: nationally, only 47 percent <strong>of</strong> them graduate.<br />
• There is a 23.8 percentage point gap between the national graduation rates for<br />
Whites and American Indians.<br />
• In <strong>North</strong> <strong>Carolina</strong>, the graduation rate differences are stark and alarming.<br />
> The statewide graduation rate in 2000-01 was 63.5 percent, but for American<br />
Indian students it was just 33.8 percent.<br />
> The gap between White and American Indian graduation rates was 35.4<br />
percent. The size <strong>of</strong> this gap is <strong>of</strong> enormous concern as the gap itself is<br />
larger than the actual graduation rate <strong>of</strong> American Indians (33.8 percent).<br />
• American Indian males in <strong>North</strong> <strong>Carolina</strong> graduated at a rate <strong>of</strong> just 29.1 percent.<br />
Less than one out <strong>of</strong> every three American Indian young men will graduate from<br />
high school according to these data.<br />
• In <strong>North</strong> <strong>Carolina</strong>, the American Indian female graduation rate was 39.2 percent,<br />
meaning that three out <strong>of</strong> five young American Indian women will not earn high<br />
school diplomas.<br />
• For comparison, the state’s Black male graduation rate is 44.9 percent, the Black<br />
female rate is 62.2 percent, the White male rate is 65.7 percent, and the White<br />
female graduation rate is 69.5 percent (Orfield, et.al., 2004).<br />
Research conducted for last year’s Indian Education Report tells us that American Indian<br />
students who drop out <strong>of</strong> school are not necessarily weak students or students who dislike<br />
schools and learning (State Advisory Council on Indian Education, 2003). In fact, every year<br />
there are many students who are bright and talented – students who excelled in elementary<br />
school – who lose their way when they reach middle or high school and leave school after<br />
consecutive years <strong>of</strong> feeling disconnected to, ignored by, and unimportant to the adults and<br />
the majority student population around them.<br />
The Council feels it is <strong>of</strong> utmost importance and urgency that the state study American Indian<br />
dropout patterns – particularly those <strong>of</strong> young men – in order to formulate comprehensive,<br />
research-based prevention and intervention strategies that can be made available to <strong>North</strong><br />
<strong>Carolina</strong>’s schools and school districts as quickly as possible.<br />
31
ADVANCED COURSE TAKING<br />
One way to measure student academic performance and success is to look at the rate at which<br />
students take upper-level or challenging coursework. The <strong>North</strong> <strong>Carolina</strong> School Report Cards<br />
(www.ncreportcards.org) provide information about the percentage <strong>of</strong> students enrolled in<br />
advanced courses (Advanced Placement, International Baccalaureate, community college courses,<br />
or college/university course for high school students), but unfortunately, data disaggregated<br />
for American Indian student enrollment is not yet available. Through the College Board, the<br />
educational services and testing company that administers the Advanced Placement Program,<br />
<strong>North</strong> <strong>Carolina</strong> has access to data about the performance <strong>of</strong> American Indian students on<br />
Advanced Placement (AP) exams. The AP exam measures mastery <strong>of</strong> course skills and content,<br />
and students’ scores may make them eligible for course credit in college/university. AP exams<br />
are fee-based and are not generally required <strong>of</strong> students enrolled in AP courses.<br />
Overall in <strong>North</strong> <strong>Carolina</strong>, fewer students enrolled in AP courses in 2002-03, but the number <strong>of</strong><br />
students opting to take the AP exam increased. While the College Board does not disaggregate<br />
AP enrollment data for American Indian students, they do report a similar change in AP testtaking:<br />
more American Indian students in <strong>North</strong> <strong>Carolina</strong> took AP exams this year than last.<br />
While American Indian student AP test-taking increased in 2003, the percentage <strong>of</strong> students<br />
scoring a grade <strong>of</strong> 3 or higher (AP grade scale <strong>of</strong> 1-5) dropped by 7 percentage points to just<br />
over 39 percent (Section IV, Table 10). In 2003 at the national level, 45 percent <strong>of</strong> American<br />
Indian students scored a 3 or higher on the AP exams they took; and, with the exception <strong>of</strong><br />
2002, in the last 5 years, American Indian students nationally have slightly out-performed<br />
those in <strong>North</strong> <strong>Carolina</strong> on AP exams.<br />
Noticeably, in both <strong>North</strong> <strong>Carolina</strong> and the nation, American Indians and Blacks are the only<br />
ethnic groups where students consistently perform below the national average. In <strong>North</strong><br />
<strong>Carolina</strong>, less than 50 percent <strong>of</strong> American Indian and Black students scored 3 or higher on<br />
AP exams taken over the last five years, while 56-60% <strong>of</strong> white students scored 3 or higher<br />
over the same period.<br />
TABLE 2<br />
NORTH CAROLINA PUBLIC SCHOOLS<br />
AP PARTICIPATION AND PERFORMANCE 2002-03<br />
NC Total American Indian White<br />
# Test Takers 27,632 174 21,497<br />
# Exams Taken 49,130 266 38,083<br />
AP Score 1 18.3% 25.6% 14.8%<br />
AP Score 2 25.7% 35.3% 25.0%<br />
AP Score 3 26.6% 21.1% 28.6%<br />
AP Score 4 18.8% 10.2% 20.2%<br />
AP Score 5 10.6% 7.9% 11.3%<br />
* Disaggregated percentages are rounded may not add to precisely 100%.<br />
Data provided by the College Board, February 2004.<br />
Since student performance is associated with exposure to upper level academic content,<br />
enrichment opportunities, and teacher quality, the State Advisory Council on Indian Education<br />
is especially interested in conducting future research into the levels at which American Indian<br />
students are recommended for and enrolled in upper-level coursework, and the comparative<br />
rate at which schools with significant American Indian student populations are staffed by<br />
highly qualified teachers.<br />
32
COLLEGE COMPLETION<br />
At this time, the Council has collected limited data on the trajectory <strong>of</strong> high-achieving, collegebound<br />
American Indian students. Because college completion rates are an important indicator<br />
<strong>of</strong> life-long achievement and economic security, future reports <strong>of</strong> the State Advisory Council<br />
will explore American Indian enrollment in post-secondary education programs (community<br />
colleges and colleges/universities) and student graduation rates and completion rates. In a<br />
preliminary look at American Indian success rates in our state’s public university system, we<br />
find that system-wide, over the last two years, just over 20 percent <strong>of</strong> American Indian students<br />
who enrolled as freshmen graduated from college four years later. This rate is noticeably lower<br />
than the average rate for all students, which was just over 30 percent in the same period. As<br />
the numbers <strong>of</strong> American Indian students enrolled in some UNC institutions is quite small, we<br />
not only see a large range in American Indian graduation rates (from 0 percent to 44 percent)<br />
among institutions, but it is quite difficult to make any meaningful comparisons between<br />
these schools. Based on rough estimates, approximately 15-20% <strong>of</strong> American Indian seniors<br />
enroll in a UNC institution. In future reports, the Council intends to examine the following<br />
additional questions:<br />
• What percentage <strong>of</strong> American Indian high school seniors enroll in the state’s<br />
public university system? What fields <strong>of</strong> study do they pursue?<br />
• What percentage <strong>of</strong> American Indian high school seniors enroll in the state’s<br />
community college system and <strong>of</strong> those, what percentage complete a two-year<br />
degree?<br />
What fields <strong>of</strong> study do they pursue?<br />
• What percentage <strong>of</strong> American Indian 9th grade students express a strong interest in<br />
pursuing education beyond high school?<br />
• What percentage <strong>of</strong> American Indian 9th grade students ultimately enroll in some<br />
form <strong>of</strong> higher education?<br />
• How does American Indian post-secondary educational attainment compare to that<br />
<strong>of</strong> other ethnic groups across <strong>North</strong> <strong>Carolina</strong>?<br />
TABLE 3<br />
Four-Year Graduation Rates <strong>of</strong> First-time Full-time Freshman Entering UNC,<br />
All Students Compared to American Indian Students<br />
UNC Institution 1999-2003 1999-2003 # American 1998-2002 1998-2002 # American<br />
All American Indians All American Indians<br />
Indian Enrolled ‘99 Indian Enrolled ‘98<br />
Appalachian State Univ. 35.3% 33.3% 6 29.7% 28.6% 7<br />
East <strong>Carolina</strong> University 25.3% 19.0% 21 25.7% 25.0% 24<br />
NC A&T State University 22.7% 0% 6 23.6% 20.0% 5<br />
<strong>North</strong> <strong>Carolina</strong> State Univ. 35.5% 34.8% 23 29.7% 15.6% 32<br />
UNC-Chapel Hill 70.5% 44.4% 27 66.7% 50.0% 26<br />
UNC-Charlotte 23.5% 8.3% 12 21.4% 12.5% 8<br />
UNC-Greensboro 28.2% 8.3% 12 26.2% 16.7% 6<br />
UNC-Pembroke 18.7% 24.0% 104 21.3% 17.7% 113<br />
UNC-Wilmington 40.7% 16.7% 6 37.3% 23.1% 13<br />
Western <strong>Carolina</strong> Univ. 22.6% 0% 13 22.7% 27.3% 11<br />
Total 34.8% 23.7% 241 32.7% 22.3% 256<br />
33<br />
* <strong>Schools</strong> that enrolled four American Indian students or less are not listed here but are included in total percentages.<br />
Data provided by UNC-General Administration, February 2004.
PUBLIC EDUCATION AND TRIBAL<br />
EDUCATION: LIVING IN TWO WORLDS<br />
“I was brought up in an Indian<br />
household with my grandparents<br />
and parents and that’s just the<br />
way you behaved. I mean, you<br />
were seen and not heard. It wasn’t<br />
polite to show <strong>of</strong>f. In school I felt<br />
really isolated and really alienated<br />
and really alone. I just didn’t<br />
volunteer a lot <strong>of</strong> information. The<br />
Indian way <strong>of</strong> behaving is: you<br />
watch and you observe before you<br />
act. You don’t want to make a fool<br />
out <strong>of</strong> yourself in front <strong>of</strong> the group<br />
because <strong>of</strong> the shame culture. You<br />
observe, and so once you know<br />
what’s expected <strong>of</strong> you, then you<br />
act, but you never want to show<br />
<strong>of</strong>f because it’s not good taste to<br />
pound your own drum. I didn’t<br />
realize why I behaved the way I<br />
did until I got into college and took<br />
a course that talked about value<br />
differences, and then it was like<br />
a light bulb going on. I started<br />
making the connections.”<br />
Jeb Beaulieu, American Indian<br />
student in a Midwest mainstream<br />
school setting, quoted in Cleary<br />
and Peacock, 1998<br />
American Indian students face an additional educational challenge<br />
that most <strong>North</strong> <strong>Carolina</strong> students do not have nor will<br />
ever have to think about: they need to master academic content<br />
standards like every other student across the state, while<br />
at the same time they must embrace their unique culture and<br />
history and then reconcile it with mainstream America and<br />
public school curriculum (NC Standard Course <strong>of</strong> Study).<br />
Many American Indian children attend school with students<br />
and teachers who don’t know that American Indians still live<br />
in <strong>North</strong> <strong>Carolina</strong>; many attend school with students and<br />
teachers who don’t know the name <strong>of</strong> their tribe or anything<br />
about it; and many American Indian students find themselves<br />
feeling ethnically anonymous – with little or no acceptance as<br />
American Indians and scarce understanding <strong>of</strong> where they fit<br />
in the predominant culture in their school. Educators as well<br />
as tribal communities must address this issue because it<br />
can have far-reaching implications for student academic<br />
achievement, high school graduation success and continued<br />
post-secondary educational achievement.<br />
Research has documented the importance <strong>of</strong> school<br />
engagement to student success in school: children who do<br />
not feel connected to their schools or to at least one adult in<br />
their schools have increased rates <strong>of</strong> truancy, disciplinary<br />
problems, and dropout (Wehlage, et.al., 1989). This research<br />
has particular bearing on American Indian education, because<br />
when American Indian students feel isolated and unknown,<br />
they may be at increased risk for school failure. When schools<br />
are not adequately able to address the cultural needs <strong>of</strong><br />
American Indian students, parents and tribal communities<br />
become a critical resource for promoting and sustaining their<br />
students’ success.<br />
Because <strong>of</strong> this vital connection between parents, communities,<br />
and children’s success in school, this report focuses in part on<br />
the role <strong>of</strong> American Indian families in education (Section II).<br />
We know that parent involvement in children’s education is a<br />
centrally important factor in student success, but for American Indian children there may be an<br />
additional layer to this issue – the cultural duality referred to above. American Indian families<br />
and tribal communities may find that they are uniquely positioned to bridge the cultural<br />
differences children experience and to help students find a balance between their home culture<br />
and the mainstream culture predominant in schools. It is entirely possible that American Indian<br />
communities will decide that a significant portion <strong>of</strong> the responsibility for finding or defining<br />
this balance may be primarily one <strong>of</strong> the home and the tribal community, not the public school.<br />
Families and tribal communities can begin by defining what is important for their children to<br />
gain from school. All parents will agree that identity conflict cannot be used as an excuse for<br />
failing in school. Children must learn in order to move up the educational ladder. But, what is<br />
the formula for success? How do the objectives <strong>of</strong> the family and tribe match the schools’<br />
objectives? Are schools responsive to the needs <strong>of</strong> American Indian children? Are schools<br />
including American Indian parents in the equation in substantive ways? What can schools do<br />
to help American Indian young people remain comfortable with their own cultural identity and<br />
to become contributing members <strong>of</strong> a technologically complex, mainstream society?<br />
34
“I was not surprised when both<br />
American Indian and non-Indian<br />
teachers...thought that the most<br />
important attribute contributing to<br />
American Indian student success<br />
in majority society schools was the<br />
ability to manage in both American<br />
Indian and non-Indian worlds.<br />
These teachers recognized that<br />
students need to feel comfortable<br />
with both worlds and need to<br />
possess the necessary skills and<br />
attitudes to move in and out <strong>of</strong><br />
these worlds without sacrificing<br />
their American Indian ways.”<br />
The answers to these questions not only provide<br />
direction for improving and evaluating American Indian<br />
student success, they also provide a platform from which<br />
tribal communities and schools can work together to<br />
determine where responsibilities lie for American Indian<br />
student success.<br />
Cleary and Peacock, 1998<br />
“I think that saying ‘living in two different worlds’ comes from an age where people thought<br />
that we were the vanishing race, that we were going to be no more. That saying came from<br />
the time around the 1800s – 1880s or 1890s, and that saying was introduced to say, ‘Condone<br />
the destruction <strong>of</strong> our people.’ Our own people now hold that up as a motivational speech,<br />
and they always quote Sitting Bull: ‘Take the best from both worlds and make a good life for<br />
your people so they can live.’<br />
A lot <strong>of</strong> the Native American teachers [that I talk to] say that, and they don’t see beyond that;<br />
they don’t see that the teaching was once used to confuse our people. And the teaching that<br />
was shared to me that we hold onto is that you can learn another culture, but instill yours first.<br />
That’s similar to language; you can learn two languages, but you need to start with you home<br />
language first. So that’s very crucial. Because when you live in two worlds, the first time you<br />
have a problem at your home, at your job with your co-workers, with your teammates on the<br />
sports team, with your classmates in the classroom, you’re straddling that way.<br />
It’s the analogy that the white man has their boat. We have our canoe, and we’re traveling on<br />
this river and we can be neighbors, but if you are a person that has a foot in each boat you’re<br />
going to come to a rapids, and you are the one we’re going to lose. We are going to bury you<br />
and have a sad funeral. It’s going to be painful for all <strong>of</strong> us. So stay in your canoe; it’s okay to<br />
understand how that other boat was made and what they do, but you have your place here.<br />
It’s almost like you have to keep your one foot—the weight—in one [boat]. I would like to see<br />
us outgrow that thinking, that two-world psychology that we’re laying on our kids...”<br />
Dennis Bowen quoted in Cleary and Peacock, 1998<br />
35
SECTION II<br />
Family Involvement
FAMILY INVOLVEMENT IN EDUCATION<br />
While the parents interviewed by the State Advisory Council on Indian Education do not<br />
represent the full breadth <strong>of</strong> <strong>North</strong> <strong>Carolina</strong>’s American Indian communities, they are a<br />
diverse group. They are mothers, fathers, and grandparents; they are from single and two<br />
parent households; their occupations range widely and some work more than one job; their<br />
children or their grandchildren range from pre-kindergarten to seniors in high school, and<br />
they live in rural and urban communities. What these parents have in common is that they<br />
are already involved or participate in their child’s education in some way and they all<br />
describe themselves as having good relationships with their schools. Given these important<br />
commonalities, the findings in this section cannot be representative <strong>of</strong> all American Indian<br />
families. Some parents were interviewed in their home communities in March 2004 and<br />
others were interviewed at the <strong>North</strong> <strong>Carolina</strong> Indian Unity Conference held in Raleigh,<br />
<strong>North</strong> <strong>Carolina</strong> from March 11-13, 2004.<br />
The American Indian parents and grandparents we talked to were united in their strong belief<br />
that education is the primary tool for success in life. While they talked about education as<br />
a means to a better standard <strong>of</strong> living, they also talked about education as providing their<br />
children with the flexibility to understand how to be successful in a changing world. A number<br />
<strong>of</strong> parents talked about education as broadening their child’s understanding <strong>of</strong> society around<br />
them and as better preparing their child to be a contributing member and leader in that society.<br />
One father thought about education in terms <strong>of</strong> his own cultural difference, commenting<br />
that a public school education would better prepare his child to be successful in a “white<br />
man’s world.” Another mother said that she valued her children’s education, in part, because<br />
it “is the one thing no one can take from you.”<br />
Generally, parents felt their role was to support their child and their school’s educational<br />
objectives. Parents felt that their child’s exposure to and understanding <strong>of</strong> American Indian<br />
culture came from the home and the tribal environment and not from the school. Many<br />
expressed a strong desire to see <strong>North</strong> <strong>Carolina</strong> American Indians represented in their<br />
school’s textbooks and classrooms and to have their diversity appreciated throughout the<br />
year and not just at Thanksgiving or during Indian Heritage Month.<br />
American Indian Family Support for Education<br />
Families engage in a wide range <strong>of</strong> supportive activities, both in the home and at their<br />
child’s school. First and foremost, the family members we spoke to described their role as<br />
supportive: it is their job to support their child in every way possible, and it is also their job<br />
to support their child’s teacher and the school’s educational goals.<br />
A number <strong>of</strong> parents stressed the importance <strong>of</strong> developing a relationship with their child’s<br />
teacher. Some check-in with their child’s teacher regularly by phone, others occasionally stop<br />
in to visit with the teacher at school. One grandmother spoke about how important it was to<br />
establish a rapport with her grandchildren’s teachers: when the teacher understood the family,<br />
the children, and their lives better, the teacher was better able to support the child, was less<br />
likely to stereotype the child as a “bad kid,” and was more likely include the grandmother in<br />
observations and concerns. In general, parents were very complimentary about their child’s<br />
teacher (particularly at the elementary school level) and a number <strong>of</strong> parents commented on<br />
how well (or how weak) their child’s teacher and the school’s administration was in welcoming<br />
diversity in their school.<br />
38
In support <strong>of</strong> their children’s education, parents take a number <strong>of</strong> steps inside the home. They<br />
encourage good study habits by providing structured time for homework, and they check to<br />
see that homework is done; some parents assist children with homework and projects; and,<br />
a number <strong>of</strong> parents attempt to stay current with the educational priorities and the topics that<br />
their child is covering on a weekly basis. A large number <strong>of</strong> the parents interviewed spoke<br />
about the importance <strong>of</strong> reading to educational success and the majority reported reading to<br />
or with their child on a regular basis. Parents <strong>of</strong> older children reported less direct contact with<br />
teachers and course materials, but stressed the continued importance <strong>of</strong> daily conversations<br />
with their children about the work they are doing, the stresses they are feeling, the progress<br />
they are making, and the process <strong>of</strong> setting and working towards goals in their studies. Many<br />
<strong>of</strong> these parents continue to oversee the homework <strong>of</strong> their older children and ask about their<br />
child’s test performances and grades regularly.<br />
Many parents participate in their child’s education at school. Some parents participate directly<br />
by volunteering in the school, by serving on school committees, and by coaching athletic<br />
teams, while others are more indirect, choosing to encourage their child to participate in<br />
school activities and by providing their child with the materials and transportation they need<br />
to do so. A large number <strong>of</strong> parents stressed that they are very vocal with their children about<br />
joining school activities and becoming involved in their school’s extra-curricular life. One<br />
grandmother, speaking from two generations <strong>of</strong> experience with children, commented that<br />
she’d found American Indian children tend to hold back in joining school activities because<br />
they think the activities aren’t really meant for them. Because she believes this isn’t at all true –<br />
American Indian children are just as welcomed and entitled to be active at school as other children<br />
are – she makes a special effort to encourage her grandchildren to join in activities that<br />
they find interesting. It may be that schools, in becoming more aware <strong>of</strong> this potential<br />
perception, might be able to improve American Indian involvement and school engagement<br />
by taking specific steps to invite and recruit students into their extra-curricular programs.<br />
American Indian families also participate in many traditional parent-school activities: they help<br />
with fund raising, they join booster clubs, they chaperone field trips, they attend PTA meetings<br />
and they come out to cheer at athletic events. Some parents have found ways to introduce<br />
their own culture and heritage into their participation. One father described a steak dinner and<br />
powwow fundraiser that he was organizing to raise money for a school trip. Another father<br />
eats lunch with his elementary school child at school and will sometimes speak in his Native<br />
language to his son and his son’s friends.<br />
Communication Between Families and <strong>Schools</strong><br />
<strong>Schools</strong> communicate with families in a variety <strong>of</strong> ways: written notes, progress reports,<br />
newsletters, phone calls that are both pre-recorded messages and directly from the teacher,<br />
and websites. All <strong>of</strong> the parents interviewed were interested in open communication with<br />
schools and a number <strong>of</strong> parents <strong>of</strong>fered unsolicited comments about the degree to which<br />
they felt known and welcomed by the adults in the school. Parents <strong>of</strong> younger children tended<br />
to be happy with the level <strong>of</strong> communication they received from school. A few parents <strong>of</strong><br />
younger children also commented on how nice it was to walk into their child’s school and be<br />
known by name or at least greeted in a friendly manner. One father said he found it very<br />
encouraging that the teachers in his child’s school knew what he expected <strong>of</strong> his child and<br />
enforced those expectations. Parents <strong>of</strong> older children noted the decrease in communication<br />
with schools as their children moved to middle school and again upon moving up to high<br />
school. All <strong>of</strong> the parents <strong>of</strong> high school aged children were interested in hearing more from<br />
their child’s school and a couple said that they did not feel at all welcome to visit or stop by their<br />
child’s high school.<br />
39
Increasing Family Involvement and Participation in Education<br />
Following the interviews, one finding was striking: parents reported that the majority <strong>of</strong> the<br />
communication they received from schools was in writing. While this may be practical from<br />
a school’s standpoint, it does create some very real barriers for less educated parents. If a<br />
parent doesn’t read well, doesn’t read at all, or is simply insecure about his or her reading<br />
and writing skills, communicating in writing is likely to be uncomfortable and unproductive.<br />
A number <strong>of</strong> our parents felt that parents who were not involved in schools were not involved<br />
because they are “in the same condition as their children,” meaning they might not be able to<br />
read well, write well, they might have low self-confidence in a school setting, or they might be<br />
uncomfortable interacting with teachers. One parent noted that it would be good if teachers<br />
could reach out to parents and “draw them into the circle <strong>of</strong> involvement,” that understanding<br />
and being sensitive to a parent’s discomfort or fears might be all that it takes to increase their<br />
involvement. A grandparent seconded this notion, “[Teachers could] look beyond the parents<br />
who volunteer all the time and seek connections with the parents they don’t see as much.<br />
They could ask the parent to come in to sit with children at lunch or to oversee kids during<br />
a test... A parent who can’t read will be more concerned about volunteering when they feel<br />
inadequate. If parents don’t have self esteem, their children won’t either.”<br />
The parents and grandparents interviewed had the following suggestions for promoting<br />
family involvement:<br />
• Start targeting school programs to the entire family instead <strong>of</strong> just the student<br />
(for example, family reading night at the school).<br />
• Give parents more positive feedback. If the school only calls about trouble, they<br />
won’t want to come to the school.<br />
• Give parents options when possible. Increase flexibility for parents by <strong>of</strong>fering<br />
programs on more than one night or by varying times.<br />
• Ask parents about their schedules and what they can do. For example, one parent<br />
was asked to volunteer for a program scheduled from 3PM – 5 PM. The parent<br />
wasn’t available because <strong>of</strong> work, but would have been able to help out if the<br />
program ran from 4PM – 6PM.<br />
• Encourage students to get involved in after-school activities. Parents will come to<br />
see their children in activities.<br />
• Make deliberate use <strong>of</strong> word <strong>of</strong> mouth and advertise in newspapers.<br />
• Stress the importance <strong>of</strong> involvement or participation in education: “If we don’t do<br />
this, we’ll lose our kids.”<br />
Teaching Native Culture, History, and Heritage<br />
The parents the Council spoke to do not count on the schools to teach their children much, if<br />
anything, about American Indian culture, history, or heritage. Instead, they take responsibility<br />
for this instruction in the home and in the tribal community. Many parents would like to see<br />
more historical attention given to <strong>North</strong> <strong>Carolina</strong> Indians in social studies and history classrooms,<br />
and a couple <strong>of</strong> parents noted that <strong>North</strong> <strong>Carolina</strong> Indians are completely missing from their<br />
child’s textbooks. A number <strong>of</strong> parents think this might help alleviate the painful and frequently<br />
voiced misconceptions <strong>of</strong> their children’s classmates – that there are no more Indians, that a<br />
child couldn’t be an Indian because he doesn’t “look Indian” or because he doesn’t wear a<br />
feather in his hair. Most parents we spoke to take these comments as opportunities to educate<br />
the children and adults around them, but they remain alert to the confusion and damage that<br />
can be caused to their own child’s sense <strong>of</strong> identity and self-esteem.<br />
40
In general, parents find their children’s teachers are uneducated about both the history and<br />
current affairs <strong>of</strong> <strong>North</strong> <strong>Carolina</strong>’s Indian tribes. Many parents make it their duty to educate<br />
their child’s teacher about their own and other <strong>North</strong> <strong>Carolina</strong> tribes and many provide resources<br />
and reading materials for the teacher’s use. A number <strong>of</strong> parents said that every year they<br />
meet with their child’s teacher at the start <strong>of</strong> school, introduce themselves, and identify their<br />
child as an American Indian. They talk to the teacher a bit about their own tribe and follow up<br />
their conversation with additional information or resources about American Indians in <strong>North</strong><br />
<strong>Carolina</strong>. Some parents are very direct in sensitizing teachers to American Indian issues and<br />
stereotypes. Other parents make a point <strong>of</strong> contacting their child’s teacher before Thanksgiving<br />
and spend time in the schools before the holiday helping to educate children about what it<br />
means to be American Indian. One parent said that she always visits her child’s classroom<br />
right before Thanksgiving in full regalia and she spends time talking to the children about<br />
American Indians in the world today. A few parents provide their schools with resource<br />
materials, books, and artwork for display during Indian Heritage Month.<br />
All <strong>of</strong> the parents interviewed teach their children about their heritage through story-telling.<br />
Sometimes the stories are simple – the story <strong>of</strong> a family member’s success, or the story <strong>of</strong><br />
someone’s struggles with adversity – but the story is the central way that families pass their<br />
values and teachings on to their children. Some families rely on frequent trips to the “home<br />
place” where their children can hear elders tell stories <strong>of</strong> their heritage. One urban mother<br />
admitted that her children are learning a lot about their heritage from books – things that<br />
would have once been passed down orally – because books and the Internet provide<br />
information that she doesn’t know well. Many parents also talked about regularly attending<br />
powwows as an important part <strong>of</strong> instilling their culture and heritage in their children.<br />
In many communities, Indian Education Programs are an extremely valuable resource for<br />
teaching children about their heritage. Indian Education Programs are federally funded<br />
through Title VII and are administered through school districts whose American Indian student<br />
populations meet certain numbers and other criteria. Some parents mentioned the classes<br />
available to their children like beading, dance, song, and legends. Others talked about the<br />
cultural enrichment opportunities provided by their Indian Education Program and the trips<br />
the Program <strong>of</strong>fered outside the community that broadened their child’s awareness <strong>of</strong> others<br />
in <strong>North</strong> <strong>Carolina</strong>. One parent commented that the Indian Education Program helped connect<br />
his child to her identity in an urban county where less than 1% <strong>of</strong> the students are American<br />
Indian and it helped her see that there were other kids similar to her.<br />
Tribal organizations, associations, and centers are also closely involved in teaching American<br />
Indian children and adults about their heritage. A number <strong>of</strong> parents take their children to<br />
weekly classes at their tribal center. Some cultural centers orchestrate special workshops for<br />
children so that talented community members – sculptors, bead workers, story-tellers – can<br />
share their artistry and craft with children in the community. One parent pointed out that her<br />
tribe’s cultural center educates non-Indians as well as Indians about tribal history and culture.<br />
One tribe produced a documentary video (in collaboration with a local university) about its<br />
history and is distributing the video to every school in surrounding counties. A number <strong>of</strong><br />
parents noted that their tribal association or organization works with local schools to educate<br />
children about American Indian history and culture.<br />
Overall, the parents who were interviewed by the Council are very attuned to their role in and<br />
responsibility for teaching their children about their culture and heritage as American Indians.<br />
They access community and tribal resources in educating their children and many talk about<br />
this education as an integral part <strong>of</strong> their family lives. Many parents express a strong wish that<br />
schools would incorporate more into their curriculum about American Indian history and<br />
American Indians living in <strong>North</strong> <strong>Carolina</strong> today.<br />
41
Conclusions<br />
Because the parents and grandparents interviewed for this report share some key characteristics<br />
– they are involved in their children’s education already and they describe having a good<br />
relationship with their schools – the Council is not able to draw conclusions about parent<br />
involvement across all American Indian families. However, our interviewees are a diverse<br />
group in terms <strong>of</strong> occupation, socio-economic background and education levels. Based on<br />
the similarities that arose from those interviews, this is what the Council found:<br />
• Parents are concerned about both teachers’ and administrators’ levels <strong>of</strong> awareness<br />
regarding their children’s cultural diversity. Many parents address their concerns<br />
directly by talking to their child’s teacher about stereotypes that American Indians<br />
encounter. They also try to provide teachers with additional information or<br />
resources about American Indians in <strong>North</strong> <strong>Carolina</strong> and to promote increased<br />
awareness about stereotypes and common misconceptions about modern<br />
American Indians.<br />
• In addition, parents would like to see more active attention given to <strong>North</strong> <strong>Carolina</strong><br />
Indians in social studies and history curriculums and textbooks. They are concerned<br />
about the damaging effects that un-informed comments like, “You can’t be an<br />
Indian, they’re all dead,” “you don’t wear a feather in your hair,” or “you don’t<br />
have black hair,” can cause for their own children who are struggling to understand<br />
their heritage and identity in a mainstream culture that already sets them apart as<br />
different or “minority.” Non-Indian children must be exposed to accurate information<br />
about <strong>North</strong> <strong>Carolina</strong>’s American Indians – both historically and in a modern<br />
context – in order to eliminate these harmful stereotypes.<br />
• The family members interviewed were very focused on encouraging their children<br />
to be involved in school activities. One grandmother, who had worked with<br />
American Indian children for years, provided an interesting context for this: she felt<br />
that American Indian children <strong>of</strong>ten thought school activities weren’t really meant<br />
“for them.” It may be that schools can promote higher levels <strong>of</strong> involvement and<br />
school engagement among American Indian students if they deliberately recruit<br />
and invite American Indian students to join school-sponsored programs and activities.<br />
This recruitment might be done through tribal centers and organizations, cultural<br />
centers, Indian Education Programs, and local churches.<br />
• Families and schools might partner to incorporate American Indian traditions and<br />
culture into their schools. At one school, a parent we interviewed was organizing a<br />
powwow as both a fund raising event and as an opportunity to share his culture<br />
with the school community. Activities like this one – that integrate a regular school<br />
need with an opportunity for cultural enrichment – may be a very effective means<br />
<strong>of</strong> educating children and communities about American Indian heritage.<br />
• Families value their relationships with schools and they want those connections to<br />
be close and comfortable. They want to be actively welcomed by schools and they<br />
want to know, or at least be comfortable in greeting, all the adults working in their<br />
child’s school regardless <strong>of</strong> their child’s age. Parental confidence in and support for<br />
schools and their programs appeared to be stronger when the parent we interviewed<br />
had good communications with his or her school.<br />
• Lastly, our interviews indicated that families are learning about their children’s<br />
academic performance primarily through written communications like notes,<br />
progress reports, and performance reports. When schools communicate with<br />
families in writing, they are inadvertently excluding a sector <strong>of</strong> their parent/family<br />
population. If schools can find a way to communicate more with families through<br />
personal phone calls, visits, or other non-written means – particularly among those<br />
families who appear to be entirely disengaged from education – they may be far<br />
more effective in increasing family participation in education.<br />
42
SECTION III<br />
Recommendations
RECOMMENDATIONS<br />
American Indian students are making impressive strides in academic achievement according<br />
to our primary statewide indicator, the ABCs End-<strong>of</strong>-Grade and End-<strong>of</strong>-Course tests. With that<br />
base <strong>of</strong> academic success, American Indian students have the foundation necessary to<br />
improve in other measures <strong>of</strong> performance: advanced course-taking, high school graduation,<br />
and post-secondary enrollment and completion. With resources targeted through the following<br />
recommendations, American Indian students in <strong>North</strong> <strong>Carolina</strong> are poised to reach higher<br />
levels <strong>of</strong> educational success than ever before.<br />
Recommendation 1:<br />
Improve the quality and quantity <strong>of</strong> data available regarding American Indian students and<br />
their educational trajectories. While the state has excellent data to measure the academic<br />
performance and growth <strong>of</strong> public school students in grades 3 – 12, it does not have adequate<br />
disaggregated data to explore questions about the degree to which American Indian students<br />
excel in their studies and are recommended for and enroll in upper level classes. In addition,<br />
further study <strong>of</strong> data extending beyond grade 12 will provide important insight into the<br />
employability and the prospects for long-term economic security <strong>of</strong> American Indian young<br />
people.<br />
• Require that enrollment data in advanced courses be disaggregated for American<br />
Indian students, particularly on the statewide School and District Report Cards.<br />
Begin collecting data on course taking patterns <strong>of</strong> American Indian students –<br />
especially advanced courses as defined by the school report card – if this data is<br />
not currently collected at the state level.<br />
• Request the NC Department <strong>Public</strong> Instruction identify and charge personnel to<br />
study American Indian dropout issues and define lessons that can be learned from<br />
states with much better high school graduation rates for American Indian students<br />
(Alabama, Arkansas, Hawaii, New Mexico, Oklahoma, and Virginia). Selection <strong>of</strong><br />
states based on data from “Losing Our Future: How Minority Youth are Being Left<br />
Behind by the Graduation Rate Crisis,” published by the Harvard Civil Rights<br />
Project.<br />
• With the findings from this study <strong>of</strong> American Indian high school graduation rates,<br />
appoint selected individuals to develop and apply results and new strategies to a<br />
pilot group <strong>of</strong> high schools serving American Indian students. Consider connecting<br />
the pilot to work currently underway in the New <strong>Schools</strong> Project, a high school<br />
innovation project grant supported by the Gates Foundation.<br />
• Develop a partnership among the University <strong>of</strong> <strong>North</strong> <strong>Carolina</strong> system, the <strong>North</strong><br />
<strong>Carolina</strong> Community College system and the Office <strong>of</strong> the Superintendent <strong>of</strong> the NC<br />
Department <strong>of</strong> <strong>Public</strong> Instruction to conduct a review <strong>of</strong> American Indian enrollment,<br />
retention, and graduation rates, and a review <strong>of</strong> the courses <strong>of</strong> study and degree<br />
programs American Indian students pursue in higher education. Information from<br />
this review will be provided to the State Advisory Council on Indian Education who<br />
will disseminate its findings to Tribal governments, Title VII Indian Education program<br />
directors, LEA superintendents, and academic <strong>of</strong>ficers <strong>of</strong> statewide institutions<br />
<strong>of</strong> higher education.<br />
46
Recommendation 2:<br />
Foster partnerships between high schools and the local business community with a specific<br />
focus on American Indian students’ preparation for and attainment <strong>of</strong> skilled, year-round<br />
employment. While we work hard to encourage American Indian students to stay in school<br />
and graduate with at least a high school diploma, are we sure that jobs exist for them when<br />
they leave school? And, do American Indian young people find jobs available in their tribal<br />
communities?<br />
• Develop formal partnerships between school guidance departments and Title VII<br />
Indian Education program directors aimed at aligning American Indian student<br />
course taking and academic preparation with the skill requirements for jobs<br />
students are interested in seeking.<br />
• Invite representatives from local chambers <strong>of</strong> commerce, local job services or<br />
employment <strong>of</strong>fices, and local human resources pr<strong>of</strong>essionals to work with Title VII<br />
Indian Education program directors, guidance counselors, and tribal elders to review<br />
current job markets, determine in what sectors American Indians are currently<br />
employed, and to explore ways to broaden employment opportunities, particularly<br />
within tribal territories. In addition, ask groups to work with school administrators<br />
to formulate action plans for strengthening American Indian students’ preparation<br />
for future employment opportunities.<br />
Recommendation 3:<br />
Actively support pr<strong>of</strong>essional development for teachers to enhance their knowledge <strong>of</strong><br />
American Indian history and culture. Given the recent establishment <strong>of</strong> a high school<br />
American Indian studies elective, and growing focus on raising the performance <strong>of</strong> student<br />
demographic subgroups including American Indians, the time is ripe for high quality, pr<strong>of</strong>essionally<br />
organized, and systematic development <strong>of</strong> educators’ knowledge and understanding <strong>of</strong><br />
American Indian history and culture. While many individual efforts to deliver American Indianrelated<br />
pr<strong>of</strong>essional development exist across the state, there is no central organization or<br />
means <strong>of</strong> communicating the opportunities available to educators (see Appendix A).<br />
• Request the NC Department <strong>of</strong> <strong>Public</strong> Instruction conduct an inventory <strong>of</strong> all<br />
educational resources and pr<strong>of</strong>essional development related to American Indian<br />
studies currently available to educators in <strong>North</strong> <strong>Carolina</strong>. Partner with the State<br />
Advisory Council on Indian Education to disseminate information about how and<br />
where to access these pr<strong>of</strong>essional development resources to K-12 teachers and<br />
teacher training programs statewide.<br />
• Request that <strong>Schools</strong> <strong>of</strong> Education insert an American Indian history and culture<br />
requirement for pre-service teachers.<br />
• Actively seek business and foundation partners who are willing to provide annual<br />
sponsorship grants to 150 social studies educators and others who are interested<br />
in becoming more expert on <strong>North</strong> <strong>Carolina</strong> American Indian history, culture, and<br />
current affairs.<br />
• Continue efforts that require all public school administrators and local boards <strong>of</strong><br />
education to review their policies and procedures toward the use <strong>of</strong> American<br />
Indian sports mascots, logos, and all demeaning imagery; and educate public<br />
school personnel about the educational, curricular, and psychological effects <strong>of</strong><br />
using American Indian sports mascots and logos.<br />
47
Recommendation 4:<br />
Actively support programs that nurture American Indian families for school success.<br />
• Develop a partnership between the Department <strong>of</strong> <strong>Public</strong> Instruction<br />
Communications Division and other state agencies and organizations to compile<br />
parent involvement resources particularly geared towards American Indian families.<br />
Publish and disseminate these materials for use by tribal organizations, American<br />
Indian churches, and schools serving relatively large populations <strong>of</strong> American<br />
Indian students.<br />
• Request that LEAs publish and distribute grade appropriate information to families<br />
on how to support children’s education in the home. These publications might<br />
include grade-level specific tips for helping with homework, grade specific guidelines<br />
on how much or how little to assist children with schoolwork, and how to help<br />
a child learn to read.<br />
• Support tribal and LEA efforts to improve American Indian family involvement in<br />
their children’s education. <strong>Public</strong>ly recognize tribes and LEAs that create effective<br />
programmatic responses to improving family-school relations.<br />
• Establish a formal partnership between the Department <strong>of</strong> <strong>Public</strong> Instruction’s<br />
parent involvement coordinator and the state’s Title VII Indian Education program<br />
directors. Create an American Indian family involvement advisory group at the state<br />
level, meeting the state parent involvement coordinator on a quarterly basis, and<br />
charged with improving American Indian family-school connections.<br />
48
SECTION IV<br />
Student Performance Data
TITLE VII COHORTS<br />
Students Program<br />
System Male Female Served Administrator/Director Phone<br />
Columbus 206 204 410 Kenwood Royal (910) 642-5168<br />
Cumberland 476 426 902 Trudy Locklear (910) 678-2462<br />
Graham 56 71 127 Marcia Hollifield (828) 479-3453<br />
Guilford 225 210 435 Jean Conley (336) 621-4042<br />
Halifax 174 130 304 Tyus Few (252) 583-5111<br />
Hertford 22 21 43 Janet Jones (252) 358-1761<br />
Hoke 481 437 918 Billy Jacobs (910) 875-4835<br />
Jackson 198 170 368 Nancy Sherrill (828) 586-2311<br />
Person 12 15 27 Leon Hamlin (336) 599-2191<br />
Richmond 90 79 169 Linda Nicholson (910) 582-5860<br />
Robeson 5,231 5,013 10,244 Rita Locklear (910) 521-1881<br />
Sampson 56 50 106 Pam Westbrook (910) 592-1401<br />
Clinton City 53 50 103 Linda Brunson (910) 592-3132<br />
Scotland 414 412 826 Lyle Shaw (910) 277-4459<br />
Swain 195 176 371 Bob Marr (828) 488-3129<br />
Wake 126 149 275 William Carruthers (919) 850-8894<br />
Warren 72 81 153 Costel Evans (252) 257-3184<br />
Total served in Cohort 15,781<br />
Total Served Indian Male 8,087<br />
Total Served Indian Female 7,694<br />
Indian Membership Statewide 19,081<br />
Indian Membership Male 9,774<br />
Indian Membership Female 9,307<br />
51
STATE SUMMARY DATA – ALL STUDENTS<br />
STUDENT ACHIEVEMENT DATA<br />
TABLE 4<br />
End-<strong>of</strong>-Grade Reading Test: Percent <strong>of</strong> Students At or Above Grade Level<br />
(Achievement Level III or Higher)<br />
TABLE 5<br />
2001 2002 2003<br />
Grade AI State AI State AI State<br />
3 69.4 76.4 71.6 79.8 75.6 82.6<br />
4 61.6 74.6 67.6 77.1 76.7 83.7<br />
5 71.5 82.7 70.7 84.5 79.6 88.7<br />
6 58.8 70.6 62.1 74.1 72.4 81.5<br />
7 62.2 75.3 65.8 76.6 79.5 85.3<br />
8 74.4 83.3 75.5 85.2 81.7 87.7<br />
End-<strong>of</strong>-Grade Mathematics Test: Percent <strong>of</strong> Students At or Above Grade Level<br />
(Achievement Level III or Higher)<br />
TABLE 6<br />
2001 2002 2003<br />
Grade AI State AI State AI State<br />
3 68.8 73.6 68 77.3 83.6 88.9<br />
4 78.9 86.8 83.8 88.9 91.5 94.7<br />
5 77.8 86.7 78.7 88.4 86.5 92.6<br />
6 75.2 82.9 79.3 86.4 82.6 90<br />
7 73.3 81.2 76.9 83.3 79.9 83.8<br />
8 72.5 79.5 76 82.3 79.4 84.2<br />
End-<strong>of</strong>-Grade Mathematics Test: Percent <strong>of</strong> Students At or Above Grade Level<br />
(Achievement Level III or Higher)<br />
2001 2002 2003<br />
Subject AI State AI State AI State<br />
Algebra I 67.6 76.0 69.5 78.9 72.1 78.6<br />
Biology 46.3 61.0 58.5 69.3 47.5 61.0<br />
ELP 54.5 70.0 52.3 69.5 59.5 69.3<br />
English I 50.8 68.3 50.5 69.6 67.1 81.6<br />
US History 34.7 50.5 38.0 50.1 43.7 54.9<br />
Algebra II 55.6 73.0 69.8 76.9 70.0 78.8<br />
Chemistry 46.3 74.4 67.6 84.4 69.7 83.4<br />
Geometry 44.6 65.5 60.1 70.6 66.6 74.2<br />
Physics 45.4 63.9 51.0 66.3 57.9 69.5<br />
Phy. Science 40.5 59.9 51.4 61.5 53.9 64.0<br />
52
COLUMBUS COUNTY<br />
Trend <strong>of</strong> American Indian Students At/Above Grade Level<br />
in EOG Reading, Grades 3-8<br />
100<br />
90<br />
80<br />
Percent <strong>of</strong> Students (%)<br />
70<br />
60<br />
50<br />
40<br />
30<br />
NC State<br />
NC American<br />
Indian<br />
LEA<br />
LEA American<br />
Indian<br />
20<br />
10<br />
0<br />
92-93 93-94 94-95 95-96 96-97 97-98 98-99 99-00 00-01 01-'02 02-'03<br />
Trend <strong>of</strong> American Indian Students At/Above Grade Level<br />
in EOG Mathematics, Grades 3-8<br />
100<br />
90<br />
80<br />
Percent <strong>of</strong> Students (%)<br />
70<br />
60<br />
50<br />
40<br />
30<br />
NC State<br />
NC American<br />
Indian<br />
LEA<br />
LEA American<br />
Indian<br />
20<br />
10<br />
0<br />
92-93 93-94 94-95 95-96 96-97 97-98 98-99 99-00 00-01 01-02 02-03<br />
53
EOG Reading, Percent <strong>of</strong> Students At/Above Grade Level<br />
AMERICAN INDIAN<br />
EOG Mathematics, Percent <strong>of</strong> Students At/Above Grade Level<br />
SYSTEM (All Students)<br />
Grade Participation 1998 1999 2000 2001 2002 2003 1998 1999 2000 2001 2002 2003<br />
3 % Grade Level 54.8 43.0 41.4 65.6 70.8 77.4 61.8 58.0 64.5 70.8 70.4 77.1<br />
# Tested 31 32 29 32 24 31 539 565 538 534 520 497<br />
4 % Grade Level 50.0 62.0 54.5 68.4 77.4 69.2 63.1 63.0 59.3 66.2 68.0 72.0<br />
# Tested 28 32 33 19 31 26 526 503 535 520 512 500<br />
5 % Grade Level 65.5 60.0 75.8 73.3 73.7 83.3 70.7 67.0 74.9 73.2 77.4 80.8<br />
# Tested 29 30 33 30 19 30 523 521 491 519 501 521<br />
6 % Grade Level 53.1 54.0 51.9 61.5 71.4 50.0 57.2 63.0 62.6 61.8 60.2 72.1<br />
# Tested 32 31 27 39 35 28 563 541 546 524 550 592<br />
7 % Grade Level 52.9 61.0 60.0 57.7 74.4 82.9 59.3 68.0 71.6 65.7 72.0 82.9<br />
# Tested 34 31 35 26 39 35 580 554 545 533 521 532<br />
8 % Grade Level 67.9 54.0 67.7 96.3 75.0 73.2 73.6 71.0 77.4 79.8 79.1 84.7<br />
# Tested 28 33 31 27 24 41 588 553 539 505 516 524<br />
AMERICAN INDIAN<br />
COLUMBUS COUNTY<br />
SYSTEM (All Students)<br />
Grade Participation 1998 1999 2000 2001 2002 2003 1998 1999 2000 2001 2002 2003<br />
3 % Grade Level 62.5 56.0 62.1 78.1 75.0 93.5 61.5 61.0 68.8 68.7 68.5 86.5<br />
# Tested 31 32 29 32 24 31 539 567 539 536 523 497<br />
4 % Grade Level 64.2 75.0 78.8 60.9 90.3 96.2 76.7 80.0 80.2 85.1 85.9 90.0<br />
# Tested 28 32 33 23 31 26 526 505 540 524 517 502<br />
5 % Grade Level 65.5 66.0 66.7 80.0 73.9 93.3 74.6 80.0 79.1 80.5 88.0 87.7<br />
# Tested 29 30 33 30 23 30 523 525 492 524 508 522<br />
6 % Grade Level 68.8 67.0 55.6 66.7 68.6 60.7 70.5 75.0 76.1 80.2 78.3 83.4<br />
# Tested 32 31 27 39 35 28 563 543 547 525 553 595<br />
7 % Grade Level 47.1 68.0 80.0 76.9 80.0 91.4 68.8 75.0 80.4 76.1 78.9 76.0<br />
# Tested 34 32 35 26 40 35 580 555 546 535 527 537<br />
8 % Grade Level 71.4 66.0 87.1 93.1 62.5 61.0 72.8 73.0 77.3 78.7 78.0 78.6<br />
# Tested 28 33 31 29 24 41 588 553 538 512 519 527<br />
EOC High School Subjects, Percent <strong>of</strong> Students At/Above Grade Level<br />
AMERICAN INDIAN<br />
SYSTEM (All Students)<br />
Course Participation 1998 1999 2000 2001 2002 2003 1998 1999 2000 2001 2002 2003<br />
Algebra I % Grade Level 48.9 56.7 45.5 81.6 71.4 65.4 46.6 54.1 63.9 73.5 68.7 73.0<br />
# Tested 45 30 11 38 28 26 686 754 510 596 575 552<br />
Biology % Grade Level 44.4 36.4 66.7 38.1 43.3 32.5 33.6 46.1 42.5 46.6 54.3 45.9<br />
# Tested 27 11 21 21 30 40 131 401 492 489 484 505<br />
ELP % Grade Level 68.4 61.3 65.0 62.5 57.1 56.0 64.1 62.8 63.2 64.2 65.9 71.2<br />
# Tested 19 31 20 24 28 25 498 521 497 492 451 437<br />
English I % Grade Level 47.2 51.9 41.7 43.3 58.8 63.0 56.3 56.1 58.5 60.5 63.8 72.9<br />
# Tested 36 27 36 30 34 27 535 533 586 521 531 547<br />
US History % Grade Level 52.0 33.3 48.3 52.6 25.0 38.5 40.0 37.2 43.5 47.4 43.0 49.9<br />
# Tested 25 18 29 19 20 26 422 441 469 420 421 415<br />
Algebra Il % Grade Level — 35.3 42.1 30.8 37.5 50.0 — 50.4 39.5 48.0 65.7 65.5<br />
# Tested — 17 19 13 8 8 — 256 299 300 245 264<br />
Physics % Grade Level — 66.7 100.0 25.0 100.0 100.0 — 79.4 58.1 57.1 81.0 80.0<br />
# Tested — 3 1 4 1 1 — 34 31 49 42 15<br />
Chemistry % Grade Level — 20.0 22.2 28.6 66.7 75.0 — 36.4 47.7 44.7 59.5 75.7<br />
# Tested — 5 9 14 3 4 — 165 216 206 205 169<br />
Geometry % Grade Level — 33.3 26.1 55.6 35.3 36.8 — 34.9 39.6 51.6 50.6 49.5<br />
# Tested — 27 23 9 17 19 — 312 407 312 322 364<br />
Phys.Science % Grade Level — 66.7 0.0 72.7 61.1 45.0 — 45.5 53.4 53.4 53.3 64.8<br />
# Tested — 21 1 11 18 20 — 209 73 277 315 361<br />
Source: <strong>Public</strong> <strong>Schools</strong> <strong>of</strong> <strong>North</strong> <strong>Carolina</strong>, Division <strong>of</strong> Accountability and Technology Services, 2002-03<br />
54
CUMBERLAND COUNTY<br />
Trend <strong>of</strong> American Indian Students At/Above Grade Level<br />
in EOG Reading, Grades 3-8<br />
100<br />
90<br />
80<br />
Percent <strong>of</strong> Students (%)<br />
70<br />
60<br />
50<br />
40<br />
30<br />
NC State<br />
NC American<br />
Indian<br />
LEA<br />
LEA American<br />
Indian<br />
20<br />
10<br />
0<br />
92-93 93-94 94-95 95-96 96-97 97-98 98-99 99-00 00-01 01-02 02-03<br />
Trend <strong>of</strong> American Indian Students At/Above Grade Level<br />
in EOG Mathematics, Grades 3-8<br />
100<br />
90<br />
80<br />
Percent <strong>of</strong> Students (%)<br />
70<br />
60<br />
50<br />
40<br />
30<br />
20<br />
NC State<br />
NC American<br />
Indian<br />
LEA<br />
LEA American<br />
Indian<br />
10<br />
0<br />
92-93 93-94 94-95 95-96 96-97 97-98 98-99 99-00 00-01 01-02 02-03<br />
55
EOG Reading, Percent <strong>of</strong> Students At/Above Grade Level<br />
AMERICAN INDIAN<br />
EOG Mathematics, Percent <strong>of</strong> Students At/Above Grade Level<br />
EOC High School Subjects, Percent <strong>of</strong> Students At/Above Grade Level<br />
SYSTEM (All Students)<br />
Grade Participation 1998 1999 2000 2001 2002 2003 1998 1999 2000 2001 2002 2003<br />
3 % Grade Level 53.4 66.0 59.4 78.6 70.0 76.9 70.2 74.0 71.1 75.0 77.3 80.9<br />
# Tested 73 60 69 56 60 65 4202 4219 4022 4100 4003 3913<br />
4 % Grade Level 51.6 61.0 61.4 60.9 73.7 67.3 72.6 70.0 70.1 72.4 75.8 81.4<br />
# Tested 62 68 57 69 57 55 3988 4013 4037 3864 4007 3927<br />
5 % Grade Level 63.8 54.0 64.5 72.6 73.5 93.0 94.8 78.0 78.6 80.7 82.5 88.3<br />
# Tested 58 64 76 62 68 57 3910 3882 3885 3968 3960 3994<br />
6 % Grade Level 58.1 69.0 47.1 56.3 60.0 69.2 70.6 73.0 71.0 69.4 73.4 80.7<br />
# Tested 74 65 68 80 65 78 3986 3822 3884 3909 3904 3981<br />
7 % Grade Level 59.7 63.0 64.1 61.5 68.0 82.0 73.1 76.0 73.8 75.9 75.2 84.8<br />
# Tested 72 82 64 65 75 61 3816 3915 3861 3878 3861 3953<br />
8 % Grade Level 80.0 66.0 71.4 76.8 73.5 74.7 80.2 77.0 81.4 82.5 84.4 86.9<br />
# Tested 75 63 77 69 68 75 3638 3707 3885 3740 3879 3823<br />
AMERICAN INDIAN<br />
CUMBERLAND COUNTY<br />
SYSTEM (All Students)<br />
Grade Participation 1998 1999 2000 2001 2002 2003 1998 1999 2000 2001 2002 2003<br />
3 % Grade Level 56.1 65.0 63.8 78.6 70.0 83.1 68.1 69.0 67.3 72.4 73.5 86.6<br />
# Tested 73 60 69 56 60 65 4202 4222 4022 4109 4005 3917<br />
4 % Grade Level 71.0 79.0 82.5 82.6 91.2 85.5 80.1 82.0 82.1 86.2 86.4 93.1<br />
# Tested 62 68 57 69 57 55 3988 4019 4042 3879 4008 3930<br />
5 % Grade Level 69.0 68.0 77.6 75.8 82.6 94.7 77.2 83.0 83.0 85.6 87.0 92.0<br />
# Tested 58 64 76 62 69 57 3910 3891 3893 3974 3967 3998<br />
6 % Grade Level 73.0 71.0 61.8 70.0 81.3 82.3 76.8 78.0 78.4 82.3 83.7 88.7<br />
# Tested 74 64 68 80 64 79 3986 3827 3883 3908 3909 3985<br />
7 % Grade Level 65.3 72.0 67.2 69.2 72.0 86.9 73.0 80.0 75.6 77.3 78.5 79.7<br />
# Tested 72 83 64 65 75 61 3816 3916 3863 3879 3859 3951<br />
8 % Grade Level 53.3 58.0 71.4 65.2 67.6 68.0 71.5 68.0 75.0 74.1 76.1 80.4<br />
# Tested 75 63 77 69 68 75 3638 3716 3888 3748 3876 3821<br />
AMERICAN INDIAN<br />
SYSTEM (All Students)<br />
Course Participation 1998 1999 2000 2001 2002 2003 1998 1999 2000 2001 2002 2003<br />
Algebra I % Grade Level 50.0 44.4 60.6 66.2 69.1 74.3 49.7 52.9 54.9 65.7 69.2 70.3<br />
# Tested 46 63 66 65 68 74 3194 3437 3651 3629 4209 4272<br />
Biology % Grade Level 45.7 41.2 36.1 60.7 59.7 43.9 54.5 48.5 50.2 56.1 61.9 54.3<br />
# Tested 46 68 61 56 72 66 3073 3227 3352 3438 3980 3974<br />
ELP % Grade Level 58.0 48.1 59.2 58.3 58.9 68.3 66.4 64.4 64.7 65.2 65.1 68.8<br />
# Tested 81 77 76 72 56 60 4061 3872 3943 3892 3817 4144<br />
English I % Grade Level 48.7 47.6 50.7 61.7 55.4 72.8 61.3 64.1 66.4 65.3 66.9 82.1<br />
# Tested 78 82 73 81 65 81 3744 3807 3978 4174 4173 4116<br />
US History % Grade Level 51.3 50.0 34.5 40.0 51.8 50.8 49.9 49.2 41.2 45.1 45.6 52.5<br />
# Tested 39 46 55 60 56 59 2693 2859 3080 3146 3330 3498<br />
Algebra Il % Grade Level — 66.7 34.3 29.0 66.7 81.1 — 38.0 42.7 52.8 65.8 70.9<br />
# Tested — 24 35 31 42 37 — 2220 2262 2267 2522 2513<br />
Physics % Grade Level — 100.0 100.0 66.7 60.0 100.0 — 59.2 60.2 58.8 73.5 69.6<br />
# Tested — 1 1 3 5 2 — 304 420 359 385 362<br />
Chemistry % Grade Level — 50.0 52.9 50.0 79.3 78.9 — 54.3 51.9 54.9 65.5 65.7<br />
# Tested — 20 17 20 29 19 — 1518 1593 1587 1654 1690<br />
Geometry % Grade Level — 41.9 36.5 40.7 62.2 48.8 — 43.8 39.0 46.1 51.0 55.1<br />
# Tested — 43 52 59 37 41 — 2679 2948 2694 3101 3234<br />
Phys.Science % Grade Level — 38.9 49.2 40.0 52.4 42.9 — 45.2 44.1 47.1 55.8 54.5<br />
# Tested — 54 63 25 21 28 — 3103 3136 1344 1075 1571<br />
Source: <strong>Public</strong> <strong>Schools</strong> <strong>of</strong> <strong>North</strong> <strong>Carolina</strong>, Division <strong>of</strong> Accountability and Technology Services, 2002-03<br />
56
GRAHAM COUNTY<br />
Trend <strong>of</strong> American Indian Students At/Above Grade Level<br />
in EOG Reading, Grades 3-8<br />
100<br />
90<br />
80<br />
Percent <strong>of</strong> Students (%)<br />
70<br />
60<br />
50<br />
40<br />
30<br />
NC State<br />
NC American<br />
Indian<br />
LEA<br />
LEA American<br />
Indian<br />
20<br />
10<br />
0<br />
92-93 93-94 94-95 95-96 96-97 97-98 98-99 99-00 00-01 01-02 02-03<br />
Trend <strong>of</strong> American Indian Students At/Above Grade Level<br />
in EOG Mathematics, Grades 3-8<br />
100<br />
90<br />
80<br />
Percent <strong>of</strong> Students (%)<br />
70<br />
60<br />
50<br />
40<br />
30<br />
20<br />
NC State<br />
NC American<br />
Indian<br />
LEA<br />
LEA American<br />
Indian<br />
10<br />
0<br />
92-93 93-94 94-95 95-96 96-97 97-98 98-99 99-00 00-01 01-02 02-03<br />
57
EOG Reading, Percent <strong>of</strong> Students At/Above Grade Level<br />
AMERICAN INDIAN<br />
EOG Mathematics, Percent <strong>of</strong> Students At/Above Grade Level<br />
SYSTEM (All Students)<br />
Grade Participation 1998 1999 2000 2001 2002 2003 1998 1999 2000 2001 2002 2003<br />
3 % Grade Level 88.2 66.0 75.0 60.0 58.3 88.9 75.8 71.0 76.1 71.1 77.7 81.4<br />
# Tested 17 9 12 15 12 9 116 87 88 97 103 86<br />
4 % Grade Level 85.7 77.0 60.0 58.3 85.7 80.0 76.1 74.0 67.0 71.9 80.2 88.1<br />
# Tested 14 18 10 12 14 10 88 112 94 89 91 101<br />
5 % Grade Level 88.9 60.0 72.2 80.0 88.9 84.6 77.3 70.0 76.1 82.2 83.1 90.1<br />
# Tested 18 15 18 10 9 13 97 86 113 90 83 91<br />
6 % Grade Level 61.5 81.0 30.8 80.0 90.0 100.0 75.0 81.0 71.6 78.6 81.3 88.2<br />
# Tested 13 16 13 20 10 8 88 96 88 117 91 85<br />
7 % Grade Level 60.0 60.0 88.2 84.6 0.0 90.0 75.9 86.0 79.6 82.6 85.0 83.5<br />
# Tested 5 10 17 13 18 10 87 84 103 86 113 97<br />
8 % Grade Level 90.9 100.0 90.9 93.3 91.7 100.0 89.9 92.0 94.3 88.7 95.2 91.9<br />
# Tested 11 3 11 15 12 17 89 84 87 97 83 111<br />
AMERICAN INDIAN<br />
GRAHAM COUNTY<br />
SYSTEM (All Students)<br />
Grade Participation 1998 1999 2000 2001 2002 2003 1998 1999 2000 2001 2002 2003<br />
3 % Grade Level 76.5 77.0 58.3 66.7 66.7 100.0 75.0 74.0 71.6 63.9 78.6 91.9<br />
# Tested 17 9 12 15 12 9 116 86 88 97 103 86<br />
4 % Grade Level 50.0 88.0 90.0 91.7 85.7 100.0 65.9 88.0 86.2 87.6 87.9 95.0<br />
# Tested 14 18 10 12 14 10 88 112 94 89 91 101<br />
5 % Grade Level 94.4 73.0 94.4 100.0 88.9 100.0 87.6 87.0 90.3 91.1 91.6 92.3<br />
# Tested 18 15 18 10 9 13 97 86 113 90 83 91<br />
6 % Grade Level 92.3 93.0 69.2 95.0 90.0 100.0 95.0 97.0 90.9 91.5 90.1 94.1<br />
# Tested 13 16 13 20 10 8 5 96 88 117 91 85<br />
7 % Grade Level 60.0 90.0 100.0 84.6 100.0 100.0 88.5 94.0 95.1 93.0 95.6 91.8<br />
# Tested 5 10 17 13 18 10 87 84 103 86 113 97<br />
8 % Grade Level 100.0 100.0 90.9 93.3 75.0 100.0 91.0 92.0 94.3 88.7 95.2 97.3<br />
# Tested 11 3 11 15 12 17 89 84 87 97 83 110<br />
EOC High School Subjects, Percent <strong>of</strong> Students At/Above Grade Level<br />
AMERICAN INDIAN<br />
SYSTEM (All Students)<br />
Course Participation 1998 1999 2000 2001 2002 2003 1998 1999 2000 2001 2002 2003<br />
Algebra I % Grade Level 100.0 80.0 100.0 90.0 100.0 83.3 89.7 85.4 84.6 82.3 93.4 83.1<br />
# Tested 10 10 2 10 14 6 78 82 78 79 76 83<br />
Biology % Grade Level 77.8 87.5 37.5 50.0 88.9 60.0 73.7 78.3 63.9 78.3 84.0 56.8<br />
# Tested 9 8 8 2 9 10 99 83 61 60 94 44<br />
ELP % Grade Level 100.0 87.5 70.0 100.0 81.8 80.0 94.3 83.3 73.5 85.9 79.6 77.0<br />
# Tested 5 8 10 4 11 10 35 72 68 64 93 74<br />
English I % Grade Level 85.7 75.0 50.0 70.0 69.2 75.0 90.0 76.1 86.7 81.0 75.6 86.0<br />
# Tested 7 12 4 10 13 8 60 92 90 79 90 86<br />
US History % Grade Level — 50.0 55.6 44.4 0.0 100.0 63.2 57.0 66.2 58.8 64.3 61.1<br />
# Tested 3 8 9 9 1 5 68 86 71 51 84 54<br />
Algebra Il % Grade Level — 75.0 100.0 75.0 100.0 66.7 — 58.3 84.9 85.7 82.5 90.7<br />
# Tested — 4 5 4 5 6 — 24 53 56 40 54<br />
Physics % Grade Level — 100.0 — — — — — 100.0 62.5 — 100.0 —<br />
# Tested — 1 — — — — — 3 8 — 2 —<br />
Chemistry % Grade Level — 25.0 40.0 33.3 — 60.0 — 8.6 54.5 54.5 85.7 51.3<br />
# Tested — 4 5 3 — 5 — 58 33 11 14 39<br />
Geometry % Grade Level — 40.0 50.0 100.0 85.7 77.8 — 68.4 76.3 75.0 78.5 82.1<br />
# Tested — 5 4 3 7 9 — 57 38 52 65 56<br />
Phys.Science % Grade Level — 20.0 100.0 28.6 66.7 50.0 — 45.7 76.7 66.1 78.2 58.6<br />
# Tested — 5 5 7 3 4 — 46 43 59 55 58<br />
Source: <strong>Public</strong> <strong>Schools</strong> <strong>of</strong> <strong>North</strong> <strong>Carolina</strong>, Division <strong>of</strong> Accountability and Technology Services, 2002-03<br />
58
GUILFORD COUNTY<br />
Trend <strong>of</strong> American Indian Students At/Above Grade Level<br />
in EOG Reading, Grades 3-8<br />
100<br />
90<br />
80<br />
Percent <strong>of</strong> Students (%)<br />
70<br />
60<br />
50<br />
40<br />
30<br />
NC State<br />
NC American<br />
Indian<br />
LEA<br />
LEA American<br />
Indian<br />
20<br />
10<br />
0<br />
92-93 93-94 94-95 95-96 96-97 97-98 98-99 99-00 00-01 01-02 02-03<br />
Trend <strong>of</strong> American Indian Students At/Above Grade Level<br />
in EOG Mathematics, Grades 3-8<br />
100<br />
90<br />
80<br />
Percent <strong>of</strong> Students (%)<br />
70<br />
60<br />
50<br />
40<br />
30<br />
20<br />
NC State<br />
NC American<br />
Indian<br />
LEA<br />
LEA American<br />
Indian<br />
10<br />
0<br />
92-93 93-94 94-95 95-96 96-97 97-98 98-99 99-00 00-01 01-02 02-03<br />
59
EOG Reading, Percent <strong>of</strong> Students At/Above Grade Level<br />
AMERICAN INDIAN<br />
EOG Mathematics, Percent <strong>of</strong> Students At/Above Grade Level<br />
EOC High School Subjects, Percent <strong>of</strong> Students At/Above Grade Level<br />
SYSTEM (All Students)<br />
Grade Participation 1998 1999 2000 2001 2002 2003 1998 1999 2000 2001 2002 2003<br />
3 % Grade Level 64.3 64.0 60.6 76.9 75.7 80.0 59.6 70.0 71.8 73.5 77.1 80.8<br />
# Tested 42 25 33 26 37 30 5034 4991 5106 5027 4927 4922<br />
4 % Grade Level 85.7 64.0 64.3 71.9 73.0 87.5 71.1 68.0 70.4 71.8 74.0 82.1<br />
# Tested 21 42 28 32 37 40 4654 4950 5021 4944 4944 4952<br />
5 % Grade Level 60.0 77.0 73.2 87.5 96.2 86.5 75.1 75.0 77.5 81.5 83.2 88.0<br />
# Tested 25 27 41 24 26 37 4522 4672 4928 4913 4865 5030<br />
6 % Grade Level 70.4 60.0 69.6 62.2 63.3 81.3 72.3 72.0 70.0 69.7 72.1 80.6<br />
# Tested 27 30 23 45 30 32 4503 4559 4780 4969 4970 4966<br />
7 % Grade Level 61.3 71.0 53.1 76.2 80.0 76.5 73.7 77.0 74.7 74.2 73.6 84.2<br />
# Tested 31 28 32 21 35 34 4450 4556 4656 4803 4895 5066<br />
8 % Grade Level 52.2 66.0 87.1 73.3 77.8 82.5 80.4 80.0 83.3 81.5 84.7 88.3<br />
# Tested 232 42 31 30 27 40 4147 4428 4546 4670 4722 4796<br />
AMERICAN INDIAN<br />
GUILFORD COUNTY<br />
SYSTEM (All Students)<br />
Grade Participation 1998 1999 2000 2001 2002 2003 1998 1999 2000 2001 2002 2003<br />
3 % Grade Level 61.9 56.0 54.5 65.4 78.9 83.3 66.0 66.0 68.2 69.9 74.8 87.5<br />
# Tested 42 25 33 26 38 30 5034 5007 5114 5039 4941 4935<br />
4 % Grade Level 100.0 81.0 79.3 87.9 86.5 87.5 78.3 78.0 82.8 85.1 87.9 94.2<br />
# Tested 21 42 29 33 37 40 4654 4961 5036 4975 4971 4964<br />
5 % Grade Level 44.0 85.0 80.5 83.3 100.0 86.5 76.5 80.0 79.9 87.1 87.8 92.7<br />
# Tested 25 27 41 24 26 37 4522 4693 4941 4927 4892 5039<br />
6 % Grade Level 75.0 66.0 78.3 68.9 76.7 90.6 76.6 77.0 79.9 78.9 84.1 89.1<br />
# Tested 27 30 23 45 30 32 4503 4558 4789 4968 4976 4973<br />
7 % Grade Level 70.0 78.0 65.6 81.0 83.3 76.5 74.6 80.0 75.9 77.8 79.9 81.5<br />
# Tested 31 28 32 21 36 34 4450 4565 4662 4800 4896 5069<br />
8 % Grade Level 40.9 59.0 70.0 63.3 81.5 80.0 73.0 74.0 77.6 75.5 80.9 82.0<br />
# Tested 23 39 30 30 27 40 4147 4430 4540 4659 4723 4809<br />
AMERICAN INDIAN<br />
SYSTEM (All Students)<br />
Course Participation 1998 1999 2000 2001 2002 2003 1998 1999 2000 2001 2002 2003<br />
Algebra I % Grade Level 53.8 42.1 48.5 60.7 64.3 57.1 56.9 56.5 64.3 66.5 69.3 67.5<br />
# Tested 13 19 33 28 42 56 3953 4573 4877 4941 5798 8196<br />
Biology % Grade Level 41.7 57.1 58.8 52.0 55.0 44.8 62.4 58.1 65.2 62.5 68.8 59.7<br />
# Tested 12 14 17 25 20 29 3518 3659 3864 5047 3922 4511<br />
ELP % Grade Level 50.0 45.0 73.7 66.7 73.9 50.0 73.0 73.3 72.8 70.7 69.1 69.4<br />
# Tested 10 20 19 30 23 20 3345 3519 3922 4791 5047 4487<br />
English I % Grade Level 55.6 41.2 57.6 74.3 66.7 82.1 63.4 65.7 69.4 68.7 65.2 80.1<br />
# Tested 9 17 33 35 30 28 3961 4232 4559 4748 4999 5042<br />
US History % Grade Level 35.7 23.5 23.1 61.5 57.9 46.2 59.9 57.9 50.3 55.1 50.2 57.2<br />
# Tested 14 17 13 13 19 26 3068 3387 3366 3575 4096 4248<br />
Algebra Il % Grade Level — 40.0 62.5 71.4 72.2 70.0 — 60.1 63.7 70.1 72.2 73.3<br />
# Tested — 5 8 7 18 20 — 2696 2774 3042 3935 4015<br />
Physics % Grade Level — 50.0 100.0 100.0 100.0 100.0 — 71.8 75.7 75.1 87.2 87.0<br />
# Tested — 4 2 1 3 3 — 653 638 539 603 621<br />
Chemistry % Grade Level — 40.0 66.7 75.0 58.3 66.7 — 60.0 63.5 69.8 70.5 75.4<br />
# Tested — 5 3 8 12 6 — 2200 2195 2504 2857 2021<br />
Geometry % Grade Level — 55.6 70.0 47.4 66.7 54.5 — 59.7 61.4 64.3 61.2 59.3<br />
# Tested — 9 10 19 18 22 — 3059 3488 3667 3998 4539<br />
Phys.Science % Grade Level — 50.0 53.1 85.7 54.5 62.5 — 56.9 55.1 61.7 63.8 60.3<br />
# Tested — 12 32 14 22 16 — 3706 3933 1699 2217 2771<br />
Source: <strong>Public</strong> <strong>Schools</strong> <strong>of</strong> <strong>North</strong> <strong>Carolina</strong>, Division <strong>of</strong> Accountability and Technology Services, 2002-03<br />
60
HALIFAX COUNTY<br />
Trend <strong>of</strong> American Indian Students At/Above Grade Level<br />
in EOG Reading, Grades 3-8<br />
100<br />
90<br />
80<br />
Percent <strong>of</strong> Students (%)<br />
70<br />
60<br />
50<br />
40<br />
30<br />
NC State<br />
NC American<br />
Indian<br />
LEA<br />
LEA American<br />
Indian<br />
20<br />
10<br />
0<br />
92-93 93-94 94-95 95-96 96-97 97-98 98-99 99-00 00-01 01-02 02-03<br />
Trend <strong>of</strong> American Indian Students At/Above Grade Level<br />
in EOG Mathematics, Grades 3-8<br />
100<br />
90<br />
80<br />
Percent <strong>of</strong> Students (%)<br />
70<br />
60<br />
50<br />
40<br />
30<br />
20<br />
NC State<br />
NC American<br />
Indian<br />
LEA<br />
LEA American<br />
Indian<br />
10<br />
0<br />
92-93 93-94 94-95 95-96 96-97 97-98 98-99 99-00 00-01 01-02 02-03<br />
61
EOG Reading, Percent <strong>of</strong> Students At/Above Grade Level<br />
AMERICAN INDIAN<br />
EOG Mathematics, Percent <strong>of</strong> Students At/Above Grade Level<br />
SYSTEM (All Students)<br />
Grade Participation 1998 1999 2000 2001 2002 2003 1998 1999 2000 2001 2002 2003<br />
3 % Grade Level 68.3 95.0 77.8 93.8 84.0 73.9 66.0 75.0 67.6 63.5 71.9 75.6<br />
# Tested 41 24 36 16 25 23 500 451 490 419 430 430<br />
4 % Grade Level 76.9 69.0 79.2 77.4 88.9 72.4 66.5 68.0 68.8 62.7 75.0 76.6<br />
# Tested 26 36 24 31 18 29 475 465 446 445 384 445<br />
5 % Grade Level 73.5 72.0 77.4 68.8 85.7 90.5 70.2 79.0 75.5 78.2 77.0 81.3<br />
# Tested 34 25 31 16 28 21 420 458 436 422 435 418<br />
6 % Grade Level 63.0 71.0 81.0 70.0 70.6 80.8 53.1 69.0 58.7 58.9 63.5 67.6<br />
# Tested 27 31 21 30 17 26 401 404 453 418 403 466<br />
7 % Grade Level 63.0 67.0 66.7 75.0 75.9 87.5 46.6 59.0 61.2 60.9 62.0 71.1<br />
# Tested 27 28 30 20 29 16 476 399 410 440 411 450<br />
8 % Grade Level 40.0 68.0 83.3 75.0 90.0 81.8 54.2 55.0 61.4 66.4 74.6 75.5<br />
# Tested 25 25 24 28 20 33 459 454 404 402 421 437<br />
AMERICAN INDIAN<br />
HALIFAX COUNTY<br />
SYSTEM (All Students)<br />
Grade Participation 1998 1999 2000 2001 2002 2003 1998 1999 2000 2001 2002 2003<br />
3 % Grade Level 61.0 70.0 83.3 87.5 78.6 82.6 59.5 70.0 61.8 52.7 68.2 81.7<br />
# Tested 41 24 36 16 28 23 500 459 497 427 450 432<br />
4 % Grade Level 92.6 91.0 100.0 90.6 94.4 93.3 85.6 86.0 83.0 82.2 87.5 91.3<br />
# Tested 26 36 24 32 18 30 475 479 459 465 393 458<br />
5 % Grade Level 82.4 80.0 74.2 93.8 79.3 95.2 78.4 88.0 81.5 85.6 80.8 86.8<br />
# Tested 34 26 31 16 29 21 410 467 453 430 449 423<br />
6 % Grade Level 81.5 80.0 90.9 82.8 94.1 92.3 75.4 79.0 76.4 74.6 82.6 80.0<br />
# Tested 27 31 22 29 17 26 401 412 461 426 414 464<br />
7 % Grade Level 77.8 82.0 73.3 90.0 75.9 81.3 70.6 77.0 72.9 66.2 71.2 70.5<br />
# Tested 27 28 30 20 29 16 476 404 410 450 420 451<br />
8 % Grade Level 52.0 76.0 87.5 62.1 85.0 72.7 64.4 66.0 72.7 70.3 68.7 71.6<br />
# Tested 25 25 24 29 20 33 459 455 406 401 434 440<br />
EOC High School Subjects, Percent <strong>of</strong> Students At/Above Grade Level<br />
AMERICAN INDIAN<br />
SYSTEM (All Students)<br />
Course Participation 1998 1999 2000 2001 2002 2003 1998 1999 2000 2001 2002 2003<br />
Algebra I % Grade Level 52.6 58.6 54.1 60.0 50.0 62.5 32.3 43.4 32.1 47.2 47.5 51.3<br />
# Tested 19 29 37 20 24 32 458 484 521 390 488 485<br />
Biology % Grade Level 57.9 56.5 43.8 60.0 66.7 43.8 28.4 32.5 23.9 22.8 39.5 22.7<br />
# Tested 19 23 16 20 18 16 348 418 380 429 304 264<br />
ELP % Grade Level 60.0 90.9 52.6 54.8 58.8 85.7 26.9 48.9 44.7 38.2 38.9 53.3<br />
# Tested 5 22 19 31 17 21 201 468 349 448 416 212<br />
English I % Grade Level 27.0 29.6 54.2 54.5 42.3 71.4 28.3 28.9 33.5 39.7 39.7 65.0<br />
# Tested 37 27 24 22 26 28 481 492 526 408 431 474<br />
US History % Grade Level 5.6 9.5 12.5 13.3 31.6 26.1 15.5 15.7 6.4 12.8 14.1 16.9<br />
# Tested 18 21 24 15 19 23 354 343 357 328 398 320<br />
Algebra Il % Grade Level — 15.4 16.7 18.8 66.7 40.0 — 8.2 19.1 32.6 45.2 45.0<br />
# Tested — 13 12 16 18 15 — 231 230 285 252 211<br />
Physics % Grade Level — 0.0 0.0 0.0 0.0 33.3 — 8.6 33.3 24.4 26.7 32.3<br />
# Tested — 2 3 2 3 3 — 35 27 41 30 62<br />
Chemistry % Grade Level — 10.0 7.1 0.0 50.0 80.0 — 8.3 12.0 17.2 28.4 42.9<br />
# Tested — 10 14 8 12 10 — 206 175 163 204 154<br />
Geometry % Grade Level — 7.1 14.3 31.8 13.3 40.9 — 5.8 7.6 16.8 17.7 23.3<br />
# Tested — 14 21 22 15 22 — 293 380 315 254 322<br />
Phys.Science % Grade Level — 19.0 26.7 58.3 55.6 41.4 — 13.1 15.7 35.3 41.5 34.5<br />
# Tested — 21 30 12 18 29 — 381 491 255 337 359<br />
Source: <strong>Public</strong> <strong>Schools</strong> <strong>of</strong> <strong>North</strong> <strong>Carolina</strong>, Division <strong>of</strong> Accountability and Technology Services, 2002-03<br />
62
HERTFORD COUNTY<br />
Trend <strong>of</strong> American Indian Students At/Above Grade Level<br />
in EOG Reading, Grades 3-8<br />
100<br />
90<br />
80<br />
Percent <strong>of</strong> Students (%)<br />
70<br />
60<br />
50<br />
40<br />
30<br />
NC State<br />
NC American<br />
Indian<br />
LEA<br />
LEA American<br />
Indian<br />
20<br />
10<br />
0<br />
92-93 93-94 94-95 95-96 96-97 97-98 98-99 99-00 00-01 01-02 02-03<br />
Trend <strong>of</strong> American Indian Students At/Above Grade Level<br />
in EOG Mathematics, Grades 3-8<br />
100<br />
90<br />
80<br />
Percent <strong>of</strong> Students (%)<br />
70<br />
60<br />
50<br />
40<br />
30<br />
20<br />
NC State<br />
NC American<br />
Indian<br />
LEA<br />
LEA American<br />
Indian<br />
10<br />
0<br />
92-93 93-94 94-95 95-96 96-97 97-98 98-99 99-00 00-01 01-02 02-03<br />
63
EOG Reading, Percent <strong>of</strong> Students At/Above Grade Level<br />
AMERICAN INDIAN<br />
EOG Mathematics, Percent <strong>of</strong> Students At/Above Grade Level<br />
SYSTEM (All Students)<br />
Grade Participation 1998 1999 2000 2001 2002 2003 1998 1999 2000 2001 2002 2003<br />
3 % Grade Level 100.0 100.0 62.5 0.0 50.0 80.0 53.8 53.0 58.6 56.5 63.8 71.3<br />
# Tested 2 2 8 1 4 5 301 307 331 306 279 272<br />
4 % Grade Level 50.0 100.0 0.0 83.3 0.0 100.0 50.8 51.0 53.0 57.5 51.5 72.2<br />
# Tested 2 2 1 6 1 3 303 285 300 320 262 259<br />
5 % Grade Level 75.0 0.0 100.0 0.0 85.7 0.0 52.7 55.0 61.9 63.2 67.5 75.4<br />
# Tested 4 1 1 1 7 1 294 288 291 299 317 280<br />
6 % Grade Level 25.0 25.0 33.3 0.0 0.0 83.3 45.4 45.0 49.0 54.6 51.3 64.2<br />
# Tested 4 4 3 2 1 6 313 290 298 273 277 307<br />
7 % Grade Level 100.0 50.0 50.0 50.0 0.0 100.0 46.6 55.0 54.3 58.3 55.9 69.4<br />
# Tested 1 4 6 4 2 1 343 313 282 300 261 281<br />
8 % Grade Level 0.0 100.0 83.3 57.1 75.0 100.0 63.5 66.0 68.7 67.3 66.0 78.0<br />
# Tested 1 1 6 7 4 2 307 333 313 269 288 259<br />
AMERICAN INDIAN<br />
HERTFORD COUNTY<br />
SYSTEM (All Students)<br />
Grade Participation 1998 1999 2000 2001 2002 2003 1998 1999 2000 2001 2002 2003<br />
3 % Grade Level 50.0 100.0 62.5 100.0 50.0 80.0 46.8 48.0 55.8 46.4 59.9 83.0<br />
# Tested 2 2 8 1 4 5 301 307 335 306 287 282<br />
4 % Grade Level 66.7 50.0 100.0 83.3 100.0 66.7 63.8 64.0 73.5 77.9 80.7 88.2<br />
# Tested 2 2 1 6 1 3 303 285 302 321 264 271<br />
5 % Grade Level 75.0 50.0 100.0 100.0 100.0 100.0 56.4 63.0 65.1 70.2 79.5 86.9<br />
# Tested 4 2 1 1 7 1 294 291 292 299 317 283<br />
6 % Grade Level 50.0 75.0 66.7 100.0 100.0 66.7 41.7 64.0 69.8 71.5 69.7 79.5<br />
# Tested 4 4 3 2 1 6 313 291 298 274 277 307<br />
7 % Grade Level 0.0 50.0 66.7 75.0 100.0 100.0 50.3 63.0 65.4 65.3 71.0 67.6<br />
# Tested 1 4 6 4 2 1 343 313 283 300 259 281<br />
8 % Grade Level 100.0 100.0 66.7 57.1 80.0 100.0 46.6 61.0 62.5 69.9 65.7 70.0<br />
# Tested 1 1 6 7 5 2 307 335 312 269 289 260<br />
EOC High School Subjects, Percent <strong>of</strong> Students At/Above Grade Level<br />
AMERICAN INDIAN<br />
SYSTEM (All Students)<br />
Course Participation 1998 1999 2000 2001 2002 2003 1998 1999 2000 2001 2002 2003<br />
Algebra I % Grade Level — 100.0 100.0 40.0 25.0 33.3 22.7 22.1 39.2 27.2 53.4 51.5<br />
# Tested 2 1 3 5 4 3 309 321 347 445 223 357<br />
Biology % Grade Level 33.3 — 0.0 0.0 100.0 33.3 15.9 31.3 26.6 22.4 35.6 32.6<br />
# Tested 6 — 1 1 3 3 523 262 222 281 289 233<br />
ELP % Grade Level — 100.0 33.3 100.0 40.0 50.0 65.4 58.6 59.4 64.9 50.5 43.8<br />
# Tested 3 3 3 2 5 6 243 220 234 222 493 464<br />
English I % Grade Level — 0.0 100.0 40.0 33.3 25.0 44.8 37.1 38.5 41.9 44.2 60.9<br />
# Tested 0 1 1 5 6 4 279 369 379 327 310 299<br />
US History % Grade Level — 33.3 — 0.0 0.0 100.0 14.4 18.3 21.9 17.0 18.8 26.5<br />
# Tested 2 3 — 4 1 3 250 290 260 264 261 226<br />
Algebra Il % Grade Level — 0.0 — 0.0 100.0 50.0 — 8.4 41.1 30.2 52.4 66.1<br />
# Tested — 4 — 5 3 4 — 226 192 192 206 186<br />
Physics % Grade Level — — — — — — — 37.5 16.7 — 17.3 —<br />
# Tested — — — — — — — 8 6 — 139 —<br />
Chemistry % Grade Level — 0.0 — 0.0 — 100.0 — 22.1 31.4 21.2 29.3 53.2<br />
# Tested — 3 — 4 — 3 — 181 159 104 229 79<br />
Geometry % Grade Level — — 0.0 0.0 50.0 33.3 — 14.4 15.6 20.4 24.5 47.4<br />
# Tested — — 1 3 4 3 — 229 250 250 322 156<br />
Phys.Science % Grade Level — 25.0 0.0 66.7 28.6 100.0 — 27.2 24.9 20.5 — 92.7<br />
# Tested — 4 1 6 7 1 — 401 458 381 — 55<br />
Source: <strong>Public</strong> <strong>Schools</strong> <strong>of</strong> <strong>North</strong> <strong>Carolina</strong>, Division <strong>of</strong> Accountability and Technology Services, 2002-03<br />
64
HOKE COUNTY<br />
Trend <strong>of</strong> American Indian Students At/Above Grade Level<br />
in EOG Reading, Grades 3-8<br />
100<br />
90<br />
80<br />
Percent <strong>of</strong> Students (%)<br />
70<br />
60<br />
50<br />
40<br />
30<br />
NC State<br />
NC American<br />
Indian<br />
LEA<br />
LEA American<br />
Indian<br />
20<br />
10<br />
0<br />
92-93 93-94 94-95 95-96 96-97 97-98 98-99 99-00 00-01 01-02 02-03<br />
Trend <strong>of</strong> American Indian Students At/Above Grade Level<br />
in EOG Mathematics, Grades 3-8<br />
100<br />
90<br />
80<br />
Percent <strong>of</strong> Students (%)<br />
70<br />
60<br />
50<br />
40<br />
30<br />
20<br />
NC State<br />
NC American<br />
Indian<br />
LEA<br />
LEA American<br />
Indian<br />
10<br />
0<br />
92-93 93-94 94-95 95-96 96-97 97-98 98-99 99-00 00-01 01-02 02-03<br />
65
EOG Reading, Percent <strong>of</strong> Students At/Above Grade Level<br />
AMERICAN INDIAN<br />
EOG Mathematics, Percent <strong>of</strong> Students At/Above Grade Level<br />
SYSTEM (All Students)<br />
Grade Participation 1998 1999 2000 2001 2002 2003 1998 1999 2000 2001 2002 2003<br />
3 % Grade Level 54.0 59.0 52.9 64.0 47.3 57.1 60.4 66.0 65.7 65.4 66.3 74.8<br />
# Tested 63 83 51 86 55 84 5.2 543 487 520 480 523<br />
4 % Grade Level 49.1 49.0 59.0 46.6 57.0 60.4 59.7 60.0 61.6 60.2 59.1 72.1<br />
# Tested 55 57 78 58 86 53 439 489 528 490 506 477<br />
5 % Grade Level 58.7 63.0 58.2 60.2 54.4 75.6 70.2 67.0 71.4 69.7 75.9 80.5<br />
# Tested 46 57 55 83 57 86 420 435 476 531 498 517<br />
6 % Grade Level 47.9 62.0 45.8 48.3 45.3 52.6 59.1 69.0 61.1 58.9 61.0 70.2<br />
# Tested 71 53 59 58 86 57 425 444 442 472 533 476<br />
7 % Grade Level 38.3 56.0 61.8 59.0 49.1 62.0 59.8 65.0 67.5 65.9 64.9 77.2<br />
# Tested 47 74 55 61 55 79 433 436 452 449 456 514<br />
8 % Grade Level 55.4 53.0 66.2 68.6 79.7 75.5 68.5 68.0 71.2 73.5 77.9 82.7<br />
# Tested 56 41 68 51 59 53 422 399 413 434 429 445<br />
AMERICAN INDIAN<br />
HOKE COUNTY<br />
SYSTEM (All Students)<br />
Grade Participation 1998 1999 2000 2001 2002 2003 1998 1999 2000 2001 2002 2003<br />
3 % Grade Level 54.7 66.0 51.9 50.6 49.1 70.2 59.0 64.0 63.8 59.1 62.4 83.7<br />
# Tested 63 83 52 87 55 84 520 549 497 521 481 523<br />
4 % Grade Level 53.6 70.0 80.0 72.9 79.1 83.0 64.6 77.0 80.4 77.2 77.4 88.7<br />
# Tested 65 58 80 59 86 53 439 494 535 491 508 478<br />
5 % Grade Level 61.7 72.0 62.5 66.3 64.9 82.6 78.7 76.0 76.0 76.0 79.9 85.5<br />
# Tested 46 59 56 83 57 86 420 439 479 533 498 519<br />
6 % Grade Level 67.1 75.0 70.7 60.3 69.8 66.7 69.7 80.0 77.4 77.1 77.3 82.8<br />
# Tested 71 54 58 58 86 57 425 453 443 472 532 476<br />
7 % Grade Level 52.1 66.0 67.9 66.1 66.1 60.8 65.6 66.0 74.3 72.4 72.3 72.1<br />
# Tested 47 72 56 62 56 79 433 438 451 449 458 513<br />
8 % Grade Level 53.6 68.0 66.2 58.0 78.0 56.9 61.3 73.0 70.9 69.4 75.3 76.4<br />
# Tested 56 41 68 50 59 51 422 399 412 434 429 441<br />
EOC High School Subjects, Percent <strong>of</strong> Students At/Above Grade Level<br />
AMERICAN INDIAN<br />
SYSTEM (All Students)<br />
Course Participation 1998 1999 2000 2001 2002 2003 1998 1999 2000 2001 2002 2003<br />
Algebra I % Grade Level 37.2 36.7 50.8 46.3 58.0 65.5 46.9 45.8 52.2 58.7 68.8 72.5<br />
# Tested 43 49 59 54 69 58 392 498 513 395 455 506<br />
Biology % Grade Level 23.5 22.6 28.1 34.7 40.0 29.3 44.0 37.4 35.9 40.4 51.2 41.9<br />
# Tested 44 53 64 49 50 58 334 476 443 423 342 473<br />
ELP % Grade Level 62.0 61.5 50.0 38.6 49.4 51.1 65.8 60.9 60.6 53.8 61.0 58.2<br />
# Tested 5 26 30 57 85 47 263 256 254 613 597 426<br />
English I % Grade Level 27.7 47.1 36.5 58.0 51.7 64.4 47.7 54.7 52.7 58.0 61.9 75.4<br />
# Tested 65 68 52 69 60 59 480 475 442 445 478 427<br />
US History % Grade Level 41.7 27.5 14.3 18.4 10.3 37.0 43.8 32.2 29.1 23.8 29.0 39.8<br />
# Tested 24 40 35 38 29 46 265 332 316 319 303 309<br />
Algebra Il % Grade Level — 25.0 42.9 42.3 59.3 72.0 — 37.0 45.6 44.7 51.7 67.1<br />
# Tested — 24 21 26 27 25 — 230 250 275 269 243<br />
Physics % Grade Level — 0.0 100.0 0.0 33.3 — — 37.5 71.4 50.0 37.9 40.0<br />
# Tested — 2 1 1 3 — — 24 14 20 29 10<br />
Chemistry % Grade Level — 9.5 4.3 21.1 25.0 58.3 — 12.1 16.4 45.4 51.7 65.1<br />
# Tested — 21 23 19 4 24 — 215 280 185 87 186<br />
Geometry % Grade Level — 24.2 15.9 31.9 42.9 42.2 — 33.8 26.1 31.2 40.3 43.2<br />
# Tested — 33 44 47 42 45 — 337 440 407 372 377<br />
Phys.Science % Grade Level — 0.0 0.0 17.4 16.7 23.5 — 26.7 39.1 25.0 42.9 31.7<br />
# Tested — 5 7 23 24 17 — 30 69 168 170 123<br />
Source: <strong>Public</strong> <strong>Schools</strong> <strong>of</strong> <strong>North</strong> <strong>Carolina</strong>, Division <strong>of</strong> Accountability and Technology Services, 2002-03<br />
66
JACKSON COUNTY<br />
Trend <strong>of</strong> American Indian Students At/Above Grade Level<br />
in EOG Reading, Grades 3-8<br />
100<br />
90<br />
80<br />
Percent <strong>of</strong> Students (%)<br />
70<br />
60<br />
50<br />
40<br />
30<br />
NC State<br />
NC American<br />
Indian<br />
LEA<br />
LEA American<br />
Indian<br />
20<br />
10<br />
0<br />
92-93 93-94 94-95 95-96 96-97 97-98 98-99 99-00 00-01 01-02 02-03<br />
Trend <strong>of</strong> American Indian Students At/Above Grade Level<br />
in EOG Mathematics, Grades 3-8<br />
100<br />
90<br />
80<br />
Percent <strong>of</strong> Students (%)<br />
70<br />
60<br />
50<br />
40<br />
30<br />
20<br />
NC State<br />
NC American<br />
Indian<br />
LEA<br />
LEA American<br />
Indian<br />
10<br />
0<br />
92-93 93-94 94-95 95-96 96-97 97-98 98-99 99-00 00-01 01-02 02-03<br />
67
EOG Reading, Percent <strong>of</strong> Students At/Above Grade Level<br />
AMERICAN INDIAN<br />
EOG Mathematics, Percent <strong>of</strong> Students At/Above Grade Level<br />
SYSTEM (All Students)<br />
Grade Participation 1998 1999 2000 2001 2002 2003 1998 1999 2000 2001 2002 2003<br />
3 % Grade Level 64.5 60.0 59.4 62.5 90.6 81.1 76.2 74.0 73.5 69.7 84.1 272.0<br />
# Tested 31 25 32 32 32 37 261 290 294 264 251 72.2<br />
4 % Grade Level 57.1 67.0 44.0 55.9 34.2 78.8 74.3 72.0 73.4 74.2 70.0 80.8<br />
# Tested 14 28 25 34 38 33 237 262 304 279 270 260<br />
5 % Grade Level 91.7 80.0 74.2 74.1 73.5 78.6 76.9 79.0 75.3 77.1 82.0 80.6<br />
# Tested 24 15 31 27 34 42 277 235 291 292 289 258<br />
6 % Grade Level 72.0 84.0 68.8 66.7 70.4 75.9 81.4 80.0 76.5 74.3 73.9 84.6<br />
# Tested 25 26 16 27 27 29 258 275 247 272 303 280<br />
7 % Grade Level 61.1 85.0 82.8 78.9 61.5 73.1 75.1 85.0 79.6 82.4 76.5 79.1<br />
# Tested 18 27 29 19 26 26 257 280 294 250 281 278<br />
8 % Grade Level 67.6 71.0 85.2 87.5 88.0 77.3 85.5 79.0 87.1 85.2 92.4 86.5<br />
# Tested 34 21 27 32 25 22 282 278 286 298 249 310<br />
AMERICAN INDIAN<br />
JACKSON COUNTY<br />
SYSTEM (All Students)<br />
Grade Participation 1998 1999 2000 2001 2002 2003 1998 1999 2000 2001 2002 2003<br />
3 % Grade Level 74.2 72.0 84.4 78.1 78.1 75.7 73.2 74.0 77.2 78.8 80.7 260.0<br />
# Tested 31 25 32 32 32 37 261 290 294 264 254 87.6<br />
4 % Grade Level 78.6 78.0 72.0 77.1 71.1 87.9 82.3 89.0 90.2 86.2 84.5 258.0<br />
# Tested 14 28 25 35 38 33 237 262 305 283 271 91.8<br />
5 % Grade Level 87.5 86.0 80.6 63.0 80.0 88.1 75.9 85.0 84.9 80.7 83.4 280.0<br />
# Tested 24 15 31 27 35 42 277 235 291 295 290 89.6<br />
6 % Grade Level 88.0 96.0 81.3 82.1 66.7 83.3 89.5 85.0 91.5 87.9 86.0 279.0<br />
# Tested 25 26 16 28 27 30 258 276 248 272 308 81<br />
7 % Grade Level 77.8 88.0 89.7 95.0 74.1 69.2 83.3 91.0 85.8 86.1 86.3 310.0<br />
# Tested 18 27 29 20 27 26 257 279 295 251 284 87.5<br />
8 % Grade Level 100.0 71.0 81.5 87.5 80.8 86.4 80.7 80.0 89.1 85.2 87.3 287.0<br />
# Tested 2 21 27 32 26 22 410 278 285 297 251 —<br />
EOC High School Subjects, Percent <strong>of</strong> Students At/Above Grade Level<br />
AMERICAN INDIAN<br />
SYSTEM (All Students)<br />
Course Participation 1998 1999 2000 2001 2002 2003 1998 1999 2000 2001 2002 2003<br />
Algebra I % Grade Level 50.0 61.9 71.4 85.0 70.0 77.8 64.2 76.6 77.3 80.9 78.3 80.9<br />
# Tested 16 21 14 20 30 18 243 274 273 272 290 246<br />
Biology % Grade Level 33.3 50.0 39.1 57.9 55.6 65.4 58.4 66.0 65.7 77.7 78.1 65.6<br />
# Tested 12 12 23 19 18 26 259 209 248 260 247 279<br />
ELP % Grade Level 47.1 40.0 31.8 33.3 54.5 43.5 71.2 65.0 69.6 66.9 62.2 64.3<br />
# Tested 17 30 22 27 33 23 347 329 299 302 323 269<br />
English I % Grade Level 40.9 47.1 46.2 44.4 66.7 73.9 64.6 68.8 76.9 72.3 73.2 83.5<br />
# Tested 22 34 26 27 33 23 305 295 294 285 299 266<br />
US History % Grade Level 38.9 33.3 22.2 31.6 61.1 33.3 41.9 47.0 53.1 62.1 60.2 56.2<br />
# Tested 18 9 9 19 18 21 191 217 241 232 244 258<br />
Algebra Il % Grade Level — 22.2 0.0 70.0 40.0 57.1 — 58.9 52.8 66.0 78.4 78.2<br />
# Tested — 9 5 10 5 7 — 185 161 191 162 165<br />
Physics % Grade Level — — 100.0 0.0 — — — 63.2 91.3 66.7 85.7 90.9<br />
# Tested — — 1 1 — — — 19 23 9 21 11<br />
Chemistry % Grade Level — 66.7 66.7 16.7 50.0 100.0 — 72.1 57.9 66.1 75.4 89.8<br />
# Tested — 3 6 6 4 1 — 111 114 118 118 59<br />
Geometry % Grade Level — 22.2 33.3 66.7 66.7 68.8 — 54.9 61.7 65.4 66.3 66.0<br />
# Tested — 9 12 12 9 16 — 195 206 211 199 191<br />
Phys.Science % Grade Level — 37.5 36.7 33.3 50.0 0.0 — 62.3 63.9 57.7 54.1 62.1<br />
# Tested — 32 30 27 30 2 — 324 316 284 290 29<br />
Source: <strong>Public</strong> <strong>Schools</strong> <strong>of</strong> <strong>North</strong> <strong>Carolina</strong>, Division <strong>of</strong> Accountability and Technology Services, 2002-03<br />
68
PERSON COUNTY<br />
Trend <strong>of</strong> American Indian Students At/Above Grade Level<br />
in EOG Reading, Grades 3-8<br />
100<br />
90<br />
80<br />
Percent <strong>of</strong> Students (%)<br />
70<br />
60<br />
50<br />
40<br />
30<br />
NC State<br />
NC American<br />
Indian<br />
LEA<br />
LEA American<br />
Indian<br />
20<br />
10<br />
0<br />
92-93 93-94 94-95 95-96 96-97 97-98 98-99 99-00 00-01 01-02 02-03<br />
Trend <strong>of</strong> American Indian Students At/Above Grade Level<br />
in EOG Mathematics, Grades 3-8<br />
100<br />
90<br />
80<br />
Percent <strong>of</strong> Students (%)<br />
70<br />
60<br />
50<br />
40<br />
30<br />
20<br />
NC State<br />
NC American<br />
Indian<br />
LEA<br />
LEA American<br />
Indian<br />
10<br />
0<br />
92-93 93-94 94-95 95-96 96-97 97-98 98-99 99-00 00-01 01-02 02-03<br />
69
EOG Reading, Percent <strong>of</strong> Students At/Above Grade Level<br />
AMERICAN INDIAN<br />
EOG Mathematics, Percent <strong>of</strong> Students At/Above Grade Level<br />
SYSTEM (All Students)<br />
Grade Participation 1998 1999 2000 2001 2002 2003 1998 1999 2000 2001 2002 2003<br />
3 % Grade Level 50.0 66.0 — 100.0 0.0 100.0 68.9 74.0 — 77.6 85.5 84.2<br />
# Tested 4 3 — 2 2 2 488 510 492 459 491 411<br />
4 % Grade Level 100.0 0.0 50.0 100.0 0.0 66.7 70.9 74.0 75.6 73.2 78.8 87.7<br />
# Tested 5 3 2 1 2 3 416 469 488 437 433 473<br />
5 % Grade Level 66.7 100.0 100.0 100.0 — 100.0 75.7 84.0 85.6 86.5 87.9 91.3<br />
# Tested 3 4 1 2 — 1 453 433 457 465 445 427<br />
6 % Grade Level 100.0 66.0 100.0 100.0 66.7 — 70.4 68.0 68.8 73.2 75.8 80.7<br />
# Tested 3 3 3 3 3 — 436 472 464 451 479 462<br />
7 % Grade Level 100.0 100.0 66.7 100.0 0.0 100.0 73.3 80.0 74.3 76.8 79.6 89.8<br />
# Tested 1 3 3 3 1 4 405 427 471 462 476 499<br />
8 % Grade Level 100.0 100.0 100.0 100.0 0.0 50.0 81.0 85.0 81.3 87.4 87.3 88.5<br />
# Tested 2 1 2 2 3 2 410 393 401 452 448 470<br />
AMERICAN INDIAN<br />
PERSON COUNTY<br />
SYSTEM (All Students)<br />
Grade Participation 1998 1999 2000 2001 2002 2003 1998 1999 2000 2001 2002 2003<br />
3 % Grade Level 50.0 100.0 — 100.0 50.0 100.0 67.2 68.0 68.3 73.6 80.1 89.1<br />
# Tested 4 3 — 2 2 2 488 512 492 458 493 411<br />
4 % Grade Level 100.0 66.0 100.0 100.0 100.0 66.7 82.7 84.0 89.0 88.6 91.9 96.4<br />
# Tested 4 3 2 1 2 3 416 471 489 438 434 474<br />
5 % Grade Level 66.7 100.0 100.0 100.0 — 100.0 78.4 87.0 88.2 91.7 93.1 93.7<br />
# Tested 3 4 2 2 — 1 453 434 459 468 447 427<br />
6 % Grade Level 100.0 100.0 100.0 100.0 100.0 — 81.0 81.0 82.6 88.7 91.1 94.4<br />
# Tested 3 3 3 3 3 — 436 473 465 453 482 462<br />
7 % Grade Level 10.0 100.0 66.7 100.0 50.0 100.0 78.0 80.0 77.9 81.8 85.4 88.4<br />
# Tested 1 3 3 3 2 4 405 428 471 466 479 499<br />
8 % Grade Level 100.0 100.0 100.0 100.0 100.0 100.0 80.7 82.0 86.1 85.3 85.1 85.9<br />
# Tested 2 1 2 2 3 3 410 392 402 455 450 474<br />
EOC High School Subjects, Percent <strong>of</strong> Students At/Above Grade Level<br />
AMERICAN INDIAN<br />
SYSTEM (All Students)<br />
Course Participation 1998 1999 2000 2001 2002 2003 1998 1999 2000 2001 2002 2003<br />
Algebra I % Grade Level — 100.0 100.0 100.0 75.0 100.0 55.3 59.7 69.0 74.9 83.0 83.4<br />
# Tested 0 3 1 2 4 1 450 501 426 450 453 475<br />
Biology % Grade Level — 100.0 100.0 0.0 0.0 66.7 60.3 61.5 56.4 66.2 73.7 64.3<br />
# Tested 2 1 1 1 2 3 325 364 305 314 315 384<br />
ELP % Grade Level — — 75.0 — 50.0 100.0 62.3 66.7 64.0 72.3 73.9 68.6<br />
# Tested 1 — 4 — 2 2 443 21 392 368 364 414<br />
English I % Grade Level — 50.0 — 50.0 100.0 100.0 54.6 70.4 79.6 76.1 67.5 83.1<br />
# Tested 1 2 — 2 2 4 441 423 401 389 462 474<br />
US History % Grade Level — 100.0 100.0 75.0 — 0.0 42.3 39.9 34.9 41.4 47.1 46.8<br />
# Tested 3 1 1 4 — 2 343 321 358 348 342 312<br />
Algebra Il % Grade Level — 100.0 — 100.0 — 0.0 — 54.5 63.4 73.2 80.8 82.9<br />
# Tested — 1 — 2 — 1 — 200 227 246 240 234<br />
Physics % Grade Level — — — — — — 100.0 57.5 42.6 37.5 45.8 67.9<br />
# Tested — — — — — — 1 40 61 16 24 28<br />
Chemistry % Grade Level — 100.0 — 0.0 — 0.0 — 61.8 64.9 57.6 75.8 82.0<br />
# Tested — 1 — 1 — 1 — 144 148 203 161 178<br />
Geometry % Grade Level — — — — 50.0 33.3 66.7 57.5 65.6 60.4 68.3 60.5<br />
# Tested — — — — 2 3 3 299 311 326 287 349<br />
Phys.Science % Grade Level — 50.0 — 50.0 0.0 100.0 — 63.2 61.9 65.6 46.3 57.8<br />
# Tested — 2 — 2 1 1 — 250 344 250 328 296<br />
Source: <strong>Public</strong> <strong>Schools</strong> <strong>of</strong> <strong>North</strong> <strong>Carolina</strong>, Division <strong>of</strong> Accountability and Technology Services, 2002-03<br />
70
RICHMOND COUNTY<br />
Trend <strong>of</strong> American Indian Students At/Above Grade Level<br />
in EOG Reading, Grades 3-8<br />
100<br />
90<br />
80<br />
Percent <strong>of</strong> Students (%)<br />
70<br />
60<br />
50<br />
40<br />
30<br />
NC State<br />
NC American<br />
Indian<br />
LEA<br />
LEA American<br />
Indian<br />
20<br />
10<br />
0<br />
92-93 93-94 94-95 95-96 96-97 97-98 98-99 99-00 00-01 01-02 02-03<br />
Trend <strong>of</strong> American Indian Students At/Above Grade Level<br />
in EOG Mathematics, Grades 3-8<br />
100<br />
90<br />
80<br />
Percent <strong>of</strong> Students (%)<br />
70<br />
60<br />
50<br />
40<br />
30<br />
20<br />
NC State<br />
NC American<br />
Indian<br />
LEA<br />
LEA American<br />
Indian<br />
10<br />
0<br />
92-93 93-94 94-95 95-96 96-97 97-98 98-99 99-00 00-01 01-02 02-03<br />
71
EOG Reading, Percent <strong>of</strong> Students At/Above Grade Level<br />
AMERICAN INDIAN<br />
EOG Mathematics, Percent <strong>of</strong> Students At/Above Grade Level<br />
RICHMOND COUNTY<br />
SYSTEM (All Students)<br />
Grade Participation 1998 1999 2000 2001 2002 2003 1998 1999 2000 2001 2002 2003<br />
3 % Grade Level 57.1 57.0 60.0 61.1 61.5 63.6 72.3 77.0 67.4 64.6 74.3 80.7<br />
# Tested 7 7 15 18 13 22 669 648 654 697 646 685<br />
4 % Grade Level 81.8 88.0 22.2 38.9 56.3 76.9 61.7 64.0 62.8 57.0 59.1 69.1<br />
# Tested 11 9 9 18 16 13 601 659 646 670 658 645<br />
5 % Grade Level 81.8 66.0 77.8 50.0 55.6 63.2 73.6 70.0 69.7 70.9 71.4 80.4<br />
# Tested 11 12 9 10 18 19 557 591 644 645 678 649<br />
6 % Grade Level 45.4 100.0 77.8 75.0 55.6 63.2 74.1 79.0 71.6 63.6 70.0 74.6<br />
# Tested 11 9 9 8 9 19 564 555 592 693 647 670<br />
7 % Grade Level 50.0 28.0 75.0 45.5 60.0 44.4 67.7 76.0 74.0 69.9 65.2 82.3<br />
# Tested 4 7 12 11 10 9 643 578 600 607 702 689<br />
8 % Grade Level 58.3 100.0 77.8 92.3 83.3 66.7 77.4 80.0 82.4 78.1 78.1 83.4<br />
# Tested 12 2 9 13 12 9 552 606 535 599 608 633<br />
AMERICAN INDIAN<br />
SYSTEM (All Students)<br />
Grade Participation 1998 1999 2000 2001 2002 2003 1998 1999 2000 2001 2002 2003<br />
3 % Grade Level 57.1 42.0 53.3 50.0 84.6 81.8 69.5 71.0 65.0 58.3 74.1 85.5<br />
# Tested 7 7 15 18 13 22 669 649 654 698 644 685<br />
4 % Grade Level 63.6 66.0 40.0 66.7 75.0 85.7 78.3 78.0 79.7 73.3 75.8 87.3<br />
# Tested 11 9 10 18 16 14 601 662 649 666 658 647<br />
5 % Grade Level 90.0 83.0 66.7 40.0 72.2 84.2 78.3 80.0 73.8 78.3 76.3 84.2<br />
# Tested 11 12 9 10 18 19 557 591 646 645 674 651<br />
6 % Grade Level 72.7 100.0 77.8 87.5 55.6 84.2 83.9 87.0 82.6 77.0 83.1 85.4<br />
# Tested 11 9 9 8 9 19 564 554 591 691 646 669<br />
7 % Grade Level 50.0 100.0 83.3 63.6 80.0 44.4 73.9 84.0 80.4 74.6 73.8 79.6<br />
# Tested 4 7 12 11 10 9 643 576 601 607 698 692<br />
8 % Grade Level 66.7 100.0 66.7 69.2 75.0 66.7 73.5 80.0 80.4 72.7 75.7 81.0<br />
# Tested 12 2 9 13 12 9 552 605 536 600 604 631<br />
EOC High School Subjects, Percent <strong>of</strong> Students At/Above Grade Level<br />
AMERICAN INDIAN<br />
SYSTEM (All Students)<br />
Course Participation 1998 1999 2000 2001 2002 2003 1998 1999 2000 2001 2002 2003<br />
Algebra I % Grade Level 18.2 14.3 — 66.7 80.0 75.0 53.2 52.0 85.0 80.0 70.3 72.4<br />
# Tested 11 7 — 3 10 8 510 523 160 530 636 543<br />
Biology % Grade Level 57.1 28.6 42.9 33.3 80.0 71.4 47.0 44.2 40.3 58.0 57.6 48.8<br />
# Tested 14 7 7 3 5 7 541 582 556 538 495 482<br />
ELP % Grade Level 60.0 50.0 0.0 33.3 66.7 41.7 69.1 52.6 57.9 58.9 57.6 57.2<br />
# Tested 5 12 1 6 9 12 601 576 610 518 564 570<br />
English I % Grade Level — 45.5 0.0 33.3 66.7 91.7 62.8 60.3 68.2 70.3 70.2 85.3<br />
# Tested 4 11 1 6 9 12 581 585 623 516 524 545<br />
US History % Grade Level — 60.0 25.0 50.0 0.0 28.6 36.1 40.5 41.4 35.2 33.0 45.0<br />
# Tested 4 10 4 — 3 7 393 412 428 389 528 447<br />
Algebra Il % Grade Level — 40.0 0.0 — 50.0 66.7 — 33.5 44.6 70.7 81.9 77.2<br />
# Tested — 5 2 — 2 3 — 269 285 304 309 373<br />
Physics % Grade Level — 100.0 — — — — — 97.5 97.1 77.4 72.7 63.6<br />
# Tested — 1 — — — — — 40 34 31 11 22<br />
Chemistry % Grade Level — 100.0 100.0 66.7 — 0.0 — 75.4 82.2 62.9 78.0 59.9<br />
# Tested — 3 1 3 — 1 — 195 197 178 177 182<br />
Geometry % Grade Level — 0.0 0.0 40.0 33.3 87.5 — 37.6 35.4 47.8 52.1 55.6<br />
# Tested — 6 4 5 3 8 — 394 418 404 445 421<br />
Phys.Science % Grade Level — 30.0 100.0 0.0 — 66.7 — 53.2 57.0 38.8 64.6 60.3<br />
# Tested — — 1 2 — 6 — 457 449 98 113 194<br />
Source: <strong>Public</strong> <strong>Schools</strong> <strong>of</strong> <strong>North</strong> <strong>Carolina</strong>, Division <strong>of</strong> Accountability and Technology Services, 2002-03<br />
72
ROBESON COUNTY<br />
Trend <strong>of</strong> American Indian Students At/Above Grade Level<br />
in EOG Reading, Grades 3-8<br />
100<br />
90<br />
80<br />
Percent <strong>of</strong> Students (%)<br />
70<br />
60<br />
50<br />
40<br />
30<br />
NC State<br />
NC American<br />
Indian<br />
LEA<br />
LEA American<br />
Indian<br />
20<br />
10<br />
0<br />
92-93 93-94 94-95 95-96 96-97 97-98 98-99 99-00 00-01 01-02 02-03<br />
Trend <strong>of</strong> American Indian Students At/Above Grade Level<br />
in EOG Mathematics, Grades 3-8<br />
100<br />
90<br />
80<br />
Percent <strong>of</strong> Students (%)<br />
70<br />
60<br />
50<br />
40<br />
30<br />
20<br />
NC State<br />
NC American<br />
Indian<br />
LEA<br />
LEA American<br />
Indian<br />
10<br />
0<br />
92-93 93-94 94-95 95-96 96-97 97-98 98-99 99-00 00-01 01-02 02-03<br />
73
EOG Reading, Percent <strong>of</strong> Students At/Above Grade Level<br />
AMERICAN INDIAN<br />
EOG Mathematics, Percent <strong>of</strong> Students At/Above Grade Level<br />
SYSTEM (All Students)<br />
Grade Participation 1998 1999 2000 2001 2002 2003 1998 1999 2000 2001 2002 2003<br />
3 % Grade Level 51.7 60.0 61.8 66.6 70.5 76.3 54.8 63.0 65.2 70.4 71.6 74.9<br />
# Tested 750 804 844 815 792 802 1823 1849 1894 1877 1813 1879<br />
4 % Grade Level 44.8 55.0 57.9 58.2 67.2 76.6 51.5 56.0 61.2 61.5 66.6 76.6<br />
# Tested 712 713 767 787 755 765 1713 1751 1768 1799 1794 1742<br />
5 % Grade Level 54.1 51.0 58.4 67.9 65.7 76.1 56.1 54.0 59.4 68.1 67.4 76.4<br />
# Tested 798 715 700 747 794 825 1774 1741 1725 1734 1811 1917<br />
6 % Grade Level 51.8 52.0 47.0 54.8 59.2 70.3 54.8 55.0 51.5 54.5 59.8 71.3<br />
# Tested 706 771 692 631 699 781 1656 1735 1708 1632 1653 1790<br />
7 % Grade Level 52.4 59.0 54.4 56.2 61.7 81.5 55.6 61.0 57.7 58.5 59.8 77.8<br />
# Tested 710 670 776 678 629 717 1581 1608 1736 1595 1632 1724<br />
8 % Grade Level 629.0 64.0 71.3 71.4 71.0 78.6 66.1 64.0 69.1 70.0 74.8 77.5<br />
# Tested 739 705 675 751 655 655 1709 1626 1611 1672 1566 1697<br />
AMERICAN INDIAN<br />
ROBESON COUNTY<br />
SYSTEM (All Students)<br />
Grade Participation 1998 1999 2000 2001 2002 2003 1998 1999 2000 2001 2002 2003<br />
3 % Grade Level 51.4 60.0 61.2 67.2 66.5 84.9 52.6 63.0 63.1 68.9 66.9 82.3<br />
# Tested 750 815 858 823 814 821 1823 1866 1912 1896 1857 1917<br />
4 % Grade Level 63.2 75.0 78.7 77.5 82.8 92.5 65.5 75.0 79.0 79.6 81.5 90.4<br />
# Tested 712 722 775 821 774 773 1713 1773 1787 1848 1840 1758<br />
5 % Grade Level 62.3 65.0 66.5 76.4 75.9 83.1 61.8 67.0 65.7 76.0 75.5 81.7<br />
# Tested 798 719 704 766 816 834 1774 1750 1737 1775 1854 1931<br />
6 % Grade Level 71.7 72.0 68.1 75.7 79.9 82.8 71.3 71.0 69.6 73.7 78.9 83.7<br />
# Tested 706 778 698 646 716 797 1656 1757 1722 1673 1688 1818<br />
7 % Grade Level 71.1 77.0 70.5 70.3 75.9 82.5 71.6 76.0 69.4 72.0 74.2 77.8<br />
# Tested 710 671 784 683 643 724 1581 1615 1759 1607 1661 1738<br />
8 % Grade Level 69.9 68.0 72.6 74.3 75.2 81.2 70.8 67.0 70.9 73.2 75.2 77.3<br />
# Tested 739 709 676 755 657 664 1709 1636 1616 1677 1571 1718<br />
EOC High School Subjects, Percent <strong>of</strong> Students At/Above Grade Level<br />
AMERICAN INDIAN<br />
SYSTEM (All Students)<br />
Course Participation 1998 1999 2000 2001 2002 2003 1998 1999 2000 2001 2002 2003<br />
Algebra I % Grade Level 46.8 50.6 43.8 63.4 71.4 71.2 51.8 56.2 47.5 62.5 67.8 70.1<br />
# Tested 530 563 696 629 643 580 1322 1316 1591 1500 1582 1539<br />
Biology % Grade Level 46.8 41.8 29.5 39.1 55.6 43.4 51.8 43.7 35.7 43.1 53.1 46.1<br />
# Tested 530 462 613 507 487 558 1322 1108 1437 1280 1232 1405<br />
ELP % Grade Level 37.3 38.4 31.0 49.5 43.4 51.3 42.2 48.4 36.5 50.2 48.2 55.9<br />
# Tested 550 581 710 566 742 411 1250 1406 1643 1482 1722 938<br />
English I % Grade Level 41.1 42.1 43.1 41.7 44.3 60.8 47.1 46.5 45.5 43.9 48.9 65.6<br />
# Tested 628 788 785 741 817 722 1476 1814 1785 1766 1817 1713<br />
US History % Grade Level 31.3 20.9 19.8 28.2 29.7 38.9 39.5 25.9 23.5 34.8 38.8 44.5<br />
# Tested 754 98 479 483 434 493 1660 1183 1151 1215 1091 1132<br />
Algebra Il % Grade Level — 25.0 28.2 53.8 70.0 67.8 — 25.5 29.7 53.7 69.1 72.1<br />
# Tested — 324 287 318 283 301 — 813 824 750 727 748<br />
Physics % Grade Level — 15.7 16.7 41.9 64.5 55.9 — 31.4 35.9 43.1 66.3 64.1<br />
# Tested — 51 24 43 31 34 — 140 117 123 83 78<br />
Chemistry % Grade Level — 32.8 37.3 38.6 55.4 59.4 — 35.3 38.8 42.1 63.2 65.2<br />
# Tested — 290 201 241 195 192 — 688 613 608 465 485<br />
Geometry % Grade Level — 21.9 29.5 43.6 40.7 54.9 — 28.1 31.9 42.2 43.0 58.4<br />
# Tested — 375 386 383 381 357 — 971 928 944 928 870<br />
Phys.Science % Grade Level — 26.9 22.6 27.1 53.5 51.2 — 35.8 24.5 34.7 56.9 55.7<br />
# Tested — 547 704 133 243 283 — 1304 1731 251 378 637<br />
Source: <strong>Public</strong> <strong>Schools</strong> <strong>of</strong> <strong>North</strong> <strong>Carolina</strong>, Division <strong>of</strong> Accountability and Technology Services, 2002-03<br />
74
SAMPSON COUNTY<br />
Trend <strong>of</strong> American Indian Students At/Above Grade Level<br />
in EOG Reading, Grades 3-8<br />
100<br />
90<br />
80<br />
Percent <strong>of</strong> Students (%)<br />
70<br />
60<br />
50<br />
40<br />
30<br />
NC State<br />
NC American<br />
Indian<br />
LEA<br />
LEA American<br />
Indian<br />
20<br />
10<br />
0<br />
92-93 93-94 94-95 95-96 96-97 97-98 98-99 99-00 00-01 01-02 02-03<br />
Trend <strong>of</strong> American Indian Students At/Above Grade Level<br />
in EOG Mathematics, Grades 3-8<br />
100<br />
90<br />
80<br />
Percent <strong>of</strong> Students (%)<br />
70<br />
60<br />
50<br />
40<br />
30<br />
20<br />
NC State<br />
NC American<br />
Indian<br />
LEA<br />
LEA American<br />
Indian<br />
10<br />
0<br />
92-93 93-94 94-95 95-96 96-97 97-98 98-99 99-00 00-01 01-02 02-03<br />
75
EOG Reading, Percent <strong>of</strong> Students At/Above Grade Level<br />
AMERICAN INDIAN<br />
EOG Mathematics, Percent <strong>of</strong> Students At/Above Grade Level<br />
SYSTEM (All Students)<br />
Grade Participation 1998 1999 2000 2001 2002 2003 1998 1999 2000 2001 2002 2003<br />
3 % Grade Level 75.0 81.0 66.7 66.7 57.1 80.0 67.4 72.0 76.7 77.2 77.2 82.8<br />
# Tested 8 11 12 6 7 5 589 590 584 631 628 611<br />
4% Grade Level 83.3 60.0 66.7 72.7 71.4 37.5 72.1 67.0 68.0 73.8 79.4 79.9<br />
# Tested 6 10 12 11 7 8 567 592 581 602 603 621<br />
5% Grade Level 75.0 66.0 100.0 76.9 90.9 85.7 70.7 78.0 81.7 84.0 86.4 89.3<br />
# Tested 8 9 7 13 11 7 526 586 590 570 589 600<br />
6% Grade Level 42.9 75.0 60.0 62.5 80.0 80.0 67.1 69.0 67.7 66.8 71.5 85.6<br />
# Tested 7 8 10 8 10 10 532 527 606 591 579 599<br />
7% Grade Level 88.9 37.0 62.5 66.7 66.7 100.0 69.8 72.0 71.0 72.3 72.8 83.3<br />
# Tested 9 8 8 9 9 10 524 550 520 620 614 599<br />
8% Grade Level 50.0 77.0 88.9 0.0 80.0 100.0 73.0 77.0 77.4 82.5 86.2 85.6<br />
# Tested 6 9 9 7 10 7 463 530 561 510 587 617<br />
AMERICAN INDIAN<br />
SAMPSON COUNTY<br />
SYSTEM (All Students)<br />
Grade Participation 1998 1999 2000 2001 2002 2003 1998 1999 2000 2001 2002 2003<br />
3 % Grade Level 87.5 81.0 91.7 50.0 57.1 33.3 69.3 68.0 75.8 73.7 75.2 89.9<br />
# Tested 8 11 12 6 7 6 589 598 590 636 633 616<br />
4% Grade Level 50.0 70.0 75.0 90.9 100.0 75.0 82.7 82.0 85.4 85.6 90.8 94.7<br />
# Tested 6 10 12 11 7 8 567 594 588 606 606 625<br />
5% Grade Level 87.5 66.0 85.7 76.9 90.9 85.7 69.8 85.0 84.6 87.7 89.3 91.5<br />
# Tested 8 9 7 13 11 7 526 588 596 575 591 602<br />
6% Grade Level 71.4 87.0 80.0 75.0 70.0 90.0 82.4 79.0 82.7 80.2 85.1 89.8<br />
# Tested 7 8 10 8 10 10 532 529 608 592 582 597<br />
7% Grade Level 66.7 62.0 87.5 77.8 66.7 70.0 74.2 82.0 76.2 78.4 84.3 81.7<br />
# Tested 9 8 8 9 9 10 524 552 521 620 618 600<br />
8% Grade Level 50.0 88.0 88.9 85.7 80.0 100.0 71.8 81.0 76.6 76.0 82.2 86.6<br />
# Tested 6 9 9 7 10 7 463 531 563 512 589 618<br />
EOC High School Subjects, Percent <strong>of</strong> Students At/Above Grade Level<br />
AMERICAN INDIAN<br />
SYSTEM (All Students)<br />
Course Participation 1998 1999 2000 2001 2002 2003 1998 1999 2000 2001 2002 2003<br />
Algebra I % Grade Level 0.0 100.0 80.0 75.0 85.7 80.0 38.9 59.4 68.4 80.9 84.1 83.7<br />
# Tested 7 2 5 8 7 10 471 480 554 502 503 523<br />
Biology % Grade Level 12.5 0.0 50.0 71.4 80.0 40.0 38.2 44.4 44.5 53.6 60.0 43.0<br />
# Tested 8 2 4 7 5 5 479 471 434 487 482 514<br />
ELP % Grade Level — 66.7 20.0 40.0 60.0 50.0 51.2 63.8 61.6 56.9 66.9 66.8<br />
# Tested 3 3 5 5 5 2 588 450 424 267 487 349<br />
English I % Grade Level — 75.0 71.4 70.0 80.0 90.0 45.1 62.2 65.7 63.4 60.2 79.0<br />
# Tested 3 4 7 10 5 10 592 468 543 569 576 563<br />
US History % Grade Level — 75.0 0.0 16.7 25.0 16.7 36.2 55.8 46.3 41.7 39.6 54.8<br />
# Tested 3 4 2 6 8 6 434 400 447 405 449 427<br />
Algebra Il % Grade Level — 50.0 50.0 100.0 100.0 60.0 — 46.7 58.8 66.1 73.3 74.2<br />
# Tested — 2 4 1 2 5 — 319 279 298 285 306<br />
Physics % Grade Level — — — — — — — 64.3 70.6 95.5 — 62.5<br />
# Tested — — — — — — — 42 34 22 — 8<br />
Chemistry % Grade Level — 66.7 0.0 100.0 — 50.0 — 58.3 62.2 68.3 77.1 66.5<br />
# Tested — 3 1 1 — 2 — 247 230 208 175 197<br />
Geometry % Grade Level — 20.0 100.0 60.0 16.7 66.7 — 53.4 58.2 53.3 62.8 63.6<br />
# Tested — 5 3 5 6 3 — 341 335 345 347 354<br />
Phys.Science % Grade Level — 66.7 — — 44.4 66.7 — 52.2 25.0 76.6 53.2 61.9<br />
# Tested — 3 — — 9 3 — 469 4 145 391 320<br />
Source: <strong>Public</strong> <strong>Schools</strong> <strong>of</strong> <strong>North</strong> <strong>Carolina</strong>, Division <strong>of</strong> Accountability and Technology Services, 2002-03<br />
76
CLINTON CITY<br />
Trend <strong>of</strong> American Indian Students At/Above Grade Level<br />
in EOG Reading, Grades 3-8<br />
100<br />
90<br />
80<br />
Percent <strong>of</strong> Students (%)<br />
70<br />
60<br />
50<br />
40<br />
30<br />
NC State<br />
NC American<br />
Indian<br />
LEA<br />
LEA American<br />
Indian<br />
20<br />
10<br />
0<br />
92-93 93-94 94-95 95-96 96-97 97-98 98-99 99-00 00-01 01-02 02-03<br />
Trend <strong>of</strong> American Indian Students At/Above Grade Level<br />
in EOG Mathematics, Grades 3-8<br />
100<br />
90<br />
80<br />
Percent <strong>of</strong> Students (%)<br />
70<br />
60<br />
50<br />
40<br />
30<br />
20<br />
NC State<br />
NC American<br />
Indian<br />
LEA<br />
LEA American<br />
Indian<br />
10<br />
0<br />
92-93 93-94 94-95 95-96 96-97 97-98 98-99 99-00 00-01 01-02 02-03<br />
77
EOG Reading, Percent <strong>of</strong> Students At/Above Grade Level<br />
AMERICAN INDIAN<br />
EOG Mathematics, Percent <strong>of</strong> Students At/Above Grade Level<br />
EOC High School Subjects, Percent <strong>of</strong> Students At/Above Grade Level<br />
SYSTEM (All Students)<br />
Grade Participation 1998 1999 2000 2001 2002 2003 1998 1999 2000 2001 2002 2003<br />
3 % Grade Level 77.8 50.0 71.4 83.3 66.7 81.8 80.0 78.0 80.3 76.4 79.4 83.6<br />
# Tested 9 4 7 12 6 11 200 203 213 225 204 183<br />
4 % Grade Level 71.4 75.0 40.0 83.3 58.3 75.0 67.2 73.0 74.9 82.0 70.5 76.4<br />
# Tested 7 8 5 6 12 8 177 199 207 211 220 203<br />
5 % Grade Level 85.7 50.0 80.0 80.0 85.7 100.0 72.4 77.0 77.8 80.6 86.2 90.8<br />
# Tested 7 4 10 5 7 9 174 189 198 211 217 218<br />
6 % Grade Level 58.3 57.0 40.0 63.6 60.0 83.3 76.1 68.0 65.5 61.0 68.6 83.2<br />
# Tested 12 7 5 11 5 6 184 170 200 213 207 232<br />
7 % Grade Level 25.0 80.0 71.4 0.0 58.3 75.0 74.4 85.0 75.9 79.0 73.3 91.3<br />
# Tested 4 10 7 3 12 4 176 184 170 205 221 207<br />
8 % Grade Level 88.8 25.0 81.8 62.5 0.0 90.0 81.5 77.0 88.8 84.8 81.5 87.7<br />
# Tested 9 4 11 8 3 10 184 171 179 171 195 211<br />
AMERICAN INDIAN<br />
CLINTON CITY<br />
SYSTEM (All Students)<br />
Grade Participation 1998 1999 2000 2001 2002 2003 1998 1999 2000 2001 2002 2003<br />
3 % Grade Level 55.6 50.0 71.4 91.7 66.7 81.8 71.0 75.0 71.8 70.2 72.1 88.0<br />
# Tested 9 4 7 12 6 11 200 203 213 225 204 183<br />
4 % Grade Level 85.7 87.0 60.0 83.3 75.0 75.0 84.7 82.0 88.4 88.6 90.9 93.6<br />
# Tested 7 8 5 6 12 8 177 199 207 211 220 204<br />
5 % Grade Level 71.4 75.0 100.0 60.0 100.0 100.0 77.0 84.0 83.8 87.7 89.4 95.4<br />
# Tested 7 4 10 5 7 9 174 189 198 211 217 218<br />
6 % Grade Level 83.3 85.0 80.0 81.8 60.0 66.7 87.0 79.0 80.5 74.6 84.5 88.4<br />
# Tested 12 7 5 11 5 6 184 170 200 213 207 232<br />
7 % Grade Level 50.0 90.0 100.0 100.0 91.7 50.0 81.3 90.0 79.4 77.6 77.4 87.0<br />
# Tested 4 10 7 3 12 4 176 185 170 205 221 208<br />
8 % Grade Level 77.8 50.0 81.8 87.5 100.0 60.0 71.7 81.0 90.5 84.2 84.1 81.1<br />
# Tested 9 4 11 8 3 10 184 171 179 171 195 212<br />
AMERICAN INDIAN<br />
SYSTEM (All Students)<br />
Course Participation 1998 1999 2000 2001 2002 2003 1998 1999 2000 2001 2002 2003<br />
Algebra I % Grade Level 36.4 40.0 100.0 72.7 87.5 100.0 56.2 59.1 73.1 77.1 84.1 86.6<br />
# Tested 11 5 4 11 8 4 174 98 156 188 189 172<br />
Biology % Grade Level 28.6 28.6 25.0 25.0 77.8 75.0 50.9 54.7 39.1 48.3 67.4 48.3<br />
# Tested 7 7 8 4 9 8 171 159 184 172 175 178<br />
ELP % Grade Level 55.6 50.0 33.3 35.7 75.0 100.0 63.2 56.5 59.6 62.3 64.8 65.9<br />
# Tested 9 10 6 14 8 4 182 209 193 212 179 217<br />
English I % Grade Level 37.5 50.0 33.3 53.8 55.6 100.0 55.5 60.0 65.6 66.4 71.1 87.0<br />
# Tested 8 10 6 13 9 3 173 195 186 211 180 177<br />
US History % Grade Level 20.0 20.0 28.6 57.1 25.0 62.5 41.0 50.0 47.2 49.7 54.4 55.4<br />
# Tested 10 10 7 7 4 8 178 176 159 183 171 175<br />
Algebra Il % Grade Level — 20.0 33.3 66.7 33.3 100.0 — 35.2 49.6 62.2 67.6 72.0<br />
# Tested — 5 6 3 6 9 — 142 137 127 148 143<br />
Physics % Grade Level — — — — 100.0 — — 66.7 100.0 84.6 — 100.0<br />
# Tested — — — — 2 — — 6 12 13 — 16<br />
Chemistry % Grade Level — 40.0 100.0 40.0 100.0 100.0 — 50.7 66.7 59.4 88.9 79.3<br />
# Tested — 5 3 5 2 3 — 134 87 96 27 87<br />
Geometry % Grade Level — 42.9 25.0 50.0 75.0 66.7 — 53.5 51.0 64.1 81.8 57.4<br />
# Tested — 7 4 4 8 3 — 144 145 142 110 162<br />
Phys.Science % Grade Level — 44.4 0.0 — — 76.9 — 56.7 56.6 — 59.9 81.2<br />
# Tested — 9 4 — — 13 — 187 175 — 147 239<br />
Source: <strong>Public</strong> <strong>Schools</strong> <strong>of</strong> <strong>North</strong> <strong>Carolina</strong>, Division <strong>of</strong> Accountability and Technology Services, 2002-03<br />
78
SCOTLAND COUNTY<br />
Trend <strong>of</strong> American Indian Students At/Above Grade Level<br />
in EOG Reading, Grades 3-8<br />
100<br />
90<br />
80<br />
Percent <strong>of</strong> Students (%)<br />
70<br />
60<br />
50<br />
40<br />
30<br />
NC State<br />
NC American<br />
Indian<br />
LEA<br />
LEA American<br />
Indian<br />
20<br />
10<br />
0<br />
92-93 93-94 94-95 95-96 96-97 97-98 98-99 99-00 00-01 01-02 02-03<br />
Trend <strong>of</strong> American Indian Students At/Above Grade Level<br />
in EOG Mathematics, Grades 3-8<br />
100<br />
90<br />
80<br />
Percent <strong>of</strong> Students (%)<br />
70<br />
60<br />
50<br />
40<br />
30<br />
20<br />
NC State<br />
NC American<br />
Indian<br />
LEA<br />
LEA American<br />
Indian<br />
10<br />
0<br />
92-93 93-94 94-95 95-96 96-97 97-98 98-99 99-00 00-01 01-02 02-03<br />
79
EOG Reading, Percent <strong>of</strong> Students At/Above Grade Level<br />
AMERICAN INDIAN<br />
EOG Mathematics, Percent <strong>of</strong> Students At/Above Grade Level<br />
AMERICAN INDIAN<br />
EOC High School Subjects, Percent <strong>of</strong> Students At/Above Grade Level<br />
Source: <strong>Public</strong> <strong>Schools</strong> <strong>of</strong> <strong>North</strong> <strong>Carolina</strong>, Division <strong>of</strong> Accountability and Technology Services, 2002-03<br />
SCOTLAND COUNTY<br />
SYSTEM (All Students)<br />
Grade Participation 1998 1999 2000 2001 2002 2003 1998 1999 2000 2001 2002 2003<br />
3 % Grade Level 51.6 67.0 53.6 60.9 62.3 72.2 56.5 66.0 61.6 69.1 69.4 75.3<br />
# Tested 62 58 69 69 77 72 529 554 583 554 523 534<br />
4 % Grade Level 53.3 64.0 65.3 57.6 59.4 77.6 63.0 57.0 64.2 64.9 68.0 81.1<br />
# Tested 60 54 49 66 64 76 521 511 514 536 543 502<br />
5 % Grade Level 62.2 67.0 70.5 75.0 72.6 76.4 70.3 66.0 69.3 79.3 78.7 84.4<br />
# Tested 45 64 61 52 62 72 461 510 512 498 507 572<br />
6 % Grade Level 60.0 54.0 50.8 49.2 73.5 67.1 64.6 68.0 61.4 58.8 67.6 71.8<br />
# Tested 50 44 63 63 49 70 505 473 508 488 478 570<br />
7 % Grade Level 65.8 75.0 57.4 67.7 67.2 75.0 66.5 76.0 70.7 72.0 72.1 80.7<br />
# Tested 38 49 54 62 64 56 486 509 488 511 480 528<br />
8 % Grade Level 40.6 79.0 72.7 73.1 81.0 86.4 68.4 75.0 77.7 78.1 82.4 83.3<br />
# Tested 32 43 55 52 58 66 532 484 498 475 467 504<br />
SYSTEM (All Students)<br />
Grade Participation 1998 1999 2000 2001 2002 2003 1998 1999 2000 2001 2002 2003<br />
3 % Grade Level 52.3 62.0 62.3 60.0 57.7 87.5 58.0 64.0 64.6 65.9 61.7 87.0<br />
# Tested 62 59 69 70 78 72 529 559 587 560 528 537<br />
4 % Grade Level 69.4 71.0 88.0 75.0 76.2 87.2 69.4 79.0 80.1 82.8 83.2 93.3<br />
# Tested 60 60 50 64 63 78 521 519 518 540 548 505<br />
5 % Grade Level 68.9 73.0 79.7 81.5 85.5 84.9 74.9 75.0 79.2 85.3 88.5 90.3<br />
# Tested 45 65 64 54 62 73 461 513 515 503 513 575<br />
6 % Grade Level 68.0 70.0 63.5 66.7 91.7 81.4 71.9 75.0 74.4 76.5 83.0 88.0<br />
# Tested 50 44 63 63 48 70 505 476 507 490 476 569<br />
7 % Grade Level 86.8 83.0 74.1 80.6 82.8 75.0 79.2 84.0 83.9 79.3 83.2 84.8<br />
# Tested 38 49 54 62 64 56 486 510 490 508 481 528<br />
8 % Grade Level 43.8 90.0 81.5 69.2 74.1 80.3 68.6 77.0 81.9 77.9 79.8 80.9<br />
# Tested 32 43 54 52 58 66 532 483 498 475 466 503<br />
AMERICAN INDIAN<br />
SYSTEM (All Students)<br />
Course Participation 1998 1999 2000 2001 2002 2003 1998 1999 2000 2001 2002 2003<br />
Algebra I % Grade Level 69.2 80.0 87.5 95.0 97.3 96.2 58.5 70.8 82.0 88.1 91.3 96.3<br />
# Tested 26 30 40 40 37 53 417 483 434 471 458 509<br />
Biology % Grade Level 45.0 44.7 38.5 47.7 57.1 48.3 45.2 53.6 51.1 55.2 56.2 60.8<br />
# Tested 40 38 26 44 42 29 487 502 364 502 402 365<br />
ELP % Grade Level 64.4 71.4 74.1 75.9 65.9 50.0 64.2 79.3 66.2 70.6 67.1 70.9<br />
# Tested 45 7 27 29 44 38 531 193 396 442 419 419<br />
English I % Grade Level 46.0 35.3 50.0 62.7 44.4 67.9 52.6 55.0 59.9 61.2 61.6 76.7<br />
# Tested 50 34 46 59 45 56 500 553 499 520 495 484<br />
US History % Grade Level 35.7 12.0 53.8 36.8 41.2 53.7 35.0 36.3 42.0 55.8 45.8 52.4<br />
# Tested 28 25 26 19 34 41 417 366 348 371 358 368<br />
Algebra Il % Grade Level — 31.6 58.8 78.6 100.0 89.5 — 52.7 66.1 75.4 93.1 89.0<br />
# Tested — 19 17 14 12 19 — 277 230 236 204 227<br />
Physics % Grade Level — 100.0 — — — 100.0 — 62.1 56.8 82.4 90.5 93.3<br />
# Tested — 1 — — — 1 — 58 37 34 42 15<br />
Chemistry % Grade Level — 50.0 75.0 90.0 62.5 100.0 — 60.7 74.6 72.4 82.5 95.9<br />
# Tested — 6 4 10 8 5 — 140 173 170 120 98<br />
Geometry % Grade Level — 56.3 88.9 76.5 85.7 85.0 — 60.9 72.6 73.2 76.4 79.2<br />
# Tested — 16 18 17 21 20 — 248 288 269 276 265<br />
Phys.Science % Grade Level — 35.7 60.0 51.5 64.9 69.2 — 53.1 48.3 57.3 68.9 77.2<br />
# Tested — 14 45 33 37 39 — 271 414 410 357 302<br />
80
SWAIN COUNTY<br />
Trend <strong>of</strong> American Indian Students At/Above Grade Level<br />
in EOG Reading, Grades 3-8<br />
100<br />
90<br />
80<br />
Percent <strong>of</strong> Students (%)<br />
70<br />
60<br />
50<br />
40<br />
30<br />
NC State<br />
NC American<br />
Indian<br />
LEA<br />
LEA American<br />
Indian<br />
20<br />
10<br />
0<br />
92-93 93-94 94-95 95-96 96-97 97-98 98-99 99-00 00-01 01-02 02-03<br />
Trend <strong>of</strong> American Indian Students At/Above Grade Level<br />
in EOG Mathematics, Grades 3-8<br />
100<br />
90<br />
80<br />
Percent <strong>of</strong> Students (%)<br />
70<br />
60<br />
50<br />
40<br />
30<br />
20<br />
NC State<br />
NC American<br />
Indian<br />
LEA<br />
LEA American<br />
Indian<br />
10<br />
0<br />
92-93 93-94 94-95 95-96 96-97 97-98 98-99 99-00 00-01 01-02 02-03<br />
81
EOG Reading, Percent <strong>of</strong> Students At/Above Grade Level<br />
AMERICAN INDIAN<br />
EOG Mathematics, Percent <strong>of</strong> Students At/Above Grade Level<br />
SYSTEM (All Students)<br />
Grade Participation 1998 1999 2000 2001 2002 2003 1998 1999 2000 2001 2002 2003<br />
3 % Grade Level 73.9 85.0 50.0 84.8 61.5 64.7 78.6 81.0 75.6 87.5 75.7 78.6<br />
# Tested 23 21 20 33 26 34 117 124 119 136 107 131<br />
4 % Grade Level 54.3 65.0 68.2 81.3 78.8 70.4 75.0 79.0 75.0 84.0 80.9 86.7<br />
# Tested 35 26 22 16 33 27 132 123 132 119 141 113<br />
5 % Grade Level 72.7 62.0 73.1 85.0 88.9 85.7 80.2 79.0 82.1 90.1 92.0 90.1<br />
# Tested 22 37 26 20 18 35 11 145 134 131 125 151<br />
6 % Grade Level 66.7 80.0 54.5 81.5 77.8 78.3 84.0 84.0 72.6 79.8 77.5 79.7<br />
# Tested 18 25 33 27 27 23 119 119 146 129 138 133<br />
7 % Grade Level 87.0 66.0 73.9 61.8 65.5 96.2 87.4 83.0 78.0 78.6 81.2 87.9<br />
# Tested 23 27 23 34 29 26 111 128 123 140 138 149<br />
8 % Grade Level 84.6 85.0 72.0 88.0 77.8 90.3 86.3 89.0 87.5 90.2 86.0 91.4<br />
# Tested 26 27 25 25 27 31 139 119 128 122 136 139<br />
AMERICAN INDIAN<br />
SWAIN COUNTY<br />
SYSTEM (All Students)<br />
Grade Participation 1998 1999 2000 2001 2002 2003 1998 1999 2000 2001 2002 2003<br />
3 % Grade Level 78.3 85.0 60.0 85.3 57.7 82.4 88.0 89.0 79.8 84.1 69.4 90.8<br />
# Tested 23 21 20 34 26 34 117 124 119 138 108 131<br />
4 % Grade Level 94.3 76.0 90.9 87.5 82.4 88.9 94.7 91.0 91.7 91.8 88.8 94.7<br />
# Tested 35 26 22 16 34 27 132 123 132 122 143 114<br />
5 % Grade Level 86.4 78.0 92.3 85.0 88.9 91.7 89.2 86.0 91.8 88.6 88.1 94.8<br />
# Tested 22 37 26 20 18 36 111 145 134 132 126 153<br />
6 % Grade Level 66.7 92.0 72.7 96.3 92.6 87.0 89.9 95.0 84.9 89.3 89.1 89.5<br />
# Tested 18 25 33 27 27 23 118 119 146 131 138 133<br />
7 % Grade Level 78.3 77.0 82.6 67.6 72.4 88.5 82.0 89.0 86.2 77.1 75.7 85.9<br />
# Tested 23 27 23 34 29 26 111 128 123 140 140 149<br />
8 % Grade Level 65.4 77.0 76.0 84.0 81.5 77.4 79.1 87.0 88.3 84.4 83.1 87.8<br />
# Tested 26 27 25 25 27 31 139 119 128 122 136 139<br />
EOC High School Subjects, Percent <strong>of</strong> Students At/Above Grade Level<br />
AMERICAN INDIAN<br />
SYSTEM (All Students)<br />
Course Participation 1998 1999 2000 2001 2002 2003 1998 1999 2000 2001 2002 2003<br />
Algebra I % Grade Level 84.6 64.0 59.4 75.0 67.6 72.0 61.3 66.1 69.0 82.3 83.8 77.9<br />
# Tested 13 25 32 20 34 25 97 124 145 96 154 113<br />
Biology % Grade Level 84.6 51.6 43.5 56.7 76.2 60.0 80.4 74.8 57.5 59.1 79.1 66.1<br />
# Tested 13 31 23 30 21 25 97 143 106 110 110 127<br />
ELP % Grade Level 93.8 86.4 93.8 95.0 88.9 89.5 92.0 89.0 93.3 96.0 93.1 91.8<br />
# Tested 16 22 16 20 18 19 75 73 90 101 102 85<br />
English I % Grade Level 48.6 73.3 80.8 66.7 65.5 54.2 72.6 73.7 81.7 81.4 73.7 82.0<br />
# Tested 35 30 26 24 29 24 146 137 120 118 137 133<br />
US History % Grade Level 51.9 55.0 42.9 66.7 57.1 47.8 62.4 64.8 64.2 73.5 63.9 57.3<br />
# Tested 27 20 28 24 21 23 101 105 120 117 97 117<br />
Algebra Il % Grade Level — 68.8 66.7 61.5 71.4 80.0 — 73.7 71.0 75.5 75.5 75.4<br />
# Tested — 16 9 13 7 10 — 57 69 53 49 61<br />
Physics % Grade Level — 80.0 — — 50.0 — — 71.4 100.0 100.0 81.8 —<br />
# Tested — 5 — — 2 — — 21 4 9 11 —<br />
Chemistry % Grade Level — 25.0 35.0 66.7 100.0 77.8 — 35.8 54.6 68.1 91.3 80.0<br />
# Tested — 12 20 6 2 9 — 67 97 47 23 40<br />
Geometry % Grade Level — 30.8 58.8 30.8 90.9 50.0 — 67.5 66.7 47.0 78.9 69.6<br />
# Tested — 13 17 13 11 14 — 83 87 66 57 79<br />
Phys.Science % Grade Level — 70.8 50.0 47.4 41.2 63.6 — 76.0 53.8 69.7 73.3 85.2<br />
# Tested — 24 4 19 17 11 — 125 13 89 86 61<br />
Source: <strong>Public</strong> <strong>Schools</strong> <strong>of</strong> <strong>North</strong> <strong>Carolina</strong>, Division <strong>of</strong> Accountability and Technology Services, 2002-03<br />
82
WAKE COUNTY<br />
Trend <strong>of</strong> American Indian Students At/Above Grade Level<br />
in EOG Reading, Grades 3-8<br />
100<br />
90<br />
80<br />
Percent <strong>of</strong> Students (%)<br />
70<br />
60<br />
50<br />
40<br />
30<br />
NC State<br />
NC American<br />
Indian<br />
LEA<br />
LEA American<br />
Indian<br />
20<br />
10<br />
0<br />
92-93 93-94 94-95 95-96 96-97 97-98 98-99 99-00 00-01 01-02 02-03<br />
Trend <strong>of</strong> American Indian Students At/Above Grade Level<br />
in EOG Mathematics, Grades 3-8<br />
100<br />
90<br />
80<br />
Percent <strong>of</strong> Students (%)<br />
70<br />
60<br />
50<br />
40<br />
30<br />
20<br />
NC State<br />
NC American<br />
Indian<br />
LEA<br />
LEA American<br />
Indian<br />
10<br />
0<br />
92-93 93-94 94-95 95-96 96-97 97-98 98-99 99-00 00-01 01-02 02-03<br />
83
EOG Reading, Percent <strong>of</strong> Students At/Above Grade Level<br />
EOG Mathematics, Percent <strong>of</strong> Students At/Above Grade Level<br />
EOC High School Subjects, Percent <strong>of</strong> Students At/Above Grade Level<br />
WAKE COUNTY<br />
AMERICAN INDIAN<br />
SYSTEM (All Students)<br />
Grade Participation 1998 1999 2000 2001 2002 2003 1998 1999 2000 2001 2002 2003<br />
3 % Grade Level 88.2 87 78.9 85 90.9 88.2 — 80 82.8 85.3 87.6 89<br />
# Tested 17 24 19 20 22 34 — 7610 7918 7780 7881 8260<br />
4 % Grade Level 72.2 85 68 90.5 77.8 95.2 — 80 81.3 85.9 87.4 89.9<br />
# Tested 18 21 25 21 18 21 — 7406 7725 7680 7700 8131<br />
5 % Grade Level 88.2 88 84.6 77.8 86.4 94.4 — 84 87.7 90.8 92.2 93.5<br />
# Tested 17 17 26 27 22 18 — 7244 7674 7572 7759 8056<br />
6 % Grade Level 53.3 84 83.3 0 68 87.5 — 80 77.9 80.7 82.8 87.7<br />
# Tested 15 19 18 24 25 24 — 7034 7646 7645 7948 8334<br />
7 % Grade Level 83.3 88 87.5 87.5 95.7 95.2 — 84 84.3 85.1 86.7 90.3<br />
# Tested 12 9 24 16 23 21 — 6768 7316 7446 7769 8362<br />
8 % Grade Level 83.3 100 80 94.7 94.4 100 — 87 88.7 90.6 91.4 92.2<br />
# Tested 12 14 15 19 18 24 — 6587 6958 7085 7414 8065<br />
AMERICAN INDIAN<br />
SYSTEM (All Students)<br />
Grade Participation 1998 1999 2000 2001 2002 2003 1998 1999 2000 2001 2002 2003<br />
3 % Grade Level 70.6 87 73.7 85 86.4 91.2 — 77 79.5 84 87.1 93.4<br />
# Tested 17 24 19 20 22 34 — 7635 7960 7801 7909 8261<br />
4 % Grade Level 66.7 85 84 95.5 100 100 — 88 88.9 92.7 94.7 96.3<br />
# Tested 18 21 25 22 18 21 — 7425 7758 7707 7719 8147<br />
5 % Grade Level 83.3 82 84.6 89.3 90.9 94.4 — 87 88.7 92.1 93.8 95.6<br />
# Tested 17 17 26 28 22 18 — 7273 7709 7611 7792 8062<br />
6 % Grade Level 53.3 80 94.4 95.8 96 91.7 — 84 85.2 88.1 90.2 91.7<br />
# Tested 15 20 18 24 25 24 — 7028 7642 7643 7955 8334<br />
7 % Grade Level 83.3 77 75 100 91.3 90.5 — 87 86.6 87.6 90.3 87.9<br />
# Tested 12 9 24 16 23 21 — 6760 7309 7452 7774 8381<br />
8 % Grade Level 75 92 73.3 84.2 94.4 91.7 — 83 85.6 86.9 88.3 88.5<br />
# Tested 12 14 15 19 18 24 — 6600 6966 7081 7408 8071<br />
AMERICAN INDIAN<br />
SYSTEM (All Students)<br />
Course Participation 1998 1999 2000 2001 2002 2003 1998 1999 2000 2001 2002 2003<br />
Algebra I % Grade Level 62.5 69.2 81.8 100 100 86.4 — 78.4 81.4 88.2 88.2 88.3<br />
# Tested 16 13 11 16 9 22 — 6615 6868 7012 7759 8526<br />
Biology % Grade Level 63.6 72.7 58.3 73.3 82.4 64.7 — 68.4 70.7 71 80.6 74.2<br />
# Tested 22 11 12 15 17 17 — 5939 6340 6775 6457 6225<br />
ELP % Grade Level 76.9 56.5 76.9 68.8 72.2 83.3 — 73.7 78.3 78.2 79.2 80.4<br />
# Tested 13 23 13 16 18 12 — 6984 6784 7383 7448 6701<br />
English I % Grade Level 73.7 81.8 93.3 71.4 65 94.4 — 74.2 78.7 79 81.1 88.8<br />
# Tested 19 11 15 14 20 18 — 6446 6946 7261 7392 7702<br />
US History % Grade Level 33.3 68.8 41.7 46.2 35.7 80 — 66.7 60.1 64.1 62.5 67.6<br />
# Tested 6 16 12 13 14 10 — 5119 5526 5906 6151 6404<br />
Algebra Il % Grade Level — 46.2 70 71.4 81.3 88.2 — 77.3 75.8 82.7 86.5 85.2<br />
# Tested — 13 10 7 16 17 — 4206 4621 4878 4968 5297<br />
Physics % Grade Level — 75 80 0 66.7 100 — 81.9 79.3 81.9 90.7 89.2<br />
# Tested — 4 5 1 3 3 — 1707 1785 1706 1924 1231<br />
Chemistry % Grade Level — 84.6 70 62.5 66.7 92.3 — 77.7 74.6 78.4 83.7 85.5<br />
# Tested — 13 10 8 6 13 — 3773 4020 4148 3810 3793<br />
Geometry % Grade Level — 56.3 87.5 72.7 75 70 — 74.1 75 80.3 80 82.1<br />
# Tested — 16 8 11 16 10 — 4850 5109 4972 5749 6193<br />
Phys.Science % Grade Level — 46.2 100 25 66.7 50 — 59.2 62.4 65.5 65.3 61.6<br />
# Tested — 13 4 4 3 6 — 3727 3283 2487 2127 2526<br />
Source: <strong>Public</strong> <strong>Schools</strong> <strong>of</strong> <strong>North</strong> <strong>Carolina</strong>, Division <strong>of</strong> Accountability and Technology Services, 2002-03<br />
84
WARREN COUNTY<br />
Trend <strong>of</strong> American Indian Students At/Above Grade Level<br />
in EOG Reading, Grades 3-8<br />
100<br />
90<br />
80<br />
Percent <strong>of</strong> Students (%)<br />
70<br />
60<br />
50<br />
40<br />
30<br />
NC State<br />
NC American<br />
Indian<br />
LEA<br />
LEA American<br />
Indian<br />
20<br />
10<br />
0<br />
92-93 93-94 94-95 95-96 96-97 97-98 98-99 99-00 00-01 01-02 02-03<br />
Trend <strong>of</strong> American Indian Students At/Above Grade Level<br />
in EOG Mathematics, Grades 3-8<br />
100<br />
90<br />
80<br />
Percent <strong>of</strong> Students (%)<br />
70<br />
60<br />
50<br />
40<br />
30<br />
20<br />
NC State<br />
NC American<br />
Indian<br />
LEA<br />
LEA American<br />
Indian<br />
10<br />
0<br />
92-93 93-94 94-95 95-96 96-97 97-98 98-99 99-00 00-01 01-02 02-03<br />
85
EOG Reading, Percent <strong>of</strong> Students At/Above Grade Level<br />
AMERICAN INDIAN<br />
EOG Mathematics, Percent <strong>of</strong> Students At/Above Grade Level<br />
EOC High School Subjects, Percent <strong>of</strong> Students At/Above Grade Level<br />
SYSTEM (All Students)<br />
Grade Participation 1998 1999 2000 2001 2002 2003 1998 1999 2000 2001 2002 2003<br />
3 % Grade Level 61.5 91 54.5 60 0 90 — 66 60.5 59.8 63.2 72.8<br />
# Tested 13 12 11 10 10 10 — 273 253 249 253 235<br />
4 % Grade Level 42.9 75 70 85.7 80 83.3 — 58 58.7 60 59.8 76.8<br />
# Tested 14 12 10 7 10 12 — 255 259 240 246 241<br />
5 % Grade Level 58.3 88 71.4 0 85.7 100 — 68 65.9 71.9 77.4 80.8<br />
# Tested 12 9 14 7 7 10 — 255 252 270 239 245<br />
6 % Grade Level 48.8 46 54.5 66.7 81.8 90.9 — 62 52.5 52.7 52.1 74.3<br />
# Tested 15 13 11 15 11 11 — 234 259 264 282 257<br />
7 % Grade Level 66.7 64 50 66.7 76.9 100 — 58 59.5 62.2 56.3 75<br />
# Tested 12 14 16 9 13 10 — 250 257 251 268 272<br />
8 % Grade Level 100 61 92.3 58.8 75 92.3 — 70 71.2 64.7 72 76.7<br />
# Tested 7 13 13 17 8 13 — 281 — 258 243 262<br />
AMERICAN INDIAN<br />
WARREN COUNTY<br />
SYSTEM (All Students)<br />
Grade Participation 1998 1999 2000 2001 2002 2003 1998 1999 2000 2001 2002 2003<br />
3 % Grade Level 69.2 75 81.8 70 100 80 — 64 62.5 55.2 60.2 81.4<br />
# Tested 13 12 11 10 10 10 — 276 259 250 254 236<br />
4 % Grade Level 57.1 75 80 100 80 100 — 70 74.5 72.3 75.8 92.9<br />
# Tested 14 12 10 7 10 12 — 268 267 242 248 241<br />
5 % Grade Level 58.3 88 78.6 100 100 100 — 81 71.2 78.6 84.2 84.7<br />
# Tested 12 9 14 7 7 10 — 261 260 271 241 248<br />
6 % Grade Level 45.8 76 72.7 73.3 90.9 90.9 — 72 64.4 68.3 71.4 87.6<br />
# Tested 15 13 11 15 11 11 — 237 261 265 283 258<br />
7 % Grade Level 69.2 85 68.8 77.8 76.9 80 — 65 65.2 66.5 67.2 68.1<br />
# Tested 12 14 16 9 13 10 — 250 256 251 268 273<br />
8 % Grade Level 85.7 76 100 47.1 75 76.9 — 70 70.9 63.6 72.5 72<br />
# Tested 7 13 13 17 8 13 — 281 234 258 244 261<br />
AMERICAN INDIAN<br />
SYSTEM (All Students)<br />
Course Participation 1998 1999 2000 2001 2002 2003 1998 1999 2000 2001 2002 2003<br />
Algebra I % Grade Level 57.1 45.5 50 84.2 47.4 81.8 — 38.8 30.6 56.4 66.6 79.3<br />
# Tested 14 11 12 19 19 11 — 240 245 303 335 261<br />
Biology % Grade Level 0 46.2 50 58.3 55.6 41.2 — 35.2 31.9 31.5 43.2 42.8<br />
# Tested 7 13 8 12 9 17 — 213 204 222 155 257<br />
ELP % Grade Level 40 46.2 26.7 70 42.1 57.1 — 40.4 33.4 39.2 41 42.8<br />
# Tested 10 13 15 20 19 14 — 280 296 288 293 327<br />
English I % Grade Level 30.8 62.5 42.9 86.7 50 90 — 49.6 50 50.2 50.2 77.8<br />
# Tested 13 8 14 15 18 10 — 228 282 253 285 270<br />
US History % Grade Level 33.3 14.3 33.3 62.5 66.7 64.7 — 29.1 34.3 33.5 41.1 50.7<br />
# Tested 12 7 9 8 9 17 — 179 216 179 219 207<br />
Algebra Il % Grade Level — 0 50 100 77.8 40 — 23.9 35 56.2 59.1 69.3<br />
# Tested — 4 10 4 9 5 — 92 103 105 127 137<br />
Physics % Grade Level — 33.3 0 66.7 100 100 — 69.8 72.9 63.4 79.1 96.2<br />
# Tested — 3 1 3 2 3 — 43 48 71 43 26<br />
Chemistry % Grade Level — 33.3 50 100 42.9 66.7 — 52.4 40.5 69.7 58.8 81.8<br />
# Tested — 3 4 4 7 3 — 82 84 66 102 55<br />
Geometry % Grade Level — 58.3 16.7 55.6 42.9 46.2 — 56.3 42.3 40.6 54.7 41.2<br />
# Tested — 12 6 9 7 13 — 103 137 143 148 262<br />
Phys.Science % Grade Level — 30 26.7 46.7 30 20 — 27.6 27.4 32.5 32.6 52.2<br />
# Tested — 10 15 15 20 5 — 293 288 305 279 201<br />
Source: <strong>Public</strong> <strong>Schools</strong> <strong>of</strong> <strong>North</strong> <strong>Carolina</strong>, Division <strong>of</strong> Accountability and Technology Services, 2002-03<br />
86
CHARLOTTE/MECKLENBURG COUNTY<br />
(County is not a Title VII Grantee, Trend Level Graph data not avaliable)<br />
EOG Reading, Percent <strong>of</strong> Students At/Above Grade Level<br />
AMERICAN INDIAN<br />
EOG Mathematics, Percent <strong>of</strong> Students At/Above Grade Level<br />
SYSTEM (All Students)<br />
Grade Participation 1998 1999 2000 2001 2002 2003 1998 1999 2000 2001 2002 2003<br />
3 % Grade Level — — 66.7 79.2 76.4 73.1 — — 72.1 75.1 78.3 81.6<br />
# Tested — — 33 48 55 52 — — 8272 8219 8272 8657<br />
4 % Grade Level — — 61.1 60.0 71.4 81.3 — — 69.1 71.6 73.9 82.9<br />
# Tested — — 36 30 49 48 — — 7894 8159 8274 8404<br />
5 % Grade Level — — 55.2 81.3 75.0 87.8 — — 75.3 82.1 81.4 86.6<br />
# Tested — — 29 32 32 49 — — 7833 7782 8248 8585<br />
6 % Grade Level — — 51.4 53.8 63.4 71.9 — — 64.1 65.8 70.8 77.0<br />
# Tested — — 37 26 41 32 — — 7631 7561 7962 8619<br />
7 % Grade Level — — 86.5 62.2 54.3 71.4 — — 86.4 70.5 72.5 81.8<br />
# Tested — — 37 37 35 35 — — 7475 7578 7928 8241<br />
8 % Grade Level — — 77.8 65.6 71.1 80.6 — — 77.3 78.4 81.2 83.8<br />
# Tested — — 27 32 38 31 — — 7167 7407 7704 8300<br />
AMERICAN INDIAN<br />
SYSTEM (All Students)<br />
Grade Participation 1998 1999 2000 2001 2002 2003 1998 1999 2000 2001 2002 2003<br />
3 % Grade Level — 63.5 57.6 68.0 71.4 77.4 — 67.5 68.1 71.6 75.5 88.0<br />
# Tested — — 33 50 56 53 — — 8379 8295 8359 8705<br />
4 % Grade Level — 76.6 75.0 76.7 92.0 95.8 — 77.2 79.7 83.8 87.8 94.7<br />
# Tested — — 36 30 50 48 — — 7983 8259 8357 8461<br />
5 % Grade Level — 70.5 63.3 81.3 80.6 94.0 — 77.7 79.2 84.9 86.5 91.9<br />
# Tested — — 30 32 31 50 — — 7900 7866 8351 8656<br />
6 % Grade Level — 74.2 57.9 69.2 80.5 84.4 — 73.2 72.9 78.0 85.3 88.4<br />
# Tested — — 38 26 41 32 — — 7669 7585 8005 8639<br />
7 % Grade Level — 76.1 67.6 67.6 62.9 85.7 — 75.6 73.3 76.1 79.4 82.4<br />
# Tested — — 37 37 35 35 — — 7470 7557 7928 8266<br />
8 % Grade Level — 68.7 66.7 71.9 78.9 64.5 — 69.4 73.2 73.7 79.0 80.9<br />
# Tested — — 27 32 38 31 — — 7171 7407 7720 8292<br />
87<br />
EOC High School Subjects, Percent <strong>of</strong> Students At/Above Grade Level<br />
AMERICAN INDIAN<br />
SYSTEM (All Students)<br />
Course Participation 1998 1999 2000 2001 2002 2003 1998 1999 2000 2001 2002 2003<br />
Algebra I % Grade Level — — 51.9 61.5 37.5 63.0 — — 52.8 55.2 65.1 65.3<br />
# Tested — — 27 39 32 46 — — 7848 9073 8678 11226<br />
Biology % Grade Level — — 47.8 50.0 58.6 50.0 — — 58.8 57.8 65.0 54.3<br />
# Tested — — 23 24 29 34 — — 6427 6977 9462 8238<br />
ELP % Grade Level — — 54.3 66.7 62.1 71.4 — — 60.6 62.6 60.2 60.5<br />
# Tested — — 35 24 29 35 — — 7529 7860 8175 8862<br />
English I % Grade Level — — 58.6 66.7 57.7 83.9 — — 67.3 66.6 68.7 77.5<br />
# Tested — — 29 24 26 31 — — 6909 7363 7672 8154<br />
US History % Grade Level — — 50.0 38.5 54.5 56.3 — — 47.7 52.9 51.6 56.2<br />
# Tested — — 8 13 22 16 — — 5290 5743 6045 6224<br />
Algebra Il % Grade Level — — 50.0 55.6 50.0 44.4 — — 60.8 64.8 65.2 66.6<br />
# Tested — — 8 9 14 18 — — 4281 4911 5637 5575<br />
Physics % Grade Level — — 66.7 0.0 — 100.0 — — 67.7 70.1 80.4 77.6<br />
# Tested — — 3 3 — 2 — — 1324 1268 1293 1314<br />
Chemistry % Grade Level — — 46.7 66.7 42.9 44.4 — — 53.0 53.6 54.1 56.7<br />
# Tested — — 15 9 14 18 — — 4514 4540 5025 6412<br />
Geometry % Grade Level — — 47.4 33.3 36.0 35.0 — — 52.6 51.9 51.0 57.3<br />
# Tested — — 19 18 25 20 — — 5861 6520 6610 7025<br />
Phys.Science % Grade Level — — 47.4 50.0 0.0 100.0 — — 46.8 41.1 39.5 43.9<br />
# Tested — — 19 8 2 2 — — 4270 1563 522 538<br />
Source: <strong>Public</strong> <strong>Schools</strong> <strong>of</strong> <strong>North</strong> <strong>Carolina</strong>, Division <strong>of</strong> Accountability and Technology Services, 2002-03
DROPOUT DATA<br />
TABLE 7<br />
PERCENTAGES OF DROPOUTS WITHIN ETHNIC/GENDER GROUPS,<br />
GRADES 1-12<br />
Ethnicity/Gender<br />
# <strong>of</strong><br />
Dropout Events<br />
Total # in<br />
Ethnic/Gender<br />
Membership<br />
Dropout Events as<br />
% <strong>of</strong> Ethnic/Gender<br />
Membership<br />
Am. Indian Male 292 9,083 3.21%<br />
Am. Indian Female 211 8,597 2.45%<br />
Asian Male 150 12,298 1.22%<br />
Asian Female 108 11,387 0.95%<br />
Black Male 4,141 193,664 2.14%<br />
Black Female 2,641 189,264 1.40%<br />
Hispanic Male 777 35,233 2.21%<br />
Hispanic Female 617 33,043 1.87%<br />
Multiracial Male 133 — —<br />
Multiracial Female 112 — —<br />
White Male 6,488 373,343 1.74%<br />
White Female 4,621 353,995 1.31%<br />
Total 20,291 1,219,907 1.66%<br />
– Data not available<br />
TABLE 8<br />
DROPOUT EVENTS BY ETHNICITY, GRADES 1-12<br />
Ethnicity<br />
# <strong>of</strong><br />
Events<br />
# in Ethnic<br />
Membership<br />
Dropout Events<br />
as % <strong>of</strong> Ethnic<br />
Membership<br />
Dropout Events<br />
as % <strong>of</strong> 1–12<br />
Membership<br />
(n=1,219,907)<br />
Ethnic Dropout<br />
Events as % <strong>of</strong> All<br />
Dropout Events<br />
(n=20,291)<br />
Am. Indian 503 17,680 2.85% .04% 2.48%<br />
Asian 258 23,685 1.09% .02% 1.27%<br />
Black 6,782 382,928 1.77% .56% 33.42%<br />
Hispanic 1,394 68,276 2.04% .11% 6.87%<br />
Multiracial 245 NA NA .02% 1.21%<br />
White 11,109 727,338 1.53% .91% 54.75%<br />
Total 20,291 1,219,907 1.66% 1.66% 100.00%<br />
– Data not available<br />
88
DROPOUT DATA<br />
TABLE 9<br />
<strong>North</strong> <strong>Carolina</strong> <strong>Public</strong> <strong>Schools</strong> Dropout Data for Grades 7-12 (Duplicated Count)<br />
SYSTEM AMERICAN INDIAN SYSTEM STATE<br />
Columbus County 2000 2001 2002 2003 2000 2001 2002 2003 2000 2001 2002 2003<br />
Total Number<br />
<strong>of</strong> Students 181 177 184 199 3,370 3,316 3407 3,227 532,765 549,770 597,161 586,159<br />
Total Number<br />
<strong>of</strong> Dropouts 18 5 4 9 190 158 173 111 24,596 22,365 21,046 19,834<br />
Dropout Rate<br />
(per 100 students) 9.94 2.82 2.17 4.52 5.64 4.76 3.77 3.44 4.62 4.07 3.52 3.38<br />
Cumberland County 2000 2001 2002 2003 2000 2001 2002 2003 2000 2001 2002 2003<br />
Total Number<br />
<strong>of</strong> Students 424 421 430 431 22,238 22,570 23,853 23,719 532,765 549,770 597,161 586,159<br />
Total Number<br />
<strong>of</strong> Dropouts 38 28 26 27 803 737 674 643 24,596 22,365 21,046 19,834<br />
Dropout Rate<br />
(per 100 students) 8.96 6.65 6.05 6.26 3.61 3.27 2.83 2.71 4.62 4.07 3.52 3.38<br />
Graham County 2000 2001 2002 2003 2000 2001 2002 2003 2000 2001 2002 2003<br />
Total Number<br />
<strong>of</strong> Students 60 64 66 57 502 504 563 529 532,765 549,770 597,161 586,159<br />
Total Number<br />
<strong>of</strong> Dropouts 1 4 6 6 47 20 24 22 24,596 22,365 21,046 19,834<br />
Dropout Rate<br />
(per 100 students) 1.67 6.25 9.09 10.53 9.14 3.98 4.26 4.16 4.62 4.07 3.52 3.38<br />
Guilford County 2000 2001 2002 2003 2000 2001 2002 2003 2000 2001 2002 2003<br />
Total Number<br />
<strong>of</strong> Students 166 156 169 181 26,248 26,948 29,022 29,191 532,765 549,770 597,161 586,159<br />
Total Number<br />
<strong>of</strong> Dropouts 16 15 4 2 1,104 747 753 602 24,596 22,365 21,046 19,834<br />
Dropout Rate<br />
(per 100 students) 9.64 9.62 2.37 1.10 4.21 2.77 2.60 2.06 4.62 4.07 3.52 3.38<br />
Halifax County 2000 2001 2002 2003 2000 2001 2002 2003 2000 2001 2002 2003<br />
Total Number<br />
<strong>of</strong> Students 164 150 152 149 2,624 2,614 2,715 2,589 532,765 549,770 597,161 586,159<br />
Total Number<br />
<strong>of</strong> Dropouts 14 6 11 4 138 113 115 91 24,596 22,365 21,046 19,834<br />
Dropout Rate<br />
(per 100 students) 8.54 4.00 7.24 2.68 5.26 4.32 4.24 3.51 4.62 4.07 3.52 3.38<br />
Hertford County 2000 2001 2002 2003 2000 2001 2002 2003 2000 2001 2002 2003<br />
Total Number<br />
<strong>of</strong> Students 15 18 21 22 1,875 1,830 1,875 1,759 532,765 549,770 597,161 586,159<br />
Total Number<br />
<strong>of</strong> Dropouts 0 0 0 1 111 67 87 76 24,596 22,365 21,046 19,834<br />
Dropout Rate<br />
(per 100 students) 0.00 0.00 1.74 4.55 3.66 3.77 4.64 4.32 4.62 4.07 3.52 3.38<br />
Source: <strong>Public</strong> <strong>Schools</strong> <strong>of</strong> <strong>North</strong> <strong>Carolina</strong>, Division <strong>of</strong> Accountability and Technology Services, 2002-03<br />
89
TABLE 9<br />
<strong>North</strong> <strong>Carolina</strong> <strong>Public</strong> <strong>Schools</strong> Dropout Data for Grades 7-12 (Duplicated Count)<br />
SYSTEM AMERICAN INDIAN SYSTEM STATE<br />
Hoke County 2000 2001 2002 2003 2000 2001 2002 2003 2000 2001 2002 2003<br />
Total Number<br />
<strong>of</strong> Students 325 326 340 364 2,450 2,441 2,607 2,596 532,765 549,770 597,161 586,159<br />
Total Number<br />
<strong>of</strong> Dropouts 31 21 19 29 165 141 131 143 24,596 22,365 21,046 19,834<br />
Dropout Rate<br />
(per 100 students) 9.54 6.44 5.59 7.97 6.73 5.78 5.02 5.51 4.62 4.07 3.52 3.38<br />
Jackson County 2000 2001 2002 2003 2000 2001 2002 2003 2000 2001 2002 2003<br />
Total Number<br />
<strong>of</strong> Students 138 138 136 133 1,635 1,639 1,705 1,697 532,765 549,770 597,161 586,159<br />
Total Number<br />
<strong>of</strong> Dropouts 8 11 8 4 68 64 56 67 24,596 22,365 21,046 19,834<br />
Dropout Rate<br />
(per 100 students) 5.80 7.97 5.88 3.01 4.16 3.90 3.28 3.95 4.62 4.07 3.52 3.38<br />
Person County 2000 2001 2002 2003 2000 2001 2002 2003 2000 2001 2002 2003<br />
Total Number<br />
<strong>of</strong> Students 11 13 12 14 2,457 2,509 2,649 2,638 532,765 549,770 597,161 586,159<br />
Total Number<br />
<strong>of</strong> Dropouts 0 0 0 0 110 114 98 77 24,596 22,365 21,046 19,834<br />
Dropout Rate<br />
(per 100 students) 0.00 0.00 0.00 0.00 4.48 4.54 3.77 2.92 4.62 4.07 3.52 3.38<br />
Richmond County 2000 2001 2002 2003 2000 2001 2002 2003 2000 2001 2002 2003<br />
Total Number<br />
<strong>of</strong> Students 44 49 52 45 3,350 3,390 3,610 3,575 532,765 549,770 597,161 586,159<br />
Total Number<br />
<strong>of</strong> Dropouts 2 5 3 2 163 156 136 110 24,596 22,365 21,046 19,834<br />
Dropout Rate<br />
(per 100 students) 4.55 10.20 5.77 4.44 4.87 4.60 3.77 3.08 4.62 4.07 3.52 3.38<br />
Robeson County 2000 2001 2002 2003 2000 2001 2002 2003 2000 2001 2002 2003<br />
Total Number<br />
<strong>of</strong> Students 4,311 4,276 4,191 4,238 9,999 10,011 10,465 10,185 532,765 549,770 597,161 586,159<br />
Total Number<br />
<strong>of</strong> Dropouts 369 382 261 292 735 776 545 605 24,596 22,365 21,046 19,834<br />
Dropout Rate<br />
(per 100 students) 8.56 8.93 6.23 6.89 7.35 7.75 5.21 5.94 4.62 4.07 3.52 3.38<br />
Sampson County 2000 2001 2002 2003 2000 2001 2002 2003 2000 2001 2002 2003<br />
Total Number<br />
<strong>of</strong> Students 33 41 45 44 3,108 3,209 3,377 3,386 532,765 549,770 597,161 586,159<br />
Total Number<br />
<strong>of</strong> Dropouts 0 2 2 2 85 112 107 97 24,596 22,365 21,046 19,834<br />
Dropout Rate<br />
(per 100 students) 0.00 4.88 4.44 4.55 2.73 3.49 3.17 2.86 4.62 4.07 3.52 3.38<br />
Source: <strong>Public</strong> <strong>Schools</strong> <strong>of</strong> <strong>North</strong> <strong>Carolina</strong>, Division <strong>of</strong> Accountability and Technology Services, 2002-03<br />
90
TABLE 9<br />
<strong>North</strong> <strong>Carolina</strong> <strong>Public</strong> <strong>Schools</strong> Dropout Data for Grades 7-12 (Duplicated Count)<br />
SYSTEM AMERICAN INDIAN SYSTEM STATE<br />
Clinton City 2000 2001 2002 2003 2000 2001 2002 2003 2000 2001 2002 2003<br />
Total Number<br />
<strong>of</strong> Students 46 43 44 40 1,114 1,117 1,205 1,172 532,765 549,770 597,161 586,159<br />
Total Number<br />
<strong>of</strong> Dropouts 3 3 4 1 58 48 38 21 24,596 22,365 21,046 19,834<br />
Dropout Rate<br />
(per 100 students) 6.52 6.98 9.09 2.50 5.21 4.30 3.15 1.79 4.62 4.07 3.52 3.38<br />
Scotland County 2000 2001 2002 2003 2000 2001 2002 2003 2000 2001 2002 2003<br />
Total Number<br />
<strong>of</strong> Students 260 283 300 322 2,869 2,928 3,010 2,935 532,765 549,770 597,161 586,159<br />
Total Number<br />
<strong>of</strong> Dropouts 20 14 12 11 169 131 83 86 24,596 22,365 21,046 19,834<br />
Dropout Rate<br />
(per 100 students) 7.69 4.95 4.00 3.42 5.89 4.47 2.76 2.93 4.62 4.07 3.52 3.38<br />
Swain County 2000 2001 2002 2003 2000 2001 2002 2003 2000 2001 2002 2003<br />
Total Number<br />
<strong>of</strong> Students 163 163 165 170 766 802 827 827 532,765 549,770 597,161 586,159<br />
Total Number<br />
<strong>of</strong> Dropouts 11 9 5 9 33 38 20 32 24,596 22,365 21,046 19,834<br />
Dropout Rate<br />
(per 100 students) 6.75 5.52 3.03 5.29 4.31 4.74 2.42 3.87 4.62 4.07 3.52 3.38<br />
Wake County 2000 2001 2002 2003 2000 2001 2002 2003 2000 2001 2002 2003<br />
Total Number<br />
<strong>of</strong> Students 90 90 105 110 39,404 41,856 44,383 45,519 532,765 549,770 597,161 586,159<br />
Total Number<br />
<strong>of</strong> Dropouts 7 2 9 1 1,114 1,038 1,040 830 24,596 22,365 21,046 19,834<br />
Dropout Rate<br />
(per 100 students) 7.78 2.22 8.57 0.91 2.83 2.48 2.34 1.82 4.62 4.07 3.52 3.38<br />
Warren County 2000 2001 2002 2003 2000 2001 2002 2003 2000 2001 2002 2003<br />
Total Number<br />
<strong>of</strong> Students 70 75 77 78 1,429 1,438 1,514 1,548 532,765 549,770 597,161 586,159<br />
Total Number<br />
<strong>of</strong> Dropouts 2 4 3 2 116 89 71 60 24,596 22,365 21,046 19,834<br />
Dropout Rate<br />
(per 100 students) 2.86 5.33 3.90 2.56 8.12 6.19 4.69 3.88 4.62 4.07 3.52 3.38<br />
Charlotte-Mecklenburg 2000 2001 2002 2003 2000 2001 2002 2003 2000 2001 2002 2003<br />
Total Number<br />
<strong>of</strong> Students 162 167 177 192 40,699 41,928 43,529 45,581 47,555 549,770 597,161 586,159<br />
Total Number<br />
<strong>of</strong> Dropouts 14 13 14 17 2,401 2,133 1,909 1,639 1,500 22,365 21,046 19,834<br />
Dropout Rate<br />
(per 100 students) 7.78 7.91 8.85 5.90 5.09 4.39 3.60 3.15 4.62 4.07 3.52 3.38<br />
Source: <strong>Public</strong> <strong>Schools</strong> <strong>of</strong> <strong>North</strong> <strong>Carolina</strong>, Division <strong>of</strong> Accountability and Technology Services, 2002-03<br />
91
AP SCORES<br />
TABLE 10<br />
PERCENT OF AP TEST TAKERS SCORING 3 OR HIGHER BY ETHNICITY<br />
NORTH CAROLINA AND THE NATION, 2002 TO 2003<br />
2003 2002 2001 2000 1999<br />
US NC GAP US NC GAP US NC GAP US NC GAP US NC GAP<br />
American<br />
Indian 45.2 39.2 6.0 44.4 45.1 -0.7 42.7 41.8 0.9 49.8 45.7 4.1 48.0 41.9 6.1<br />
Asian 64.1 59.0 5.1 64.0 57.0 7.0 62.2 54.7 7.5 64.0 56.9 7.1 64.1 57.7 6.4<br />
Black 31.2 23.6 8.2 30.6 26.8 3.8 28.6 25.6 3.0 31.1 26.5 4.6 31.7 27.4 4.3<br />
Hispanic 50.5 53.6 -3.1 50.9 56.9 -6.0 50.5 51.3 -0.8 54.0 52.0 2.0 55.6 57.8 -2.2<br />
White 64.9 60.1 4.8 64.8 60.5 4.3 62.5 56.7 5.8 65.0 58.0 7.0 64.1 56.2 7.9<br />
All Students 61.5 56.0 5.5 61.4 56.9 4.5 59.5 53.7 5.8 62.1 55.4 6.7 61.9 54.2 7.7<br />
Note: Gap refers to the United States (US) percentage minus the <strong>North</strong> <strong>Carolina</strong> (NC) percentage.<br />
Data reflect public school students only.<br />
SOURCE: <strong>North</strong> <strong>Carolina</strong> State Summary Report, The College Board, 1999-2003.<br />
TABLE 11<br />
NUMBER AND PERCENTAGE OF AP TEST TAKERS BY ETHNICITY<br />
NORTH CAROLINA AND THE NATION, 2002 TO 2003<br />
Number and Percent <strong>of</strong> Test Takers<br />
<strong>North</strong> <strong>Carolina</strong><br />
Nation<br />
2003 2002 2003 2002<br />
Number Percent Number Percent Number Percent Number Percent<br />
American<br />
Indian 174 0.6 115 0.5 3,937 0.5 3,368 0.4<br />
Asian 1,413 5.1 1,147 4.8 95,441 11.5 87,065 11.6<br />
Black 3,020 10.9 2,438 10.1 44,587 5.4 38,862 5.2<br />
Hispanic 611 2.2 494 2.1 98,391 11.9 84,569 11.3<br />
White 21,497 78.2 18,984 78.8 541,597 65.4 494,243 65.8<br />
Other 908 3.3 906 3.8 44,534 5.4 42,955 5.7<br />
Total 27,623 100.0 24,084 100.0 828,487 100.0 751,062 100.0<br />
Note: Data reflect public public school students only.<br />
Percent columns may not total 100 due to rounding.<br />
SOURCE: <strong>North</strong> <strong>Carolina</strong> State Summary Report, The College Board, 2002 and 2003.<br />
92
SAT SCORES<br />
GRAPH 6<br />
Mean Total NC SAT Scores by Ethnicity — 1994–2003<br />
1200<br />
1150<br />
1100<br />
MEAN TOTAL SAT SCORE 1<br />
1050<br />
1000<br />
950<br />
900<br />
Asian 1021<br />
White 1008<br />
United States 1003<br />
1016<br />
1012<br />
1010<br />
887<br />
1018<br />
1017<br />
1013<br />
887<br />
1023<br />
1023<br />
1016<br />
Hispanic 956<br />
900<br />
1026<br />
1017<br />
1014<br />
984<br />
906<br />
1031<br />
1026<br />
1016<br />
966<br />
900<br />
1035<br />
1024<br />
1019<br />
970<br />
1041<br />
1031<br />
1020<br />
975<br />
897 891<br />
1046<br />
1025<br />
1020<br />
961<br />
914<br />
1052<br />
1050<br />
1026<br />
961<br />
923<br />
850<br />
American Indian 860<br />
Black 826<br />
830<br />
840<br />
834<br />
839<br />
837<br />
835<br />
835<br />
839<br />
839<br />
800<br />
1994 1995 1996 1997 1998 1999 2000 2001 2002 2003<br />
1<br />
All SAT scores are reported on the recentered score scale (1995).<br />
GRAPH 7<br />
Mean Total NC SAT Scores by Family Income Level — 2003<br />
1200<br />
1178<br />
1150<br />
MEAN TOTAL SAT SCORE 1<br />
1100<br />
1050<br />
1000<br />
950<br />
900<br />
850<br />
800<br />
White 967<br />
American Indian 905<br />
Asian 888<br />
Hispanic 885<br />
Black 787<br />
999<br />
964<br />
920<br />
872<br />
830<br />
1037<br />
1021<br />
918<br />
914<br />
853<br />
1096<br />
1019<br />
994<br />
949<br />
895<br />
1121<br />
1035<br />
1013<br />
962 962<br />
901<br />
1080<br />
1074<br />
912<br />
750<br />
700<br />
650<br />
600<br />
Under 20 20–35 35–50 50–60 60–70 Over 70<br />
Family Income (in Thousands <strong>of</strong> Dollars)<br />
1<br />
All SAT scores are reported on the recentered score scale (1995).<br />
93
APPENDICES<br />
Student making pottery at the Indian Education Resource Center in Pembroke, NC.<br />
Lower left pottery and woven basket by Angel Bradley (pictured right),<br />
Eastern Band <strong>of</strong> Cherokee, Smokey Mountain Elementary School, Jackson County
APPENDIX A<br />
American Indian Mascots, Descriptors, and Nicknames<br />
in <strong>Public</strong> <strong>Schools</strong> Across <strong>North</strong> <strong>Carolina</strong><br />
In February 2002, the NC State Advisory Council on Indian Education passed a resolution calling<br />
for the elimination <strong>of</strong> American Indian mascots and related imagery in <strong>North</strong> <strong>Carolina</strong>’s public<br />
schools. In its resolution, the Council stressed that American Indian descriptions naming<br />
mascots, logos and sports team nicknames are detrimental to the achievement, self-identity,<br />
self-concept, and self-esteem <strong>of</strong> American Indian students, and that they work contrary to both<br />
the State Board <strong>of</strong> Education’s strategic priority to ensure that schools provide a welcoming,<br />
caring, and inviting place for student learning and the strategic priority that all students achieve<br />
high performance in schools. The State Board <strong>of</strong> Education approved a recommendation<br />
in June 2002 strongly encouraging all educators in the public schools <strong>of</strong> <strong>North</strong> <strong>Carolina</strong> to<br />
educate themselves on the educational, curricular, and psychological effects <strong>of</strong> using<br />
American<br />
Indian sport mascots and logos. In addition, the State Board agreed that all public school<br />
administrators and local boards <strong>of</strong> education should review their policies and procedures<br />
toward the use <strong>of</strong> American Indian sport mascots, logos, and other demeaning imagery.<br />
In the past year, local boards <strong>of</strong> education across the state including districts such as Guilford<br />
County and Charlotte-Mecklenburg have reviewed and revised their policies for using American<br />
Indians or other existing ethnic groups as mascots, nicknames, or descriptors for school-related<br />
teams, clubs and organizations. In its February 2004 meeting, the NC State Advisory Council on<br />
Indian Education publicly commended these school districts for their responsive and definitive<br />
action. The Council agreed that local education agencies across the state should encourage<br />
continued commitment to their local plans <strong>of</strong> action aimed at increasing administrator, teacher,<br />
and student understanding <strong>of</strong> the negative impact <strong>of</strong> American Indian mascots and related<br />
imagery. At the direction <strong>of</strong> the State Board in 2002, the Council will request that districts still<br />
using American Indian mascots and related imagery to promptly examine their policies and<br />
the impact <strong>of</strong> those policies on the attitudes, cultural sensitivity, and cultural understanding <strong>of</strong><br />
both American Indian students and non-Indian students enrolled in their schools. The Council<br />
will provide a report on the status following the districts’ reporting.<br />
American Indian Studies Elective and Pr<strong>of</strong>essional<br />
Development for Teachers<br />
The State Board <strong>of</strong> Education approved the creation <strong>of</strong> an American Indian Studies elective<br />
for public high school students. The elective is part <strong>of</strong> the state curriculum and can be <strong>of</strong>fered<br />
in any high school in <strong>North</strong> <strong>Carolina</strong> by decision <strong>of</strong> the local school board. The American<br />
Indian Studies elective covers the histories, cultures, and oral literary traditions <strong>of</strong> the tribes<br />
native to <strong>North</strong> <strong>Carolina</strong>. American Indians are also increasingly visible in grades K-8 <strong>of</strong> the<br />
Standard Course <strong>of</strong> Study, the state defined curriculum.<br />
The existence <strong>of</strong> an American Indian Studies elective for high school students has created an<br />
immediate need for curricular resources and teacher training. A number <strong>of</strong> pr<strong>of</strong>essional development<br />
opportunities have been created across the state, but as yet, there is no coordination<br />
96
97<br />
in what programs or content are available to teachers and there is no central clearinghouse<br />
that inventories the resources and programs that are being developed. The Department <strong>of</strong><br />
<strong>Public</strong> Instruction partnered with LEARN NC, an online tool for instructional resources and<br />
pr<strong>of</strong>essional development geared toward teachers in <strong>North</strong> <strong>Carolina</strong>, to develop teacher<br />
education modules for the state’s American Indian Studies Elective. Teachers can also now<br />
access <strong>North</strong> <strong>Carolina</strong> Indian and <strong>North</strong> American Indian model lesson plans through LEARN<br />
NC. Another partnership with UNC-Pembroke and the Wildacres Leadership Initiative provided<br />
for the first time in July 2003, an institute on American Indian history and culture that was<br />
highly rated by participating teachers. The Council has heard anecdotally that a number <strong>of</strong><br />
other groups are providing training and producing curricular resources on American Indian<br />
history and culture, but these efforts are not part <strong>of</strong> a coordinated education initiative.
APPENDIX B<br />
A Decade <strong>of</strong> Progress in Education<br />
2003<br />
• <strong>North</strong> <strong>Carolina</strong> leads the nation in integrating<br />
No Child Left Behind into school accountability<br />
and improvement efforts.<br />
• <strong>North</strong> <strong>Carolina</strong> remains focused on: improving<br />
academic achievement for all students at all<br />
academic levels; ensuring that all students<br />
have access to highly qualified teachers;<br />
communicating with parents and<br />
communities about school performance;<br />
and, involving communities in locally-based<br />
education decisions.<br />
2001<br />
• The <strong>North</strong> <strong>Carolina</strong> General Assembly<br />
mandates, with support <strong>of</strong> the State Board <strong>of</strong><br />
Education and the Department <strong>of</strong> <strong>Public</strong><br />
Instruction, that the state include a 'closing the<br />
achievement gap' component when measuring<br />
schools on student academic growth.<br />
1999<br />
• The State Board <strong>of</strong> Education approves<br />
standards at third, fifth, and eighth grade that<br />
ensure students are working at grade level in<br />
reading, writing, and math before being<br />
promoted to the next grade.<br />
1996 – 1997<br />
• K-8 schools are first measured under the<br />
ABCs accountability program.<br />
• A rewards system is introduced providing cash<br />
bonuses to teachers and staff in schools that<br />
meet or exceed academic expectations.<br />
• 62 percent <strong>of</strong> students in grades 3-8 score at or<br />
above grade level in both reading and math.<br />
1992 – 1993<br />
• Statewide testing begins in reading and math<br />
for grades 3-8.<br />
• 53 percent <strong>of</strong> students perform at or above<br />
grade level in both reading and math.<br />
Raising Academic Achievement • Leading the Nation in Education Progress<br />
2002<br />
• The Federal No Child Left Behind Act is signed<br />
into law.<br />
• Law requires: holding schools accountable for<br />
all students performing at grade level; closing<br />
achievement gaps between student<br />
demographic groups; and having a highly<br />
qualified teacher in every classroom.<br />
• Student performance is up 22 percentage<br />
points from 1993; 75 percent <strong>of</strong> students in<br />
grades 3-8 test at or above grade level in both<br />
reading and math.<br />
2000<br />
• The State Board <strong>of</strong> Education starts holding<br />
high schools accountable for showing growth<br />
in individual student achievement in 10 major<br />
subject areas.<br />
• As a result, high schools are measured for<br />
both absolute academic achievement and<br />
for improvements in individual students'<br />
achievement.<br />
1997 – 1998<br />
• High schools are first measured under the ABCs<br />
accountability program.<br />
1995<br />
• State law introduces the ABCs <strong>of</strong> <strong>Public</strong><br />
Education comprehensive school improvement<br />
effort.<br />
• The ABCs accountability program requires<br />
sweeping education reforms: reorganizing and<br />
refocusing public schools through high<br />
academic standards, teaching the basics, and<br />
maximum local control.<br />
1989<br />
• The NC School Improvement and Accountability<br />
Act introduces statewide curriculum standards,<br />
testing programs, and annual performance<br />
report cards.<br />
98
APPENDIX C<br />
Understanding Education Accountability in<br />
<strong>North</strong> <strong>Carolina</strong>: The ABCs <strong>of</strong> <strong>Public</strong> Education<br />
Overview<br />
The ABCs <strong>of</strong> <strong>Public</strong> Education is <strong>North</strong> <strong>Carolina</strong>'s comprehensive school improvement effort.<br />
The result <strong>of</strong> a 1995 state law requiring sweeping education reforms and reorganization, the<br />
ABCs has focused public schools in three areas: strong accountability with an emphasis on<br />
high educational standards, teaching the basics, and maximum local control. Since its beginning,<br />
the ABCs program has been modified and improved to better portray school performance<br />
and to ensure that its measures are as fair and accurate as possible. The 2002-03 school year<br />
marks the seventh year <strong>of</strong> the ABCs for K-8 schools and the sixth year for high schools. The<br />
ABCs accountability model sets growth and performance standards for each elementary, middle<br />
and high school in the state. End-<strong>of</strong>-Grade (EOG) and End-<strong>of</strong>-Course (EOC) test results and<br />
selected other components are used to measure schools' growth and performance.<br />
What distinguishes the ABCs accountability model from other accountability models is the<br />
commitment to rewarding growth in student academic achievement over time. By focusing<br />
on both growth and overall performance, schools that make substantial progress in improving<br />
student achievement can be rewarded for their efforts before their students are performing at<br />
top levels. High-performing schools still are held accountable for the growth <strong>of</strong> each student,<br />
even after the student reaches grade-level pr<strong>of</strong>iciency.<br />
Performance standards are measured based on the absolute achievement or the percent <strong>of</strong><br />
students' scores at or above grade level. Growth standards are benchmarks set annually to<br />
measure a school's average progress or growth in student achievement.<br />
Student Assessment<br />
Students in grades 3-8 complete state ABCs End-<strong>of</strong>-Grade tests in reading and mathematics<br />
at the conclusion <strong>of</strong> each school year. High school students enrolled in the following<br />
courses complete state ABCs End-<strong>of</strong>-Course tests at the conclusion <strong>of</strong> each course:<br />
English I, Algebra I, Algebra II, Geometry, Biology, Chemistry, Physical Science, Physics,<br />
ELPS (Economic, Legal, and Political Systems), and US History.<br />
On every ABCs test, student performance is rated according to the following four<br />
performance levels:<br />
Level I:<br />
Level II:<br />
Students performing at this level do not have sufficient mastery <strong>of</strong> knowledge<br />
and skills in this grade level or subject area to be successful at the next grade<br />
level or at a more advanced level in this subject area.<br />
Students performing at this level demonstrate inconsistent mastery <strong>of</strong> knowledge<br />
and skills in this grade level or subject area and are minimally prepared to be<br />
successful at the next grade level or at a more advanced level in this subject area.<br />
Level III: Students performing at this level consistently demonstrate mastery <strong>of</strong> this subject<br />
matter and skills and are well prepared for the next grade level or for a more<br />
advanced level in this subject area.<br />
99
Level IV: Students performing at this level consistently perform in a superior manner<br />
clearly beyond that required to be pr<strong>of</strong>icient in this grade level or subject matter<br />
and are very well prepared for the next grade level or for a more advanced level<br />
in the subject area.<br />
School Evaluation and Recognition<br />
School performance is publicized annually by the State Board <strong>of</strong> Education for the following<br />
recognition categories:<br />
SCHOOL STATUS LABELS FOR 2003-2004<br />
PERFORMANCE LEVEL<br />
Based on Percent <strong>of</strong><br />
Students’ Scores at or Above<br />
Achievement Level III<br />
ACADEMIC GROWTH<br />
<strong>Schools</strong> Making Expected<br />
Growth or High Growth<br />
<strong>Schools</strong> Making Less<br />
than Expected Growth<br />
90% to 100%<br />
80% to 89%<br />
60% to 79%<br />
Met AYP<br />
AYP Not Met<br />
Honor School<br />
<strong>of</strong> Excellence<br />
School <strong>of</strong><br />
Excellence<br />
School <strong>of</strong> Distinction<br />
School <strong>of</strong> Progress<br />
No Recognition<br />
50% to 59%<br />
Priority School<br />
Less than 50%<br />
Priority School<br />
Low-Performing*<br />
* The term “low performing” applies to a school that does not meet the expected growth<br />
standard and less than 50% <strong>of</strong> its students are performing at or above Achievement Level III.<br />
Each year, as part <strong>of</strong> <strong>North</strong> <strong>Carolina</strong>'s ABCs Accountability program, elementary, middle, and<br />
high schools receive one or more ABCs designations based on their performance on the<br />
state's End-<strong>of</strong>-Grade/End-<strong>of</strong>-Course tests. These ABCs designations are awarded based on<br />
standards in two areas: 1) performance, the percentage <strong>of</strong> students testing at or above grade<br />
level, and, 2) growth, whether students have learned as much as they were expected to learn<br />
in one year.<br />
<strong>Schools</strong> that reach the state's highest performance and growth standards are eligible for<br />
incentive awards or other recognition. To be eligible for incentive awards, schools must test<br />
at least 98 percent <strong>of</strong> their eligible students in grades K-8 and 95 percent <strong>of</strong> students enrolled<br />
in specific courses in high school. <strong>Schools</strong> become designated low performing when<br />
their growth and performance fall below specified levels, and those schools may receive<br />
mandatory assistance based on action by the State Board <strong>of</strong> Education.<br />
Each year, every school receives one <strong>of</strong> the following ABCs designations: High Growth,<br />
Expected Growth, No Recognition, Priority School, or Low Performing. When schools meet<br />
or exceed the state's growth goals and satisfy the state's testing requirements, they can earn<br />
the following additional designations for commendable performance: School <strong>of</strong> Excellence,<br />
School <strong>of</strong> Distinction, or School <strong>of</strong> Progress.<br />
Incentives for high performance and sanctions for low performance are key elements <strong>of</strong> the<br />
ABCs. Teachers, principals and other certified staff, as well as teacher assistants, are eligible<br />
for cash incentives based on whether a school meets expected or high growth.<br />
100
One <strong>of</strong> the major strengths <strong>of</strong> the ABCs is the assistance provided to schools that are<br />
designated as low performing by the State Board <strong>of</strong> Education. State Assistance Teams may<br />
be assigned to low-performing schools to help the schools evaluate their teaching and<br />
learning environment and to provide services that will improve the education <strong>of</strong> all children<br />
attending those schools.<br />
Assistance Teams review all facets <strong>of</strong> school operation and assist in developing recommendations<br />
for improving student performance. The teams also evaluate all certified personnel assigned<br />
to the schools and make recommendations concerning their performance.<br />
School and Student Performance<br />
Since the ABCs began, the number <strong>of</strong> high performing schools in <strong>North</strong> <strong>Carolina</strong> has<br />
consistently grown. In 2002-03, more than 60 percent <strong>of</strong> <strong>North</strong> <strong>Carolina</strong> schools were <strong>Schools</strong><br />
<strong>of</strong> Excellence or <strong>Schools</strong> <strong>of</strong> Distinction, the state's two highest recognition categories,<br />
compared to a little over 10 percent in 1996-97. Between 1996-97 and 2002-03, the number<br />
<strong>of</strong> <strong>Schools</strong> <strong>of</strong> Excellence increased from 12 to 473 schools. In 2002-03, there were only 6<br />
low-performing schools statewide, down from 123 low-performing schools in the first year <strong>of</strong><br />
the program.<br />
The overall level <strong>of</strong> student achievement is improving under the ABCs. In 2001, the General<br />
Assembly mandated that, beginning in the 2002-03 school year, the state include a “closing<br />
the achievement gap” component in its measurement <strong>of</strong> student growth. Although there have<br />
been improvements in the academic performance <strong>of</strong> students in every demographic group<br />
under the ABCs, the performance gap between white and minority students has persisted.<br />
PERCENT OF STUDENTS AT OR ABOVE GRADE LEVEL<br />
IN BOTH READING AND MATH, GRADES 3-8<br />
All students American Indian White students<br />
statewide students statewide statewide<br />
2002-03 80.8 percent 72.3 percent 88.8 percent<br />
1996-97 61.7 percent 42.9 percent 72.7 percent<br />
By following the annual performance <strong>of</strong> demographic subgroups <strong>of</strong> students, the state is<br />
able to chart its progress in closing gaps between groups and to direct its resources to those<br />
students who need them most.<br />
For more information about the ABCs, please go to http://www.ncpublicschools.org/abcs/ or<br />
contact your local school district superintendent. A list <strong>of</strong> <strong>North</strong> <strong>Carolina</strong> superintendents and<br />
contact information can be found at: www.ncpublicschools.org/nceddirectory/.<br />
101
APPENDIX D<br />
No Child Left Behind: Our <strong>Schools</strong> and the Federal<br />
Education Law<br />
No Child Left Behind (NCLB), signed into federal law by President George W. Bush in 2002, is<br />
having a tremendous impact on <strong>North</strong> <strong>Carolina</strong>’s public schools. The legislation represents the<br />
largest ever expansion <strong>of</strong> involvement in K-12 education by the federal government. Several<br />
key parts <strong>of</strong> the new Act are well aligned with <strong>North</strong> <strong>Carolina</strong>’s ABCs <strong>of</strong> <strong>Public</strong> Education<br />
accountability program and the major education initiatives already underway in our state. No<br />
Child Left Behind measures student and school performance, establishes standards for<br />
teacher qualifications, and involves parents and communities in education-related decision<br />
making.<br />
Adequate Yearly Progress Standards<br />
The federal No Child Left Behind Act requires <strong>North</strong> <strong>Carolina</strong> to establish a set <strong>of</strong> standards<br />
for determining whether the state's schools are making Adequate Yearly Progress (AYP).<br />
Beginning with a baseline from the 2001-02 school year, schools must make AYP every school<br />
year. Adequate Yearly Progress is determined based on a series <strong>of</strong> incrementally higher<br />
performance targets in reading and math culminating in the goal that all students (100%)<br />
reach grade level standards or higher by 2013-14. Based on federal guidelines, the State Board<br />
<strong>of</strong> Education has set the following AYP performance targets for the school year, 2003-04:<br />
<strong>Schools</strong> Offering Grades K-8 Must Have<br />
• A 90 percent daily attendance rate or improvement (0.1 percentage point) from the<br />
previous year.<br />
• 68.9 percent <strong>of</strong> the entire school testing at or above grade level in reading, and<br />
68.9 percent <strong>of</strong> students from every demographic subgroup <strong>of</strong> over 40 students –<br />
including American Indians – testing at or above grade level in reading as measured<br />
by the state's End-<strong>of</strong>-Grade tests given in grades 3-8.<br />
• 74.6 percent <strong>of</strong> the entire school testing at or above grade level in math, and 74.6<br />
percent <strong>of</strong> students from every demographic subgroup <strong>of</strong> over 40 students –<br />
including American Indians – testing at or above grade level in math as measured<br />
by the state's End-<strong>of</strong>-Grade tests given in grades 3-8.<br />
<strong>Schools</strong> Offering Grades 9-12 Must Have<br />
• A 90 percent graduation rate or improvement (0.1 percentage point) from the<br />
previous year.<br />
• 52.0 percent <strong>of</strong> all 10th graders testing at or above grade level in reading, and<br />
52.0 percent <strong>of</strong> students from every demographic subgroup <strong>of</strong> over 40 students –<br />
including American Indians – testing at or above grade level in reading as measured<br />
by the state's 10th Grade Comprehensive Test in Reading.<br />
• 54.9 percent <strong>of</strong> all 10th graders testing at or above grade level in math, and 54.9<br />
percent <strong>of</strong> students from every demographic subgroup <strong>of</strong> over 40 students –<br />
including American Indians – testing at or above grade level in math as measured<br />
by the state's 10th Grade Comprehensive Test in Mathematics.<br />
102
The disaggregation <strong>of</strong> data for the student demographic subgroups is an important part <strong>of</strong><br />
identifying and developing high quality programs and strategies for closing minority achievement<br />
gaps. School test results for 2002-03, broken into subgroups, are available on the <strong>Public</strong><br />
<strong>Schools</strong> <strong>of</strong> <strong>North</strong> <strong>Carolina</strong> Web site, www.ncpublicschools.org. If even one subgroup in one<br />
subject area in a school does not meet NCLB standards, the school will not meet Adequate<br />
Yearly Progress standards. In the 2002-03 school year, 47 percent <strong>of</strong> <strong>North</strong> <strong>Carolina</strong>’s schools<br />
made Adequate Yearly Progress.<br />
<strong>Schools</strong> that receive Title I federal funding and fail to make Adequate Yearly Progress (AYP) for<br />
two consecutive years enter into School Improvement Status. Once a school enters School<br />
Improvement Status, it must meet Adequate Yearly Progress (AYP) for two consecutive years<br />
in order to be removed from improvement status. <strong>Schools</strong> in School Improvement face sanctions<br />
that increase in severity each year the school remains in school improvement. For more<br />
information about AYP and the No Child Left Behind Act, visit www.ncpublicschools.org/nclb.<br />
Teacher Quality Standards<br />
One <strong>of</strong> the important provisions <strong>of</strong> the No Child Left Behind Act is a requirement that, by June<br />
30, 2006, all teachers <strong>of</strong> core academic subjects must be "highly qualified." <strong>North</strong> <strong>Carolina</strong><br />
already has rigorous standards for teacher licensure and this new federal law adds one more<br />
way in which teacher qualification can be measured. In 2002-03, 83 percent <strong>of</strong> teachers across<br />
the state met the federal "highly qualified" definition.<br />
"Highly qualified" teachers are generally defined as teachers who are fully licensed (also called<br />
certified) by the state. They hold at least a bachelor's degree from a four-year institution, and<br />
they demonstrate competence in the subject area(s) they teach. The standards for "highly qualified"<br />
only apply to teachers in core subject areas: English, reading, language arts, mathematics,<br />
science, foreign languages, civics and government, social studies, economics, arts, history,<br />
geography, and kindergarten through Grade 6 (K-6). The federal regulations do not apply to<br />
non-core subject area teachers such as vocational teachers or physical education teachers.<br />
Teachers can demonstrate subject area competence in a number <strong>of</strong> ways, ranging from national<br />
board certification or passing scores on pr<strong>of</strong>essional exams, to completion <strong>of</strong> an academic<br />
major or a master's or doctoral degree in the subject area taught.<br />
Federal regulations regarding "highly qualified" teachers have multiple rules that are applied<br />
in various ways and for various circumstances. For example, a veteran elementary school<br />
teacher with 25 years <strong>of</strong> experience and a doctoral degree might not be considered highly<br />
qualified by federal definition. If the teacher were licensed by <strong>North</strong> <strong>Carolina</strong> before a subject<br />
area-teaching exam was required for certification, even with his doctoral degree and 25 years<br />
<strong>of</strong> experience, this teacher would not demonstrate "competence" according to federal rules. So<br />
while this teacher may be an extremely well qualified teacher, his qualifications do not meet<br />
the federal definition. Eventually, this teacher is likely to pass a federally mandated exam, but<br />
until then he will not be considered “highly qualified” according to No Child Left Behind.<br />
Many effective, quality teachers may not currently meet the federal definition <strong>of</strong> "highly qualified,"<br />
but the state expects its numbers <strong>of</strong> "highly qualified" teachers to increase as rules<br />
become more clear and requirements are fully communicated to teachers.<br />
In schools with federal Title I funding, parents may ask their school district about the<br />
qualifications <strong>of</strong> their child's teacher. Parents may request the following information:<br />
• Has a child's teacher met <strong>North</strong> <strong>Carolina</strong>'s teacher licensing requirements?<br />
In what areas is the teacher certified/licensed?<br />
• Has a child's teacher had any licensure requirements waived?<br />
• What degrees does a child's teacher hold and with what academic majors?<br />
103
In addition, parents <strong>of</strong> children attending schools with federal Title I funding must be<br />
notified when their child is taught a core academic subject for four or more consecutive<br />
weeks by a teacher who does not meet "highly qualified" standards. For more information<br />
about highly qualified teachers and parent communications in Title I funded schools, visit<br />
www.ncpublicschools.org/nclb.<br />
John Jacobs, Lumbee<br />
Southeast High School, Guilford County<br />
104
APPENDIX E<br />
List <strong>of</strong> Parent Interviewees<br />
The Council would like to extend its grateful thanks to the following parents and<br />
grandparents who shared their time, their thoughts, and their insights on education<br />
and parent involvement for this report.<br />
Jeff Anstead, Haliwa-Saponi, Warren County<br />
Sadie Barber, Coharie, Sampson County<br />
Daniel Bell, Coharie/Lumbee, Chapel Hill<br />
Kimberly Bird, Sappony, Mecklenburg County & Person County<br />
Henry Brewer, Lumbee, Robeson County<br />
Sabrina Dew, Lumbee, Robeson County<br />
Eddie Epps, Sappony, Wake County<br />
Isabelle Freeman, Coharie, Harnett County<br />
Sandra Hunt, Coharie, Guilford County<br />
Angela Hurley, Occaneechi, Alamance County<br />
Sue Jacobs, Waccamaw-Siouan<br />
Anthony Locklear, Lumbee, Wake County<br />
Glenn Martin, Sappony, Person County<br />
Annette Raines, Lumbee, Wake County<br />
Ronald Richardson, Haliwa-Saponi, Halifax County<br />
Kay Roberts, Lumbee, Robeson County<br />
Nora Dial Stanley, Lumbee, Forsyth County<br />
Delton Stewart, Sappony, Person County<br />
Gary Strickland, Lumbee, Robeson County<br />
While these volunteer contributors do not represent the full breadth <strong>of</strong> <strong>North</strong> <strong>Carolina</strong>’s American<br />
Indian communities, they are a diverse group. They are mothers, fathers, and grandparents; they<br />
are from single and two parent households; their occupations range widely and some work<br />
more than one job; their children or their grandchildren range from pre-kindergarten to seniors in<br />
high school, and they live in rural and urban communities. Some parents were interviewed in<br />
their home communities in March 2004 and others were interviewed at the <strong>North</strong> <strong>Carolina</strong> Indian<br />
Unity Conference held in Raleigh, <strong>North</strong> <strong>Carolina</strong> from March 11-13, 2004. Additional parents were<br />
interviewed for this report, but their names are not included here at their request.<br />
105
APPENDIX F<br />
List <strong>of</strong> Resources for Parents and Communities<br />
The following resources are meant to provide information that might be useful to the readers.<br />
These resources do not constitute endorsement by the NC Department <strong>of</strong> <strong>Public</strong> Instruction or<br />
the NC American Indian Council.<br />
<strong>North</strong> <strong>Carolina</strong> <strong>Public</strong> <strong>Schools</strong><br />
NC SCHOOL REPORT CARDS<br />
Provides detailed data about public school and school district in <strong>North</strong> <strong>Carolina</strong>.<br />
www.ncreportcards.org<br />
NC ABCS OF PUBLIC EDUCATION<br />
Provides details about <strong>North</strong> <strong>Carolina</strong>’s public school accountability program that started in<br />
1995, including information about school performance standards and annual school ABCs<br />
designations. www.ncpublicschools.org/abcs<br />
Educational Programs<br />
21ST CENTURY COMMUNITY LEARNING CENTERS<br />
U.S. Secretary <strong>of</strong> Education Rod Page announced the award <strong>of</strong> nearly $206 million in new<br />
21st Century Community Learning Center grants. The new grants will go to 308 school<br />
districts, working in partnership with community-based organizations, to establish centers<br />
in 1,420 rural and inner-city public schools. http://www.ed.gov/21steele/<br />
CENTER FOR MULTILINGUAL MULTICULTURAL RESEARCH<br />
The center is an organized research unit at the University <strong>of</strong> Southern California, facilitating<br />
the research collaboration, dissemination and pr<strong>of</strong>essional development activities <strong>of</strong> faculty,<br />
students, and others across School <strong>of</strong> Education, university outside organizational lines. The<br />
center provides a base for those interested in multilingual education, multicultural education<br />
and other related areas; and the opportunity to come together for research and program<br />
collaboration. http://www.usc.edu/dept/education/CMMR<br />
GEAR UP<br />
The mission <strong>of</strong> GEAR UP is to significantly increase the number <strong>of</strong> low-income students<br />
who are prepared to enter and succeed in postsecondary education. The Executive Director<br />
<strong>of</strong> GEAR UP NC is Anthony Locklear. http://www.ncmentor.org/gear_up/<br />
TRIO PROGRAM<br />
The TRIO programs are educational opportunity outreach programs designed to motivate and<br />
support students. U.S. Department <strong>of</strong> Education, 1990 K Street, N.W., 7th floor Washington, DC<br />
20006-8510 http://www.ed.gov/about/<strong>of</strong>fices/list/ope/trio/index.html<br />
106
INROADS<br />
Inroads <strong>of</strong>fers corporate internships, educational support and training programs to talented<br />
minority college students. Inroads works to develop and place talented minority youth in<br />
business and industry and prepare them for corporate and community leadership. Inroads<br />
has affiliates in Charlotte and in Raleigh/Durham/Chapel Hill/Greensboro.<br />
http://www.inroads.org/<br />
NATIONAL INDIAN EDUCATION ASSOCIATION<br />
The National Indian Education Association supports traditional Native cultures and values,<br />
enables Native learners to become contributing members <strong>of</strong> their communities, promotes<br />
Native control <strong>of</strong> educational institutions, and improves educational opportunities and<br />
resources for American Indians and Alaska Natives throughout the United States.<br />
http://www.niea.org/<br />
BUREAU OF INDIAN AFFAIRS, OFFICE OF INDIAN EDUCATION<br />
The Bureau <strong>of</strong> Indian Affairs, Office <strong>of</strong> Indian Education Programs is a service organization<br />
devoted to providing quality education opportunities for American Indian people. Established<br />
in the latter part <strong>of</strong> the nineteenth century to carry out the federal government’s education<br />
commitment to Indian tribes, it has become the only national education system for American<br />
Indian children and adults. http://www.oiep.bia.edu/<br />
Clearinghouses for American Indian Resources and Educational Links<br />
CANKU OTA<br />
An online newsletter celebrating Native America. Access a wealth <strong>of</strong> information about<br />
American Indian educational resources at www.turtletrack.org under “Cool links.”<br />
Bibliography <strong>of</strong> Native American centers, schools, colleges, universities and research:<br />
http://cobalt.lang.osaka-u.ac.jp/~krkvls/edu.html<br />
Tribal colleges, Native Studies programs, and Indian Education:<br />
http://www.nativeculture.com/lisamitten/education.html<br />
Native American research and information sites maintained by the Educational Technology<br />
Center – KSU in Kennesaw, GA: http://edtech.kennesaw.edu/web/natam.html<br />
Scholarship and Financial Aid Information<br />
AMERICAN INDIAN COLLEGE FUND<br />
Based in Denver, with <strong>of</strong>fices in New York City, the nonpr<strong>of</strong>it College Fund was created in 1989<br />
to raise private support for scholarships, endowments and public awareness for Native higher<br />
education. In 1999 alone, the Fund has raised more than $33 million on behalf <strong>of</strong> the 30 tribal<br />
colleges it was founded to support. http://www.collegefund.org/<br />
CATCHING THE DREAM<br />
Provides help with writing essays for college and also provides assistance when obtaining and<br />
applying for scholarships. Dr. Dean Chavers, director. Phone # (505) 262-2351<br />
ctd4deanchavers@aol.com<br />
107
COLLEGE FOUNDATION OF NORTH CAROLINA<br />
The College Foundation <strong>of</strong> <strong>North</strong> <strong>Carolina</strong> is a nonpr<strong>of</strong>it partnership between Pathways <strong>of</strong><br />
<strong>North</strong> <strong>Carolina</strong>, College Foundation, Inc., and the <strong>North</strong> <strong>Carolina</strong> State Education Assistance<br />
Authority. These organizations have broad expertise in helping students to prepare successfully<br />
for college and to find the best financial aid alternatives. Together they provide a complete and<br />
comprehensive source <strong>of</strong> information for students and their families. http://www.cfnc.org/<br />
FAFSA (FREE APPLICATION FOR FEDERAL STUDENT AID)<br />
Prospective college students can apply for federal financial aid through the Free Application for<br />
US Federal Student Aid (FAFSA), a service <strong>of</strong> the US Education Department.<br />
http://www.fafsa.ed.gov/<br />
GATES MILLENNIUM SCHOLARS PROGAM<br />
The Gates Millennium Scholars Program, administered by the United Negro College Fund, will<br />
provide scholarships and fellowships for outstanding low-income African-American, Native<br />
American, Hispanic American, and Asian-Pacific American students to attend the undergraduate<br />
and graduate institutions <strong>of</strong> their choice. http://www.gmsp.org<br />
SCHOLARSHIP AND GRANT PAGE FOR NATIVE AMERICAN STUDENTS<br />
General Information for financial aid including a detailed list <strong>of</strong> Native American scholarships<br />
http://www.uncc.edu/kvjohnso/<br />
108
APPENDIX G<br />
Tribal Organizations in <strong>North</strong> <strong>Carolina</strong><br />
109<br />
COHARIE INTRA-TRIBAL COUNCIL<br />
7531 N. U.S. Hwy 421<br />
Clinton, NC 28328<br />
Elizabeth Maynor, Executive Director<br />
Phone: 910-564-6909<br />
FAX: 910-564-2701<br />
CUMBERLAND COUNTY ASSOCIATION<br />
FOR INDIAN PEOPLE<br />
200 Indian Drive<br />
Fayetteville, NC 28301<br />
Gladys Hunt, Executive Director<br />
Phone: 910-483-8442<br />
FAX: 910-483-8742<br />
Email: ccaip@onp.wdsc.org<br />
EASTERN BAND OF CHEROKEE<br />
P. O. Box 455<br />
Cherokee, NC 28719<br />
Michelle Hicks, Principal Chief<br />
Phone: 828-497-2771<br />
FAX: 828-497-7007<br />
Email: mhicks@nc-cherokee.com<br />
GUILFORD NATIVE AMERICAN ASSOCIATION<br />
P. O. Box 5623<br />
Greensboro, NC 27435<br />
Rick Oxendine, Executive Director<br />
Phone: 336-273-8686<br />
FAX: 336-272-2925<br />
HALIWA-SAPONI TRIBE, INC.<br />
P. O. Box 99, 39129 Hwy. 561<br />
Hollister, NC 27844<br />
Mr. Archie Lynch, Executive Director<br />
Phone: 252-586-4017<br />
FAX: 252-586-3918<br />
Email: alynch@coastalnet.com<br />
MEHERRIN INDIAN TRIBE<br />
P. O. Box 508<br />
Winton, NC 27986<br />
Denyce Hall, Executive Director<br />
Thomas Lewis, Tribal Chairman<br />
Phone: 252-398-3321<br />
FAX: 252-396-0334<br />
Email: meherrin@inteliport.com<br />
METROLINA NATIVE AMERICAN ASSOCIATION<br />
8001 W. Tryon Street<br />
Charlotte, NC 28262<br />
Letha Strickland, Executive Director<br />
Phone: 704-926-1524<br />
FAX: 704-347-0888<br />
Email: mnaa2000@excite.com<br />
NORTH CAROLINA COMMISSION OF INDIAN AFFAIRS<br />
217 West Jones Street<br />
Raleigh, NC 27699-1317<br />
Gregory Richardson, Executive Director<br />
Phone: 919-733-5998<br />
FAX: 919-733-1207<br />
OCCANEECHI BAND OF SAPONI NATION<br />
207 E. Center Street<br />
Mebane, NC 27302<br />
William Hayes, Chairman<br />
Phone: 919-304-3723<br />
FAX: 919-304-3724<br />
Email: obsn@mebtel.net<br />
SAPPONY<br />
High Plains Indians, Inc., for the Sappony<br />
P. O. Box 1101<br />
Roxboro, NC 27573<br />
Dante Desiderio, Executive Director<br />
Phone: 434-585-3352<br />
Email: sappony@msn.com<br />
TRIANGLE NATIVE AMERICAN SOCIETY<br />
P. O. Box 26841<br />
Raleigh, NC 27611<br />
La-Tonya Locklear, President<br />
Phone: 919-463-0164<br />
TRIBAL COUNCIL OF THE LUMBEE TRIBE<br />
P. O. Box 2709<br />
Pembroke, NC 28372<br />
Mr. Leon Jacobs, Tribal Administrator<br />
Phone: 910-521-7861<br />
FAX: 910-521-7790<br />
Email: leon.jacobs@lumbeetribe.com<br />
UNITED TRIBES OF N.C.<br />
c/o Cumberland Co. Assoc. for Indian People<br />
200 Indian Drive<br />
Fayetteville, NC 28301<br />
Gladys Hunt, President<br />
Phone: 910-483-8442<br />
FAX: 910-483-8742<br />
WACCAMAW SIOUAN DEVELOPMENT ASSOCIATION<br />
P. O. Box 69<br />
Bolton, NC 28423<br />
Archie Jacobs, Tribal Council Chair<br />
Phone: 910-655-9551<br />
FAX: 910-655-8779
APPENDIX H<br />
Council Members and Staff<br />
DANIEL BELL<br />
UNC American Indian Studies<br />
CB 3520 Greenlaw Hall<br />
Chapel Hill NC 27514<br />
ROSEANNA BELT<br />
WCU – Cherokee Center<br />
1594 Acquoni Road<br />
Cherokee NC 28719<br />
KIMBERLY BIRD<br />
11431 Longhedge Lane<br />
Charlotte NC 28273<br />
THERESA BLANKS<br />
5263 Pocosin Road<br />
Lake Waccamaw NC 28450<br />
DOROTHY STEWART CROWE<br />
156 Cherokee Lane<br />
Roxboro NC 27574<br />
VELINA HAMMOND EBERT<br />
PO Box 2326<br />
Kernersville NC 27285<br />
RITA LOCKLEAR, Vice Chairperson<br />
957 Lonnie Farm Road<br />
Pembroke NC 28372<br />
ANGELA LYNCH<br />
1713 Old Barn Road<br />
Rocky Mount NC 27805<br />
LOUISE C. MAYNOR, Chairperson<br />
1626 University Drive<br />
Durham NC 27707<br />
VIVIAN CARTER MAYNOR<br />
PO Box 315<br />
Clinton NC 28329<br />
DEBORAH ANN MOUNTAIN<br />
PO Box 568<br />
Grandy NC 27838<br />
TERRIE QADURA<br />
4117 Brewster Drive<br />
Raleigh NC 27606<br />
EARLENE J. STACKS<br />
910 Lansdowne Road<br />
Charlotte NC 28270<br />
RONNIE SUTTON<br />
NC House <strong>of</strong> Representatives<br />
PO Box 787<br />
Pembroke NC 28372<br />
Staff to the Council<br />
Zoe W. Locklear, Ph.D.<br />
Associate State Superintendent<br />
Leadership Development & Special Services<br />
Priscilla J. Maynor<br />
Senior Assistant to the State Superintendent<br />
for Communications and Information<br />
Office <strong>of</strong> the State Superintendent<br />
Norma Quiñones, Consultant<br />
Closing the Achievement Gap Section<br />
Division <strong>of</strong> School Improvement<br />
Benita Tipton<br />
State Superintendent’s Representative<br />
Teacher Development Services<br />
Division <strong>of</strong> School Improvement<br />
110
APPENDIX I<br />
References<br />
Cleary, Linda M. and Peacock, Thomas D. Collected Wisdom: American Indian Education,<br />
Needham Heights, MA: Allyn and Bacon,1998.<br />
The College Board, Inc. State <strong>of</strong> <strong>North</strong> <strong>Carolina</strong> SAT/AP Annual Summary Report 2002-03.<br />
Princeton, NJ: The College Board, 2003.<br />
Orfield, G., Losen, D., Wald, J., & Swanson, C. Losing Our Future: How Minority Youth<br />
are Being Left Behind by the Graduation Rate Crisis. Cambridge, MA: The Civil Rights<br />
Project at Harvard University. Contributors: Advocates for Children <strong>of</strong> New York,<br />
The Civil Society Institute, 2004.<br />
<strong>Public</strong> <strong>Schools</strong> <strong>of</strong> <strong>North</strong> <strong>Carolina</strong>. Statistical Pr<strong>of</strong>ile 2003. Raleigh, NC: NCDPI, 2003.<br />
<strong>Public</strong> <strong>Schools</strong> <strong>of</strong> <strong>North</strong> <strong>Carolina</strong>, Division <strong>of</strong> Accountability and Technology<br />
Services. 2002-03 State Testing Results. Raleigh, NC: NCDPI, 2003.<br />
<strong>Public</strong> <strong>Schools</strong> <strong>of</strong> <strong>North</strong> <strong>Carolina</strong>, Division <strong>of</strong> School Improvement. Dropout Data<br />
Report 2002-03. Raleigh, NC: NCDPI, 2004.<br />
Snipp, C. Matthew. American Indian and Alaska Native Children in the 2000 Census.<br />
A KIDS COUNT/PRB Report on Census 2000. The Annie. E Casey Foundation and<br />
The Population Reference Bureau, 2002.<br />
State Advisory Council on Indian Education. Remaining and Becoming: 2003 Report<br />
to the State Board <strong>of</strong> Education. Raleigh, NC: NCDPI, 2003.<br />
University <strong>of</strong> <strong>North</strong> <strong>Carolina</strong> General Administration, Office <strong>of</strong> the President,<br />
Program Assessment Division. Graduation Rates <strong>of</strong> First-Time Full-Time Freshman at<br />
UNC Institutions. , February, 2004.<br />
U.S. Department <strong>of</strong> Commerce, Bureau <strong>of</strong> the Census. Current Population Survey.<br />
Washington, DC: U.S. Census Bureau, 2000.<br />
Wehlage, Gary G., et al. Reducing the Risk: <strong>Schools</strong> as Communities <strong>of</strong> Support.<br />
London: The Falmer Press, 1989.<br />
111
The Council extends its thanks and its warm appreciation to<br />
those contributing to the 2004 Indian Education Report.<br />
Sue Vaughn, photographer, Guilford Native American Association, for photographs<br />
contained in this report.<br />
Velina Hammond Ebert, Rita Locklear and Roseanna Belt, for photographs contained<br />
in this report.<br />
THE FOLLOWING STUDENTS FOR CONTRIBUTING THEIR ARTWORK TO THIS REPORT:<br />
Angel Bradley, Eastern Band <strong>of</strong> Cherokee, Smokey Mountain Elementary School,<br />
Jackson County<br />
John Jacobs, Lumbee, Southeast High School, Guilford County<br />
Kimberly Bird, Norma Quiñones, Dorothy Crowe, Rita Locklear, Daniel Bell, Benita<br />
Tipton, and Velina Hammond Ebert for conducting parent interviews.<br />
Norma Quiñones, School Improvement Division, Raising Achievement and Closing Gaps<br />
Section, <strong>North</strong> <strong>Carolina</strong> Department <strong>of</strong> <strong>Public</strong> Instruction, for staffing the State Advisory<br />
Council on Indian Education, for updating and collecting student data, and for facilitating the<br />
production <strong>of</strong> this report.<br />
Benita Tipton, School Improvement Division, Teacher Development Section, <strong>North</strong> <strong>Carolina</strong><br />
Department <strong>of</strong> <strong>Public</strong> Instruction, for staffing the State Advisory Council on Indian Education,<br />
for information gathering and organization, and for facilitating the production <strong>of</strong> this report.<br />
Priscilla Maynor, Senior Assistant to the State Superintendent for Communications and<br />
Information, and Zoe Locklear, Associate Superintendent for Leadership Development and<br />
Special Services, <strong>North</strong> <strong>Carolina</strong> Department <strong>of</strong> <strong>Public</strong> Instruction, for their guidance and their<br />
substantial input into this report.<br />
Amanda Kittelberger, for writing and editing this report in collaboration with Council members.<br />
Allison Lowry for sharing the wisdom and the legacy <strong>of</strong> her husband, Derek Lowry. We also<br />
thank Mr. and Mrs. Winford Lowry, parents <strong>of</strong> Derek Lowry.<br />
Connie Hedgepeth and the Haliwa-Saponi Tribe, Inc., for background information used<br />
in this report.<br />
Rick Oxendine and the Guilford Native American Association, for photographs and<br />
background information used in this report.<br />
The Sappony Tribe, for photographs and background information used in this report.<br />
Greg Richardson, Mickey Locklear, and the <strong>North</strong> <strong>Carolina</strong> Commission <strong>of</strong> Indian<br />
Affairs, for background information used in this report and resources provided in the appendix.<br />
Laura Weakland, graphic designer, Communications and Information Division,<br />
Department <strong>of</strong> <strong>Public</strong> Instruction, for report design and publication.<br />
112