pdf, 2.0mb - Public Schools of North Carolina
pdf, 2.0mb - Public Schools of North Carolina
pdf, 2.0mb - Public Schools of North Carolina
You also want an ePaper? Increase the reach of your titles
YUMPU automatically turns print PDFs into web optimized ePapers that Google loves.
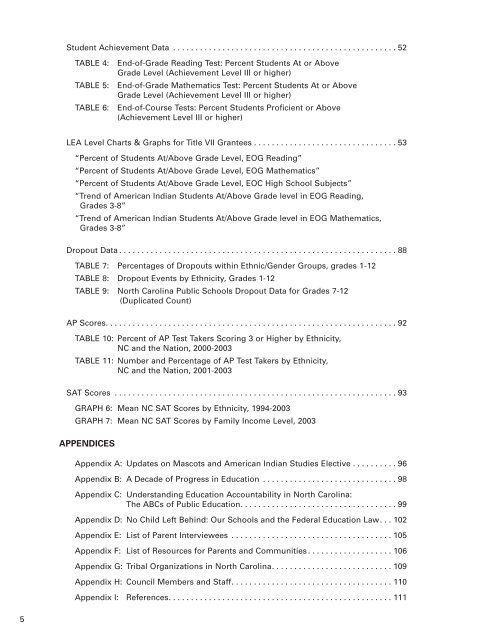
Student Achievement Data . . . . . . . . . . . . . . . . . . . . . . . . . . . . . . . . . . . . . . . . . . . . . . . . . . 52<br />
TABLE 4: End-<strong>of</strong>-Grade Reading Test: Percent Students At or Above<br />
Grade Level (Achievement Level III or higher)<br />
TABLE 5: End-<strong>of</strong>-Grade Mathematics Test: Percent Students At or Above<br />
Grade Level (Achievement Level III or higher)<br />
TABLE 6: End-<strong>of</strong>-Course Tests: Percent Students Pr<strong>of</strong>icient or Above<br />
(Achievement Level III or higher)<br />
LEA Level Charts & Graphs for Title VII Grantees . . . . . . . . . . . . . . . . . . . . . . . . . . . . . . . . 53<br />
“Percent <strong>of</strong> Students At/Above Grade Level, EOG Reading”<br />
“Percent <strong>of</strong> Students At/Above Grade Level, EOG Mathematics”<br />
“Percent <strong>of</strong> Students At/Above Grade Level, EOC High School Subjects”<br />
“Trend <strong>of</strong> American Indian Students At/Above Grade level in EOG Reading,<br />
Grades 3-8”<br />
“Trend <strong>of</strong> American Indian Students At/Above Grade level in EOG Mathematics,<br />
Grades 3-8”<br />
Dropout Data . . . . . . . . . . . . . . . . . . . . . . . . . . . . . . . . . . . . . . . . . . . . . . . . . . . . . . . . . . . . . . 88<br />
TABLE 7: Percentages <strong>of</strong> Dropouts within Ethnic/Gender Groups, grades 1-12<br />
TABLE 8: Dropout Events by Ethnicity, Grades 1-12<br />
TABLE 9: <strong>North</strong> <strong>Carolina</strong> <strong>Public</strong> <strong>Schools</strong> Dropout Data for Grades 7-12<br />
(Duplicated Count)<br />
AP Scores. . . . . . . . . . . . . . . . . . . . . . . . . . . . . . . . . . . . . . . . . . . . . . . . . . . . . . . . . . . . . . . . . 92<br />
TABLE 10: Percent <strong>of</strong> AP Test Takers Scoring 3 or Higher by Ethnicity,<br />
NC and the Nation, 2000-2003<br />
TABLE 11: Number and Percentage <strong>of</strong> AP Test Takers by Ethnicity,<br />
NC and the Nation, 2001-2003<br />
SAT Scores . . . . . . . . . . . . . . . . . . . . . . . . . . . . . . . . . . . . . . . . . . . . . . . . . . . . . . . . . . . . . . . 93<br />
GRAPH 6: Mean NC SAT Scores by Ethnicity, 1994-2003<br />
GRAPH 7: Mean NC SAT Scores by Family Income Level, 2003<br />
APPENDICES<br />
Appendix A: Updates on Mascots and American Indian Studies Elective . . . . . . . . . . 96<br />
Appendix B: A Decade <strong>of</strong> Progress in Education . . . . . . . . . . . . . . . . . . . . . . . . . . . . . . 98<br />
Appendix C: Understanding Education Accountability in <strong>North</strong> <strong>Carolina</strong>:<br />
The ABCs <strong>of</strong> <strong>Public</strong> Education. . . . . . . . . . . . . . . . . . . . . . . . . . . . . . . . . . . 99<br />
Appendix D: No Child Left Behind: Our <strong>Schools</strong> and the Federal Education Law. . . 102<br />
Appendix E: List <strong>of</strong> Parent Interviewees . . . . . . . . . . . . . . . . . . . . . . . . . . . . . . . . . . . . 105<br />
Appendix F: List <strong>of</strong> Resources for Parents and Communities . . . . . . . . . . . . . . . . . . . 106<br />
Appendix G: Tribal Organizations in <strong>North</strong> <strong>Carolina</strong>. . . . . . . . . . . . . . . . . . . . . . . . . . . 109<br />
Appendix H: Council Members and Staff. . . . . . . . . . . . . . . . . . . . . . . . . . . . . . . . . . . . 110<br />
Appendix I: References. . . . . . . . . . . . . . . . . . . . . . . . . . . . . . . . . . . . . . . . . . . . . . . . . . 111<br />
5


