pdf, 2.0mb - Public Schools of North Carolina
pdf, 2.0mb - Public Schools of North Carolina
pdf, 2.0mb - Public Schools of North Carolina

You also want an ePaper? Increase the reach of your titles
YUMPU automatically turns print PDFs into web optimized ePapers that Google loves.
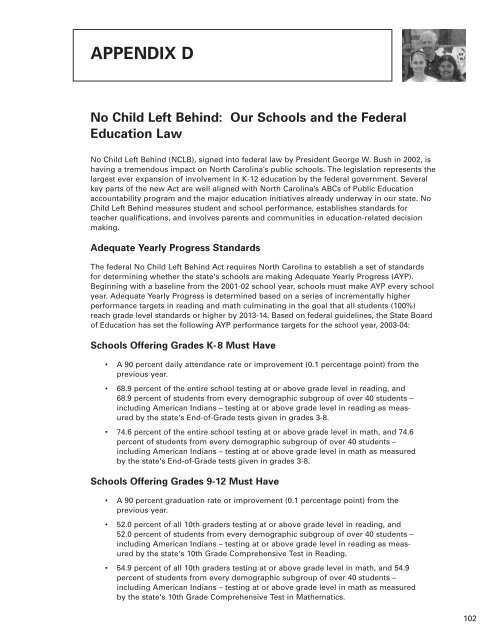
APPENDIX D<br />
No Child Left Behind: Our <strong>Schools</strong> and the Federal<br />
Education Law<br />
No Child Left Behind (NCLB), signed into federal law by President George W. Bush in 2002, is<br />
having a tremendous impact on <strong>North</strong> <strong>Carolina</strong>’s public schools. The legislation represents the<br />
largest ever expansion <strong>of</strong> involvement in K-12 education by the federal government. Several<br />
key parts <strong>of</strong> the new Act are well aligned with <strong>North</strong> <strong>Carolina</strong>’s ABCs <strong>of</strong> <strong>Public</strong> Education<br />
accountability program and the major education initiatives already underway in our state. No<br />
Child Left Behind measures student and school performance, establishes standards for<br />
teacher qualifications, and involves parents and communities in education-related decision<br />
making.<br />
Adequate Yearly Progress Standards<br />
The federal No Child Left Behind Act requires <strong>North</strong> <strong>Carolina</strong> to establish a set <strong>of</strong> standards<br />
for determining whether the state's schools are making Adequate Yearly Progress (AYP).<br />
Beginning with a baseline from the 2001-02 school year, schools must make AYP every school<br />
year. Adequate Yearly Progress is determined based on a series <strong>of</strong> incrementally higher<br />
performance targets in reading and math culminating in the goal that all students (100%)<br />
reach grade level standards or higher by 2013-14. Based on federal guidelines, the State Board<br />
<strong>of</strong> Education has set the following AYP performance targets for the school year, 2003-04:<br />
<strong>Schools</strong> Offering Grades K-8 Must Have<br />
• A 90 percent daily attendance rate or improvement (0.1 percentage point) from the<br />
previous year.<br />
• 68.9 percent <strong>of</strong> the entire school testing at or above grade level in reading, and<br />
68.9 percent <strong>of</strong> students from every demographic subgroup <strong>of</strong> over 40 students –<br />
including American Indians – testing at or above grade level in reading as measured<br />
by the state's End-<strong>of</strong>-Grade tests given in grades 3-8.<br />
• 74.6 percent <strong>of</strong> the entire school testing at or above grade level in math, and 74.6<br />
percent <strong>of</strong> students from every demographic subgroup <strong>of</strong> over 40 students –<br />
including American Indians – testing at or above grade level in math as measured<br />
by the state's End-<strong>of</strong>-Grade tests given in grades 3-8.<br />
<strong>Schools</strong> Offering Grades 9-12 Must Have<br />
• A 90 percent graduation rate or improvement (0.1 percentage point) from the<br />
previous year.<br />
• 52.0 percent <strong>of</strong> all 10th graders testing at or above grade level in reading, and<br />
52.0 percent <strong>of</strong> students from every demographic subgroup <strong>of</strong> over 40 students –<br />
including American Indians – testing at or above grade level in reading as measured<br />
by the state's 10th Grade Comprehensive Test in Reading.<br />
• 54.9 percent <strong>of</strong> all 10th graders testing at or above grade level in math, and 54.9<br />
percent <strong>of</strong> students from every demographic subgroup <strong>of</strong> over 40 students –<br />
including American Indians – testing at or above grade level in math as measured<br />
by the state's 10th Grade Comprehensive Test in Mathematics.<br />
102