

State of the World's Children 2013 - Unicef
State of the World's Children 2013 - Unicef
State of the World's Children 2013 - Unicef

Create successful ePaper yourself
Turn your PDF publications into a flip-book with our unique Google optimized e-Paper software.
THE STATE OF THE WORLD’S CHILDREN <strong>2013</strong><br />
<strong>Children</strong> with<br />
Disabilities
© United Nations <strong>Children</strong>’s Fund (UNICEF)<br />
May <strong>2013</strong><br />
Permission is required to reproduce any part <strong>of</strong> this publication. Permission will be<br />
freely granted to educational or non-pr<strong>of</strong>it organizations. O<strong>the</strong>rs will be requested<br />
to pay a small fee. Please contact:<br />
Division <strong>of</strong> Communication, UNICEF<br />
Attn: Permissions H6F<br />
3 United Nations Plaza, New York, NY 10017, USA<br />
Tel: +1 (212) 326-7434<br />
Email: nyhqdoc.permit@unicef.org<br />
This report and additional online content are available at . Perspective and Focus essays represent <strong>the</strong> personal views <strong>of</strong><br />
<strong>the</strong> authors and do not necessarily reflect <strong>the</strong> position <strong>of</strong> <strong>the</strong> United Nations<br />
<strong>Children</strong>’s Fund.<br />
For corrigenda subsequent to printing, please see .<br />
For latest data, please visit .<br />
ISBN: 978-92-806-4656-6<br />
eISBN: 978-92-806-4662-7<br />
United Nations publication sales no.: E.13.XX.1<br />
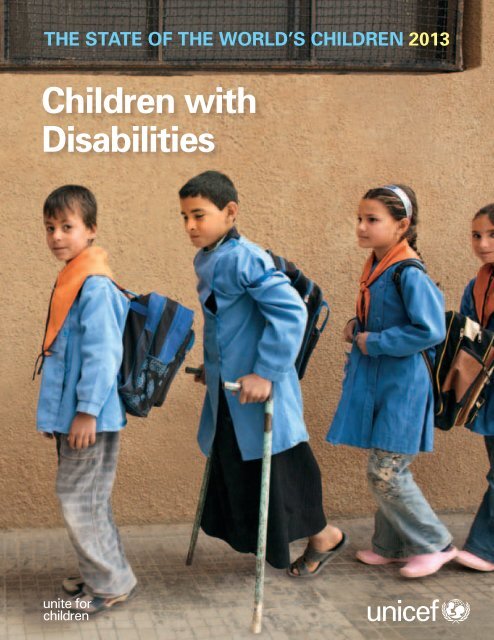
Cover photo:<br />
Schoolchildren queue to enter <strong>the</strong>ir classroom in this 2007 photograph from <strong>the</strong><br />
Syrian Arab Republic. © UNICEF/HQ2007-0745/Noorani
THE STATE OF THE<br />
WORLD’S CHILDREN <strong>2013</strong>
ACKNOWLEDGEMENTS<br />
This report is <strong>the</strong> result <strong>of</strong> collaboration among too many individuals and institutions to acknowledge here. The editorial and research team<br />
thanks all who gave so willingly <strong>of</strong> <strong>the</strong>ir time, expertise and energy, in particular:<br />
Vesna Bosnjak (International Social Services); Shuaib Chalklen (UN Special Rapporteur on Disability); Maureen Durkin (University <strong>of</strong> Wisconsin); Nora Groce and Maria Kett<br />
(Leonard Cheshire Disability and Inclusive Development Centre, University College London); Nawaf Kabbara (Arab Organization <strong>of</strong> Disabled People); Lisa Jordan (Bernard<br />
van Leer Foundation); Connie Laurin-Bowie (International Disability Alliance); Barbara LeRoy (Wayne <strong>State</strong> University); Charlotte McClain-Nhlapo (United <strong>State</strong>s Agency for<br />
International Development); Helen Meekosha (Women with Disabilities Australia); Peter Mittler (University <strong>of</strong> Manchester); Roseweter Mudarikwa (Secretariat <strong>of</strong> <strong>the</strong> African<br />
Decade on Persons with Disabilities); David Mugawe (African Child Policy Forum); Ghulam Nabi Nizamani (Pakistan Disabled Peoples’ Organization); Victor Santiago Pineda<br />
(Victor Pineda Foundation); Tom Shakespeare (World Health Organization); Aleksandra Posarac (World Bank); Shantha Rau Barriga (Human Rights Watch); Eric Rosenthal<br />
(Disability Rights International); Albina Shankar (Mobility India); and Armando Vásquez (Pan American Health Organization) for serving on <strong>the</strong> External Advisory Board.<br />
Judith Klein (Open Society Foundations); Gerrison Lansdown (independent); Malcolm MacLachlan and Hasheem Mannan (Trinity College Dublin); Susie Miles (independent);<br />
Daniel Mont (Leonard Cheshire Disability); and Diane Richler (International Disability Alliance) for authoring background papers.<br />
Sruthi Atmakur (City University <strong>of</strong> New York); Parul Bakshi and Jean-Francois Trani (Washington University in St. Louis); Nazmul Bari and Amzad Hossain (Centre for Disability<br />
in Development); Simone Bloem and Mihaylo Milovanovitch (Organization for Economic Co-operation and Development); Johan Borg (Lund University); Megan Burke,<br />
Stephane De Greef and Loren Persi Vicentic (Landmine and Cluster Munition Monitor); James Conroy (Center for Outcome Analysis); Audrey Cooper, Charles Reilly and Amy<br />
Wilson (Gallaudet University); Alexandre Cote (International Disability Alliance); Marcella Deluca, Sunanda Mavillapalli, Alex Mhando, Kristy Mitchell, Hannah Nicolls and<br />
Diana Shaw (Leonard Cheshire Disability/Young Voices); Avinash De Souza (De Souza Foundation); Ca<strong>the</strong>rine Dixon (Handicap International); Fred Doulton (Secretariat <strong>of</strong> <strong>the</strong><br />
Convention on <strong>the</strong> Rights <strong>of</strong> Persons with Disabilities); Natasha Graham (Global Partnership for Education); Jean Johnson (University <strong>of</strong> Hawaii); Chapal Khasnabis and Alana<br />
Officer (World Health Organization); Darko Krznaric (Queen’s University); Gwynnyth Llewellyn (University <strong>of</strong> Sydney); Mitch Loeb (Centers for Disease Control and Prevention/<br />
National Center for Health Statistics); Rosemay McKay (Australian Agency for International Development); Amanda McRae (Human Rights Watch); Sophie Mitra (Fordham<br />
University); David Morissey, Sherzodbek Sharipoo and Andrea Shettle (United <strong>State</strong>s International Council on Disabilities); Zelda Mycr<strong>of</strong>t (The Chaeli Campaign); Emma<br />
Pearce (Women’s Refugee Commission); Natalia Raileanu (Keystone Human Services); Richard Rieser (World <strong>of</strong> Inclusion); Marguerite Schneider (Stellenbosch University);<br />
Morsheda Akter Shilpi (Organization for <strong>the</strong> Poor Community Advancement); Silje Vold (Plan Norway) for writing background material or providing advice and information.<br />
Tracy Achieng; Grace Okumu Akimi; Sophia Rose Akoth; Abeida Onica Anderson; Washinton Okok Anyumba; Beatrice Atieno; Ssentongo Deo; Ivory Duncan; Argie Ergina;<br />
Mary Charles Felix; Michael Salah Hosea; Amna Hissein Idris; Tiffany Joseph; Hannah Wanja Maina; Saitoti Augustin Maina; Dianne Mallari; Modesta Mbijima; Shida<br />
Mganga; Nicole Mballah Mulavu; Joseph Kadiko Mutunkei; Ann Napaashu Nemagai; Rachael Nyaboke Nyabuti; Alice Akoth Nyamuok; Sarah Omanwa; Benson Okoth Otieno;<br />
Nakafu Phiona; Shalima Ramadhani; Rosemarie Ramitt; Nambobi Sadat; Veronicah Shangutit Sampeke; Ladu Michel Seme; Josephine Kiden Simon; Muhammad Tarmizi bin<br />
Fauzi; Elizabeth Mamunyak Tikami; Shemona Trinidad; and <strong>the</strong> 20 o<strong>the</strong>r young people who participated anonymously in surveys and focus groups conducted specially for this<br />
report by facilitators from <strong>the</strong> Leonard Cheshire Disability Young Voices network.<br />
Bora Shin and Mat<strong>the</strong>w Manos (veryniceDesign) for <strong>the</strong> infographic on universal design published online at .<br />
UNICEF country and regional <strong>of</strong>fices and headquarters divisions contributed to this report or to related online content or advocacy materials by submitting findings or photographs,<br />
taking part in formal reviews or commenting on drafts. Many UNICEF <strong>of</strong>fices and national committees arranged to translate or adapt <strong>the</strong> report for local use.<br />
Programme, policy, communication and research advice and support were provided by Yoka Brandt, Deputy Executive Director; Geeta Rao Gupta, Deputy Executive Director;<br />
Gordon Alexander, Director, Office <strong>of</strong> Research and colleagues; Nicholas Alipui, Director, Programme Division and colleagues; Ted Chaiban, Director, Office <strong>of</strong> Emergency<br />
Operations and colleagues; Colin Kirk, Director, Office <strong>of</strong> Evaluation and colleagues; Jeffrey O’Malley, Director, Division <strong>of</strong> Policy and Strategy and colleagues; and Edward<br />
Carwardine, Deputy Director, Division <strong>of</strong> Communication and colleagues. This edition also benefited from <strong>the</strong> close cooperation <strong>of</strong> Rosangela Berman-Bieler, Chief, and<br />
colleagues in <strong>the</strong> Disability Section <strong>of</strong> UNICEF’s Programme Division.<br />
Special thanks to David Anthony, Chief, Policy Advocacy Section; Claudia Cappa, Statistics and Monitoring Specialist; Khaled Mansour, Director <strong>of</strong> Communication until<br />
January <strong>2013</strong>; and Julia Szczuka, deputy editor <strong>of</strong> this report until September 2012, for <strong>the</strong>ir generosity <strong>of</strong> intellect and spirit.<br />
REPORT TEAM<br />
EDITORIAL AND RESEARCH<br />
Abid Aslam, Editor<br />
Christine Mills, Project Manager<br />
Nikola Balvin, Sue Le-Ba, Ticiana Maloney, Research Officers<br />
Anna Grojec, Perspectives Editor<br />
Marc Chalamet, French Editor<br />
Carlos Perellon, Spanish Editor<br />
Hirut Gebre-Egziabher (Lead), Lisa Kenney, Ami Pradhan, Research Assistants<br />
Charlotte Maitre (Lead), Carol Holmes, Pamela Knight, Natalie Leston,<br />
Kristin Moehlmann, Copy Editors<br />
Anne Santiago, Nogel S. Viyar, Judith Yemane, Editorial support<br />
PUBLISHING AND DISSEMINATION<br />
Ca<strong>the</strong>rine Langevin-Falcon, Chief, Publications Section; Jaclyn Tierney, Production<br />
Officer; Germain Ake; Christine Kenyi; Maryan Lobo; Jorge Peralta-Rodriguez;<br />
Elias Salem<br />
STATISTICAL TABLES<br />
Tessa Wardlaw, Associate Director, Statistics and Monitoring Section, Division<br />
<strong>of</strong> Policy and Strategy; David Brown; Claudia Cappa; Liliana Carvajal; Archana<br />
Dwivedi; Anne Genereux; Elizabeth Horn-Phathanothai; Priscilla Idele; Claes<br />
Johansson; Rouslan Karimov; Rolf Luyendijk; Colleen Murray; Jin Rou New;<br />
Holly Newby; Khin Wityee Oo; Nicole Petrowski; Tyler Porth; Chiho Suzuki;<br />
Andrew Thompson; Danzhen You<br />
Design by Prographics, Inc.<br />
Printed by Hatteras Press, Inc.<br />
ii<br />
THE STATE OF THE WORLD’S CHILDREN <strong>2013</strong>: <strong>Children</strong> with Disabilities
FOREWORD<br />
Is <strong>the</strong>re a child who does not dream <strong>of</strong> being counted and having her or his gifts<br />
and talents recognized? No. All children have hopes and dreams – including children<br />
with disabilities. And all children deserve a fair chance to make <strong>the</strong>ir dreams real.<br />
This edition <strong>of</strong> The <strong>State</strong> <strong>of</strong> <strong>the</strong> World’s <strong>Children</strong> includes contributions by<br />
young people and parents who show that, when given that chance, children with<br />
disabilities are more than capable <strong>of</strong> overcoming barriers to <strong>the</strong>ir inclusion, <strong>of</strong> taking <strong>the</strong>ir rightful place<br />
as equal participants in society and <strong>of</strong> enriching <strong>the</strong> life <strong>of</strong> <strong>the</strong>ir communities.<br />
But for far too many children with disabilities, <strong>the</strong> opportunity to participate simply does not exist. Far<br />
too <strong>of</strong>ten, children with disabilities are among <strong>the</strong> last in line for resources and services, especially<br />
where <strong>the</strong>se are scarce to begin with. Far too regularly, <strong>the</strong>y are <strong>the</strong> objects simply <strong>of</strong> pity or, worse,<br />
discrimination and abuse.<br />
The deprivations faced by children and adolescents with disabilities are violations <strong>of</strong> <strong>the</strong>ir rights and <strong>the</strong><br />
principle <strong>of</strong> equity, at <strong>the</strong> heart <strong>of</strong> which lies a concern for <strong>the</strong> dignity and rights <strong>of</strong> all children – including<br />
<strong>the</strong> most vulnerable and marginalized members <strong>of</strong> society.<br />
As this report documents, <strong>the</strong> inclusion <strong>of</strong> children with disabilities in society is possible – but it requires<br />
first a change <strong>of</strong> perception, a recognition that children with disabilities hold <strong>the</strong> same rights as o<strong>the</strong>rs;<br />
that <strong>the</strong>y can be agents <strong>of</strong> change and self-determination, not merely <strong>the</strong> beneficiaries <strong>of</strong> charity; that<br />
<strong>the</strong>ir voices must be heard and heeded in our policymaking and programmes.<br />
We contribute to <strong>the</strong>ir exclusion by failing to ga<strong>the</strong>r enough data to inform our decisions. When we fail<br />
to count <strong>the</strong>se children, we are failing to help <strong>the</strong>m count for all <strong>the</strong>y should in <strong>the</strong>ir societies.<br />
Fortunately, progress is being made – albeit unevenly. This report not only examines <strong>the</strong> challenges<br />
involved in ensuring that children with disabilities have <strong>the</strong> fair access to services that is <strong>the</strong>ir right. It<br />
also explores initiatives that show promise in such areas as health, nutrition, education and emergency<br />
programming – and in <strong>the</strong> data collection and analysis needed to improve policies and operations in all<br />
<strong>the</strong>se fields. O<strong>the</strong>r chapters also discuss principles and approaches that can be adapted to advance <strong>the</strong>se<br />
children’s inclusion.<br />
Somewhere, a child is being told he cannot play because he cannot walk, or ano<strong>the</strong>r that she cannot<br />
learn because she cannot see. That boy deserves a chance to play. And we all benefit when that girl,<br />
and all children, can read, learn and contribute.<br />
The path forward will be challenging. But children do not accept unnecessary limits. Nei<strong>the</strong>r should we.<br />
Anthony Lake<br />
Executive Director, UNICEF<br />
iii
CONTENTS<br />
ACKNOWLEDGEMENTS.................................................. ii<br />
FOREWORD<br />
Anthony Lake, Executive Director, UNICEF............................... iii<br />
CHAPTER 1<br />
INTRODUCTION................................................................. 1<br />
From exclusion to inclusion......................................................... 1<br />
On <strong>the</strong> numbers............................................................................. 3<br />
A framework for action................................................................ 3<br />
CHAPTER 2<br />
FUNDAMENTALS OF INCLUSION.................... 11<br />
Changing attitudes...................................................................... 12<br />
It’s about ability........................................................................... 13<br />
Supporting children and <strong>the</strong>ir families..................................... 13<br />
Community-based rehabilitation............................................... 16<br />
Assistive technology................................................................... 18<br />
Universal design.......................................................................... 18<br />
CHAPTER 3<br />
A STRONG FOUNDATION....................................... 23<br />
Inclusive health............................................................................ 23<br />
Immunization............................................................................... 23<br />
Nutrition....................................................................................... 24<br />
Water, sanitation and hygiene.................................................... 25<br />
Sexual and reproductive health and HIV/AIDS......................... 26<br />
Early detection and intervention................................................ 26<br />
Inclusive education..................................................................... 27<br />
Starting early............................................................................... 29<br />
Working with teachers................................................................ 32<br />
Involving parents, communities and children ......................... 33<br />
Lines <strong>of</strong> responsibility................................................................. 36<br />
CHAPTER 4<br />
ESSENTIALS OF PROTECTION............................ 41<br />
Abuse and violence..................................................................... 41<br />
Institutions and inappropriate care........................................... 42<br />
Inclusive justice........................................................................... 43<br />
CHAPTER 5<br />
HUMANITARIAN RESPONSE................................ 49<br />
CHAPTER 6<br />
MEASURING CHILD DISABILITY........................ 63<br />
Evolving definitions.................................................................... 63<br />
Putting disability in context ...................................................... 64<br />
Data collection............................................................................. 65<br />
Questionnaire design.................................................................. 66<br />
Purpose and consequences........................................................ 67<br />
A way forward............................................................................. 68<br />
CHAPTER 7<br />
AN AGENDA FOR ACTION..................................... 75<br />
Ratify and implement <strong>the</strong> Conventions.................................... 75<br />
Fight discrimination.................................................................... 75<br />
Dismantle barriers to inclusion.................................................. 77<br />
End institutionalization.............................................................. 80<br />
Support families.......................................................................... 81<br />
Move beyond minimum standards........................................... 81<br />
Coordinate services to support <strong>the</strong> child................................. 81<br />
Involve children with disabilities in making decisions............ 84<br />
Global promise, local test.......................................................... 85<br />
iv<br />
THE STATE OF THE WORLD’S CHILDREN <strong>2013</strong>: <strong>Children</strong> with Disabilities
FOCUS<br />
Violence against children with disabilities............................... 44<br />
Risk, resilience and inclusive humanitarian action.................. 52<br />
Explosive remnants <strong>of</strong> war........................................................ 54<br />
Lessons learned........................................................................... 69<br />
From screening to assessment.................................................. 70<br />
PERSPECTIVE<br />
From pioneer to advocate for inclusion<br />
Nancy Maguire.............................................................................. 4<br />
Living with albinism, discrimination and superstition<br />
Michael Hosea............................................................................... 6<br />
I want good memories<br />
Nicolae Poraico.............................................................................. 8<br />
For deaf young people, language is <strong>the</strong> key<br />
Krishneer Sen.............................................................................. 20<br />
My son Hanif<br />
Mohammad Absar ...................................................................... 30<br />
The new normal<br />
Claire Halford............................................................................... 34<br />
Adjusting, adapting and empowering<br />
Yahia J. Elziq................................................................................ 38<br />
Segregation and abuse in institutions<br />
Eric Rosenthal and Laurie Ahern............................................... 46<br />
One bite <strong>of</strong> <strong>the</strong> elephant at a time<br />
Chaeli Mycr<strong>of</strong>t.............................................................................. 60<br />
From invisibility to inclusion for<br />
indigenous children with disabilities<br />
Olga Montufar Contreras............................................................ 72<br />
Open <strong>the</strong> doors to education – and employment<br />
Ivory Duncan................................................................................ 78<br />
End <strong>the</strong> ‘book famine’ with better<br />
technology, attitudes and copyright law<br />
Kartik Sawhney............................................................................ 82<br />
<strong>Children</strong> with disabilities and<br />
universal human rights<br />
Lenín Voltaire Moreno Garcés.................................................... 86<br />
Additional Focus and Perspective essays are available online at<br />
.<br />
FIGURES<br />
Estimated rates <strong>of</strong> primary schoolcompletion........................ 12<br />
Community-based rehabilitation............................................... 16<br />
Assistive technology products................................................... 19<br />
<strong>Children</strong> with disabilities and secondary education............... 42<br />
Last to benefit.............................................................................. 43<br />
Child casualties in countries heavily affected by<br />
mines and explosive remnants <strong>of</strong> war, 2011............................ 56<br />
Child casualties in <strong>the</strong> most affected<br />
countries (1999–2011)................................................................. 57<br />
Child casualties by type <strong>of</strong> explosive........................................ 59<br />
Four case studies: Percentage <strong>of</strong> population<br />
reporting some form <strong>of</strong> disability.............................................. 64<br />
Convention on <strong>the</strong> Rights <strong>of</strong> Persons with Disabilities<br />
and Optional Protocol: Signatures and ratifications............... 76<br />
REFERENCES........................................................................ 88<br />
STATISTICAL TABLES................................................. 93<br />
Overview...................................................................................... 94<br />
Under-five mortality rankings.................................................... 99<br />
Table 1. Basic indicators........................................................... 100<br />
Table 2. Nutrition....................................................................... 104<br />
Table 3. Health........................................................................... 108<br />
Table 4. HIV/AIDS...................................................................... 112<br />
Table 5. Education..................................................................... 116<br />
Table 6. Demographic indicators............................................. 120<br />
Table 7. Economic indicators................................................... 124<br />
Table 8. Women......................................................................... 128<br />
Table 9. Child protection........................................................... 132<br />
Table 10. The rate <strong>of</strong> progress................................................. 136<br />
Table 11. Adolescents............................................................... 140<br />
Table 12. Disparities by residence........................................... 144<br />
Table 13. Disparities by household wealth............................. 148<br />
Table 14. Early childhood development.................................. 152<br />
A NOTE ON TERMS<br />
Conventions, optional protocols, signatures and<br />
ratifications................................................................................ 154<br />
v
Victor, a 13-year-old with cerebral palsy, has fun in <strong>the</strong> water in Brazil. © Andre Castro/2012
CHAPTER 1<br />
INTRODUCTION<br />
Reports such as this typically begin with a statistic<br />
designed to highlight a problem. The girls and boys to<br />
whom this edition <strong>of</strong> The <strong>State</strong> <strong>of</strong> <strong>the</strong> World’s <strong>Children</strong><br />
is dedicated are not problems.<br />
Ra<strong>the</strong>r, each is a sister, bro<strong>the</strong>r or friend who has<br />
a favourite dish, song or game; a daughter or son<br />
with dreams and <strong>the</strong> desire to fulfil <strong>the</strong>m; a child<br />
with a disability who has <strong>the</strong> same rights as any<br />
o<strong>the</strong>r girl or boy.<br />
Given opportunities to flourish as o<strong>the</strong>rs might,<br />
children with disabilities have <strong>the</strong> potential to<br />
lead fulfilling lives and to contribute to <strong>the</strong><br />
social, cultural and economic vitality <strong>of</strong> <strong>the</strong>ir<br />
communities – as <strong>the</strong> personal essays in this<br />
volume attest.<br />
Yet surviving and thriving can be especially<br />
difficult for children with disabilities. They are<br />
at greater risk <strong>of</strong> being poor than peers without<br />
disabilities. Even where children share <strong>the</strong> same<br />
disadvantages – <strong>of</strong> poverty or membership in a<br />
minority group, say – children with disabilities<br />
confront additional challenges as a result <strong>of</strong> <strong>the</strong>ir<br />
impairments and <strong>the</strong> many barriers that society<br />
throws in <strong>the</strong>ir way. <strong>Children</strong> living in poverty are<br />
among <strong>the</strong> least likely to enjoy <strong>the</strong> benefits <strong>of</strong> education<br />
and health care, for example, but children<br />
who live in poverty and have a disability are even<br />
less likely to attend <strong>the</strong>ir local school or clinic.<br />
In many countries, responses to <strong>the</strong> situation<br />
<strong>of</strong> children with disabilities are largely limited<br />
to institutionalization, abandonment or neglect.<br />
These responses are <strong>the</strong> problem, and <strong>the</strong>y are<br />
rooted in negative or paternalistic assumptions<br />
<strong>of</strong> incapacity, dependency and difference that are<br />
perpetuated by ignorance. Unless this changes,<br />
children with disabilities will continue to have <strong>the</strong>ir<br />
rights neglected; to experience discrimination,<br />
violence and abuse; to have <strong>the</strong>ir opportunities<br />
restricted; to be excluded from society.<br />
What is needed is a commitment to <strong>the</strong>se<br />
children’s rights and <strong>the</strong>ir futures, giving priority<br />
to <strong>the</strong> most disadvantaged – as a matter <strong>of</strong> equity<br />
and for <strong>the</strong> benefit <strong>of</strong> all.<br />
From exclusion to inclusion<br />
<strong>Children</strong> with disabilities encounter different<br />
forms <strong>of</strong> exclusion and are affected by <strong>the</strong>m to<br />
varying degrees, depending on factors such as<br />
<strong>the</strong> type <strong>of</strong> disability <strong>the</strong>y have, where <strong>the</strong>y live<br />
and <strong>the</strong> culture or class to which <strong>the</strong>y belong.<br />
Gender is also a crucial factor: Girls are less<br />
likely than boys to receive care and food and are<br />
more likely to be left out <strong>of</strong> family interactions<br />
and activities. Girls and young women with<br />
disabilities are ‘doubly disabled’. They confront<br />
not only <strong>the</strong> prejudice and inequities encountered<br />
by many persons with disabilities, but are also<br />
constrained by traditional gender roles and<br />
barriers. 1 Girls with disabilities are also less likely<br />
to get an education, receive vocational training or<br />
find employment than are boys with disabilities<br />
or girls without disabilities. 2<br />
INTRODUCTION<br />
1
At <strong>the</strong> heart <strong>of</strong> <strong>the</strong>se differing forms and degrees<br />
<strong>of</strong> exclusion, however, lies <strong>the</strong> shared experience<br />
<strong>of</strong> being defined and judged by what one lacks<br />
ra<strong>the</strong>r than by what one has. <strong>Children</strong> with disabilities<br />
are <strong>of</strong>ten regarded as inferior, and this exposes<br />
<strong>the</strong>m to increased vulnerability: Discrimination<br />
based on disability has manifested itself in marginalization<br />
from resources and decision-making, and<br />
even in infanticide. 3<br />
Exclusion is <strong>of</strong>ten <strong>the</strong> consequence <strong>of</strong> invisibility.<br />
Few countries have reliable information on how<br />
many <strong>of</strong> <strong>the</strong>ir citizens are children with disabilities,<br />
what disabilities <strong>the</strong>y have or how <strong>the</strong>se<br />
disabilities affect <strong>the</strong>ir lives. In some countries,<br />
families raising children with disabilities face<br />
ostracism. Because <strong>of</strong> this, even loving parents<br />
and family members can be reluctant to report<br />
that a child <strong>of</strong> <strong>the</strong>irs has a disability – whe<strong>the</strong>r<br />
because <strong>the</strong>y are trying to avoid being shunned,<br />
because <strong>the</strong>y are being overprotective <strong>of</strong> <strong>the</strong><br />
child, or both. If <strong>the</strong> child is born with an impairment,<br />
its birth might not even be registered.<br />
<strong>Children</strong> excluded in this way are unknown to,<br />
and <strong>the</strong>refore cut <strong>of</strong>f from, <strong>the</strong> health, education<br />
and social services to which <strong>the</strong>y are entitled.<br />
Childhood deprivations can have lasting effects<br />
– by limiting access to gainful employment or<br />
participation in civic affairs later in life, for<br />
example. Conversely, access to and use <strong>of</strong><br />
supportive services and technology can position<br />
a child with a disability to take her or his<br />
place in <strong>the</strong> community and contribute to it.<br />
Indeed, <strong>the</strong> future is far from grim. Effective<br />
means are available to build inclusive societies<br />
in which children with and without disabilities<br />
can enjoy <strong>the</strong>ir rights equally. Physical, attitudinal<br />
and political barriers are being dismantled,<br />
although <strong>the</strong> process is uneven and has far<br />
to go.<br />
Rahmatuallah, 14, who lost his leg in a landmine explosion, takes part in a training workshop for electricians at a centre for<br />
war-affected children in Kandahar, Afghanistan. © UNICEF/AFGA2007-00420/Noorani<br />
2<br />
THE STATE OF THE WORLD’S CHILDREN <strong>2013</strong>: <strong>Children</strong> with Disabilities
Under <strong>the</strong> Convention on <strong>the</strong> Rights <strong>of</strong> <strong>the</strong><br />
Child (CRC) and <strong>the</strong> Convention on <strong>the</strong> Rights <strong>of</strong><br />
Persons with Disabilities (CRPD), governments<br />
around <strong>the</strong> world have taken upon <strong>the</strong>mselves<br />
<strong>the</strong> responsibility <strong>of</strong> ensuring that all children,<br />
irrespective <strong>of</strong> ability or disability, enjoy <strong>the</strong>ir<br />
rights without discrimination <strong>of</strong> any kind. As <strong>of</strong><br />
February <strong>2013</strong>, 193 countries had ratified <strong>the</strong> CRC<br />
and 127 countries and <strong>the</strong> European Union had<br />
ratified <strong>the</strong> CRPD.<br />
These two Conventions bear witness to a growing<br />
global movement dedicated to <strong>the</strong> inclusion<br />
<strong>of</strong> children with disabilities in community life.<br />
Concern for inclusion is rooted in <strong>the</strong> recognition<br />
that all children are full members <strong>of</strong> society: that<br />
each child is a unique individual who is entitled<br />
to be respected and consulted, who has skills<br />
and aspirations worth nurturing and needs that<br />
demand fulfilment and whose contributions are<br />
to be valued and encouraged. Inclusion requires<br />
society to make physical infrastructure, information<br />
and <strong>the</strong> means <strong>of</strong> communication accessible<br />
so all can use <strong>the</strong>m, to eliminate discrimination<br />
so none is forced to suffer it and to provide protection,<br />
support and services so every child with<br />
a disability is able to enjoy her or his rights as<br />
do o<strong>the</strong>rs.<br />
Inclusion goes beyond ‘integration’. The latter<br />
implies that children with disabilities are to be<br />
brought into a pre-existing framework <strong>of</strong> prevailing<br />
norms and standards. In <strong>the</strong> context <strong>of</strong><br />
education, for example, integration might be<br />
attempted simply by admitting children with<br />
disabilities to ‘regular’ schools. This would fall<br />
short <strong>of</strong> inclusion, which is possible only when<br />
schools are designed and administered so that<br />
all children can experience quality learning and<br />
recreation toge<strong>the</strong>r. This would entail providing<br />
students with disabilities with such needed<br />
accommodations as access to Braille, sign<br />
language and adapted curricula that allow<br />
<strong>the</strong>m equal opportunity to learn and interact.<br />
Inclusion benefits everyone. To continue with <strong>the</strong><br />
example <strong>of</strong> education, ramps and wide doorways<br />
On <strong>the</strong> numbers<br />
By one widely used estimate, some 93 million children<br />
– or 1 in 20 <strong>of</strong> those aged 14 or younger – live with a<br />
moderate or severe disability <strong>of</strong> some kind.<br />
Such global estimates are essentially speculative. They<br />
are dated – this one has been in circulation since 2004<br />
– and derived from data <strong>of</strong> quality too varied and methods<br />
too inconsistent to be reliable. In order to provide<br />
a context for and illustrate <strong>the</strong> issues under discussion,<br />
this report presents <strong>the</strong> results <strong>of</strong> national surveys and<br />
independent studies, but even <strong>the</strong>se must be interpreted<br />
with caution and should not be compared to one<br />
ano<strong>the</strong>r. This is because definitions <strong>of</strong> disability<br />
differ by place and time, as do study design, methodology<br />
and analysis. These issues, and promising initiatives<br />
aimed at improving <strong>the</strong> quality and availability<br />
<strong>of</strong> data, are discussed in Chapter 6 <strong>of</strong> this report.<br />
can enhance access and safety for all children,<br />
teachers, parents and visitors in a school, not<br />
just those who use wheelchairs. And an inclusive<br />
curriculum – one that is child-centred and that<br />
includes representations <strong>of</strong> persons with disabilities<br />
in order to reflect and cater to a true cross<br />
section <strong>of</strong> society – can broaden <strong>the</strong> horizons not<br />
only <strong>of</strong> children whose disabilities would o<strong>the</strong>rwise<br />
limit <strong>the</strong>ir ambitions or options, but also <strong>of</strong><br />
those without disabilities who stand to gain an<br />
appreciation <strong>of</strong> diversity and <strong>of</strong> <strong>the</strong> skills and preparedness<br />
necessary to build a society inclusive<br />
<strong>of</strong> all. Where educational attainment leads to a job<br />
or o<strong>the</strong>r means <strong>of</strong> earning a living, <strong>the</strong> child with<br />
a disability is able to advance and to take her or<br />
his place as a full and equal member <strong>of</strong> <strong>the</strong> adult<br />
world, one who produces as well as consumes.<br />
A framework for action<br />
<strong>Children</strong> with disabilities should not be treated or<br />
regarded simply as <strong>the</strong> recipients <strong>of</strong> charity. They<br />
have <strong>the</strong> same rights as o<strong>the</strong>rs – among <strong>the</strong>se,<br />
<strong>the</strong> right to life and to <strong>the</strong> opportunities that flow<br />
from good health care, nutrition and education,<br />
(continued on p. 9)<br />
INTRODUCTION 3
PERSPECTIVE<br />
From pioneer to advocate<br />
for inclusion<br />
By Nancy Maguire<br />
Nancy Maguire is a disability<br />
activist from <strong>the</strong> United Kingdom.<br />
She is a qualified social worker but,<br />
after travelling abroad, decided to<br />
campaign for <strong>the</strong> rights <strong>of</strong> people<br />
with disabilities, especially young<br />
women. She has worked with<br />
disabled people’s organizations<br />
in Asia and Sou<strong>the</strong>rn Africa, and<br />
hopes to obtain a Master’s degree<br />
in policy and development.<br />
I was born in London in 1986<br />
and have a condition called<br />
osteogenesis imperfecta, commonly<br />
known as brittle bones.<br />
Many children with brittle bones<br />
grow up protected – overprotected,<br />
some might say – from<br />
any possibility <strong>of</strong> hurting <strong>the</strong>mselves.<br />
My parents wanted me<br />
to be safe, but <strong>the</strong>y also wanted<br />
me to have <strong>the</strong> opportunity to<br />
play, make friends and lead as<br />
normal a childhood as possible.<br />
In <strong>the</strong> 1980s, inclusive education<br />
was still a fairly new concept.<br />
Like most parents <strong>of</strong> a disabled<br />
child, mine were advised to<br />
send me to a special school.<br />
My mo<strong>the</strong>r is a teacher, and<br />
after visiting <strong>the</strong> recommended<br />
school she was convinced that<br />
it would provide a substandard<br />
education. My parents have<br />
always used my older sister<br />
Katy, who did not have a disability,<br />
to gauge what is acceptable<br />
for me: If <strong>the</strong>y thought<br />
something wasn’t good enough<br />
for Katy, <strong>the</strong>n it wasn’t good<br />
enough for me.<br />
I was <strong>the</strong> first child with a disability<br />
to attend my primary<br />
school, and in many ways I felt<br />
like a guinea pig for inclusion.<br />
For example, despite having a<br />
positive attitude towards including<br />
me in all aspects <strong>of</strong> school<br />
life, my teachers lacked experience<br />
in how to adapt physical<br />
education so that I could get<br />
involved in a meaningful way.<br />
Like most childhoods, mine<br />
wasn’t always easy. I spent a<br />
lot <strong>of</strong> time in hospital, and even<br />
within an ‘inclusive’ mainstream<br />
education system, <strong>the</strong>re were<br />
times when I was excluded.<br />
For example, I wasn’t allowed<br />
to go to my nursery Christmas<br />
party because <strong>the</strong> teachers were<br />
worried I would break a bone.<br />
Also, at high school <strong>the</strong>y had a<br />
separate table in <strong>the</strong> canteen for<br />
children with disabilities and <strong>the</strong><br />
teachers could not understand<br />
why I refused to sit at it. Despite<br />
setbacks and obstacles, however,<br />
I managed to flourish both<br />
educationally and socially.<br />
I was always encouraged to try<br />
new things. My extracurricular<br />
activities included swimming,<br />
ballet, wheelchair tennis, drama<br />
and singing. In many <strong>of</strong> <strong>the</strong>se,<br />
I was also <strong>the</strong> only child with a<br />
disability. Interestingly, I <strong>of</strong>ten<br />
found <strong>the</strong>se groups more inclusive<br />
than school in terms <strong>of</strong><br />
how much I could participate<br />
and contribute. I felt wanted<br />
and people found creative<br />
ways for me to get involved.<br />
None<strong>the</strong>less, <strong>the</strong>re were many<br />
things I found difficult to do<br />
because <strong>of</strong> my limited mobility.<br />
I would sometimes feel upset<br />
because I couldn’t do things as<br />
well as <strong>the</strong> o<strong>the</strong>r children, and<br />
as I grew older and more selfconscious,<br />
I became reluctant to<br />
put myself in situations where<br />
my difficulties were on show.<br />
In my teenage years a lot <strong>of</strong> my<br />
friends went through phases<br />
<strong>of</strong> being a ‘goth’ or a ‘rude<br />
girl’, which involved dressing<br />
or behaving in ways designed<br />
to attract attention. Whilst <strong>the</strong>y<br />
were doing everything <strong>the</strong>y<br />
4<br />
THE STATE OF THE WORLD’S CHILDREN <strong>2013</strong>: <strong>Children</strong> with Disabilities
People with disabilities are becoming more visible in many walks<br />
<strong>of</strong> life – in politics and <strong>the</strong> media, for example. This is instrumental<br />
in improving children’s perceptions <strong>of</strong> what <strong>the</strong>y can achieve.<br />
could to stand out and be different,<br />
I was desperate to be<br />
‘normal’ and fit in. Growing up<br />
with a disability, I received a lot<br />
<strong>of</strong> attention. People in <strong>the</strong> street<br />
would <strong>of</strong>ten stare at me, make<br />
comments and ask my parents,<br />
“What’s wrong with her?” I had<br />
days when I was able to brush it<br />
<strong>of</strong>f, but no amount <strong>of</strong> resilience<br />
or family support can stop that<br />
from affecting you.<br />
I developed extremely low selfesteem<br />
and poor body image,<br />
made worse because I was<br />
significantly overweight. I found<br />
exercise difficult, and like many<br />
girls my age, I ate to comfort<br />
myself. I had also internalized<br />
<strong>the</strong> medical terminology that<br />
was used to describe me – in<br />
particular <strong>the</strong> word ‘deformed’<br />
(I had a curvature <strong>of</strong> <strong>the</strong> spine,<br />
since corrected). When I was 14,<br />
I developed an eating disorder,<br />
partly because I wanted to lose<br />
weight – but also because my<br />
weight felt like one aspect <strong>of</strong> my<br />
physical appearance that I could<br />
actually control.<br />
Although I had incredibly<br />
supportive family and friends,<br />
being disabled was never something<br />
I viewed as a positive<br />
thing. I thought I had to overcome<br />
it, like adversity. I became<br />
obsessed with being as ‘undisabled’<br />
as possible, and I was<br />
convinced that if I could walk,<br />
my life would be a lot better.<br />
Ironically, although I no longer<br />
use a wheelchair, in many ways<br />
I feel more aware <strong>of</strong> my disability<br />
than ever. People still make comments<br />
about me because I have<br />
small stature, and make assumptions<br />
about my life and ability;<br />
I always have to prove myself,<br />
particularly in <strong>the</strong> workplace.<br />
Though I am not defined by my<br />
disability, it has been pivotal in<br />
shaping who I am and what<br />
I have achieved. Having a disability<br />
is now something I embrace:<br />
I no longer see it as a negative<br />
thing or something I should be<br />
embarrassed about. In many<br />
ways being disabled has worked<br />
to my advantage and created<br />
opportunities that might never<br />
have been available to me –<br />
like writing this article.<br />
Every child’s experience is<br />
different. I come from a lowermiddle-class<br />
family in <strong>the</strong> United<br />
Kingdom, where I had access<br />
to free health care and a good<br />
education. But I strongly believe<br />
that <strong>the</strong> issues <strong>of</strong> belonging,<br />
self-esteem and aspiration<br />
transcend such distinctions as<br />
gender, class and nationality.<br />
To develop a greater sense <strong>of</strong><br />
self-worth, children with<br />
disabilities need <strong>the</strong> opportunity<br />
to participate and contribute in<br />
all aspects <strong>of</strong> <strong>the</strong>ir lives.<br />
People with disabilities are<br />
becoming more visible in many<br />
walks <strong>of</strong> life – in politics and<br />
<strong>the</strong> media, for example. This<br />
is instrumental in improving<br />
children’s perceptions <strong>of</strong> what<br />
<strong>the</strong>y can achieve. When I was<br />
growing up, <strong>the</strong> only role model<br />
I had was Stevie Wonder.<br />
I admired him because he was<br />
a successful and respected<br />
musician despite being blind.<br />
However, it would have helped<br />
me to see people with disabilities<br />
doing everyday jobs – as<br />
teachers, doctors or shopkeepers.<br />
I think that would also have<br />
helped my parents. My mum<br />
said that when I was a child,<br />
she tried not to think about<br />
my future because it made her<br />
scared. She knew that I was<br />
capable but feared that my<br />
options would be limited.<br />
As it turns out, my disability has<br />
not prevented me from achieving<br />
any <strong>of</strong> <strong>the</strong> important things.<br />
I am a qualified social worker,<br />
passed my driving test when<br />
I was 16, left home when I was<br />
19 and have lived and worked<br />
in Asia and Africa. In <strong>the</strong> future<br />
I hope to be an advocate for<br />
children with disabilities on an<br />
international level, as I passionately<br />
believe in <strong>the</strong> inalienable<br />
human rights and untapped<br />
potential <strong>of</strong> <strong>the</strong>se children.<br />
INTRODUCTION<br />
5
PERSPECTIVE<br />
Living with albinism,<br />
discrimination and superstition<br />
By Michael Hosea<br />
to protect my eyes. I also have<br />
troubles at school. Sometimes<br />
I can’t see <strong>the</strong> blackboard, and<br />
I always have to sit in <strong>the</strong><br />
shade. This country does<br />
not have sufficient visionenhancing<br />
technology, such<br />
as glasses, magnifiers and<br />
special computer equipment,<br />
and without it children with<br />
albinism have a hard time<br />
graduating from school and<br />
finding employment. My family<br />
is poor, so getting money for<br />
school fees is also difficult.<br />
Michael Hosea was born in 1995.<br />
He is <strong>the</strong> eldest <strong>of</strong> six children and<br />
one <strong>of</strong> three persons with albinism<br />
in his immediate family. He lives<br />
in Dodoma, United Republic <strong>of</strong><br />
Tanzania, and is about to graduate<br />
from school. He advocates for<br />
<strong>the</strong> rights <strong>of</strong> young people with<br />
disabilities, particularly those with<br />
albinism, through <strong>the</strong> Leonard<br />
Cheshire Disability Young Voices<br />
network.<br />
I was born in Mwanza, <strong>the</strong><br />
second largest city in <strong>the</strong><br />
United Republic <strong>of</strong> Tanzania.<br />
I am <strong>the</strong> eldest son and live<br />
with my siblings and parents in<br />
Dodoma, <strong>the</strong> capital. There are<br />
six children in our family; one<br />
<strong>of</strong> my sisters and one <strong>of</strong> my<br />
bro<strong>the</strong>rs are also albinos.<br />
The impairments caused by<br />
my condition make life very<br />
difficult. I always have trouble<br />
with <strong>the</strong> sun and have to cover<br />
up with heavy, long-sleeved<br />
clothing and wear sunglasses<br />
Life is complicated even more<br />
by <strong>the</strong> way people treat us.<br />
There is a lot <strong>of</strong> discrimination<br />
against people with albinism,<br />
and I sometimes lack <strong>the</strong> company<br />
<strong>of</strong> friends. Some people<br />
also believe horrible myths<br />
about us: that we are not<br />
human and never die, that<br />
albinism is a curse from <strong>the</strong><br />
gods and that anyone who<br />
touches us will be cursed.<br />
Worst <strong>of</strong> all, practitioners <strong>of</strong><br />
witchcraft hunt and kill us to<br />
use our hair, body parts and<br />
organs in charms and potions.<br />
For centuries some people<br />
have believed that if <strong>the</strong>y go<br />
to a witch doctor with albino<br />
6<br />
THE STATE OF THE WORLD’S CHILDREN <strong>2013</strong>: <strong>Children</strong> with Disabilities
Education is <strong>the</strong> key to stopping <strong>the</strong> murder, abuse and<br />
discrimination. It is important that o<strong>the</strong>rs – even members <strong>of</strong><br />
my extended family – learn that we are people just like <strong>the</strong>m.<br />
body parts, <strong>the</strong>y will become<br />
rich and prosperous. Even<br />
though it is illegal to kill people<br />
with albinism, it still happens –<br />
it’s greed that makes people<br />
do it. But it’s all based on lies:<br />
There are people who have<br />
done <strong>the</strong>se terrible things, yet<br />
<strong>the</strong>ir lives have remained<br />
<strong>the</strong> same.<br />
A few months ago, thanks to a<br />
friend <strong>of</strong> my fa<strong>the</strong>r, my siblings<br />
and I escaped being <strong>the</strong> victims<br />
<strong>of</strong> murder for witchcraft. My<br />
fa<strong>the</strong>r’s friend came to warn him<br />
that his three albino children<br />
were in danger <strong>of</strong> being hunted,<br />
and he begged my fa<strong>the</strong>r to<br />
leave Mwanza. This wasn’t easy<br />
because my parents’ financial<br />
situation was not good, but we<br />
packed up everything and left<br />
at 3 a.m. that night.<br />
We travelled over 500 kilometres<br />
to Dodoma and after two<br />
days received news from home<br />
that people had broken into our<br />
house in Mwanza looking to<br />
kill us.<br />
When <strong>the</strong>se people found that<br />
we had escaped, <strong>the</strong>y went<br />
to our next-door neighbour’s<br />
house. He was our local albino<br />
representative and had done so<br />
much to help us and advocate<br />
for albino rights in our community.<br />
They cut <strong>of</strong>f his genitals<br />
and arms, and left him <strong>the</strong>re to<br />
die. We later received a phone<br />
call from ano<strong>the</strong>r neighbour<br />
telling us what <strong>the</strong>y did to him.<br />
This news hurt me so much<br />
that I cried a lot, but what<br />
could I do? This is <strong>the</strong> way<br />
things are.<br />
I don’t understand why people<br />
do such things to fellow human<br />
beings. But I think education is<br />
<strong>the</strong> key to stopping <strong>the</strong> murder,<br />
abuse and discrimination. It is<br />
important that o<strong>the</strong>rs – even<br />
members <strong>of</strong> my extended<br />
family – learn that we are<br />
people just like <strong>the</strong>m. We<br />
are all <strong>the</strong> same.<br />
To escape life’s difficulties, I love<br />
to write songs and sing. I have<br />
just written a song about albinos<br />
and our struggle. My dream is<br />
to one day be able to record my<br />
music in a studio and spread<br />
my message. I pray that people<br />
around <strong>the</strong> world can one day<br />
understand that albinos are no<br />
different from <strong>the</strong>m. We are all<br />
human beings and deserve to be<br />
treated with love and respect.<br />
Note:<br />
Albinism is a rare, genetically<br />
inherited condition found in all<br />
ethnicities. People with albinism<br />
have little or no pigmentation in<br />
<strong>the</strong>ir eyes, hair and skin owing to a<br />
lack <strong>of</strong> melanin. They are sensitive to<br />
bright light and have a higher than<br />
average risk <strong>of</strong> skin cancer from sun<br />
exposure. Most people with albinism<br />
are also visually impaired. Under<br />
<strong>the</strong> Same Sun, a Canadian nongovernmental<br />
organization, estimates<br />
that albinism affects 1 in 2,000<br />
Tanzanians. Although <strong>the</strong> medical<br />
condition itself does not affect life<br />
expectancy, in <strong>the</strong> United Republic<br />
<strong>of</strong> Tanzania <strong>the</strong> average lifespan<br />
<strong>of</strong> a person with albinism is around<br />
30 years.<br />
INTRODUCTION 7
PERSPECTIVE<br />
I want good memories<br />
By Nicolae Poraico<br />
Nicolae Poraico and his bro<strong>the</strong>r<br />
Grisha spent several years in a<br />
residential home for children with<br />
mental disabilities in <strong>the</strong> Republic<br />
<strong>of</strong> Moldova. Nicolae was diagnosed<br />
with a moderate intellectual<br />
disability and his bro<strong>the</strong>r with a<br />
severe intellectual disability. In<br />
2010 Nicolae and Grisha reunited<br />
with <strong>the</strong>ir mo<strong>the</strong>r in <strong>the</strong> village<br />
<strong>of</strong> Lapusna. This was made<br />
possible with <strong>the</strong> assistance <strong>of</strong><br />
<strong>the</strong> Community for All – Moldova<br />
programme, which is implemented<br />
by <strong>the</strong> Keystone Human Services<br />
International Moldova Association<br />
with financial support from <strong>the</strong><br />
Open Society Mental Health<br />
Initiative and <strong>the</strong> Soros Foundation<br />
Moldova.<br />
I was 11 when I went to <strong>the</strong> institution<br />
with my bro<strong>the</strong>r Grisha. I<br />
am now 16. Our mo<strong>the</strong>r sent us<br />
<strong>the</strong>re because we did not have<br />
enough money to buy or rent<br />
a house, and she had to work<br />
nights. She came to see us <strong>of</strong>ten.<br />
I do not remember <strong>the</strong> day I<br />
went to <strong>the</strong> institution. I even<br />
forgot some <strong>of</strong> my memories <strong>of</strong><br />
being <strong>the</strong>re, and I hope in time I<br />
will forget <strong>the</strong> o<strong>the</strong>r ones. I want<br />
new memories, good memories.<br />
At holidays <strong>the</strong> food was good. It<br />
was also good on o<strong>the</strong>r days; we<br />
were fed four times a day. After<br />
eating I cleaned <strong>the</strong> kitchen.<br />
The teachers taught us to recite<br />
poems and sing songs and<br />
showed us different games.<br />
I know a poem about Gigel<br />
and two about Mo<strong>the</strong>r.<br />
We had naptime from 1 to<br />
4 p.m. I would not sleep:<br />
I laughed, talked to o<strong>the</strong>r boys.<br />
I put my head on <strong>the</strong> pillow, kept<br />
my eyes open and looked at <strong>the</strong><br />
boys. We were all living in one<br />
room, all 16 boys from my class.<br />
There was one boy, Victor. He<br />
worked in <strong>the</strong> kitchen. We went<br />
to <strong>the</strong> stadium nearby. He took<br />
just me to <strong>the</strong> stadium; he had<br />
bread and sour milk, and we ate<br />
toge<strong>the</strong>r. When my mo<strong>the</strong>r took<br />
me and my bro<strong>the</strong>r home, Victor<br />
did not know as he was sleeping.<br />
He gave me his picture so I<br />
would not forget him, but I forgot<br />
it <strong>the</strong>re.<br />
Sometimes <strong>the</strong> staff beat us. I<br />
do not know why. They beat me<br />
so much with different sticks<br />
that my back was injured. I was<br />
not <strong>the</strong> only one. O<strong>the</strong>r boys<br />
were injured, too. And some<br />
boys had knives. Some boys hit<br />
o<strong>the</strong>rs, and sometimes I fought<br />
with <strong>the</strong>m, with fists. What<br />
could I do? If I did not defend<br />
myself, <strong>the</strong>y could kill me. They<br />
beat Grisha, but I defended him.<br />
I didn’t want to stay <strong>the</strong>re. If my<br />
mo<strong>the</strong>r had left us <strong>the</strong>re, <strong>the</strong><br />
administration could have sent<br />
us to different families and my<br />
mo<strong>the</strong>r would never find us. But<br />
I want to visit <strong>the</strong> institution, just<br />
to see Victor and take his phone<br />
number.<br />
At home, it is very good.<br />
I now play with Colea, Igor<br />
and Dima. Here, nobody beats<br />
me. Sometimes we discuss<br />
problems with our mo<strong>the</strong>r<br />
and ask for advice. We get<br />
along very well and I go to<br />
school every day. I like physical<br />
education and Romanian<br />
language classes. I am glad<br />
I came here. I am happy that<br />
I am in Lapusna.<br />
8<br />
THE STATE OF THE WORLD’S CHILDREN <strong>2013</strong>: <strong>Children</strong> with Disabilities
(continued from p. 3)<br />
<strong>the</strong> right to express <strong>the</strong>ir views and participate<br />
in making decisions, and <strong>the</strong> right to enjoy equal<br />
protection under <strong>the</strong> law. They belong at <strong>the</strong><br />
centre <strong>of</strong> efforts to build inclusive and equitable<br />
societies – not only as beneficiaries, but as<br />
agents <strong>of</strong> change. After all, who is in a better<br />
position to comprehend <strong>the</strong>ir needs and evaluate<br />
<strong>the</strong> response?<br />
In any effort to promote inclusion and fairness,<br />
children with disabilities should be able to enlist<br />
<strong>the</strong> support <strong>of</strong> <strong>the</strong>ir families, disabled people’s<br />
organizations, parents’ associations and community<br />
groups. They should also be able to<br />
count on allies fur<strong>the</strong>r afield. Governments have<br />
<strong>the</strong> power to help by aligning <strong>the</strong>ir policies and<br />
programmes with <strong>the</strong> spirit and stipulations <strong>of</strong><br />
<strong>the</strong> CRPD, CRC and o<strong>the</strong>r international instruments<br />
that address or affect child disability.<br />
International partners can provide assistance<br />
compatible with <strong>the</strong> Conventions. Corporations<br />
and o<strong>the</strong>r entities in <strong>the</strong> private sector can<br />
advance inclusion – and attract <strong>the</strong> best talent<br />
– by embracing diversity in hiring.<br />
The research community is working to improve<br />
data collection and analysis. Their work will help<br />
to overcome ignorance and <strong>the</strong> discrimination<br />
that <strong>of</strong>ten stems from it. Fur<strong>the</strong>rmore, because<br />
data help to target interventions and gauge <strong>the</strong>ir<br />
effects, better collection and analysis helps in<br />
ensuring an optimal allocation <strong>of</strong> resources and<br />
services. But decision-makers need not wait for<br />
better data to begin building more inclusive infrastructure<br />
and services: As some have already<br />
found, inclusion involves and benefits entire<br />
communities, and its elements can be applied to<br />
new projects across <strong>the</strong> board. All that is needed<br />
is for <strong>the</strong>se efforts to remain flexible so <strong>the</strong>y can<br />
be adapted as new data come to light.<br />
promise – are dedicated to specific aspects <strong>of</strong><br />
<strong>the</strong> lives <strong>of</strong> children with disabilities. Chapter 3<br />
examines <strong>the</strong> health, nutritional and educational<br />
services that can provide a strong foundation<br />
on which children with disabilities can build<br />
full and fulfilling lives. Chapter 4 explores <strong>the</strong><br />
opportunities and challenges <strong>of</strong> ensuring legal<br />
recognition and protection against exploitation<br />
or abuse. Chapter 5 discusses inclusion in <strong>the</strong><br />
context <strong>of</strong> humanitarian crises.<br />
Many <strong>of</strong> <strong>the</strong> deprivations endured by children<br />
with disabilities stem from and are perpetuated<br />
by <strong>the</strong>ir invisibility. Research on child disability<br />
is woefully inadequate, especially in low- and<br />
middle-income countries. The resulting lack <strong>of</strong><br />
evidence hinders good policymaking and service<br />
delivery for children who are among <strong>the</strong> most<br />
vulnerable. Therefore, Chapter 6 <strong>of</strong> this report<br />
examines <strong>the</strong> challenges and opportunities<br />
confronting researchers – and ways in which<br />
children with disabilities can be rendered visible<br />
through sound data collection and analysis.<br />
Chapter 7, which concludes this edition <strong>of</strong> The<br />
<strong>State</strong> <strong>of</strong> <strong>the</strong> World’s <strong>Children</strong>, outlines necessary<br />
and feasible actions that will enable governments,<br />
<strong>the</strong>ir international partners, civil society<br />
and <strong>the</strong> private sector to advance equity through<br />
<strong>the</strong> inclusion <strong>of</strong> children with disabilities.<br />
The next chapter <strong>of</strong> this report discusses exclusion<br />
and <strong>the</strong> factors that propagate it, along with<br />
some philosophical and practical fundamentals<br />
<strong>of</strong> inclusion. Subsequent chapters – each <strong>of</strong><br />
which applies <strong>the</strong> same approach <strong>of</strong> exploring<br />
barriers as well as solutions that show<br />
Wenjun, 9, walks with her foster mo<strong>the</strong>r in China.<br />
© UNICEF/China/2010/Liu<br />
INTRODUCTION<br />
9
<strong>Children</strong> with and without disabilities participate in school festivities in Bangladesh. © UNICEF/BANA2007-00655/Siddique
CHAPTER 2<br />
FUNDAMENTALS OF<br />
INCLUSION<br />
Adopting an approach grounded in respect for <strong>the</strong> rights,<br />
aspirations and potential <strong>of</strong> all children can reduce <strong>the</strong><br />
vulnerability <strong>of</strong> children with disabilities to discrimination,<br />
exclusion and abuse.<br />
The Convention on <strong>the</strong> Rights <strong>of</strong> <strong>the</strong> Child (CRC)<br />
and <strong>the</strong> Convention on <strong>the</strong> Rights <strong>of</strong> Persons with<br />
Disabilities (CRPD) challenge charitable approaches<br />
that regard children with disabilities as passive<br />
recipients <strong>of</strong> care and protection. Instead, <strong>the</strong><br />
Conventions demand recognition <strong>of</strong> each child<br />
as a full member <strong>of</strong> her or his family, community<br />
and society. This entails a focus not on traditional<br />
notions <strong>of</strong> ‘rescuing’ <strong>the</strong> child, but on investment<br />
in removing <strong>the</strong> physical, cultural, economic, communication,<br />
mobility and attitudinal barriers that<br />
impede <strong>the</strong> realization <strong>of</strong> <strong>the</strong> child’s rights – including<br />
<strong>the</strong> right to active involvement in <strong>the</strong> making<br />
<strong>of</strong> decisions that affect children’s daily lives.<br />
It is <strong>of</strong>ten said that when you change, <strong>the</strong> world<br />
changes. Underestimation <strong>of</strong> <strong>the</strong> abilities <strong>of</strong><br />
people with disabilities is a major obstacle to<br />
<strong>the</strong>ir inclusion. It exists not only in society at<br />
large but also in <strong>the</strong> minds <strong>of</strong> pr<strong>of</strong>essionals,<br />
politicians and o<strong>the</strong>r decision-makers. It can also<br />
occur in families, among peers and in individuals<br />
with a disability, especially in <strong>the</strong> absence <strong>of</strong> evidence<br />
that <strong>the</strong>y are valued and supported in <strong>the</strong>ir<br />
development. Negative or ill-informed attitudes,<br />
from which stem such deprivations as <strong>the</strong> lack <strong>of</strong><br />
reasonable accommodation for children with<br />
disabilities, remain among <strong>the</strong> greatest obstacles<br />
to achieving equality <strong>of</strong> opportunity.<br />
Negative social perceptions may result in children<br />
with disabilities having fewer friends and<br />
being isolated or bullied, <strong>the</strong>ir families experiencing<br />
additional stress, and <strong>the</strong>ir communities<br />
treating <strong>the</strong>m as outsiders. Early studies<br />
<strong>of</strong> <strong>the</strong> way children with disabilities are treated<br />
by <strong>the</strong>ir peers have found that even at <strong>the</strong> preschool<br />
level, <strong>the</strong>y may be overlooked as friends<br />
or playmates, sometimes because o<strong>the</strong>r children<br />
believe that <strong>the</strong>y are not interested or able<br />
to play and interact. 4 A survey <strong>of</strong> families <strong>of</strong><br />
children with disabilities in <strong>the</strong> United Kingdom<br />
found that 70 per cent thought that understanding<br />
and acceptance <strong>of</strong> disability among <strong>the</strong>ir<br />
community was poor or unsatisfactory, and<br />
almost half encountered problems in accessing<br />
such support services as childcare. 5 According<br />
to a 2007 UK study involving children with special<br />
educational needs, 55 per cent said that<br />
<strong>the</strong>y had been treated unfairly because <strong>of</strong> <strong>the</strong>ir<br />
disability. 6 In Madagascar, one study found that<br />
ignorance about disability was common among<br />
parents – and that even among <strong>the</strong> presidents<br />
<strong>of</strong> parents’ associations, 48 per cent believed,<br />
mistakenly, that disability is contagious. 7 A<br />
2009 study in <strong>the</strong> Vietnamese city <strong>of</strong> Da Nang<br />
reported that although <strong>the</strong> community adopted<br />
generally tolerant attitudes towards children<br />
with disabilities and <strong>the</strong>ir families, instances<br />
<strong>of</strong> stigmatization and discrimination persisted.<br />
The appearance <strong>of</strong> children with disabilities in<br />
public on such holidays as Tet, which marks <strong>the</strong><br />
new lunar year, was considered detrimental to<br />
good fortune. 8<br />
FUNDAMENTALS OF INCLUSION<br />
11
It is no wonder, <strong>the</strong>n, that children with disabilities<br />
are among <strong>the</strong> most vulnerable to low selfesteem<br />
and feelings <strong>of</strong> isolation. No child should<br />
be defined by a disability. Each child is unique<br />
and has <strong>the</strong> right to be respected as such. When<br />
societies embrace inclusive principles and demonstrate<br />
this support for equity in practice, children<br />
with disabilities are able to enjoy <strong>the</strong> same<br />
rights and choices as o<strong>the</strong>r children. Enabling<br />
participation in <strong>the</strong> community and providing<br />
educational, cultural and recreational options is<br />
<strong>of</strong> paramount importance for <strong>the</strong> healthy physical<br />
and intellectual development <strong>of</strong> every child.<br />
Where specialized support – for communications<br />
or mobility, for example – is needed to facilitate<br />
interaction and promote self-reliant participation<br />
in everyday activities, access should be free and<br />
available to all.<br />
Changing attitudes<br />
Little will change in <strong>the</strong> lives <strong>of</strong> children with<br />
disabilities until attitudes among communities,<br />
pr<strong>of</strong>essionals, media and governments begin to<br />
Estimated rates <strong>of</strong> primary<br />
school completion<br />
with<br />
disability<br />
without<br />
disability<br />
with<br />
disability<br />
without<br />
disability<br />
42%<br />
51%<br />
53%<br />
Source: World Health Organization, based on surveys in 51 countries.<br />
61%<br />
change. Ignorance about <strong>the</strong> nature and causes<br />
<strong>of</strong> impairments, invisibility <strong>of</strong> <strong>the</strong> children <strong>the</strong>mselves,<br />
serious underestimation <strong>of</strong> <strong>the</strong>ir potential<br />
and capacities, and o<strong>the</strong>r impediments to equal<br />
opportunity and treatment all conspire to keep<br />
children with disabilities silenced and marginalized.<br />
Major public awareness campaigns that<br />
are sponsored by governments, include children<br />
as key presenters and are supported by all civil<br />
society stakeholders can inform, challenge and<br />
expose <strong>the</strong>se barriers to <strong>the</strong> realization <strong>of</strong> rights.<br />
Fur<strong>the</strong>rmore, parents and disabled persons’ organizations<br />
can – and <strong>of</strong>ten do – play pivotal roles<br />
in campaigning for acceptance and inclusion.<br />
Bringing disability into political and social discourse<br />
can help to sensitize decision-makers and<br />
service providers, and demonstrate to society at<br />
large that disability is ‘part <strong>of</strong> <strong>the</strong> human condition’.<br />
9 The importance <strong>of</strong> involving children with<br />
disabilities cannot be overstated. Prejudice can<br />
be effectively reduced through interaction, and<br />
activities that bring toge<strong>the</strong>r children with and<br />
without disabilities have been shown to foster<br />
more positive attitudes. 10 Social integration benefits<br />
everyone. It follows that if societies seek<br />
to reduce inequalities, <strong>the</strong>y should start with<br />
children who are best fitted to build an inclusive<br />
society for <strong>the</strong> next generation. <strong>Children</strong> who<br />
have experienced inclusive education, for<br />
example, can be society’s best teachers.<br />
Inclusive media also have a key part to play.<br />
When children’s literature includes children and<br />
adults with disabilities, it sends out positive messages<br />
that <strong>the</strong>y are members <strong>of</strong> families and<br />
neighbourhoods. It is important for members<br />
<strong>of</strong> all groups, and especially those that may be<br />
discriminated against on <strong>the</strong> grounds <strong>of</strong> race,<br />
gender, ethnicity or disability, to be included in<br />
stories and textbooks for children – not necessarily<br />
as <strong>the</strong> main protagonists but simply to<br />
note <strong>the</strong>ir presence and participation. Books, film<br />
and media portrayal play an important role in<br />
teaching children about social norms. Just as <strong>the</strong><br />
portrayal <strong>of</strong> girl characters in mainstream children’s<br />
media carries implicit notions <strong>of</strong> gender<br />
12<br />
THE STATE OF THE WORLD’S CHILDREN <strong>2013</strong>: <strong>Children</strong> with Disabilities
hierarchy and traditional expectations <strong>of</strong> gender,<br />
so <strong>the</strong> routine absence, misrepresentation or<br />
stereotyping <strong>of</strong> people with disabilities creates<br />
and reinforces social prejudices and leads to <strong>the</strong><br />
underestimation <strong>of</strong> <strong>the</strong> roles and place <strong>of</strong> people<br />
with disabilities in society.<br />
Similarly, participation in social activities helps<br />
to promote a positive view <strong>of</strong> disability. Sport, in<br />
particular, has helped overcome many societal<br />
prejudices. Physical activity can be a powerful<br />
means <strong>of</strong> promoting respect – it is inspirational<br />
to see a child surmount <strong>the</strong> physical and psychological<br />
barriers to participation, including lack<br />
<strong>of</strong> encouragement and support or limited adaptive<br />
equipment. In one study, physically active<br />
children with disabilities were rated as more<br />
competent than <strong>the</strong>ir non-disabled counterparts. 11<br />
However, care must be taken not to create an<br />
artificial atmosphere in which children with disabilities<br />
who demonstrate physical heroism are<br />
deemed worthy and those who do not are made<br />
to feel inferior.<br />
Sport has also been helpful in campaigns to<br />
reduce stigma. Athletes with disabilities are<br />
<strong>of</strong>ten among <strong>the</strong> most recognized representatives<br />
<strong>of</strong> people with disabilities, and many use<br />
such platforms as <strong>the</strong> Paralympics and Special<br />
Olympics to campaign and to become role<br />
models for children with physical or intellectual<br />
impairments. Moreover, experiences in Bosnia<br />
and Herzegovina, <strong>the</strong> Lao People’s Democratic<br />
Republic, Malaysia and <strong>the</strong> Russian Federation<br />
show that access to sport and recreation is not<br />
only <strong>of</strong> direct benefit to children with disabilities<br />
but also helps to raise <strong>the</strong>ir standing in <strong>the</strong> community<br />
as <strong>the</strong>y are seen to participate alongside<br />
o<strong>the</strong>r children in activities valued by society. 12<br />
Encouraging children with disabilities to take<br />
part in sport and recreation in company with all<br />
<strong>the</strong>ir peers is more than a matter <strong>of</strong> changing<br />
attitudes. It is a right and a specific requirement<br />
<strong>of</strong> <strong>the</strong> CRPD, which instructs <strong>State</strong>s parties to<br />
“ensure that children with disabilities have equal<br />
access with o<strong>the</strong>r children to participation in play,<br />
It’s about ability<br />
Montenegro’s ‘It’s About Ability’ campaign was<br />
launched in September 2010 and has had an impact on<br />
<strong>the</strong> public’s knowledge <strong>of</strong> and attitudes and practices<br />
towards children with disabilities. The campaign brings<br />
toge<strong>the</strong>r a broad coalition <strong>of</strong> 100 national and international<br />
organizations ranging from <strong>the</strong> Government<br />
<strong>of</strong> Montenegro to <strong>the</strong> European Union, <strong>the</strong> Council <strong>of</strong><br />
Europe, <strong>the</strong> Organization for Security and Co-operation<br />
in Europe, United Nations agencies, embassies, associations<br />
<strong>of</strong> parents <strong>of</strong> children with disabilities, print<br />
and electronic media, <strong>the</strong> private sector, local <strong>of</strong>ficials<br />
and children with and without disabilities. One <strong>of</strong> <strong>the</strong><br />
campaign’s strategies involved <strong>the</strong> use <strong>of</strong> billboards all<br />
over <strong>the</strong> country to show children with disabilities as<br />
active members <strong>of</strong> society, portraying <strong>the</strong>m as athletes,<br />
friends, musicians, dancers, students, daughters, sons,<br />
bro<strong>the</strong>rs and sisters.<br />
A November 2011 survey measuring <strong>the</strong> impact <strong>of</strong> <strong>the</strong><br />
campaign reported that it contributed to an 18 per<br />
cent increase in <strong>the</strong> number <strong>of</strong> people who consider<br />
children with disabilities as equal members <strong>of</strong> society.<br />
Behaviour toward children with disabilities and<br />
communication between <strong>the</strong>m and people without<br />
disabilities were also seen to improve.<br />
recreation and leisure and sporting activities,<br />
including those activities in <strong>the</strong> school system.”<br />
Supporting children and<br />
<strong>the</strong>ir families<br />
The CRPD underlines <strong>the</strong> role <strong>of</strong> <strong>the</strong> family as <strong>the</strong><br />
natural unit <strong>of</strong> society and <strong>the</strong> role <strong>of</strong> <strong>the</strong> <strong>State</strong><br />
in supporting <strong>the</strong> family. It says that “persons<br />
with disabilities and <strong>the</strong>ir family members should<br />
receive <strong>the</strong> necessary protection and assistance<br />
to enable families to contribute towards <strong>the</strong> full<br />
and equal enjoyment <strong>of</strong> <strong>the</strong> rights <strong>of</strong> persons<br />
with disabilities.” 13<br />
The process <strong>of</strong> fulfilling <strong>the</strong> rights <strong>of</strong> a child with<br />
a disability – <strong>of</strong> including that child in community<br />
FUNDAMENTALS OF INCLUSION<br />
13
Social protection for children with disabilities<br />
and <strong>the</strong>ir families is especially important because<br />
<strong>the</strong>se families <strong>of</strong>ten face a higher cost <strong>of</strong> living<br />
and lost opportunities to earn income.<br />
Estimates <strong>of</strong> <strong>the</strong> additional costs <strong>of</strong> disability<br />
borne by families range from 11–69 per cent<br />
<strong>of</strong> income in <strong>the</strong> United Kingdom to 29–37 per<br />
cent in Australia, 20–37 per cent in Ireland, 9 per<br />
cent in Viet Nam and 14 per cent in Bosnia and<br />
Herzegovina. 14 Costs associated with disability<br />
include such direct expenses as medical treatment,<br />
travel, rehabilitation or assistance with<br />
care, and such opportunity costs as <strong>the</strong> income<br />
forgone when parents or family members give<br />
up or limit <strong>the</strong>ir employment to care for a child or<br />
children with disabilities. 15<br />
Marmane, 8, looks over her shoulder in a rehabilitation<br />
centre run by <strong>the</strong> international non-governmental<br />
organization Médecins sans Frontières in Port-au-Prince,<br />
Haiti. © UNICEF/HQ2005-1970/LeMoyne<br />
life – begins with establishing a home setting<br />
conducive to early intervention. It involves stimulation<br />
and interaction with parents and caregivers<br />
from <strong>the</strong> first days and weeks <strong>of</strong> life through <strong>the</strong><br />
different stages <strong>of</strong> <strong>the</strong> child’s educational and<br />
recreational development. Inclusion is important<br />
at all ages but <strong>the</strong> earlier children with disabilities<br />
are given <strong>the</strong> chance to interact with peers and<br />
<strong>the</strong> larger society, <strong>the</strong> greater <strong>the</strong> likely benefits<br />
for all children.<br />
Under <strong>the</strong> CRPD, children with disabilities and<br />
<strong>the</strong>ir families have <strong>the</strong> right to an adequate standard<br />
<strong>of</strong> living, including adequate food, clothing<br />
and housing. <strong>Children</strong> with disabilities and those<br />
responsible for <strong>the</strong>ir care are also entitled to such<br />
subsidized or free support services as day care,<br />
respite care and access to self-help groups.<br />
The International Labour Organization has estimated<br />
that in 10 low- and middle-income countries,<br />
<strong>the</strong> economic costs <strong>of</strong> disability amount to<br />
3–5 per cent <strong>of</strong> gross domestic product. 16 A review<br />
<strong>of</strong> 14 developing countries found that people<br />
with disabilities were more likely to experience<br />
poverty than those without disabilities. 17 People<br />
with disabilities tended to be less well <strong>of</strong>f in terms<br />
<strong>of</strong> education, employment, living conditions,<br />
consumption and health. In Malawi and Uganda,<br />
households with members who have disabilities<br />
have been found more likely to be poorer than<br />
similar households without disabled members. 18<br />
Households with members with disabilities generally<br />
have lower incomes than o<strong>the</strong>r households<br />
and are at greater risk <strong>of</strong> living below <strong>the</strong> poverty<br />
line. 19 In developing countries, households with a<br />
member or members who have disabilities spend<br />
considerably more on health care. 20 This means<br />
that even a household that technically stands<br />
above <strong>the</strong> poverty line but includes a member<br />
or members with disabilities can actually have<br />
a standard <strong>of</strong> living equivalent to that <strong>of</strong> a household<br />
below <strong>the</strong> poverty line but without members<br />
with disabilities.<br />
The evidence is clear that childhood disability<br />
diminishes a person’s life chances. <strong>Children</strong> with<br />
disabilities grow up poorer, have less access<br />
14<br />
THE STATE OF THE WORLD’S CHILDREN <strong>2013</strong>: <strong>Children</strong> with Disabilities
to education and health-care services, and are<br />
worse <strong>of</strong>f on a host <strong>of</strong> measures including <strong>the</strong><br />
likelihood <strong>of</strong> family break-up and abuse.<br />
<strong>State</strong>s can tackle <strong>the</strong> consequent, increased risk <strong>of</strong><br />
child poverty with such social protection initiatives<br />
as cash transfer programmes. These programmes<br />
are relatively easy to administer and provide for<br />
flexibility in meeting <strong>the</strong> particular needs <strong>of</strong> parents<br />
and children. They also respect <strong>the</strong> decisionmaking<br />
rights <strong>of</strong> parents and children.<br />
Cash transfer programmes have been shown<br />
to benefit children, 21 although it can be difficult<br />
to gauge <strong>the</strong> extent to which <strong>the</strong>y are used<br />
by and useful to children with disabilities and<br />
those who care for <strong>the</strong>m. 22 A growing number <strong>of</strong><br />
low- and middle-income countries are building<br />
on promising results from <strong>the</strong>se broader efforts<br />
and have launched targeted social protection<br />
initiatives that include cash transfers specifically<br />
for children with disabilities. These countries<br />
include Bangladesh, Brazil, Chile, India, Lesotho,<br />
Mozambique, Namibia, Nepal, South Africa,<br />
Turkey and Viet Nam, among o<strong>the</strong>rs. The type<br />
<strong>of</strong> allowances and criteria for receiving <strong>the</strong>m<br />
vary greatly. Some are tied to <strong>the</strong> severity <strong>of</strong><br />
<strong>the</strong> child’s impairment. Routine monitoring and<br />
evaluation <strong>of</strong> <strong>the</strong> transfers’ effects on <strong>the</strong> health,<br />
educational and recreational attainment <strong>of</strong> children<br />
with disabilities will be essential to make<br />
sure <strong>the</strong>se transfers achieve <strong>the</strong>ir objectives.<br />
Ano<strong>the</strong>r tool governments can use is disabilityspecific<br />
budgeting. For instance, a government<br />
that has committed to ensuring that all children<br />
receive free, high-quality education would include<br />
specific goals regarding children with disabilities<br />
from <strong>the</strong> outset and take care to allocate a sufficient<br />
portion <strong>of</strong> <strong>the</strong> available resources to covering<br />
such things as training teachers, making infrastructure<br />
and curricula accessible, and procuring<br />
and fitting assistive devices.<br />
Effective access to services including education,<br />
health care, habilitation (training and treatment<br />
to carry out <strong>the</strong> activities <strong>of</strong> daily living), rehabilitation<br />
(products and services to help restore<br />
A young boy with albinism reads Braille at school in <strong>the</strong> town <strong>of</strong> Moshi, United Republic <strong>of</strong> Tanzania.<br />
© UNICEF/HQ2008-1786/Pirozzi<br />
FUNDAMENTALS OF INCLUSION<br />
15
function after an impairment is acquired) and<br />
recreation should be provided free <strong>of</strong> charge and<br />
be consistent with promoting <strong>the</strong> fullest possible<br />
social integration and individual development <strong>of</strong><br />
<strong>the</strong> child, including cultural and spiritual development.<br />
Such measures can promote inclusion in<br />
society, in <strong>the</strong> spirit <strong>of</strong> Article 23 <strong>of</strong> <strong>the</strong> CRC, which<br />
states that a child with a disability “should enjoy<br />
a full and decent life, in conditions which ensure<br />
dignity, promote self-reliance and facilitate <strong>the</strong><br />
child’s active participation in <strong>the</strong> community.” 23<br />
<strong>State</strong>s parties to <strong>the</strong> CRPD have obligated<br />
<strong>the</strong>mselves to take action to eliminate discrimination<br />
against children with disabilities and<br />
to make <strong>the</strong>ir inclusion in society a priority.<br />
Comprehensive national strategies with measurable<br />
outcomes will make it more likely for<br />
all children to realize <strong>the</strong>ir rights. International<br />
cooperation and exchange <strong>of</strong> information and<br />
technical assistance – including advances in<br />
teaching or community-based approaches to<br />
early intervention – could fur<strong>the</strong>r <strong>the</strong>se aims.<br />
Development assistance programmes focusing<br />
on children can help by taking into account <strong>the</strong><br />
needs <strong>of</strong> children with disabilities and <strong>the</strong>ir families,<br />
particularly in low-income settings where<br />
systems to protect and promote <strong>the</strong> rights <strong>of</strong><br />
children with disabilities may be weak.<br />
Services for children with disabilities are<br />
delivered by a range <strong>of</strong> government and<br />
non-governmental institutions. Appropriate<br />
multi-sectoral coordination involving family<br />
members would help to avoid gaps in provision<br />
and should be attuned to changes in <strong>the</strong> child’s<br />
capacities and needs as she or he grows and<br />
experiences life.<br />
Community-based rehabilitation<br />
Community-based rehabilitation (CBR) programmes<br />
are designed and run by local communities.<br />
CBR seeks to ensure that people with<br />
Community-based rehabilitation<br />
CBR<br />
MATRIX<br />
HEALTH EDUCATION LIVELIHOOD SOCIAL EMPOWERMENT<br />
PROMOTION<br />
EARLY<br />
CHILDHOOD<br />
SKILLS<br />
DEVELOPMENT<br />
PERSONAL<br />
ASSISTANCE<br />
ADVOCACY &<br />
COMMUNICATION<br />
PREVENTION<br />
PRIMARY<br />
SELF-<br />
EMPLOYMENT<br />
RELATIONSHIPS<br />
MARRIAGE &<br />
FAMILY<br />
COMMUNITY<br />
MOBILIZATION<br />
MEDICAL CARE<br />
SECONDARY &<br />
HIGHER<br />
WAGE<br />
EMPLOYMENT<br />
CULTURE &<br />
ARTS<br />
POLITICAL<br />
PARTICIPATION<br />
REHABILITATION<br />
ASSISTIVE<br />
DEVICES<br />
NON-FORMAL<br />
LIFELONG<br />
LEARNING<br />
FINANCIAL<br />
SERVICES<br />
SOCIAL<br />
PROTECTION<br />
RECREATION,<br />
LEISURE &<br />
SPORTS<br />
JUSTICE<br />
SELF-HELP<br />
GROUPS<br />
RECREATION,<br />
LEISURE &<br />
SPORTS<br />
Source: World Health Organization.<br />
16<br />
THE STATE OF THE WORLD’S CHILDREN <strong>2013</strong>: <strong>Children</strong> with Disabilities
An inclusive kindergarten in Nizhny Novgorod, Russian Federation. © UNICEF/RUSS/2011/Kochineva<br />
disabilities have equal access to rehabilitation<br />
and o<strong>the</strong>r services and opportunities – health,<br />
education, livelihoods. Developed by <strong>the</strong> World<br />
Health Organization (WHO) in <strong>the</strong> late 1970s and<br />
early 1980s, it is practised in more than 90 countries<br />
and represents a move away from <strong>the</strong> concentration<br />
<strong>of</strong> care in institutions and at <strong>the</strong> hands<br />
<strong>of</strong> specialists towards community self-reliance,<br />
collaboration and ownership in addressing <strong>the</strong><br />
particular needs <strong>of</strong> people with disabilities –<br />
critically, with <strong>the</strong>ir own active participation. 24<br />
CBR can prove effective in addressing multiple<br />
deprivations. <strong>Children</strong> with disabilities who live<br />
in rural and indigenous communities contend<br />
with multiple disadvantages: They have disabilities,<br />
<strong>the</strong>y belong to a marginalized group<br />
and <strong>the</strong>y live in remote locations. They have<br />
little or no access to services that could ensure<br />
<strong>the</strong>ir development, protection and participation<br />
in community life. 25 An outreach initiative led<br />
by <strong>the</strong> Centre for Research and Post-Secondary<br />
Studies in Social Anthropology (CIESAS) in<br />
Oaxaca, Mexico, provides an example <strong>of</strong> CBR<br />
for indigenous children with disabilities, <strong>the</strong>ir<br />
families and community. In collaboration with<br />
UNICEF and with financing from <strong>the</strong> state welfare<br />
agency DIF-Oaxaca, CIESAS used CBR to advance<br />
<strong>the</strong> inclusion <strong>of</strong> children with disabilities in four<br />
remote rural communities 26 with large indigenous<br />
populations and low Human Development Index<br />
scores. Teams – made up <strong>of</strong> a doctor, a physical<br />
or occupational <strong>the</strong>rapist, an educator and two<br />
community activists fluent in local indigenous<br />
languages – were trained and sent into <strong>the</strong> communities<br />
to conduct workshops on discrimination,<br />
inclusion and children’s rights. They promoted<br />
<strong>the</strong> formation <strong>of</strong> local support networks<br />
among <strong>the</strong> families <strong>of</strong> children with disabilities<br />
and, where appropriate, provided referrals to medical<br />
treatment or <strong>the</strong>rapy. During <strong>the</strong> three-year<br />
period 2007–2010, <strong>the</strong> initiative led to increased<br />
FUNDAMENTALS OF INCLUSION<br />
17
acceptance <strong>of</strong> indigenous children with disabilities<br />
by <strong>the</strong>ir own families and communities. Benefits<br />
also included improved provision <strong>of</strong> social services,<br />
community-led construction <strong>of</strong> wheelchair<br />
ramps to make public spaces accessible, agreement<br />
by state and federal hospitals to provide<br />
services free <strong>of</strong> charge to children with disabilities<br />
referred by <strong>the</strong> project – and 32 new enrolments <strong>of</strong><br />
children with disabilities in mainstream schools. 27<br />
Assistive technology<br />
Depending on <strong>the</strong> type <strong>of</strong> disability, a child may<br />
need any <strong>of</strong> a number <strong>of</strong> assistive devices and<br />
services (see next page). According to <strong>the</strong> World<br />
Health Organization, however, in many lowincome<br />
countries only 5–15 per cent <strong>of</strong> <strong>the</strong> people<br />
who need assistive technology are able to obtain<br />
it. 28 Reasons for this include costs, which can be<br />
especially prohibitive in <strong>the</strong> case <strong>of</strong> children, who<br />
need <strong>the</strong>ir assistive devices replaced or adjusted<br />
from time to time as <strong>the</strong>y grow. 29 <strong>Children</strong> are<br />
<strong>of</strong>ten less likely than adults to access assistive<br />
technology. 30 The provision and uses <strong>of</strong> assistive<br />
technology are discussed in a Focus article published<br />
online at .<br />
Universal design<br />
Inclusive approaches are built around <strong>the</strong> concept<br />
<strong>of</strong> accessibility, with <strong>the</strong> aim <strong>of</strong> making <strong>the</strong><br />
mainstream work for everyone ra<strong>the</strong>r than creating<br />
parallel systems. An accessible environment<br />
is essential if children with disabilities are to<br />
enjoy <strong>the</strong>ir right to participate in <strong>the</strong> community.<br />
For instance, access to all schools is necessary<br />
if children with disabilities are to take part in<br />
education. <strong>Children</strong> who are educated alongside<br />
<strong>the</strong>ir peers have a much better chance <strong>of</strong><br />
becoming productive members <strong>of</strong> <strong>the</strong>ir societies<br />
and <strong>of</strong> being integrated in <strong>the</strong> lives <strong>of</strong> <strong>the</strong>ir<br />
communities. 31<br />
Accessibility can refer to <strong>the</strong> design <strong>of</strong> an<br />
environment, product or structure. Universal<br />
design is defined as <strong>the</strong> design <strong>of</strong> products<br />
Liban, 8, uses crutches after losing a leg to a bomb explosion in Mogadiscio, Somalia. © UNICEF/HQ2011-2423/Grarup<br />
18<br />
THE STATE OF THE WORLD’S CHILDREN <strong>2013</strong>: <strong>Children</strong> with Disabilities
Assistive technology products<br />
Category<br />
Mobility<br />
Vision<br />
Hearing<br />
Communication<br />
Cognition<br />
Examples <strong>of</strong> products<br />
• Walking stick, crutch, walking frame, manual and powered wheelchair, tricycle<br />
• Artificial leg or hand, caliper, hand splint, club foot brace<br />
• Corner chair, special seat, standing frame<br />
• Adapted cutlery and cooking utensils, dressing stick, shower seat, toilet seat, toilet frame, feeding robot<br />
• Eyeglasses, magnifier, magnifying s<strong>of</strong>tware for computer<br />
• White cane, GPS-based navigation device<br />
• Braille systems for reading and writing, screen reader for computer, talking book player, audio recorder and player<br />
• Braille chess, balls that emit sound<br />
• Headphone, hearing aid<br />
• Amplified telephone, hearing loop<br />
• Communication cards with texts, communication board with letters, symbols or pictures<br />
• Electronic communication device with recorded or syn<strong>the</strong>tic speech<br />
• Task lists, picture schedule and calendar, picture-based instructions<br />
• Timer, manual or automatic reminder, smartphone with adapted task lists, schedules, calendars and audio recorder<br />
• Adapted toys and games<br />
Source: Johan Borg; International Organization for Standardization (2008), .<br />
and environments to be usable by all people,<br />
to <strong>the</strong> greatest extent possible, without <strong>the</strong><br />
need for adaptation or specialized design.<br />
The approach focuses on design that works<br />
for all people regardless <strong>of</strong> age, ability or<br />
situation.<br />
The principles <strong>of</strong> universal design were developed<br />
by architects, product designers, engineers<br />
and environmental design researchers.<br />
They cut across design disciplines and may be<br />
applied to guide <strong>the</strong> design process or evaluate<br />
existing designs. There are seven principles:<br />
equitable use; flexibility in use; simple and<br />
intuitive use; perceptible information; tolerance<br />
for error; low physical effort; and size<br />
and space for approach and use.<br />
In practice, universal design can be found in<br />
<strong>the</strong> form <strong>of</strong> curb cuts or sidewalk ramps, audio<br />
books, Velcro fastenings, cabinets with pull-out<br />
shelves, automatic doors and low-floor buses.<br />
The cost <strong>of</strong> integrating accessibility into new<br />
buildings and infrastructure can be negligible,<br />
amounting to less than 1 per cent <strong>of</strong> <strong>the</strong> capital<br />
development cost. 32 However, <strong>the</strong> cost <strong>of</strong> making<br />
adaptations to completed buildings can be much<br />
higher, especially for smaller buildings, where<br />
it can reach 20 per cent <strong>of</strong> <strong>the</strong> original cost. 33 It<br />
makes sense to integrate accessibility considerations<br />
into projects at <strong>the</strong> early stages <strong>of</strong> <strong>the</strong><br />
design process. Accessibility should also be a<br />
consideration when funding development<br />
projects.<br />
FUNDAMENTALS OF INCLUSION<br />
19
PERSPECTIVE<br />
For deaf young people,<br />
language is <strong>the</strong> key<br />
By Krishneer Sen<br />
Krishneer Sen, a deaf youth activist<br />
from Suva, Fiji, and recipient <strong>of</strong> <strong>the</strong><br />
World Deaf Leadership scholarship,<br />
is studying information technology<br />
at Gallaudet University, United<br />
<strong>State</strong>s. In 2012, he served as an<br />
intern with UNICEF Fiji.<br />
Access to information and<br />
means <strong>of</strong> communication are<br />
essential for anyone to realize<br />
<strong>the</strong>ir rights as a citizen. Without<br />
ways to ga<strong>the</strong>r knowledge,<br />
express opinions and voice<br />
demands, it is impossible to<br />
obtain an education, find a job<br />
or participate in civic affairs.<br />
In my country, Fiji, lack <strong>of</strong><br />
access to information and<br />
means <strong>of</strong> communication are<br />
<strong>the</strong> biggest issue facing deaf<br />
children. Information and<br />
communication technology<br />
(ICT), which I am studying<br />
at university, is helping deaf<br />
people around <strong>the</strong> world, creating<br />
opportunities that simply<br />
would not have been possible<br />
a generation ago. Where available,<br />
ICT provides deaf people<br />
with <strong>the</strong> chance to communicate<br />
and connect with friends,<br />
reduces <strong>the</strong>ir isolation and<br />
opens up avenues for <strong>the</strong>ir participation<br />
in political, economic,<br />
social and cultural life. Those<br />
who lack access – because <strong>the</strong>y<br />
live in rural areas, are poor or<br />
lack education, or for whom<br />
appropriately adapted devices<br />
are not yet available – experience<br />
frustration and exclusion.<br />
Deaf Fijians like me have<br />
limited access to <strong>the</strong> media,<br />
emergency services – and even<br />
simple telephone conversations.<br />
In <strong>the</strong> absence <strong>of</strong> such<br />
assistive technology as captioned<br />
telephones, we must<br />
rely on people who can hear to<br />
serve as interpreters, or resort<br />
to text messaging. This will not<br />
change until ICT and media<br />
policy for people with disabilities<br />
become a top government<br />
priority.<br />
Deaf people can succeed and<br />
contribute to society just like<br />
hearing people. Developing<br />
<strong>the</strong>ir abilities begins with education<br />
and language. Because<br />
deaf children grow up in a<br />
hearing world, quality education<br />
necessarily means bilingual<br />
education. In Fiji, deaf<br />
children should be taught Fiji<br />
Sign Language in addition<br />
to <strong>the</strong> languages commonly<br />
taught to hearing Fijian children<br />
(English, Fijian and Hindi),<br />
and this should start at birth.<br />
Bilingual education helps deaf<br />
children develop <strong>the</strong>ir ability<br />
to communicate using <strong>the</strong> languages<br />
<strong>of</strong> hearing people: Deaf<br />
children who can communicate<br />
effectively in sign language will<br />
find it easier to learn o<strong>the</strong>r languages,<br />
like English. I believe<br />
that bilingualism will give deaf<br />
children better access to <strong>the</strong><br />
20<br />
THE STATE OF THE WORLD’S CHILDREN <strong>2013</strong>: <strong>Children</strong> with Disabilities
We need to make media more accessible to deaf children<br />
by captioning or interpreting television programmes and<br />
developing children’s programmes that use sign language.<br />
education <strong>the</strong>y need to function<br />
as equal citizens.<br />
As a kid, I used to watch cartoon<br />
programmes on Fijian TV<br />
with no subtitles or sign language<br />
interpreters. My family<br />
didn’t know sign language well.<br />
Later on, I realized that <strong>the</strong> reason<br />
I was still struggling with<br />
my English was that I had not<br />
been exclusively taught using<br />
signs at home. Parents have<br />
an important role in facilitating<br />
deaf children’s ability to communicate<br />
and access information;<br />
along with o<strong>the</strong>r people<br />
who interact with deaf children,<br />
<strong>the</strong>y need to take <strong>the</strong> initiative<br />
and use sign language to communicate<br />
in <strong>the</strong>ir daily lives, at<br />
home and school.<br />
We need to make media more<br />
accessible to deaf children by<br />
captioning or interpreting television<br />
programmes and developing<br />
children’s programmes<br />
that use sign language. We<br />
need an environment free<br />
<strong>of</strong> communication barriers. I<br />
would like to see Fijian Sign<br />
Language used in a range <strong>of</strong><br />
programmes, from news to<br />
cartoons. In addition to television,<br />
social media can provide<br />
powerful tools to enhance<br />
knowledge about Fiji and<br />
international affairs and ensure<br />
that everyone, including people<br />
with disabilities, has access to<br />
information about <strong>the</strong> political<br />
situation and can cast an<br />
informed vote during elections.<br />
Making ICT available to deaf<br />
children can facilitate <strong>the</strong>ir<br />
social and emotional development,<br />
help <strong>the</strong>m learn in<br />
mainstream schools and prepare<br />
<strong>the</strong>m for future employment.<br />
I took a basic computer<br />
class at a special school, and<br />
it changed my life for <strong>the</strong> better:<br />
It was through <strong>the</strong> Internet<br />
that I learned about Gallaudet<br />
University, where I now study.<br />
In addition to enhancing education,<br />
ICT provides deaf and<br />
o<strong>the</strong>r young people with disabilities<br />
to learn about <strong>the</strong>ir<br />
rights and band toge<strong>the</strong>r to<br />
campaign for <strong>the</strong>ir realization.<br />
By facilitating activism, ICT<br />
may thus help increase <strong>the</strong><br />
pr<strong>of</strong>ile <strong>of</strong> persons with disabilities<br />
within society at large<br />
and allow <strong>the</strong>m to participate<br />
actively.<br />
My dream is to see deaf people<br />
communicate freely with hearing<br />
people through <strong>the</strong> use <strong>of</strong><br />
assistive technologies. Once<br />
I graduate, I plan to start a<br />
project to set up communication<br />
technologies in Fiji in order<br />
to facilitate communication<br />
between hearing and deaf people,<br />
using sign language interpreters<br />
as well as video calling.<br />
I will be working with <strong>the</strong> Fiji<br />
Association for <strong>the</strong> Deaf, <strong>of</strong><br />
which I have been a member<br />
for many years, to advocate<br />
for human rights, opportunities<br />
and equality.<br />
If <strong>the</strong> government is to consider<br />
<strong>the</strong> needs <strong>of</strong> deaf people<br />
a priority, deaf people must<br />
advocate on our own behalf.<br />
To facilitate activism among<br />
deaf people, we must educate<br />
deaf children to use both sign<br />
language and <strong>the</strong> languages <strong>of</strong><br />
<strong>the</strong> hearing communities <strong>the</strong>y<br />
live in, and we must work to<br />
expand access to technologies<br />
through which <strong>the</strong>y can find<br />
information and communicate<br />
with o<strong>the</strong>rs, deaf and hearing.<br />
FUNDAMENTALS OF INCLUSION<br />
21
A teacher with a hearing impairment teaches a class <strong>of</strong> hearing-impaired children in Gulu, Uganda. © UNICEF/UGDA2012-00108/Sibiloni
CHAPTER 3<br />
A STRONG<br />
FOUNDATION<br />
Good health, nutrition and a solid education: These are<br />
<strong>the</strong> building blocks <strong>of</strong> life that children and <strong>the</strong>ir parents<br />
want, and to which all children are entitled.<br />
Inclusive health<br />
Under <strong>the</strong> Convention on <strong>the</strong> Rights <strong>of</strong> <strong>the</strong><br />
Child (CRC) and <strong>the</strong> Convention on <strong>the</strong> Rights<br />
<strong>of</strong> Persons with Disabilities (CRPD), all children<br />
have <strong>the</strong> right to <strong>the</strong> highest attainable standard<br />
<strong>of</strong> health. It follows that children with disabilities<br />
are equally entitled to <strong>the</strong> full spectrum <strong>of</strong> care<br />
– from immunization in infancy to proper nutrition<br />
and treatment for <strong>the</strong> ailments and injuries<br />
<strong>of</strong> childhood, to confidential sexual and reproductive<br />
health information and services during<br />
adolescence and into early adulthood. Equally<br />
critical are such basic services as water,<br />
sanitation and hygiene.<br />
Ensuring that children with disabilities actually<br />
enjoy <strong>the</strong>se rights on a par with o<strong>the</strong>rs is <strong>the</strong><br />
objective <strong>of</strong> an inclusive approach to health. This<br />
is a matter <strong>of</strong> social justice and <strong>of</strong> respecting <strong>the</strong><br />
inherent dignity <strong>of</strong> all human beings. It is also<br />
an investment in <strong>the</strong> future: Like o<strong>the</strong>r children,<br />
those with disabilities are tomorrow’s adults.<br />
They need good health for its own sake, for<br />
<strong>the</strong> crucial role it plays in facilitating a happy<br />
childhood and for <strong>the</strong> boost it can give <strong>the</strong>ir<br />
prospects as future producers and parents.<br />
Immunization<br />
Immunizations are a critical component <strong>of</strong><br />
global efforts to reduce childhood illness and<br />
death. They are among <strong>the</strong> most successful and<br />
cost-effective <strong>of</strong> all public health interventions,<br />
with <strong>the</strong> strong potential to reduce <strong>the</strong> burden <strong>of</strong><br />
morbidity and mortality, particularly for children<br />
under 5 years <strong>of</strong> age. For this reason, immunization<br />
has been a cornerstone <strong>of</strong> national and international<br />
health initiatives. More children than ever<br />
before are being reached. One consequence has<br />
been that <strong>the</strong> incidence <strong>of</strong> polio – which can lead<br />
to permanent muscle paralysis – fell from more<br />
than 350,000 cases in 1988 to 221 cases in 2012. 34<br />
There is still a considerable way to go. In 2008,<br />
for example, over a million children under<br />
5 died from pneumococcal disease, rotavirus<br />
diarrhoea and Haemophilus influenzae type B.<br />
Vaccination can actually prevent a large number<br />
<strong>of</strong> <strong>the</strong>se deaths. 35<br />
The inclusion <strong>of</strong> children with disabilities in<br />
immunization efforts is not only ethical but<br />
imperative for public health and equity: Goals<br />
<strong>of</strong> universal coverage can only be achieved if<br />
children who have disabilities are included in<br />
immunization efforts. 36<br />
While immunization is an important means <strong>of</strong><br />
pre-empting diseases that lead to disabilities, it<br />
is no less important for a child who already has a<br />
disability to be immunized. Unfortunately, many<br />
children with disabilities are still not benefiting<br />
from increased immunization coverage, though<br />
<strong>the</strong>y are at <strong>the</strong> same risk <strong>of</strong> childhood diseases<br />
as all children. If <strong>the</strong>y are left unimmunized or<br />
A STRONG FOUNDATION<br />
23
only partially immunized, <strong>the</strong> results can include<br />
delays in reaching developmental milestones,<br />
avoidable secondary conditions and, at worst,<br />
preventable death. 37<br />
It will help to bring children with disabilities<br />
into <strong>the</strong> immunization fold if efforts to promote<br />
immunization include <strong>the</strong>m. Showing children<br />
with disabilities alongside o<strong>the</strong>rs on campaign<br />
posters and promotional materials, for example,<br />
can help to promote awareness. Enhancing<br />
popular understanding <strong>of</strong> <strong>the</strong> importance <strong>of</strong><br />
immunizing each child also involves reaching<br />
out to parents through public health campaigns,<br />
civil society and disabled peoples’ organizations,<br />
schools and mass media.<br />
Nutrition<br />
About 870 million people worldwide are thought<br />
to be undernourished. Among <strong>the</strong>m, some 165<br />
million under-fives are believed to be stunted,<br />
or chronically malnourished, and more than 100<br />
million are considered underweight. Insufficient<br />
food or a poorly balanced diet short <strong>of</strong> certain<br />
vitamins and minerals (iodine, vitamin A, iron<br />
and zinc, for example) can leave infants and<br />
children vulnerable to specific conditions or<br />
a host <strong>of</strong> infections that can lead to physical,<br />
sensory or intellectual disabilities. 38<br />
Between 250,000 and 500,000 children are considered<br />
to be at risk <strong>of</strong> becoming blind each year<br />
from vitamin A deficiency, a syndrome easily<br />
prevented by oral supplementation costing just<br />
a few cents per child. 39 For a similarly minute<br />
amount – five cents per person per year – salt<br />
iodization remains <strong>the</strong> most cost-effective way<br />
<strong>of</strong> delivering iodine and preventing cognition<br />
damage in children in iodine-deficient areas. 40<br />
These low-cost measures help not only children<br />
with disabilities but also <strong>the</strong>ir mo<strong>the</strong>rs as <strong>the</strong>y<br />
labour to raise infants and children in strained<br />
circumstances.<br />
Doing homework in Bangladesh. © Broja Gopal Saha/Centre for Disability in Development<br />
24<br />
THE STATE OF THE WORLD’S CHILDREN <strong>2013</strong>: <strong>Children</strong> with Disabilities
Early childhood stunting, which is measured as<br />
low height for age, is caused by poor nutrition<br />
and diarrhoea. A multi-country study showed<br />
that each episode <strong>of</strong> diarrhoea in <strong>the</strong> first two<br />
years <strong>of</strong> life contributes to stunting, 41 which is<br />
estimated to affect some 28 per cent <strong>of</strong> children<br />
younger than 5 in low- and middle-income<br />
countries. 42 The consequences <strong>of</strong> stunting, such<br />
as poor cognitive and educational performance,<br />
begin when children are very young but affect<br />
<strong>the</strong>m through <strong>the</strong> rest <strong>of</strong> <strong>the</strong>ir lives. However,<br />
community-based efforts to improve basic health<br />
practices have been shown to reduce stunting<br />
among young children. 43<br />
A combination <strong>of</strong> physical factors and attitudes<br />
may adversely affect child nutrition. In some<br />
societies, mo<strong>the</strong>rs may not be encouraged to<br />
breastfeed a disabled child. Stigma and discrimination<br />
may also result in a child with a disability<br />
being fed less, denied food or provided with less<br />
nutritious food than siblings without disabilities.<br />
49 <strong>Children</strong> with some types <strong>of</strong> physical or<br />
intellectual disabilities may also have difficulty<br />
in feeding <strong>the</strong>mselves, or need additional time<br />
or assistance to eat. It is probable that in some<br />
cases what is assumed to be disability-associated<br />
ill health and wasting may in fact be connected<br />
with feeding problems. 50<br />
Malnutrition in mo<strong>the</strong>rs can lead to a number <strong>of</strong><br />
preventable childhood disabilities. Approximately<br />
42 per cent <strong>of</strong> pregnant women in low- and<br />
middle-income countries are anaemic, and more<br />
than one in two pregnant women in <strong>the</strong>se countries<br />
suffer iron deficiency anaemia. 44 Anaemia<br />
also affects more than half <strong>of</strong> pre-school aged<br />
children in developing countries. It is one <strong>of</strong> <strong>the</strong><br />
most prevalent causes <strong>of</strong> disability in <strong>the</strong> world<br />
– and <strong>the</strong>refore a serious global public health<br />
problem. 45 Malnutrition in lactating mo<strong>the</strong>rs can<br />
also contribute to poorer infant health, 46 increasing<br />
<strong>the</strong> risk <strong>of</strong> diseases that can cause disability.<br />
Healthy mo<strong>the</strong>rs can help reduce <strong>the</strong> incidence<br />
<strong>of</strong> some disabilities and are better prepared to<br />
minister to <strong>the</strong>ir children’s needs.<br />
While malnutrition can be a cause <strong>of</strong> disability,<br />
it can also be a consequence. Indeed, children<br />
with disabilities are at heightened risk <strong>of</strong> malnutrition.<br />
For example, an infant with cleft palate<br />
may not be able to breastfeed or consume<br />
food effectively. <strong>Children</strong> with cerebral palsy<br />
may have difficulty chewing or swallowing. 47<br />
Certain conditions, such as cystic fibrosis, may<br />
impede nutrient absorption. Some infants and<br />
children with disabilities may need specific diets<br />
or increased calorie intake in order to maintain a<br />
healthy weight. 48 Yet <strong>the</strong>y may be hidden away<br />
from community screening and feeding initiatives.<br />
<strong>Children</strong> with disabilities who do not attend<br />
school miss out on school feeding programmes.<br />
Water, sanitation and hygiene<br />
It is a widely acknowledged but little documented<br />
fact that throughout <strong>the</strong> developing world, persons<br />
with disabilities routinely face particular<br />
difficulties in accessing safe drinking water and<br />
basic sanitation. <strong>Children</strong> with physical impairments<br />
may be unable to collect water or carry<br />
it for long distances; o<strong>the</strong>rs may find well walls<br />
and water taps too high. Hardware and washroom<br />
doors can be difficult to manipulate and<br />
<strong>the</strong>re may be nowhere to rest <strong>the</strong> water container<br />
while filling it, or <strong>the</strong>re may be nothing to hold<br />
on to for balance to avoid falling into a well,<br />
pond or toilet. Long or slippery paths and poor<br />
lighting also limit <strong>the</strong> use <strong>of</strong> latrines by children<br />
with disabilities.<br />
Barriers to persons with disabilities extend beyond<br />
physical and design issues. Social barriers vary in<br />
different cultures. <strong>Children</strong> with disabilities <strong>of</strong>ten<br />
face stigma and discrimination when using household<br />
and public facilities. Wholly inaccurate fears<br />
that children with disabilities will contaminate<br />
water sources or soil latrines are frequently reported.<br />
When children or adolescents, and particularly<br />
girls, with disabilities are forced to use different<br />
facilities than o<strong>the</strong>r members <strong>of</strong> <strong>the</strong>ir households,<br />
or are compelled to use <strong>the</strong>m at different times,<br />
<strong>the</strong>y are at increased risk <strong>of</strong> accidents and physical<br />
attack, including rape. Issues preventing disabled<br />
children from accessing water and sanitation in<br />
A STRONG FOUNDATION<br />
25
such settings may vary depending on cultural and<br />
geographical context, as well as by <strong>the</strong> type <strong>of</strong><br />
disability a child may have: A child with a physical<br />
impairment may face significant difficulties in<br />
using a hand pump or an outdoor latrine; a child<br />
who is deaf or who has an intellectual disability<br />
may have little physical difficulty but be vulnerable<br />
to teasing or abuse, which can render <strong>the</strong>se<br />
facilities inaccessible.<br />
<strong>Children</strong> with disabilities might not attend school<br />
for want <strong>of</strong> an accessible toilet. <strong>Children</strong> with disabilities<br />
<strong>of</strong>ten report that <strong>the</strong>y try to drink and eat<br />
less to cut down <strong>the</strong> number <strong>of</strong> times <strong>the</strong>y need<br />
to go to <strong>the</strong> toilet, especially if <strong>the</strong>y have to ask<br />
someone to help <strong>the</strong>m. This adds to <strong>the</strong> risk that<br />
<strong>the</strong>se children will be poorly nourished. It is also<br />
cause for concern that in some places, new water,<br />
sanitation and hygiene (WASH) facilities are still<br />
being designed and built without adequate concern<br />
for children with disabilities. Low-tech, lowcost<br />
interventions for persons with disabilities<br />
are increasingly available – new step latrines<br />
and easy-to-use water pumps, for example. This<br />
information has yet to be widely disseminated<br />
among WASH pr<strong>of</strong>essionals or incorporated into<br />
WASH policies and practice. 51<br />
Sexual and reproductive health and<br />
HIV/AIDS<br />
<strong>Children</strong> and young people who live with a<br />
physical, sensory, intellectual or psychosocial<br />
disability have been almost entirely overlooked<br />
in sexual and reproductive health and HIV/AIDS<br />
programmes. They are <strong>of</strong>ten – and incorrectly –<br />
believed to be sexually inactive, unlikely to use<br />
drugs or alcohol, and at less risk <strong>of</strong> abuse, violence<br />
or rape than <strong>the</strong>ir non-disabled peers, and<br />
<strong>the</strong>refore to be at low risk <strong>of</strong> HIV infection. 52<br />
In consequence, children and young people<br />
who have disabilities are at increased risk <strong>of</strong><br />
becoming HIV-positive.<br />
People with disabilities <strong>of</strong> all ages who are<br />
HIV-positive are less likely to receive appropriate<br />
services than peers without disabilities.<br />
Treatment, testing and counselling centres are<br />
very rarely adapted to <strong>the</strong>ir needs, and healthcare<br />
personnel are seldom trained to deal with<br />
children and adolescents with disabilities. 53<br />
Many young people with disabilities do not<br />
receive even basic information about how <strong>the</strong>ir<br />
bodies develop and change. Structured education<br />
about sexual and reproductive health and relationships<br />
is seldom a part <strong>of</strong> <strong>the</strong> curriculum and<br />
even where it is, children with disabilities may<br />
be excluded. Many have been taught to be silent<br />
and obedient and have no experience <strong>of</strong> setting<br />
limits with o<strong>the</strong>rs regarding physical contact. 54<br />
The risk <strong>of</strong> abuse is thus increased, as illustrated<br />
by a study in South Africa that suggests deaf<br />
youth are at heightened risk <strong>of</strong> HIV infection. 55<br />
Early detection and intervention<br />
Beatriz, a 10-year-old girl with cerebral palsy, blows soap<br />
bubbles in Brazil. © Andre Castro/2012<br />
<strong>Children</strong> develop rapidly during <strong>the</strong> first three<br />
years <strong>of</strong> life, so early detection and intervention<br />
26<br />
THE STATE OF THE WORLD’S CHILDREN <strong>2013</strong>: <strong>Children</strong> with Disabilities
are particularly important. Developmental<br />
screening is an effective means <strong>of</strong> detecting disability<br />
in children. 56 It can take place in primaryhealth-care<br />
settings, for example, during immunization<br />
visits or growth monitoring check-ups<br />
at community health centres. The purpose <strong>of</strong><br />
screening is to identify children at risk, to refer<br />
<strong>the</strong>m for fur<strong>the</strong>r assessment and intervention<br />
as needed, and to provide family members with<br />
vital information on disability. Screening involves<br />
vision and hearing examinations as well as<br />
assessments <strong>of</strong> children’s progress against such<br />
developmental milestones as sitting, standing,<br />
crawling, walking, talking or handling objects.<br />
Health-care systems in high-income countries<br />
provide numerous opportunities to identify and<br />
manage developmental difficulties early in a<br />
child’s life. But interventions to improve young<br />
children’s development are becoming increasingly<br />
available in low- and middle-income countries.<br />
These include such interventions as treating iron<br />
deficiency, training caregivers and providing<br />
community-based rehabilitation. 57<br />
Recent studies in high- and low-income countries<br />
have shown that up to 70 per cent <strong>of</strong> children<br />
and adults newly diagnosed with epilepsy<br />
can be successfully treated (i.e., <strong>the</strong>ir seizures<br />
completely controlled) with anti-epileptic drugs.<br />
After two to five years <strong>of</strong> successful treatment,<br />
drugs can be withdrawn without danger <strong>of</strong><br />
relapse in about 70 per cent <strong>of</strong> children and<br />
60 per cent <strong>of</strong> adults. However, approximately<br />
three quarters <strong>of</strong> people with epilepsy in lowincome<br />
countries do not get <strong>the</strong> treatment<br />
<strong>the</strong>y need. 58 The treatments exist – efficient<br />
dissemination is <strong>of</strong>ten lacking.<br />
The detection and treatment <strong>of</strong> impairments is<br />
not a separate area <strong>of</strong> medicine but an integral<br />
aspect <strong>of</strong> public health. Never<strong>the</strong>less, policymakers<br />
and researchers typically characterize <strong>the</strong>se<br />
measures as being in competition for resources<br />
with measures to promote <strong>the</strong> health <strong>of</strong> people<br />
without disabilities. 59 This merely serves to<br />
perpetuate discrimination and inequity.<br />
<strong>Children</strong> with disabilities who overcome <strong>the</strong><br />
discrimination and o<strong>the</strong>r obstacles that stand<br />
between <strong>the</strong>m and health care may yet find that<br />
<strong>the</strong> services <strong>the</strong>y access are <strong>of</strong> poor quality.<br />
<strong>Children</strong>’s feedback should be invited so facilities<br />
and services can be improved to meet <strong>the</strong>ir<br />
needs. In addition, health workers and o<strong>the</strong>r pr<strong>of</strong>essionals<br />
dealing with children stand to benefit<br />
from being educated about <strong>the</strong> multiple issues<br />
<strong>of</strong> child development and child disability and<br />
from being trained to deliver integrated services<br />
– where possible, with <strong>the</strong> participation <strong>of</strong> <strong>the</strong><br />
extended family. International cooperation can<br />
play an important role in efforts to make higherquality<br />
services available to children identified as<br />
having or at risk <strong>of</strong> developing disabilities, and in<br />
changing <strong>the</strong> competitive approach to allocating<br />
resources described in <strong>the</strong> preceding paragraph.<br />
Inclusive education<br />
Education is <strong>the</strong> gateway to full participation<br />
in society. It is particularly important for children<br />
with disabilities, who are <strong>of</strong>ten excluded.<br />
Many <strong>of</strong> <strong>the</strong> benefits <strong>of</strong> going to school accrue<br />
over <strong>the</strong> long run – securing a livelihood in<br />
adult life, for example – but some are almost<br />
immediately evident. Taking part at school is an<br />
important way for children with disabilities to<br />
correct misconceptions that prevent inclusion.<br />
And when <strong>the</strong>se children are able to attend<br />
school, parents and caregivers are able to find<br />
time for o<strong>the</strong>r activities including earning a<br />
living and resting.<br />
In principle, all children have <strong>the</strong> same right to<br />
education. In practice, children with disabilities<br />
are disproportionately denied this right. In consequence,<br />
<strong>the</strong>ir ability to enjoy <strong>the</strong> full rights<br />
<strong>of</strong> citizenship and take up valued roles in society<br />
– chiefly, through gainful employment – is<br />
undermined.<br />
Household survey data from 13 low- and middleincome<br />
countries show that children with disabilities<br />
aged 6–17 years are significantly less<br />
likely to be enrolled in school than peers without<br />
A STRONG FOUNDATION<br />
27
disabilities. 60 A 2004 study in Malawi found that<br />
a child with a disability was twice as likely to<br />
have never attended school as a child without a<br />
disability. Similarly, a 2008 survey in <strong>the</strong> United<br />
Republic <strong>of</strong> Tanzania found that children with disabilities<br />
who attended primary school progressed<br />
to higher levels <strong>of</strong> education at only half <strong>the</strong> rate<br />
<strong>of</strong> children without disabilities. 61<br />
As long as children with disabilities are denied<br />
equal access to <strong>the</strong>ir local schools, governments<br />
cannot reach <strong>the</strong> Millennium Development Goal<br />
<strong>of</strong> achieving universal primary education (MDG<br />
2), and <strong>State</strong>s parties to <strong>the</strong> Convention on <strong>the</strong><br />
Rights <strong>of</strong> Persons with Disabilities cannot fulfil<br />
<strong>the</strong>ir responsibilities under Article 24. 62 A recent<br />
monitoring report <strong>of</strong> <strong>the</strong> Convention on <strong>the</strong> Rights<br />
<strong>of</strong> <strong>the</strong> Child acknowledged that “<strong>the</strong> challenges<br />
faced by children with disabilities in realizing <strong>the</strong>ir<br />
right to education remain pr<strong>of</strong>ound” and that <strong>the</strong>y<br />
are “one <strong>of</strong> <strong>the</strong> most marginalized and excluded<br />
groups in respect <strong>of</strong> education.” 63<br />
Although <strong>the</strong> Conventions make a powerful case<br />
for inclusive education, <strong>the</strong>y can also sometimes<br />
be misused to justify <strong>the</strong> perpetuation <strong>of</strong> segregated<br />
education. For example, children in residential<br />
special schools may be said to be accessing<br />
<strong>the</strong>ir right to be ‘included’ in education – even<br />
though <strong>the</strong>ir right to live with <strong>the</strong>ir families and<br />
to be a part <strong>of</strong> <strong>the</strong>ir own community is being<br />
violated.<br />
Inclusive education entails providing meaningful<br />
learning opportunities to all students within <strong>the</strong><br />
regular school system. Ideally, it allows children<br />
with and without disabilities to attend <strong>the</strong> same<br />
age-appropriate classes at <strong>the</strong> local school, with<br />
additional, individually tailored support as needed.<br />
It requires physical accommodation – ramps<br />
instead <strong>of</strong> stairs and doorways wide enough for<br />
wheelchair users, for example – as well as a new,<br />
child-centred curriculum that includes representations<br />
<strong>of</strong> <strong>the</strong> full spectrum <strong>of</strong> people found in society<br />
(not just persons with disabilities) and reflects<br />
Students learning ma<strong>the</strong>matics use Braille in West Bengal, India. © UNICEF/INDA2009-00026/Khemka<br />
28<br />
THE STATE OF THE WORLD’S CHILDREN <strong>2013</strong>: <strong>Children</strong> with Disabilities
<strong>the</strong> needs <strong>of</strong> all children. In an inclusive school,<br />
students are taught in small classes in which<br />
<strong>the</strong>y collaborate and support one ano<strong>the</strong>r ra<strong>the</strong>r<br />
than compete. <strong>Children</strong> with disabilities are not<br />
segregated in <strong>the</strong> classroom, at lunchtime or on<br />
<strong>the</strong> playground.<br />
Studies across countries show a strong link<br />
between poverty and disability 64 – one that is in<br />
turn linked to gender, health and employment<br />
issues. <strong>Children</strong> with disabilities are <strong>of</strong>ten caught<br />
in a cycle <strong>of</strong> poverty and exclusion: Girls become<br />
caregivers to <strong>the</strong>ir siblings ra<strong>the</strong>r than attend<br />
school, for example, or <strong>the</strong> whole family may be<br />
stigmatized, leading to <strong>the</strong>ir reluctance to report<br />
that a child has a disability or to take <strong>the</strong> child<br />
out in public. 65 The education <strong>of</strong> those who are<br />
excluded or marginalized, however, brings about<br />
poverty reduction. 66<br />
Inclusive approaches to education have received<br />
numerous global endorsements, including at<br />
<strong>the</strong> 1994 World Conference on Special Needs<br />
Education 67 and, since 2002, through <strong>the</strong> global<br />
Education for All initiative on <strong>the</strong> right to education<br />
for persons with disabilities. 68 These<br />
approaches are by no means luxuries available<br />
only to <strong>the</strong> privileged or in high-income countries.<br />
Examples <strong>of</strong> inclusion in education are to<br />
be found in all regions <strong>of</strong> <strong>the</strong> world. To optimize<br />
<strong>the</strong> potential to include <strong>the</strong> excluded, all such<br />
efforts should apply <strong>the</strong> principles <strong>of</strong> universal<br />
design to learning systems and environments.<br />
An example <strong>of</strong> this is provided by <strong>the</strong> infographic<br />
published online at .<br />
Starting early<br />
The first steps towards inclusion are taken at<br />
home during <strong>the</strong> early years. If children with disabilities<br />
do not receive <strong>the</strong> love, sensory stimulation,<br />
health care and social inclusion to which<br />
<strong>the</strong>y are entitled, <strong>the</strong>y can miss important developmental<br />
milestones and <strong>the</strong>ir potential may be<br />
unfairly limited, with significant social and economic<br />
implications for <strong>the</strong>mselves, <strong>the</strong>ir families<br />
and <strong>the</strong> communities in which <strong>the</strong>y live.<br />
Ashiraff plays with friends at school in Togo after a<br />
local disabled people’s organization and international<br />
partners helped to realize his right to education.<br />
© UNICEF/Togo/2012/Brisno<br />
A child whose disability or developmental delay<br />
is identified at an early stage will have a much<br />
better chance <strong>of</strong> reaching her or his full capacity.<br />
Early childhood education, whe<strong>the</strong>r it is public,<br />
private or provided by <strong>the</strong> community, should<br />
be designed to respond to <strong>the</strong> child’s individual<br />
needs. Early childhood is important precisely<br />
because approximately 80 per cent <strong>of</strong> <strong>the</strong> brain’s<br />
capacity develops before <strong>the</strong> age <strong>of</strong> 3 and<br />
because <strong>the</strong> period between birth and primary<br />
school provides opportunities to tailor developmental<br />
education to <strong>the</strong> child’s needs. Studies<br />
suggest that <strong>the</strong> children who are at greatest<br />
disadvantage stand to benefit <strong>the</strong> most. 69<br />
Early childhood education is not limited to preschools<br />
and o<strong>the</strong>r childcare facilities – <strong>the</strong> home<br />
environment plays a fundamental role in stimulating<br />
and facilitating <strong>the</strong> development <strong>of</strong> <strong>the</strong><br />
child. Studies from Bangladesh, 70 China, 71 India 72<br />
and South Africa 73 have shown that enhanced<br />
interaction between mo<strong>the</strong>r and child and<br />
increased developmental activities benefit cognitive<br />
development in young children across a<br />
variety <strong>of</strong> settings, from home to health centre. 74<br />
(continued on p. 32)<br />
A STRONG FOUNDATION<br />
29
PERSPECTIVE<br />
My son Hanif<br />
By Mohammad Absar<br />
Mohammad Absar lives in <strong>the</strong><br />
village <strong>of</strong> Maddhyam Sonapahar in<br />
Mirershorai Province, Bangladesh.<br />
He has three sons and three<br />
daughters and supports his family<br />
by running a small tea stall.<br />
My son Hanif is 9 years old<br />
and attends <strong>the</strong> second grade.<br />
When he was 4, he got injured<br />
while playing. He started complaining<br />
about pain in his leg,<br />
which became red and swollen.<br />
We took him to Chittagong<br />
Medical Hospital. The doctors<br />
<strong>the</strong>re tried to save Hanif’s leg,<br />
but it was severely infected,<br />
and eventually <strong>the</strong>y decided to<br />
amputate it.<br />
After Hanif lost his leg, o<strong>the</strong>r<br />
children used to torment him:<br />
They called him ‘lame’ or ‘legless<br />
creep’ and pushed him to<br />
<strong>the</strong> ground when he tried to<br />
play with <strong>the</strong>m. They also used<br />
to tease his bro<strong>the</strong>r, who suffers<br />
from mental illness. This always<br />
made me sad, and it used to<br />
drive my wife crazy. She would<br />
quarrel with people who said bad<br />
things about her children. As for<br />
Hanif – he became very reluctant<br />
to go out. He was miserable.<br />
Things began to improve after<br />
<strong>the</strong> local, non-governmental<br />
Organization for <strong>the</strong> Poor<br />
Community Advancement<br />
(OPCA) started conducting meetings<br />
in our area to raise awareness<br />
about disability and encourage<br />
people to have a positive<br />
approach towards those with<br />
special needs.<br />
A rehabilitation worker from<br />
OPCA visited our home along<br />
with a teacher from <strong>the</strong> primary<br />
school. They encouraged us to<br />
enrol Hanif in school. Because<br />
<strong>the</strong> local primary school is half a<br />
kilometre away from our home,<br />
I had to carry my son to school<br />
every morning. I started a small<br />
shop near <strong>the</strong> school so I could<br />
be <strong>the</strong>re to carry him home at<br />
<strong>the</strong> end <strong>of</strong> <strong>the</strong> day. At first, Hanif<br />
had a lot <strong>of</strong> trouble at school. His<br />
classmates, just like his peers in<br />
<strong>the</strong> neighbourhood, mocked him<br />
and called him names.<br />
One day, <strong>the</strong> rehabilitation worker<br />
informed us that <strong>the</strong> Centre<br />
for Disability in Development<br />
(CDD), a nationwide nongovernmental<br />
organization<br />
based in Dhaka, would provide<br />
my son with an artificial leg.<br />
We travelled to <strong>the</strong> capital,<br />
where Hanif was fitted for<br />
<strong>the</strong> pros<strong>the</strong>sis and given several<br />
days <strong>of</strong> training. He also<br />
received a pair <strong>of</strong> crutches. His<br />
stump is quite small and this<br />
makes it a bit difficult for him to<br />
climb stairs. O<strong>the</strong>r than that, he<br />
can now do almost everything<br />
on his own.<br />
When he first got <strong>the</strong> new leg,<br />
people stared – it was very<br />
surprising to see him walking<br />
again. I myself had never imagined<br />
it would be possible. Some<br />
<strong>of</strong> our neighbours came to<br />
visit our home just to see <strong>the</strong><br />
pros<strong>the</strong>sis.<br />
Now that my son can walk<br />
again and participate in all sorts<br />
<strong>of</strong> activities, o<strong>the</strong>r children have<br />
stopped calling him names.<br />
They don’t push him to <strong>the</strong><br />
ground anymore. I no longer<br />
have to carry Hanif to school –<br />
he walks himself, and his classmates<br />
are eager to walk with<br />
him. The most important thing<br />
is that Hanif is happier and<br />
more confident. His artificial leg<br />
allows him to be independent,<br />
and he no longer feels inferior<br />
to <strong>the</strong> o<strong>the</strong>r children. He is<br />
doing better in his classes and<br />
30<br />
THE STATE OF THE WORLD’S CHILDREN <strong>2013</strong>: <strong>Children</strong> with Disabilities
Look at Hanif and you will see that with proper support<br />
and encouragement, people with disabilities can be<br />
effective in society.<br />
can now enjoy sports like cricket<br />
and soccer along with his peers.<br />
A rehabilitation worker has<br />
visited Hanif’s school several<br />
times to conduct awareness<br />
meetings on disability and <strong>the</strong><br />
importance <strong>of</strong> inclusive education.<br />
Hanif’s surrounding<br />
environment is more disabilityfriendly<br />
than ever before. His<br />
school works to accommodate<br />
his needs. For example, Hanif<br />
has trouble climbing stairs, so<br />
when one <strong>of</strong> his classes was<br />
scheduled on <strong>the</strong> first floor,<br />
<strong>the</strong> principal agreed to move it<br />
downstairs to make it easier for<br />
Hanif to attend.<br />
home and take care <strong>of</strong> it. As<br />
Hanif has grown, <strong>the</strong>y have<br />
adjusted his artificial limb.<br />
Hanif also receives a disability<br />
allowance <strong>of</strong> 300 Bangladesh<br />
taka each month from our<br />
district’s Department <strong>of</strong> Social<br />
Services. I take him to <strong>the</strong> local<br />
bank to receive his allowance.<br />
Hanif will need additional support<br />
to ensure that he can<br />
continue his education without<br />
interruption.<br />
Above all, I want my son to be<br />
well educated. An education<br />
will empower him and help<br />
guide him so that he can build a<br />
meaningful life. I think it would<br />
be best for Hanif to get a desk<br />
job so he doesn’t have to walk<br />
or stand too much. Perhaps he<br />
might work in an organization<br />
like CDD, where <strong>the</strong> environment<br />
is very disability-friendly.<br />
I saw people with various disabilities<br />
working <strong>the</strong>re. Such<br />
an environment would help<br />
my son work to <strong>the</strong> best <strong>of</strong> his<br />
capacity, while at <strong>the</strong> same time<br />
securing an honourable position<br />
for him. He can become<br />
an example: Look at Hanif and<br />
you will see that with proper<br />
support and encouragement,<br />
people with disabilities can be<br />
effective in society.<br />
While he’s in school, Hanif<br />
enjoys drawing pictures.<br />
Outside <strong>of</strong> school and during<br />
breaks, he loves to play. He<br />
wants to be a teacher when<br />
he grows up, just like his role<br />
models – his schoolteachers Mr.<br />
Arup and Mr. Shapan. They love<br />
Hanif very much and support<br />
him in every way <strong>the</strong>y can.<br />
Because our family is very<br />
poor, my son’s artificial limb<br />
and associated expenses were<br />
provided by CDD through <strong>the</strong><br />
Promoting Rights for Persons<br />
with Disabilities project funded<br />
by <strong>the</strong> Manusher Jonno<br />
Foundation. If Hanif has any<br />
problem with <strong>the</strong> pros<strong>the</strong>sis,<br />
rehabilitation workers visit our<br />
Hanif taking part in class. © Centre for Disability in Development<br />
A STRONG FOUNDATION<br />
31
(continued from p. 29)<br />
Age-old biases and low expectations with regard<br />
to children with disabilities should not stand in<br />
<strong>the</strong> way <strong>of</strong> early childhood development. It is<br />
clear that with family and community support<br />
from <strong>the</strong> earliest days <strong>of</strong> <strong>the</strong>ir lives, children with<br />
disabilities are better placed to make <strong>the</strong> most <strong>of</strong><br />
<strong>the</strong>ir school years and to prepare <strong>the</strong>mselves for<br />
adulthood.<br />
Working with teachers<br />
Teachers are a – and perhaps <strong>the</strong> – key element<br />
in a child’s learning environment, so it is important<br />
that <strong>the</strong>y have a clear understanding <strong>of</strong><br />
inclusive education and a strong commitment<br />
to teaching all children.<br />
All too <strong>of</strong>ten, however, teachers lack appropriate<br />
preparation and support in teaching children<br />
with disabilities in regular schools. This is a<br />
factor in <strong>the</strong> stated unwillingness <strong>of</strong> educators<br />
in many countries to support <strong>the</strong> inclusion <strong>of</strong><br />
children with disabilities in <strong>the</strong>ir classes. 75 For<br />
example, one study <strong>of</strong> prospective teachers<br />
<strong>of</strong> special education in Israel found <strong>the</strong>y held<br />
unhelpful preconceptions about people with disabilities,<br />
and that some discriminated between<br />
different types <strong>of</strong> disability. 76 Resources for<br />
children with disabilities tend to be allocated to<br />
segregated schools ra<strong>the</strong>r than to an inclusive<br />
mainstream education system. This can prove<br />
costly as well as inappropriate: In Bulgaria, <strong>the</strong><br />
budget per child educated in a special school<br />
can be up to three times higher than that for a<br />
similar child in a regular school. 77<br />
A review <strong>of</strong> <strong>the</strong> situation <strong>of</strong> children with intellectual<br />
disabilities in 22 European countries<br />
highlighted <strong>the</strong> lack <strong>of</strong> training <strong>of</strong> regular teachers<br />
to work with children with disabilities as a<br />
major concern. Most <strong>of</strong> <strong>the</strong> time, <strong>the</strong>se students<br />
were taught by support staff ra<strong>the</strong>r than certified<br />
teachers. Teacher training has proved effective in<br />
fostering commitment to inclusion. A 2003 study<br />
found that school principals who had taken more<br />
courses on disability expressed more inclusive<br />
views. And shifting attitudes benefit students:<br />
Positive views on inclusion translated into less<br />
restrictive placements for specific students with<br />
disabilities. 78 Ano<strong>the</strong>r study from 2001 found that<br />
a course on inclusion for those studying to be<br />
teachers was effective in changing <strong>the</strong>ir attitudes,<br />
so that <strong>the</strong>y favoured including children with<br />
mild disabilities in <strong>the</strong> classroom. 79<br />
The greatest opportunity appears to exist among<br />
teachers who are still fresh in <strong>the</strong> pr<strong>of</strong>ession. A<br />
recent systematic literature review <strong>of</strong> countries as<br />
diverse as China, Cyprus, India, Iran, <strong>the</strong> Republic<br />
<strong>of</strong> Korea, <strong>the</strong> <strong>State</strong> <strong>of</strong> Palestine, <strong>the</strong> United Arab<br />
Emirates and Zimbabwe found that teachers with<br />
<strong>the</strong> least general teaching experience had more<br />
positive attitudes than those with longer service.<br />
Teachers who had received training in inclusive<br />
education had more positive attitudes than those<br />
who had received no training, and those who had<br />
<strong>the</strong> most positive attitudes were those with actual<br />
experience <strong>of</strong> inclusion. 80<br />
Yet pre-service training rarely prepares teachers<br />
to teach inclusively. Where training exists,<br />
it is <strong>of</strong> variable quality. Although numerous<br />
toolkits exist, <strong>the</strong>se are not always geared to a<br />
specific context, and so will frequently contain<br />
foreign concepts. Group learning is one example.<br />
Teachers have responded negatively to pictures<br />
<strong>of</strong> children with and without disabilities seated in<br />
groups, as this is at odds with <strong>the</strong> way students<br />
interact in more traditional classrooms. 81<br />
Ano<strong>the</strong>r challenge is <strong>the</strong> lack <strong>of</strong> diversity among<br />
teaching personnel. Teachers with disabilities<br />
are quite rare and in some settings considerable<br />
obstacles exist for adults with disabilities to qualify<br />
as teachers. In Cambodia, for example, <strong>the</strong> law<br />
states that teachers must be “free <strong>of</strong> disabilities.” 82<br />
Partnerships with civil society are providing<br />
encouraging examples <strong>of</strong> ways to enhance<br />
teacher training and diversity. In Bangladesh, <strong>the</strong><br />
Centre for Disability in Development (CDD), a<br />
national non-governmental organization (NGO),<br />
employs a group <strong>of</strong> inclusive education trainers<br />
who run 10-day training sessions during school<br />
32<br />
THE STATE OF THE WORLD’S CHILDREN <strong>2013</strong>: <strong>Children</strong> with Disabilities
terms for 20 schools at a time, with training provided<br />
to one teacher from each school. 83 Several<br />
<strong>of</strong> <strong>the</strong> CDD trainers are visually impaired or have<br />
o<strong>the</strong>r disabilities, so <strong>the</strong>y are important role<br />
models for teachers and students with and without<br />
disabilities. And in Mozambique, Ajuda de<br />
Desenvolvimento de Povo para Povo, a national<br />
NGO, has worked closely with <strong>the</strong> national disabled<br />
people’s organization known as ADEMO to<br />
train student teachers to work with children with<br />
disabilities and to train student teachers who<br />
have disabilities. 84<br />
Teachers tend to work in isolation, which means<br />
<strong>the</strong>y are <strong>of</strong>ten unsupported in <strong>the</strong> classroom,<br />
and are <strong>of</strong>ten under pressure to complete a narrow<br />
syllabus imposed from above. Inclusive<br />
education requires a flexible approach to school<br />
organization, curriculum development and pupil<br />
assessment. Such flexibility would allow for<br />
<strong>the</strong> development <strong>of</strong> a more inclusive pedagogy,<br />
shifting <strong>the</strong> focus from teacher-centred to childcentred<br />
to embrace diverse learning styles.<br />
Parents can play many roles, from providing<br />
accessible transport to raising awareness, getting<br />
involved in civil society organizations and<br />
liaising with <strong>the</strong> health sector so that children<br />
have access to appropriate equipment and support<br />
and with <strong>the</strong> social sectors to access grants<br />
and credit schemes to reduce poverty. In many<br />
countries, schools have community committees<br />
that are engaged in a wide range <strong>of</strong> activities<br />
to support inclusion. For example, in Viet Nam,<br />
Community Steering Committees have been<br />
involved in advocacy, local training, securing<br />
assistive devices, providing financial support<br />
and developing accessible environments. 87 It is<br />
important that parents and community members<br />
realize that <strong>the</strong>y have contributions to make and<br />
that <strong>the</strong>ir contributions are used.<br />
Although <strong>the</strong> importance <strong>of</strong> child participation<br />
and child agency is well documented, <strong>the</strong>y sit<br />
uncomfortably within <strong>the</strong> existing structures and<br />
(continued on p. 36)<br />
Teachers need to be able to call on specialist help<br />
from colleagues who have greater expertise and<br />
experience <strong>of</strong> working with children with disabilities,<br />
especially children with sensory or intellectual<br />
impairments. For example, specialists can<br />
advise on <strong>the</strong> use <strong>of</strong> Braille or computer-based<br />
instruction. 85 Where such specialists are relatively<br />
few, <strong>the</strong>y can travel between schools as needed.<br />
Even <strong>the</strong>se itinerant specialist teachers can be in<br />
short supply in such low-income areas as sub-<br />
Saharan Africa. 86 This presents an opportunity for<br />
appropriate support from providers <strong>of</strong> financial<br />
and technical assistance from <strong>the</strong> international<br />
to <strong>the</strong> local level.<br />
Involving parents, communities<br />
and children<br />
Inclusive education programmes that focus only<br />
on classroom practices fail to harness parents’<br />
potential to contribute to inclusive education –<br />
and to prevent such violations as <strong>the</strong> confinement<br />
<strong>of</strong> children with disabilities to separate rooms.<br />
Boys play football at <strong>the</strong> Nimba Centre in Conakry, Guinea.<br />
The centre provides training for people with physical<br />
disabilities. © UNICEF/HQ2010-1196/Asselin<br />
A STRONG FOUNDATION<br />
33
PERSPECTIVE<br />
The new normal<br />
By Claire Halford<br />
Claire Halford lives in Melbourne,<br />
Australia, with her partner and<br />
<strong>the</strong>ir two children. She worked in<br />
fashion and <strong>the</strong> visual arts before<br />
becoming a full-time caregiver for<br />
her son Owen.<br />
Everybody hopes for a healthy<br />
baby when expecting a child.<br />
When asked, “What are you having?”<br />
expectant mums and dads<br />
respond, “Oh, we don’t mind, as<br />
long as it’s healthy.”<br />
I remember <strong>the</strong> first-trimester<br />
milestone with my first-born son,<br />
Owen: I told <strong>the</strong> midwife that I<br />
had stopped smoking and drinking,<br />
ate a healthy diet, exercised<br />
moderately and felt pretty good<br />
about carrying a child. “That’s<br />
great,” she said in a reassuring<br />
tone. “After all, what can go<br />
wrong with a healthy female in<br />
a first-world country in pr<strong>of</strong>essional<br />
medical care?” Little did<br />
I know that in about six months<br />
I would find out exactly what<br />
could go wrong.<br />
My son’s birth, at full term, was<br />
incredibly traumatic. When he<br />
finally entered <strong>the</strong> world, he<br />
could not brea<strong>the</strong>. His brain was<br />
deprived <strong>of</strong> oxygen. He was<br />
resuscitated and ventilated, and<br />
for two weeks he was swapped<br />
between intensive care and<br />
special care. He had his first<br />
seizure at 1 day old. Until he was<br />
2 years old, epilepsy invaded our<br />
lives all day, every day.<br />
My son was diagnosed with<br />
cerebral palsy (CP) at 5 months.<br />
Cerebral palsy is a broad term<br />
describing a brain injury that can<br />
occur in utero, during birth or in<br />
early childhood. In Australia, CP<br />
is <strong>the</strong> most common cause <strong>of</strong><br />
physical disability in childhood,<br />
and it is a disability that affects<br />
children in all countries whe<strong>the</strong>r<br />
<strong>the</strong>y are affluent or poor. The<br />
condition mostly affects movement<br />
and muscle tone. Owen<br />
has severe CP: He cannot sit,<br />
roll, walk or speak.<br />
Following his diagnosis, correspondence<br />
from doctors arrived<br />
in <strong>the</strong> post on an almost weekly<br />
basis. Initial letters delivered<br />
brutal realities, using medicalspeak<br />
like ‘spastic quadriplegic’,<br />
‘cortical visual impairment’<br />
and ‘globally developmentally<br />
delayed’ – terms that were completely<br />
foreign. Every online<br />
search ended in ‘prognosis poor’.<br />
In those early days, <strong>the</strong> only<br />
shining light in all this shocking<br />
darkness was Owen’s beautiful<br />
personality, infectious laugh,<br />
obvious engagement with <strong>the</strong><br />
world around him and emerging<br />
handsome looks.<br />
The first year was very hard.<br />
Anger – no, rage – and disappointment,<br />
devastation, loneliness<br />
and disbelief lurked at<br />
every corner. As <strong>the</strong> midwife had<br />
suggested, this wasn’t supposed<br />
to happen to me, to him, to<br />
us – this was a mistake! Friends<br />
and family could say or do nothing<br />
right, so I sought out o<strong>the</strong>rs<br />
who were in a similar position,<br />
through support groups in my<br />
area and on <strong>the</strong> Internet.<br />
Around <strong>the</strong> time <strong>of</strong> Owen’s diagnosis,<br />
I received a phone call<br />
from <strong>the</strong> university at which<br />
I had once worked, asking if I’d<br />
like to return to teach life drawing<br />
and design part-time. This<br />
job was to have been my ticket<br />
out <strong>of</strong> employment in retail; it<br />
was to have been something<br />
meaningful I could sink my teeth<br />
into. I declined. I had new work:<br />
Now I was a full-time caregiver.<br />
It turned out that Owen had<br />
intractable seizures that did not<br />
respond to epilepsy medication.<br />
So we started 2-year-old<br />
Owen on a medical diet for<br />
34<br />
THE STATE OF THE WORLD’S CHILDREN <strong>2013</strong>: <strong>Children</strong> with Disabilities
epilepsy. The ketogenic diet is<br />
an incredibly strict high-fat, lowcarbohydrate<br />
diet. In a bizarre,<br />
unexpected stroke <strong>of</strong> grace, it<br />
worked. My poor suffering son<br />
went from having up to 200<br />
seizures a day to almost none<br />
in <strong>the</strong> first three months. He has<br />
been virtually seizure-free since.<br />
My partner and I have since had<br />
ano<strong>the</strong>r son, a healthy toddler<br />
whom we love as dearly as we<br />
do Owen. He has brought us<br />
ano<strong>the</strong>r perspective on life. Our<br />
family life has come to define<br />
us. The connection we have<br />
makes us stronger – to us, our<br />
lifestyle is normal; we carry on.<br />
It’s normal to drive all over town<br />
to do physical <strong>the</strong>rapy many<br />
times a week; it’s normal to haul<br />
heavy equipment like standing<br />
frames and bath chairs from<br />
room to room every day. We<br />
know <strong>the</strong> children’s hospital like<br />
<strong>the</strong> backs <strong>of</strong> our hands and are<br />
familiar with many <strong>of</strong> <strong>the</strong> top<br />
specialists in various fields <strong>of</strong><br />
paediatric medicine.<br />
I call myself my son’s<br />
‘personal assistant’ because<br />
he has a never-ending<br />
stream <strong>of</strong> paperwork,<br />
funding applications, doctor’s<br />
appointments, <strong>the</strong>rapy sessions,<br />
check-ups and blood tests. I<br />
do most <strong>of</strong> his personal care,<br />
such as feeding and bathing.<br />
My partner helps when he can,<br />
but he works very long hours to<br />
keep us all afloat financially – so<br />
that I can care for Owen and<br />
we can have a comfortable<br />
life. We try to keep busy on <strong>the</strong><br />
weekends, doing family things<br />
like visiting <strong>the</strong> farmer’s market,<br />
going out for Vietnamese food<br />
or checking out a kids’ show.<br />
Owen has a pretty fun and<br />
busy life for a 5-year-old. Yet<br />
no matter how good things can<br />
be, he has a long and difficult<br />
journey ahead <strong>of</strong> him.<br />
We are hoping to place Owen<br />
in a mainstream primary school<br />
with <strong>the</strong> support <strong>of</strong> <strong>the</strong> Cerebral<br />
Palsy Education Centre, an early<br />
intervention programme. Owen<br />
has shown vast improvement<br />
in communication and movement<br />
since he started going<br />
<strong>the</strong>re. He also attends activities<br />
at <strong>the</strong> Riding for <strong>the</strong> Disabled<br />
Association, which we both<br />
love. Over <strong>the</strong> years we have<br />
spent so much money and time<br />
on <strong>the</strong>rapies and services –<br />
some <strong>of</strong> <strong>the</strong>m good, o<strong>the</strong>rs not<br />
that helpful. We’re learning as<br />
we go, and we’re getting better<br />
at making practical ra<strong>the</strong>r than<br />
emotional decisions. It’s still<br />
hard for us, though; I’m always<br />
fighting or waiting for something<br />
he desperately needs,<br />
sometimes for years.<br />
The hardest battles have to do<br />
with people’s perceptions <strong>of</strong><br />
Owen. I just want him to be<br />
treated and spoken to like a<br />
regular kid – but I also want him<br />
to receive special attention, and<br />
for people to be more patient.<br />
I want my friends and family to<br />
help him and engage with him<br />
more. Many <strong>of</strong> <strong>the</strong>m tend to<br />
focus on how I am doing or on<br />
something else that’s less challenging<br />
than Owen’s very real<br />
problems. It’s hard for <strong>the</strong>m,<br />
too – with everything he has<br />
going on, I sometimes think<br />
he should come with an<br />
instruction manual.<br />
I’ve <strong>of</strong>ten feared that <strong>the</strong><br />
things that defined me before<br />
I became a caregiver – work,<br />
creative interests and a social<br />
life – have been lost down a<br />
well <strong>of</strong> grief and exhaustion.<br />
More <strong>of</strong>ten than not, however,<br />
I feel like my life before Owen<br />
was born was comparatively<br />
superficial. Becoming a caregiver<br />
for my own child has been<br />
an overwhelmingly pr<strong>of</strong>ound<br />
and joyful experience. We celebrate<br />
small accomplishments<br />
feverishly, and my expectations<br />
<strong>of</strong> what success entails have<br />
been smashed and rebuilt into<br />
something beautifully simple:<br />
Owen sitting unaided for five<br />
seconds, or, as he watches <strong>the</strong><br />
Paralympics on television, hearing<br />
<strong>the</strong> words ‘cerebral palsy’<br />
and ‘champion’ in <strong>the</strong> same<br />
sentence. I have grown through<br />
caring for Owen – above all,<br />
perhaps, in my ability to<br />
empathize.<br />
I have learned that no matter<br />
what a child can’t do, she or he<br />
will still always have an identity<br />
and a character that will leave<br />
a distinctive brushstroke on<br />
this world. If we want to be an<br />
enlightened society, our job is<br />
to believe and encourage. Only<br />
<strong>the</strong>n can children who have<br />
such difficult limitations grow.<br />
And <strong>the</strong>n we can all come to<br />
see that things that ‘go wrong’<br />
are sometimes just different –<br />
and <strong>of</strong>ten amazing.<br />
A STRONG FOUNDATION<br />
35
(continued from p. 33)<br />
system <strong>of</strong> education. This is true for all children,<br />
with or without disabilities: Few are involved<br />
in making decisions about <strong>the</strong>ir education and<br />
lives. Involving children with disabilities in such<br />
decisions can be particularly challenging, not<br />
least because <strong>of</strong> ingrained thinking and behaviour<br />
that perceives <strong>the</strong>m as passive victims. As<br />
<strong>the</strong> 2011 Report <strong>of</strong> <strong>the</strong> Secretary-General on <strong>the</strong><br />
Status <strong>of</strong> <strong>the</strong> Convention on <strong>the</strong> Rights <strong>of</strong> <strong>the</strong><br />
Child noted, “It remains difficult for children with<br />
disabilities to have <strong>the</strong>ir voices heard. Initiatives<br />
such as school councils and children’s parliaments,<br />
consultative processes to elicit children’s<br />
views, as well as judicial proceedings, commonly<br />
fail to ensure <strong>the</strong> inclusion <strong>of</strong> children with disabilities,<br />
or acknowledge <strong>the</strong>ir capacities for<br />
participation.” 88<br />
The most underused resource in schools and<br />
communities all over <strong>the</strong> world is <strong>the</strong> children<br />
<strong>the</strong>mselves. The Child-to-Child Trust in <strong>the</strong> United<br />
Kingdom has worked for many years to promote<br />
children’s involvement in health education, and<br />
in some countries this approach has been used<br />
to good effect as part <strong>of</strong> inclusive education and<br />
community-based rehabilitation programmes. 89<br />
In participatory research, for example, children<br />
frequently highlight <strong>the</strong> importance <strong>of</strong> a clean<br />
environment and hygienic toilets, and for children<br />
with disabilities, <strong>the</strong> issues <strong>of</strong> privacy and<br />
accessibility are paramount. 90 It stands to reason<br />
that children with disabilities can and must guide<br />
and evaluate efforts to advance accessibility and<br />
inclusion. After all, who better to understand <strong>the</strong><br />
means and impact <strong>of</strong> exclusion?<br />
Lines <strong>of</strong> responsibility<br />
As in o<strong>the</strong>r fields <strong>of</strong> endeavour, it will help to<br />
realize aspirations for inclusive education if governments<br />
and <strong>the</strong>ir partners are clear about who<br />
is to do what and how, and to whom <strong>the</strong>y are<br />
expected to report. O<strong>the</strong>rwise, <strong>the</strong> promise <strong>of</strong><br />
inclusion risks becoming a matter <strong>of</strong> lip service.<br />
One study <strong>of</strong> countries engaged in what was<br />
once known as <strong>the</strong> Education For All Fast Track<br />
Initiative (FTI) and is now called <strong>the</strong> Global<br />
Partnership for Education found that ‘‘a number<br />
<strong>of</strong> FTI-endorsed countries, particularly those<br />
which are approaching universal primary education,<br />
do now have national education sector<br />
plans which address <strong>the</strong> inclusion <strong>of</strong> disabled<br />
children. […] However, in a number <strong>of</strong> countries,<br />
policies and provision for disabled children<br />
remain cursory or have not been implemented.”<br />
91 The report notes that in five FTI-endorsed<br />
countries <strong>the</strong>re was no mention at all <strong>of</strong> children<br />
with disabilities.<br />
Sometimes, <strong>the</strong> problem is one <strong>of</strong> divided or<br />
unclear mandates: In Bangladesh <strong>the</strong>re is some<br />
confusion about which ministries are responsible<br />
for children with disabilities <strong>of</strong> school age. The<br />
mandate for implementing Education For All lies<br />
with <strong>the</strong> Ministry <strong>of</strong> Education and <strong>the</strong> Ministry <strong>of</strong><br />
Primary and Mass Education, but <strong>the</strong> education<br />
<strong>of</strong> children with disabilities is managed by <strong>the</strong><br />
Ministry <strong>of</strong> Social Welfare and is seen as a<br />
matter <strong>of</strong> charity, not a human rights issue. 92<br />
Since 2002, children with disabilities and those<br />
with special educational needs have been included<br />
in primary education through <strong>the</strong> Primary<br />
Education Development Programme 93 under<br />
<strong>the</strong> Ministry <strong>of</strong> Education. But managing integrated<br />
educational provision for children with<br />
visual impairments and running primary schools<br />
for children with hearing, visual or intellectual<br />
impairments remains <strong>the</strong> responsibility <strong>the</strong><br />
Ministry <strong>of</strong> Social Welfare. 94<br />
Ministries <strong>of</strong> Education should be encouraged to<br />
take responsibility for all children <strong>of</strong> school age.<br />
Coordination with partners and stakeholders can<br />
play a strong supporting role in this process. In<br />
Bangladesh, <strong>the</strong> National Forum <strong>of</strong> Organizations<br />
Working with <strong>the</strong> Disabled promotes networking<br />
between <strong>the</strong> government and NGOs, and<br />
has been instrumental in encouraging greater<br />
educational inclusion as well as a gradual shift<br />
<strong>of</strong> ministerial responsibility from social welfare<br />
to education. As a consequence, <strong>the</strong> Campaign<br />
for Popular Education, a national network, has<br />
committed to ensuring that all children with<br />
36<br />
THE STATE OF THE WORLD’S CHILDREN <strong>2013</strong>: <strong>Children</strong> with Disabilities
Reading Braille at a school in Uganda. © UNICEF/UGDA2012-00112/Sibiloni<br />
disabilities have access to basic and quality education,<br />
and <strong>the</strong> non-governmental Bangladesh<br />
Rural Advancement Committee, which is committed<br />
to achieving Education For All and poverty<br />
reduction, now includes learners with disabilities<br />
in its schools.<br />
Exclusion denies children with disabilities <strong>the</strong><br />
lifelong benefits <strong>of</strong> education: a better job, social<br />
and economic security, and opportunities for<br />
full participation in society. In contrast, investment<br />
in <strong>the</strong> education <strong>of</strong> children with disabilities<br />
can contribute to <strong>the</strong>ir future effectiveness as<br />
members <strong>of</strong> <strong>the</strong> labour force. Indeed, a person’s<br />
potential income can increase by as much as 10<br />
per cent with each additional year <strong>of</strong> schooling. 95<br />
But inclusive education can also reduce current<br />
and future dependence, freeing o<strong>the</strong>r household<br />
members from some <strong>of</strong> <strong>the</strong>ir caring responsibilities,<br />
and allowing <strong>the</strong>m to resume productive<br />
activity – or simply to rest. 96<br />
Basic reading and writing skills also improve<br />
health: A child born to a mo<strong>the</strong>r who can read is<br />
50 per cent more likely to survive past <strong>the</strong> age <strong>of</strong><br />
5. 97 Lower maternal education has been linked<br />
to higher rates <strong>of</strong> stunting among children in<br />
<strong>the</strong> urban slums <strong>of</strong> Kenya, 98 Roma settlements<br />
in Serbia, 99 and in Cambodia. 100 Better-educated<br />
Bangladeshi parents decreased <strong>the</strong>ir child’s risk<br />
<strong>of</strong> stunting by up to 5.4 per cent (4.6 per cent in<br />
<strong>the</strong> case <strong>of</strong> mo<strong>the</strong>rs, and between 2.9 and 5.4 per<br />
cent for fa<strong>the</strong>rs), and better-educated Indonesian<br />
parents accounted for up to a 5 per cent decrease<br />
(between 4.4 and 5 per cent for mo<strong>the</strong>rs, and 3 per<br />
cent for fa<strong>the</strong>rs) in <strong>the</strong>ir child’s odds <strong>of</strong> stunting. 101<br />
Education is both a useful instrument and a right,<br />
<strong>the</strong> purpose <strong>of</strong> which, as stated in <strong>the</strong> Convention<br />
on <strong>the</strong> Rights <strong>of</strong> <strong>the</strong> Child, is to promote “<strong>the</strong><br />
development <strong>of</strong> <strong>the</strong> child’s personality, talents<br />
and mental and physical abilities to <strong>the</strong>ir<br />
fullest potential.” 102<br />
A STRONG FOUNDATION<br />
37
PERSPECTIVE<br />
Adjusting, adapting and empowering<br />
By Yahia J. Elziq<br />
Yahia J. Elziq is a Technical Advisor<br />
for Handicap International in<br />
Ramallah, <strong>State</strong> <strong>of</strong> Palestine.<br />
Saja was 7 years old when<br />
I met her.<br />
At that time I was working<br />
in one <strong>of</strong> <strong>the</strong> three national<br />
rehabilitation centres in <strong>the</strong><br />
West Bank as an occupational<br />
<strong>the</strong>rapist. Although this centre<br />
is not set up to handle Saja’s<br />
needs and demands as a child<br />
with cerebral palsy, we were<br />
able to provide <strong>the</strong>rapy sessions<br />
to prevent deterioration<br />
in her condition. The two main<br />
obstacles that still prevent<br />
her from reaching appropriate<br />
rehabilitation services<br />
are <strong>the</strong> absence <strong>of</strong> referral<br />
mechanisms and coordination<br />
between services in <strong>the</strong> West<br />
Bank, and <strong>the</strong> restrictions on<br />
movement that are imposed<br />
on Palestinians under occupation.<br />
The specialized rehabilitation<br />
centre for such conditions<br />
is based in East Jerusalem, but<br />
Saja’s family was refused permission<br />
to enter <strong>the</strong> city.<br />
In addition, children with disabilities<br />
in <strong>the</strong> West Bank, as<br />
elsewhere, confront a general<br />
lack <strong>of</strong> knowledge and skills<br />
about disability throughout<br />
<strong>the</strong> public and private sectors.<br />
They are also faced with<br />
a dominant perspective that<br />
regards people with disabilities<br />
as pitiable and as worthy<br />
to receive charity – but not as<br />
individuals with rights who<br />
have <strong>the</strong> same entitlements as<br />
o<strong>the</strong>rs, and who can and do<br />
contribute to society.<br />
In this context Saja has been<br />
lucky. After an extensive evaluation,<br />
our team developed a<br />
plan to support and improve<br />
her participation in <strong>the</strong> community.<br />
The priority for her<br />
and her family was to have<br />
her enrolled in regular school.<br />
However, in order to attend<br />
a mainstream school, she<br />
needed various environmental<br />
changes – among <strong>the</strong>m,<br />
<strong>the</strong> school premises had to<br />
be physically accessible, and<br />
she needed to have a suitable<br />
wheelchair. Full collaboration<br />
from her family, school<br />
and community were absolute<br />
necessities. Saja needed<br />
integrated activities involving<br />
many stakeholders, starting<br />
from her own parents,<br />
who tended to use available<br />
resources in favour <strong>of</strong> her<br />
bro<strong>the</strong>r, who has <strong>the</strong> same<br />
38<br />
THE STATE OF THE WORLD’S CHILDREN <strong>2013</strong>: <strong>Children</strong> with Disabilities
Saja opened my eyes to my own ability to adjust and adapt as<br />
a pr<strong>of</strong>essional – and to <strong>the</strong> positive impact that we <strong>the</strong>rapeutic<br />
pr<strong>of</strong>essionals can have if we adopt empowering attitudes.<br />
condition, leaving her without<br />
<strong>the</strong> opportunity to develop to<br />
her full potential.<br />
Tackling all <strong>the</strong>se issues was<br />
made difficult because <strong>of</strong> <strong>the</strong><br />
absence <strong>of</strong> adequate national<br />
policy. There is no inclusive<br />
education programme for<br />
children with disabilities, for<br />
example, and disabilityinclusive<br />
policies are not priorities<br />
for decision-makers.<br />
For <strong>the</strong>se reasons, <strong>the</strong> fate <strong>of</strong><br />
children with disabilities relies<br />
heavily on <strong>the</strong> willingness <strong>of</strong><br />
community members to recognize<br />
that <strong>the</strong>se children have<br />
<strong>the</strong> same rights as all children.<br />
When <strong>the</strong>se rights are<br />
recognized, many issues can<br />
be solved – <strong>of</strong>ten simply by<br />
mobilizing existing community<br />
resources.<br />
Fortunately, in Saja’s case,<br />
negotiations with <strong>the</strong> school<br />
principal succeeded and her<br />
classroom was moved from<br />
<strong>the</strong> second to <strong>the</strong> ground floor.<br />
The teachers accepted <strong>the</strong> idea<br />
<strong>of</strong> having her in <strong>the</strong>ir class.<br />
By using our own networks<br />
<strong>of</strong> pr<strong>of</strong>essional and personal<br />
contacts, we were able to get<br />
her a suitable wheelchair and,<br />
thanks to some local doctors<br />
and a health centre, her family<br />
was able to obtain free treatment<br />
to improve her eyesight.<br />
Social workers helped raise<br />
awareness <strong>of</strong> her particular<br />
situation within her family, and<br />
a psychologist supported her<br />
in overcoming her experience<br />
<strong>of</strong> discrimination.<br />
Over just a couple <strong>of</strong> years,<br />
Saja’s situation improved<br />
dramatically as some <strong>of</strong> her<br />
health issues were addressed,<br />
her mobility improved and her<br />
self-esteem and confidence<br />
improved along with her social<br />
interactions, knowledge and<br />
life skills. As a person, I was<br />
overjoyed at seeing Saja’s<br />
progress. As a rehabilitation<br />
pr<strong>of</strong>essional, it was highly<br />
rewarding.<br />
Saja opened my eyes to my<br />
own ability to adjust and adapt<br />
as a pr<strong>of</strong>essional – and to <strong>the</strong><br />
positive impact that we <strong>the</strong>rapeutic<br />
pr<strong>of</strong>essionals can have<br />
if we adopt empowering attitudes.<br />
More importantly, she<br />
helped me to understand <strong>the</strong><br />
value and importance <strong>of</strong> taking<br />
a holistic view <strong>of</strong> <strong>the</strong> individual<br />
child and <strong>of</strong> taking a comprehensive<br />
approach in working<br />
with persons with disabilities<br />
and <strong>the</strong>ir community. This is<br />
<strong>the</strong> only way to ensure that<br />
children with disabilities can<br />
have <strong>the</strong> same opportunities<br />
as o<strong>the</strong>r children to participate<br />
in community life.<br />
I want to share this realization<br />
with policymakers so <strong>the</strong>y<br />
can take a more empowering,<br />
holistic approach to <strong>the</strong>ir work.<br />
Good policies – made with <strong>the</strong><br />
involvement <strong>of</strong> children with<br />
disabilities and disabled persons’<br />
organizations, and properly<br />
implemented – will help<br />
to ensure that when <strong>the</strong> next<br />
Saja comes to us, she and her<br />
family will know what she is<br />
entitled to, and what she might<br />
expect to achieve – which is<br />
what every o<strong>the</strong>r girl <strong>of</strong> her<br />
age in her community can<br />
expect to achieve. This is <strong>the</strong><br />
message that <strong>the</strong> Convention<br />
on <strong>the</strong> Rights <strong>of</strong> Persons with<br />
Disabilities and <strong>the</strong> Convention<br />
on <strong>the</strong> Rights <strong>of</strong> <strong>the</strong> Child<br />
give us, and that we want<br />
to promote every day.<br />
A STRONG FOUNDATION<br />
39
A teacher trained in inclusive education checks on 5-year-old Sok Chea, who is deaf and mute, at a preschool in Cambodia.<br />
© UNICEF/Cambodia/2011/Mufel
CHAPTER 4<br />
ESSENTIALS OF<br />
PROTECTION<br />
<strong>Children</strong> with disabilities are among <strong>the</strong> most vulnerable<br />
members <strong>of</strong> society. They stand to benefit <strong>the</strong> most from<br />
measures to count <strong>the</strong>m, protect <strong>the</strong>m against abuse<br />
and guarantee <strong>the</strong>m access to justice.<br />
Obtaining protection can be a particular challenge<br />
for children with disabilities. In societies<br />
where <strong>the</strong>y are stigmatized and <strong>the</strong>ir families<br />
are exposed to social or economic exclusion,<br />
many children with disabilities are not even able<br />
to obtain an identity document. Their births go<br />
unregistered: They might not be expected to<br />
survive, 103 <strong>the</strong>ir parents might not want to admit<br />
to <strong>the</strong>m, or <strong>the</strong>y might be considered a potential<br />
drain on public resources. This is a flagrant violation<br />
<strong>of</strong> <strong>the</strong>se children’s human rights and a fundamental<br />
barrier to <strong>the</strong>ir participation in society.<br />
It can seal <strong>the</strong>ir invisibility and increase <strong>the</strong>ir vulnerability<br />
to <strong>the</strong> many forms <strong>of</strong> exploitation that<br />
result from not having an <strong>of</strong>ficial identity.<br />
<strong>State</strong>s parties to <strong>the</strong> Convention on <strong>the</strong> Rights <strong>of</strong><br />
Persons with Disabilities (CRPD) have given <strong>the</strong>mselves<br />
<strong>the</strong> clear obligation to guarantee effective<br />
legal protection for children with disabilities. They<br />
have also embraced <strong>the</strong> principle <strong>of</strong> ‘reasonable<br />
accommodation’, which requires that necessary<br />
and appropriate adaptations be made so that<br />
children with disabilities can enjoy <strong>the</strong>ir rights on<br />
an equal basis with o<strong>the</strong>rs. For resulting legislation<br />
and efforts to change discriminatory social<br />
norms to be meaningful, it is also necessary to<br />
make certain that laws are enforced and children<br />
with disabilities are informed about <strong>the</strong>ir right to<br />
protection from discrimination and about how to<br />
exercise this right. Separate systems for children<br />
with disabilities would be inappropriate. As with<br />
<strong>the</strong> o<strong>the</strong>r aspects <strong>of</strong> life and society discussed in<br />
this report, equity through inclusion is <strong>the</strong> goal.<br />
Abuse and violence<br />
Discrimination against and exclusion <strong>of</strong> children<br />
with disabilities renders <strong>the</strong>m disproportionately<br />
vulnerable to violence, neglect and abuse. Studies<br />
from <strong>the</strong> United <strong>State</strong>s have shown that children<br />
with disabilities who are in preschool or younger<br />
are more likely to be abused than peers without<br />
disabilities. 104 A national survey <strong>of</strong> deaf adults in<br />
Norway found that girls were twice as likely to<br />
experience sexual abuse, and boys three times as<br />
likely, as peers who had no disability. 105 <strong>Children</strong><br />
who may already be suffering stigma and isolation<br />
have also been shown to be more likely to<br />
suffer physical abuse.<br />
Some forms <strong>of</strong> violence are specific to children<br />
with disabilities. For example, <strong>the</strong>y may be subject<br />
to violence administered under <strong>the</strong> guise <strong>of</strong> treatment<br />
for behaviour modification, including electroconvulsive<br />
treatment, drug <strong>the</strong>rapy or electric<br />
shocks. 106 Girls with disabilities endure particular<br />
abuses, and in many countries are subject to forced<br />
sterilization or abortion. 107 Such procedures are<br />
defended on grounds <strong>of</strong> avoidance <strong>of</strong> menstruation<br />
or unwanted pregnancy, or even ascribed to a<br />
mistaken notion <strong>of</strong> ‘child protection’, given <strong>the</strong> disproportionate<br />
vulnerability <strong>of</strong> girls with disabilities<br />
to sexual abuse and rape. 108 As <strong>of</strong> <strong>the</strong> beginning <strong>of</strong><br />
ESSENTIALS OF PROTECTION<br />
41
<strong>2013</strong>, <strong>the</strong> World Health Organization was developing<br />
guidance designed to combat <strong>the</strong> human<br />
rights abuse <strong>of</strong> forced sterilization.<br />
Institutions and inappropriate care<br />
In many countries, children with disabilities continue<br />
to be placed in institutions. It is rare for<br />
<strong>the</strong>se facilities to provide <strong>the</strong> individual attention<br />
that children need to develop to <strong>the</strong>ir full capacity.<br />
The quality <strong>of</strong> educational, medical and rehabilitative<br />
care provided in institutions is <strong>of</strong>ten insufficient<br />
because standards <strong>of</strong> appropriate care for<br />
children with disabilities are lacking or, where<br />
such standards exist, because <strong>the</strong>y are not monitored<br />
and enforced.<br />
Under <strong>the</strong> Convention on <strong>the</strong> Rights <strong>of</strong> <strong>the</strong> Child<br />
(CRC), children with and without disabilities have<br />
<strong>the</strong> right to be cared for by <strong>the</strong>ir parents (Article<br />
7) and to not be separated from <strong>the</strong>ir parents<br />
unless this is deemed by a competent authority<br />
to be in <strong>the</strong> child’s best interest (Article 9). The<br />
CRPD reinforces this in Article 23, which states<br />
that where <strong>the</strong> immediate family is unable to care<br />
for a child with disabilities, <strong>State</strong>s parties must<br />
take every measure to provide alternative care<br />
within <strong>the</strong> extended family or community.<br />
In many countries, foster families are a frequent<br />
form <strong>of</strong> alternative care. Foster families may feel<br />
reluctant to take on <strong>the</strong> care <strong>of</strong> a child with a disability<br />
because <strong>of</strong> <strong>the</strong> perceived extra burden <strong>of</strong><br />
care and additional physical and psychological<br />
demands. Organizations tasked with placing children<br />
in families can encourage <strong>the</strong>m to consider<br />
fostering children with disabilities, and provide<br />
<strong>the</strong>m with appropriate training and support.<br />
Where authorities have come to see <strong>the</strong> perils<br />
<strong>of</strong> institutional care and have moved to return<br />
children to <strong>the</strong>ir families or communities, children<br />
with disabilities have been among <strong>the</strong> last<br />
to be removed from institutions and transferred<br />
to alternative care. In many countries <strong>of</strong> Central<br />
and Eastern Europe and <strong>the</strong> Commonwealth <strong>of</strong><br />
<strong>Children</strong> with disabilities and secondary education<br />
uArmenia, 2011<br />
<strong>Children</strong> with disabilities who live with <strong>the</strong>ir families<br />
generally obtain <strong>the</strong>ir secondary education in<br />
mainstream schools. <strong>Children</strong> with disabilities who<br />
live in orphanages tend to not attend secondary<br />
school at all.<br />
The main reason children with disabilities who are<br />
in <strong>the</strong> care <strong>of</strong> <strong>the</strong>ir families do not attend school is<br />
because <strong>the</strong>ir parents think <strong>the</strong>ir children cannot<br />
study at school.<br />
Total Male Female Total Male Female<br />
70% 71%<br />
67%<br />
72% 72% 72%<br />
48%47% 57%<br />
General<br />
school<br />
12% 12% 12%<br />
Special<br />
school<br />
18%<br />
21%<br />
17%<br />
No<br />
school<br />
<strong>Children</strong> with disabilities in <strong>the</strong><br />
care <strong>of</strong> families<br />
5%<br />
8%<br />
2%<br />
General<br />
school<br />
23% 21% 21%<br />
Special<br />
school<br />
No<br />
school<br />
<strong>Children</strong> with disabilities in <strong>the</strong><br />
care <strong>of</strong> orphanages<br />
4% 4% 3%<br />
Refused<br />
admission<br />
6% 4%<br />
9% 7% 8% 4%<br />
Distance/<br />
transportation<br />
Parents see<br />
no need<br />
for school<br />
19%<br />
14%<br />
26%<br />
Insufficient<br />
conditions<br />
at school<br />
34% 37% 29%<br />
Health<br />
condition<br />
Parents think<br />
child cannot<br />
study at school<br />
Source: Ministry <strong>of</strong> Labour and Social Issues <strong>of</strong> <strong>the</strong> Republic <strong>of</strong> Armenia and UNICEF, It’s About Inclusion: Access to education, health and social protection services<br />
for children with disabilities in Armenia. UNICEF/Yerevan, 2012, .<br />
Sample sizes: 5,707 children in total sample; 5,322 children with disabilities in <strong>the</strong> care <strong>of</strong> families; 385 children with disabilities in <strong>the</strong> care <strong>of</strong> orphanages.<br />
Age range: Total sample: 0–18 years old. Secondary education questions: 6–18 years old.<br />
42<br />
THE STATE OF THE WORLD’S CHILDREN <strong>2013</strong>: <strong>Children</strong> with Disabilities
Independent <strong>State</strong>s, institutionalized care is being<br />
reformed and children are being moved from<br />
large facilities to smaller group homes or familybased<br />
care. Serbia, for example, began wholesale<br />
reforms in 2001. Deinstitutionalization was given<br />
priority and fostering, which had an established<br />
history in <strong>the</strong> country, was given a boost. A new<br />
family law was adopted and a fund was established<br />
to help develop community-based social<br />
services. Progress ensued, but close examination<br />
revealed that children without disabilities had<br />
been released from institutions at a much faster<br />
rate than children with disabilities – about 70<br />
per cent <strong>of</strong> whom had been committed to care<br />
directly from a maternity ward. This revelation<br />
served to demonstrate <strong>the</strong> importance <strong>of</strong> ensuring<br />
that reforms are designed and implemented<br />
so no children are excluded from progress, and<br />
it has since led to a renewed commitment to<br />
deinstitutionalization. 109<br />
Inclusive justice<br />
A <strong>State</strong>’s responsibility to protect <strong>the</strong> rights <strong>of</strong> all<br />
children under its jurisdiction extends equally to<br />
children with disabilities who are in contact with<br />
<strong>the</strong> law – whe<strong>the</strong>r as victims, witnesses, suspects<br />
or convicts. Specific measures can help: <strong>Children</strong><br />
with disabilities can be interviewed in appropriate<br />
languages, whe<strong>the</strong>r spoken or signed. Law<br />
enforcement <strong>of</strong>ficers, social workers, lawyers,<br />
judges and o<strong>the</strong>r relevant pr<strong>of</strong>essionals can be<br />
trained to work with children who have disabilities.<br />
Systematic and continuous training <strong>of</strong> all<br />
pr<strong>of</strong>essionals involved in <strong>the</strong> administration <strong>of</strong><br />
justice for children is vital, as is <strong>the</strong> establishment<br />
<strong>of</strong> regulations and protocols that enhance<br />
equal treatment <strong>of</strong> children with disabilities.<br />
Last to benefit<br />
Under Serbia’s welfare reforms, children with<br />
disabilities were released from institutions at a<br />
slower rate than children without disabilities.<br />
37%<br />
DECREASE 63%<br />
100% 100%<br />
DECREASE<br />
91%<br />
83%<br />
79%<br />
63%<br />
2000 2005 2008 2011 2000 2005 2008 2011<br />
<strong>Children</strong> and youth (0–26 years old)<br />
with disabilities in institutions<br />
49%<br />
37%<br />
<strong>Children</strong> and youth (0–26 years old)<br />
without disabilities in institutions<br />
Source: Republican Institute for Social Protection, Serbia.<br />
Sample sizes: <strong>Children</strong> and youth (0–26 years old) with disabilities: 2,020 in<br />
2000, 1,280 in 2011. <strong>Children</strong> and youth (0–26 years old) without disabilities:<br />
1,534 in 2000, 574 in 2011.<br />
<strong>Children</strong> with disabilities should not be placed in<br />
regular juvenile detention facilities, nei<strong>the</strong>r when<br />
awaiting nor following a trial. Any decisions resulting<br />
in deprivation <strong>of</strong> liberty should be aimed at<br />
appropriate treatment to address <strong>the</strong> issues that led<br />
<strong>the</strong> child to commit a crime. Such treatment should<br />
be carried out in <strong>the</strong> context <strong>of</strong> appropriate facilities<br />
with adequately trained staff, with human rights<br />
and legal safeguards fully respected. 110<br />
It is also important to develop alternative solutions<br />
to formal judicial proceedings, taking into<br />
account <strong>the</strong> range <strong>of</strong> individual capacities <strong>of</strong><br />
children who have disabilities. Formal legal<br />
procedures should only be used as a measure<br />
<strong>of</strong> last resort, where this is in <strong>the</strong> interest <strong>of</strong><br />
public order, and care should be taken to<br />
explain <strong>the</strong> process and <strong>the</strong> child’s rights.<br />
A child learns <strong>the</strong> Dutch alphabet at a school for children<br />
with learning disabilities in Curaçao, Ne<strong>the</strong>rlands.<br />
© UNICEF/HQ2011-1955/LeMoyne<br />
ESSENTIALS OF PROTECTION<br />
43
FOCUS<br />
Violence against children<br />
with disabilities<br />
By Lisa Jones, Mark A. Bellis, Sara<br />
Wood, Karen Hughes, Ellie McCoy,<br />
Lindsay Eckley, Ge<strong>of</strong>f Bates<br />
Centre for Public Health, Liverpool<br />
John Moores University<br />
Christopher Mikton, Alana Officer,<br />
Tom Shakespeare<br />
Department <strong>of</strong> Violence and Injury<br />
Prevention and Disability, World<br />
Health Organization<br />
<strong>Children</strong> with disabilities are<br />
three to four times more likely<br />
to be victims <strong>of</strong> violence.<br />
<strong>Children</strong> and adults with disabilities<br />
<strong>of</strong>ten face a wide<br />
range <strong>of</strong> physical, social and<br />
environmental barriers to full<br />
participation in society, including<br />
reduced access to health<br />
care, education and o<strong>the</strong>r support<br />
services. They are also<br />
thought to be at significantly<br />
greater risk <strong>of</strong> violence than<br />
<strong>the</strong>ir peers without disabilities.<br />
Understanding <strong>the</strong> extent <strong>of</strong><br />
violence against children with<br />
disabilities is an essential first<br />
step in developing effective programmes<br />
to prevent <strong>the</strong>m from<br />
becoming victims <strong>of</strong> violence<br />
and to improve <strong>the</strong>ir health<br />
and <strong>the</strong> quality <strong>of</strong> <strong>the</strong>ir lives.<br />
To this end, research teams<br />
at Liverpool John Moores<br />
University and <strong>the</strong> World Health<br />
Organization conducted <strong>the</strong> first<br />
systematic review, including<br />
meta-analysis, <strong>of</strong> existing studies<br />
on violence against children<br />
with disabilities (aged 18 years<br />
and under).<br />
Seventeen studies, all from<br />
high-income countries, met<br />
<strong>the</strong> criteria for inclusion in <strong>the</strong><br />
review. Prevalence estimates<br />
<strong>of</strong> violence against children<br />
with disabilities ranged from<br />
26.7 per cent for combined<br />
measures <strong>of</strong> violence to 20.4<br />
per cent for physical violence<br />
and 13.7 per cent for sexual<br />
violence. Estimates <strong>of</strong> risk<br />
indicated that children with disabilities<br />
were at a significantly<br />
greater risk <strong>of</strong> experiencing<br />
violence than peers without<br />
disabilities: 3.7 times more<br />
likely for combined measures<br />
<strong>of</strong> violence, 3.6 times more<br />
likely for physical violence<br />
and 2.9 times more likely for<br />
sexual violence. The type <strong>of</strong><br />
disability appeared to affect <strong>the</strong><br />
prevalence and risk <strong>of</strong> violence,<br />
although <strong>the</strong> evidence on this<br />
point was not conclusive. For<br />
instance, children with mental<br />
or intellectual disabilities were<br />
4.6 times more likely to be<br />
victims <strong>of</strong> sexual violence than<br />
<strong>the</strong>ir non-disabled peers.<br />
This review demonstrated that<br />
violence is a major problem<br />
for children with disabilities. It<br />
also highlighted <strong>the</strong> absence <strong>of</strong><br />
high-quality studies on <strong>the</strong> topic<br />
from low- and middle-income<br />
countries, which generally have<br />
higher population rates <strong>of</strong> disability,<br />
higher levels <strong>of</strong> violence<br />
and fewer support services for<br />
those living with a disability.<br />
This gap in <strong>the</strong> research urgently<br />
needs to be filled.<br />
A number <strong>of</strong> explanations have<br />
been put forward to account<br />
44<br />
THE STATE OF THE WORLD’S CHILDREN <strong>2013</strong>: <strong>Children</strong> with Disabilities
<strong>Children</strong> with disabilities are at greater risk <strong>of</strong> experiencing physical<br />
or sexual violence than peers without disabilities.<br />
for why children with disabilities<br />
are at much greater risk <strong>of</strong><br />
violence than children without<br />
disabilities. Having to care for<br />
a child with a disability can<br />
put extra strain on parents<br />
or households and increase<br />
<strong>the</strong> risk <strong>of</strong> abuse. Significant<br />
numbers <strong>of</strong> children with disabilities<br />
continue to be placed<br />
into residential care, which is<br />
a major risk factor for sexual<br />
and physical abuse. <strong>Children</strong><br />
with disabilities that affect<br />
communication may be particularly<br />
vulnerable to abuse, since<br />
communication barriers can<br />
hamper <strong>the</strong>ir ability to disclose<br />
abusive experiences.<br />
The Convention on <strong>the</strong> Rights<br />
<strong>of</strong> Persons with Disabilities<br />
aims to protect <strong>the</strong> rights <strong>of</strong><br />
individuals with disabilities<br />
and guarantee <strong>the</strong>ir full and<br />
equal participation in society.<br />
In <strong>the</strong> case <strong>of</strong> children with disabilities,<br />
this includes ensuring<br />
a safe and stable progression<br />
through childhood and into<br />
adulthood. As with all children,<br />
a safe and secure childhood<br />
provides <strong>the</strong> best chance <strong>of</strong><br />
achieving a healthy, welladjusted<br />
adulthood. Adverse<br />
childhood experiences, including<br />
violence, are known to<br />
be related to a wide range <strong>of</strong><br />
negative health and social outcomes<br />
in later life. The extra<br />
demands placed on children<br />
with disabilities – who must<br />
cope with <strong>the</strong>ir disabilities and<br />
overcome societal barriers that<br />
increase <strong>the</strong>ir risk <strong>of</strong> poorer<br />
outcomes in later life – mean<br />
that a safe and secure childhood<br />
is particularly important.<br />
<strong>Children</strong> placed away from<br />
home need increased care and<br />
protection, and institutional<br />
cultures, regimes and structures<br />
that exacerbate <strong>the</strong> risk<br />
<strong>of</strong> violence and abuse should<br />
be addressed as a matter <strong>of</strong><br />
urgency. Whe<strong>the</strong>r <strong>the</strong>y live<br />
in institutions or with <strong>the</strong>ir<br />
families or o<strong>the</strong>r caregivers,<br />
all children with disabilities<br />
should be viewed as a highrisk<br />
group in which it is critical<br />
to identify violence. They<br />
may benefit from interventions<br />
such as home visiting<br />
and parenting programmes,<br />
which have been demonstrated<br />
to be effective for preventing<br />
violence and mitigating its consequences<br />
in children without<br />
disabilities. The effectiveness <strong>of</strong><br />
such interventions for children<br />
with disabilities should be evaluated<br />
as a matter <strong>of</strong> priority.<br />
ESSENTIALS OF PROTECTION<br />
45
PERSPECTIVE<br />
Segregation and abuse<br />
in institutions<br />
By Eric Rosenthal and Laurie Ahern<br />
Eric Rosenthal, JD, is founder and<br />
Executive Director <strong>of</strong> Disability Rights<br />
International (DRI). Laurie Ahern is its<br />
President. Through investigations <strong>of</strong><br />
orphanages and o<strong>the</strong>r institutions in<br />
more than two dozen countries, DRI<br />
has brought international attention<br />
to <strong>the</strong> human rights <strong>of</strong> people with<br />
disabilities.<br />
Throughout <strong>the</strong> world, millions<br />
<strong>of</strong> children with disabilities are<br />
separated from <strong>the</strong>ir families<br />
and placed in orphanages,<br />
boarding schools, psychiatric<br />
facilities and social care<br />
homes. <strong>Children</strong> who survive<br />
institutions face <strong>the</strong> prospect<br />
<strong>of</strong> lifetime segregation from<br />
society in facilities for adults.<br />
According to <strong>the</strong> Convention<br />
on <strong>the</strong> Rights <strong>of</strong> Persons with<br />
Disabilities (CRPD), segregating<br />
children on <strong>the</strong> basis <strong>of</strong> <strong>the</strong>ir<br />
disability violates <strong>the</strong> rights <strong>of</strong><br />
every such child. Article 19 <strong>of</strong><br />
<strong>the</strong> Convention requires governments<br />
to establish <strong>the</strong> laws,<br />
social policies and community<br />
support services needed to prevent<br />
isolation or segregation<br />
from <strong>the</strong> community.<br />
Over <strong>the</strong> course <strong>of</strong> 20 years,<br />
Disability Rights International<br />
(DRI) has documented <strong>the</strong><br />
conditions <strong>of</strong> children with<br />
disabilities in institutions in 26<br />
countries around <strong>the</strong> world. Our<br />
findings are surprisingly consistent.<br />
We have interviewed<br />
heartbroken mo<strong>the</strong>rs and fa<strong>the</strong>rs<br />
who wish to keep <strong>the</strong>ir children<br />
at home but receive inadequate<br />
support from governments and<br />
cannot afford to stay home from<br />
work to take care <strong>of</strong> a child.<br />
Doctors <strong>of</strong>ten tell parents to<br />
place <strong>the</strong>ir daughter or son in an<br />
orphanage before <strong>the</strong>y become<br />
too attached to <strong>the</strong> child.<br />
Raising children in congregate<br />
settings is inherently dangerous.<br />
Even in clean, well-managed and<br />
well-staffed institutions, children<br />
encounter greater risks to <strong>the</strong>ir<br />
life and health compared to<br />
those who grow up in families.<br />
<strong>Children</strong> who grow up in institutions<br />
are likely to acquire developmental<br />
disabilities, and <strong>the</strong><br />
youngest among <strong>the</strong>m also face<br />
potentially irreversible psychological<br />
damage.<br />
Even in institutions with adequate<br />
food, we <strong>of</strong>ten observe<br />
children who are emaciated<br />
because <strong>the</strong>y simply stop eating<br />
– a condition called ‘failure to<br />
thrive’. Infants and children with<br />
disabilities may starve or lack<br />
adequate nutrients because staff<br />
do not or cannot take <strong>the</strong> extra<br />
time to feed <strong>the</strong>m. Sometimes<br />
staff will prop a bottle on <strong>the</strong><br />
chest <strong>of</strong> a bedridden child, in<br />
<strong>the</strong>ory allowing her to grasp it<br />
and drink – but in practice, <strong>the</strong><br />
child may be unable to pick it up.<br />
Many children are left to languish.<br />
A DRI investigator came<br />
to <strong>the</strong> horrific realization, in<br />
2007, that a child who looked to<br />
be 7 or 8 years old was, according<br />
to a nurse, 21 years old and<br />
had never been out <strong>of</strong> his crib in<br />
11 years.<br />
Without any movement, physical<br />
disabilities worsen, and children<br />
can develop life-threatening<br />
medical complications. Some<br />
children’s arms and legs atrophy<br />
and have to be amputated.<br />
Without emotional attention<br />
and support, many children<br />
become self-abusive, rocking<br />
back and forth, banging <strong>the</strong>ir<br />
heads against walls, biting <strong>the</strong>mselves<br />
or poking <strong>the</strong>ir own eyes.<br />
Most facilities lack trained staff<br />
who can help children stop such<br />
behaviour. Instead, children are<br />
sometimes tied permanently to<br />
46<br />
THE STATE OF THE WORLD’S CHILDREN <strong>2013</strong>: <strong>Children</strong> with Disabilities
It is much harder to protect children and provide <strong>the</strong>m with an<br />
opportunity for a life in society when <strong>the</strong>ir ties to family have<br />
already been broken.<br />
beds or held in cages – whe<strong>the</strong>r<br />
to prevent self-abuse or to help<br />
overwhelmed staff cope with<br />
<strong>the</strong> demands <strong>of</strong> <strong>the</strong> many children<br />
in <strong>the</strong>ir care. The United<br />
Nations Committee against<br />
Torture and <strong>the</strong> United Nations<br />
Special Rapporteur on Torture<br />
have said that <strong>the</strong> prolonged<br />
use <strong>of</strong> restraints may constitute<br />
torture.<br />
For a child who has already<br />
been institutionalized, falling ill<br />
can be a death sentence. Staff<br />
members at facilities in more<br />
than one country have said<br />
that children with disabilities<br />
are routinely denied medical<br />
treatment. Institution staff have<br />
also told us – incorrectly – that<br />
children with developmental<br />
disabilities lack <strong>the</strong> ability to<br />
feel pain. So, in some cases,<br />
medical procedures are conducted<br />
without anaes<strong>the</strong>sia.<br />
In one facility, children’s teeth<br />
were extracted with pliers;<br />
elsewhere, children received<br />
electro-convulsive <strong>the</strong>rapy<br />
with no anaes<strong>the</strong>sia or<br />
muscle relaxants.<br />
<strong>Children</strong> have been given electric<br />
shocks, physically restrained<br />
for long periods and isolated<br />
with <strong>the</strong> express purpose <strong>of</strong><br />
causing pain, on <strong>the</strong> <strong>the</strong>ory that<br />
this ‘aversive <strong>the</strong>rapy’ would<br />
extinguish behaviour deemed<br />
inappropriate. A teacher in <strong>the</strong><br />
United <strong>State</strong>s described one girl<br />
– blind, deaf and non-verbal –<br />
who was shocked for moaning.<br />
It turned out she had a broken<br />
tooth.<br />
Without oversight and human<br />
rights protections, children have,<br />
in effect, disappeared in institutions.<br />
Human rights monitoring<br />
and enforcement programmes to<br />
protect against violence, exploitation<br />
and abuse – as required by<br />
Article 16 <strong>of</strong> CRPD – are absent in<br />
most <strong>of</strong> <strong>the</strong> facilities we have visited.<br />
In some cases, authorities<br />
do not keep track <strong>of</strong> <strong>the</strong> names<br />
or numbers <strong>of</strong> children detained<br />
in <strong>the</strong>se places.<br />
Official statistics are unreliable<br />
and <strong>of</strong>ten understate reliance<br />
upon segregated service systems.<br />
The numbers are <strong>of</strong>ten<br />
limited to orphanages and do<br />
not include children detained in<br />
o<strong>the</strong>r types <strong>of</strong> institutions, such<br />
as boarding schools, health-care<br />
or psychiatric facilities, criminal<br />
justice systems or homeless<br />
shelters. Private or religious<br />
institutions, which may be much<br />
larger than government orphanages,<br />
are <strong>of</strong>ten not counted.<br />
The entrances to some orphanages<br />
and o<strong>the</strong>r institutions are<br />
emblazoned with <strong>the</strong> logos <strong>of</strong><br />
governments, corporate donors,<br />
churches or private charities.<br />
Even when financial assistance<br />
from international donors or<br />
technical assistance agencies<br />
makes up a small portion <strong>of</strong> an<br />
institution’s operating budget,<br />
this support can provide an<br />
apparent ‘seal <strong>of</strong> approval’. DRI<br />
has found bilateral and multilateral<br />
support – both <strong>of</strong>ficial<br />
and from voluntary donations<br />
by staff – for such amenities<br />
as playgrounds at orphanages<br />
where children die for want <strong>of</strong><br />
medical care and where <strong>the</strong>y<br />
are tied to beds. These donors<br />
may be well intentioned but<br />
this support runs counter to <strong>the</strong><br />
intent <strong>of</strong> <strong>the</strong> CRPD and o<strong>the</strong>r<br />
rights instruments that protect<br />
people from segregation.<br />
No child should ever be taken<br />
away from her or his family on<br />
<strong>the</strong> basis <strong>of</strong> disability. DRI is<br />
calling on every government<br />
and international donor agency<br />
to commit to preventing any<br />
new placements in orphanages.<br />
It is much harder to protect children<br />
and provide <strong>the</strong>m with an<br />
opportunity for a life in society<br />
when <strong>the</strong>ir ties to family have<br />
already been broken. The detention<br />
<strong>of</strong> children in institutions<br />
is a fundamental human rights<br />
violation. We can bring it to<br />
an end, on a worldwide scale,<br />
through a moratorium on new<br />
placements.<br />
ESSENTIALS OF PROTECTION<br />
47
Fadi, 12, walks past houses destroyed by airstrikes in Rafah, <strong>State</strong> <strong>of</strong> Palestine, where ongoing violence has<br />
had substantial psychological impact, especially on children. © UNICEF/HQ2012-1583/El Baba
CHAPTER 5<br />
HUMANITARIAN<br />
RESPONSE<br />
Humanitarian crises, such as those stemming from<br />
warfare or natural disasters, pose particular risks for<br />
children with disabilities. Inclusive humanitarian response<br />
is urgently needed – and feasible.<br />
Armed conflict and war affect children in direct<br />
and indirect ways: directly in <strong>the</strong> form <strong>of</strong> physical<br />
injuries from attack, artillery fire and landmine<br />
explosions or in <strong>the</strong> form <strong>of</strong> psychological<br />
conditions derived from <strong>the</strong>se injuries or from<br />
witnessing traumatic events; indirectly through,<br />
for example, <strong>the</strong> breakdown <strong>of</strong> health services,<br />
which leaves many illnesses untreated, and<br />
food insecurity, which leads to malnutrition. 111<br />
<strong>Children</strong> are also separated from <strong>the</strong>ir families,<br />
<strong>the</strong>ir homes or <strong>the</strong>ir schools, sometimes<br />
for years.<br />
The nature <strong>of</strong> armed conflict, a major cause<br />
<strong>of</strong> disabilities among children, is changing.<br />
Fighting is increasingly taking <strong>the</strong> form <strong>of</strong> recurring<br />
civil wars and fragmented violence characterized<br />
by <strong>the</strong> indiscriminate use <strong>of</strong> force and<br />
weapons. At <strong>the</strong> same time, natural disasters<br />
are expected to affect increasing numbers <strong>of</strong><br />
children and adults in coming years, especially<br />
in hazardous regions such as low-lying coastal<br />
zones, particularly as climate change-related<br />
disasters grow in frequency and severity. 112<br />
<strong>Children</strong> with disabilities face particular challenges<br />
in emergencies. They may be unable to<br />
escape during a crisis because <strong>of</strong> inaccessible<br />
evacuation routes; for example, a child in a<br />
wheelchair may be unable to flee a tsunami or<br />
gunfire and may be abandoned by her or his<br />
family. They may be dependent on assistive<br />
devices or caregivers, and in <strong>the</strong> face <strong>of</strong> <strong>the</strong> loss<br />
<strong>of</strong> a caregiver, may be extremely vulnerable to<br />
physical violence or to sexual, emotional and<br />
verbal abuse. <strong>Children</strong> with disabilities may<br />
also be made invisible by family and community<br />
beliefs – for example, a child with a mental<br />
impairment might be kept in <strong>the</strong> house because<br />
<strong>of</strong> stigma surrounding her or his condition.<br />
In addition, children with disabilities may be<br />
excluded from or unable to access mainstream<br />
support services and assistance programmes<br />
such as health services or food distribution<br />
because <strong>of</strong> <strong>the</strong> physical barriers posed by inaccessible<br />
buildings or because <strong>of</strong> negative attitudes.<br />
Or <strong>the</strong>y may be forgotten in <strong>the</strong> establishment<br />
<strong>of</strong> targeted services. For example, landmine<br />
survivors may not be able to access physical<br />
rehabilitation services because <strong>of</strong> distance, <strong>the</strong><br />
high cost <strong>of</strong> transport or criteria for admission to<br />
treatment programmes. Fur<strong>the</strong>rmore, children<br />
with disabilities may be disregarded in early<br />
warning systems, which <strong>of</strong>ten do not take into<br />
account <strong>the</strong> communication and mobility requirements<br />
<strong>of</strong> those with disabilities.<br />
Disability-inclusive humanitarian action is<br />
informed by and grounded in:<br />
• A rights-based approach, based on <strong>the</strong><br />
Convention on <strong>the</strong> Rights <strong>of</strong> <strong>the</strong> Child (CRC)<br />
and <strong>the</strong> Convention on <strong>the</strong> Rights <strong>of</strong> Persons<br />
with Disabilities (CRPD). Article 11 <strong>of</strong> <strong>the</strong> CRPD<br />
HUMANITARIAN RESPONSE<br />
49
specifically calls on duty bearers to take all necessary<br />
measures to ensure <strong>the</strong> protection and<br />
safety <strong>of</strong> persons with disabilities in situations<br />
<strong>of</strong> conflict, emergency and disaster, signifying<br />
<strong>the</strong> importance <strong>of</strong> <strong>the</strong> issue.<br />
• An inclusive approach that recognizes that<br />
children with disabilities, in addition to <strong>the</strong>ir<br />
disability-specific needs, have <strong>the</strong> same needs<br />
as o<strong>the</strong>r children, disability being only one<br />
aspect <strong>of</strong> <strong>the</strong>ir situation: They are children who<br />
happen to have disabilities. Such an inclusive<br />
approach also addresses <strong>the</strong> social, attitudinal,<br />
informational and physical barriers that impede<br />
participation and decision-making by children<br />
with disabilities in regular programmes.<br />
• Ensuring accessibility and universal design <strong>of</strong><br />
infrastructure and information. This includes<br />
making <strong>the</strong> physical environment, all facilities,<br />
health centres, shelters and schools, and<br />
<strong>the</strong> organization <strong>of</strong> health and o<strong>the</strong>r services,<br />
including communication and information systems,<br />
accessible for children with disabilities.<br />
• Promoting independent living so that children<br />
with disabilities can live as independently as<br />
possible and participate as fully as possible<br />
in all aspects <strong>of</strong> life.<br />
• Integrating age, gender and diversity awareness,<br />
including paying special attention to<br />
<strong>the</strong> double or triple discrimination faced by<br />
women and girls with disabilities.<br />
Disability-inclusive humanitarian response<br />
ensures that children and adults with disabilities,<br />
as well as <strong>the</strong>ir families, survive and live<br />
with dignity, even as it benefits <strong>the</strong> population<br />
as a whole. This approach calls for holistic and<br />
inclusive programmes, ra<strong>the</strong>r than just isolated<br />
projects and policies targeting disabilities. Key<br />
Vijay, 12, survived a landmine explosion and has gone on to become a mine risk educator in Sri Lanka.<br />
© UNICEF/Sri Lanka/2012/Tuladar<br />
50<br />
THE STATE OF THE WORLD’S CHILDREN <strong>2013</strong>: <strong>Children</strong> with Disabilities
Explosive remnants <strong>of</strong> war (ERW) on display at a school in Ajdabiya, Libya. Students collected <strong>the</strong> objects from around<br />
<strong>the</strong> city. © UNICEF/HQ2011-1435/Diffidenti<br />
intervention areas for disability-inclusive humanitarian<br />
action include:<br />
• Improving data and assessments in order to<br />
have an evidence base for <strong>the</strong> distinct needs<br />
and priorities <strong>of</strong> children with disabilities.<br />
• Making mainstream humanitarian services<br />
accessible for children with disabilities and<br />
involving <strong>the</strong>m in planning and design.<br />
• Designing specialized services for children with<br />
disabilities and ensuring that recovery and reintegration<br />
proceed in environments that foster<br />
well-being, health, self-respect and dignity.<br />
• Putting measures in place to prevent injuries<br />
and abuse and promote accessibility.<br />
• Partnering with community, regional and<br />
national actors, including disabled persons’<br />
organizations, to challenge discriminatory<br />
attitudes and perceptions and promote equity.<br />
• Promoting participation <strong>of</strong> children with<br />
disabilities by consulting <strong>the</strong>m and creating<br />
opportunities for <strong>the</strong>ir voices to be heard.<br />
Parties to conflict have an obligation to protect<br />
children from <strong>the</strong> effects <strong>of</strong> armed violence<br />
and to provide <strong>the</strong>m with access to appropriate<br />
health and psychosocial care to aid <strong>the</strong>ir recovery<br />
and reintegration. The Committee on <strong>the</strong> Rights<br />
<strong>of</strong> <strong>the</strong> Child has recommended that <strong>State</strong>s parties<br />
to <strong>the</strong> CRC add explicit reference to children<br />
with disabilities as part <strong>of</strong> <strong>the</strong>ir broader commitment<br />
not to recruit children into armed forces. 113<br />
Governments should also take care to address<br />
<strong>the</strong> recovery and social reintegration <strong>of</strong> children<br />
who acquire disabilities as a result <strong>of</strong> armed<br />
conflict. This is explored in greater detail in <strong>the</strong><br />
following Focus article.<br />
HUMANITARIAN RESPONSE<br />
51
FOCUS<br />
Risk, resilience and inclusive<br />
humanitarian action<br />
By Maria Kett<br />
Assistant Director, Department <strong>of</strong><br />
Epidemiology and Public Health,<br />
Leonard Cheshire Disability and<br />
Inclusive Development Centre,<br />
University College London<br />
Article 11 <strong>of</strong> <strong>the</strong> Convention<br />
on <strong>the</strong> Rights <strong>of</strong> Persons with<br />
Disabilities compels <strong>State</strong>s<br />
parties to “ensure <strong>the</strong> protection<br />
and safety <strong>of</strong> persons with<br />
disabilities in situations <strong>of</strong> risk,<br />
including situations <strong>of</strong> armed<br />
conflict, humanitarian emergencies<br />
and <strong>the</strong> occurrence<br />
<strong>of</strong> natural disasters.”<br />
In an emergency – whe<strong>the</strong>r<br />
armed conflict or a natural or<br />
human-made disaster – children<br />
are among those most<br />
vulnerable to <strong>the</strong> loss <strong>of</strong> food,<br />
shelter, health care, education<br />
and age-appropriate psychosocial<br />
support services. This<br />
vulnerability can be even more<br />
acute for children with disabilities:<br />
Even where basic supplies<br />
and relief services are available,<br />
<strong>the</strong>y may not be inclusive<br />
or accessible.<br />
Knowing how many children<br />
with disabilities live in an area<br />
affected by an emergency is<br />
extremely challenging, because<br />
accurate numbers may not<br />
have existed even before <strong>the</strong><br />
emergency. Parents or communities<br />
may hide such children<br />
because <strong>of</strong> stigma, for example.<br />
The resulting exclusion is <strong>of</strong> particular<br />
concern because even <strong>the</strong><br />
most rudimentary reporting systems<br />
can unravel in humanitarian<br />
situations, since registration<br />
and reporting points or centres<br />
may not be accessible.<br />
At <strong>the</strong> same time, increasing<br />
numbers <strong>of</strong> children may sustain<br />
disabling injuries as a result <strong>of</strong><br />
chronic or sudden emergencies.<br />
In an earthquake, children may<br />
be disabled by falling objects or<br />
when buildings collapse. They<br />
may receive crushing injuries<br />
and undergo psychological<br />
trauma during floods and landslides.<br />
Conflict increases <strong>the</strong> likelihood<br />
that children will become<br />
disabled as a result <strong>of</strong> fighting,<br />
because <strong>of</strong> landmines, or<br />
through exposure to o<strong>the</strong>r explosive<br />
remnants <strong>of</strong> war (ERW).<br />
Because children are smaller and<br />
at earlier stages in <strong>the</strong>ir development,<br />
<strong>the</strong>y <strong>of</strong>ten sustain more<br />
seriously disabling injuries than<br />
adults and require continuing<br />
physio<strong>the</strong>rapy, pros<strong>the</strong>ses and<br />
psychological support.<br />
The challenges facing children<br />
with disabilities and <strong>the</strong>ir families<br />
are rarely acknowledged<br />
when <strong>the</strong> impact <strong>of</strong> an emergency<br />
is assessed. These challenges<br />
include new environmental barriers<br />
such as collapsed ramps;<br />
damaged or lost assistive<br />
devices; and <strong>the</strong> loss <strong>of</strong> previously<br />
established services (sign<br />
language interpreters or visiting<br />
nurses) or support systems<br />
(social security payments or<br />
social protection schemes).<br />
There are o<strong>the</strong>r risks. If family<br />
members die, <strong>the</strong>re may be<br />
no one left who knows how to<br />
care for a child with a physical<br />
disability or who can communicate<br />
with a child with a<br />
sensory impairment. If families<br />
are forced to flee, especially if<br />
<strong>the</strong>y face a long journey by foot,<br />
<strong>the</strong>y may leave behind children<br />
who are unable to walk or are<br />
in frail health. Families may<br />
also leave behind children with<br />
disabilities because <strong>the</strong>y fear<br />
<strong>the</strong>y will be refused asylum in<br />
ano<strong>the</strong>r country if one <strong>of</strong> <strong>the</strong>ir<br />
family members has a disability.<br />
Several countries practise such<br />
discrimination. Institutions and<br />
residential schools may close or<br />
be abandoned by staff, leaving<br />
few people – or no one – to help<br />
<strong>the</strong> children in <strong>the</strong>ir charge.<br />
<strong>Children</strong> with disabilities, especially<br />
those with learning disabilities,<br />
can also be directly<br />
involved in conflict. They may<br />
be pressed into service as fighters,<br />
cooks or porters precisely<br />
because <strong>the</strong>y are considered to<br />
be less valuable, or less likely to<br />
52<br />
THE STATE OF THE WORLD’S CHILDREN <strong>2013</strong>: <strong>Children</strong> with Disabilities
esist, than children without disabilities.<br />
In <strong>the</strong>ory disarmament,<br />
demobilization and reintegration<br />
programmes include all child<br />
ex-combatants, but resources<br />
or programmes for children<br />
with disabilities are <strong>of</strong>ten nonexistent.<br />
These children <strong>the</strong>refore<br />
remain marginalized and<br />
excluded, leaving <strong>the</strong>m poor,<br />
vulnerable and <strong>of</strong>ten having to<br />
beg, as has been <strong>the</strong> case in<br />
Liberia and Sierra Leone.<br />
The risk <strong>of</strong> violence, including<br />
sexual violence, increases when<br />
family protection and social<br />
structures break down as <strong>the</strong>y<br />
do during conflict and disasters.<br />
While girls with disabilities are<br />
at particular risk in such situations,<br />
boys with disabilities<br />
are also at risk and are even<br />
less likely to be helped in <strong>the</strong><br />
aftermath <strong>of</strong> violence.<br />
Recovery and reconstruction<br />
come with <strong>the</strong>ir own challenges<br />
for children with disabilities. As<br />
is <strong>the</strong> case with all crisis-affected<br />
children, those with disabilities<br />
require a range <strong>of</strong> services,<br />
including but not limited to targeted<br />
ones. Disability-specific<br />
needs are extremely important,<br />
but <strong>the</strong>y are only part <strong>of</strong> <strong>the</strong> picture.<br />
During recovery operations<br />
after <strong>the</strong> 2004 Indian Ocean tsunami,<br />
for example, one girl with<br />
a disability was given five wheelchairs<br />
– but no one asked her if<br />
she needed food or clo<strong>the</strong>s.<br />
Resilience and inclusion<br />
<strong>Children</strong> have repeatedly<br />
demonstrated <strong>the</strong>ir resilience.<br />
Measures can be taken to<br />
support <strong>the</strong>ir participation and<br />
inclusion. These measures<br />
should be specific to particular<br />
groups and contexts: Boys and<br />
girls have different experiences<br />
<strong>of</strong> conflict, as do young children<br />
and adolescents. Similarly,<br />
emergencies can affect urban<br />
and rural areas differently.<br />
As a starting point, children with<br />
disabilities should be given <strong>the</strong><br />
opportunity to take part in <strong>the</strong><br />
planning and implementation <strong>of</strong><br />
disaster risk reduction and peacebuilding<br />
strategies as well as in<br />
recovery processes. Ignorance<br />
and incorrect assumptions that<br />
<strong>the</strong>y are unable to contribute<br />
have <strong>of</strong>ten barred <strong>the</strong>m from<br />
doing so, but this has begun to<br />
change. In Bangladesh, for example,<br />
Plan International learned<br />
to challenge such misconceptions<br />
through partnerships with<br />
disability organizations and by<br />
working directly with communities<br />
in undertaking child-centred<br />
disaster risk reduction.<br />
Similarly, provision for children<br />
with disabilities is increasing in<br />
disaster response. In Pakistan,<br />
Handicap International (HI) and<br />
Save <strong>the</strong> <strong>Children</strong> built childfriendly<br />
inclusive spaces and<br />
developed sector-wide guidance<br />
on inclusion <strong>of</strong> persons with disabilities,<br />
especially in protection<br />
projects. In Haiti, HI and <strong>the</strong> faithbased<br />
development organization<br />
CBM lobbied <strong>the</strong> government to<br />
increase <strong>the</strong> inclusion <strong>of</strong> persons<br />
with disabilities in food distribution<br />
and o<strong>the</strong>r efforts. The United<br />
Nations <strong>of</strong>ten uses emergencies<br />
as an opportunity to ‘build back<br />
better’, an approach that can<br />
yield opportunities for children<br />
with disabilities because it<br />
<strong>of</strong>fers all stakeholders a<br />
chance to work toge<strong>the</strong>r.<br />
Disability is also being mainstreamed<br />
in such guidelines<br />
as <strong>the</strong> Sphere Project’s<br />
Humanitarian Charter and<br />
Minimum Standards in<br />
Humanitarian Response,<br />
framed by a group <strong>of</strong> international<br />
organizations to improve<br />
<strong>the</strong> quality and accountability<br />
<strong>of</strong> humanitarian response.<br />
The availability <strong>of</strong> emergency<br />
guidelines on how to include<br />
people with disabilities – and<br />
children in particular – is<br />
increasing. These gains need to<br />
be consolidated and extended<br />
to such areas as child nutrition<br />
and protection.<br />
Also needed is a unified<br />
approach to data collection.<br />
Collaboration with local and<br />
national disabled people’s<br />
organizations should be<br />
emphasized, and <strong>the</strong>se groups’<br />
capacity to address issues<br />
specific to children should be<br />
built up where necessary. And<br />
<strong>the</strong> extent to which children<br />
with disabilities are included in<br />
humanitarian response must<br />
be audited to monitor and<br />
improve results.<br />
Clear standards and inclusion<br />
checklists that can be applied<br />
across <strong>the</strong> range <strong>of</strong> emergencies<br />
will be essential – but to<br />
be put into practice, <strong>the</strong>y must<br />
be accompanied by resource<br />
allocations.<br />
HUMANITARIAN RESPONSE<br />
53
FOCUS<br />
Explosive remnants <strong>of</strong> war<br />
By <strong>the</strong> Victim Assistance Editorial<br />
Team at <strong>the</strong> Landmine and Cluster<br />
Munition Monitor.<br />
The Landmine and Cluster Munition<br />
Monitor provides research for <strong>the</strong><br />
International Campaign to Ban<br />
Landmines and <strong>the</strong> Cluster Munition<br />
Coalition. It is <strong>the</strong> de facto monitoring<br />
regime for <strong>the</strong> Mine Ban Treaty<br />
and <strong>the</strong> Convention on Cluster<br />
Munitions.<br />
Explosive remnants <strong>of</strong> war<br />
(ERW) and anti-personnel<br />
landmines have a devastating<br />
impact on children and represent<br />
a significant contributing<br />
factor to child disability. Since<br />
<strong>the</strong> signing <strong>of</strong> <strong>the</strong> 1997 Mine<br />
Ban Treaty, however, vast tracts<br />
<strong>of</strong> land have been cleared <strong>of</strong><br />
<strong>the</strong>se munitions and returned<br />
to productive use.<br />
The 1997 treaty; <strong>the</strong> 1996<br />
Amended Protocol II and<br />
2003 Protocol V to <strong>the</strong> 1980<br />
Convention on Certain<br />
Conventional Weapons; and<br />
<strong>the</strong> 2008 Convention on Cluster<br />
Munitions have all had a positive<br />
impact in terms <strong>of</strong> protecting<br />
<strong>the</strong> lives <strong>of</strong> people living<br />
in areas contaminated by ERW<br />
and landmines. The global<br />
movement to ban landmines<br />
and cluster munitions is a testament<br />
to <strong>the</strong> importance <strong>of</strong><br />
strong political will among<br />
key stakeholders in fostering<br />
global change.<br />
Mine action programming,<br />
which seeks to address <strong>the</strong><br />
impact <strong>of</strong> landmines and ERW,<br />
is understood to be made up<br />
<strong>of</strong> five pillars – clearance, ERW/<br />
mine risk education, victim<br />
assistance, stockpile destruction<br />
and advocacy. Despite <strong>the</strong><br />
great successes in many <strong>of</strong><br />
<strong>the</strong>se pillars, as indicated by<br />
a significant global decline in<br />
ERW and landmine casualties,<br />
victim assistance continues<br />
to stand out as a key area <strong>of</strong><br />
weakness. This is especially so<br />
in <strong>the</strong> case <strong>of</strong> children affected<br />
by ERW or landmines.<br />
In contrast with <strong>the</strong> o<strong>the</strong>r four<br />
pillars <strong>of</strong> mine action, victim<br />
assistance requires a crosscutting<br />
response that includes<br />
medical and paramedical interventions<br />
to ensure physical<br />
rehabilitation, as well as social<br />
and economic interventions to<br />
promote reintegration and <strong>the</strong><br />
livelihood <strong>of</strong> victims.<br />
To date <strong>the</strong> bulk <strong>of</strong> mine<br />
action assistance and funding<br />
has been dedicated to clearance<br />
activities. In 2010, 85 per<br />
cent <strong>of</strong> global funds related<br />
to mine action were allocated<br />
to clearance, while only 9 per<br />
cent were allocated to victim<br />
assistance interventions. While<br />
<strong>the</strong> International Mine Action<br />
Standards – <strong>the</strong> standards in<br />
force for all UN mine action<br />
operations – address <strong>the</strong> mine<br />
action programming pillars <strong>of</strong><br />
clearance, ERW/mine risk education<br />
and stockpile destruction,<br />
<strong>the</strong>y do not tackle <strong>the</strong> issue <strong>of</strong><br />
victim assistance. Moreover, <strong>the</strong><br />
right to age- and gender-appropriate<br />
physical rehabilitation<br />
and social and economic reintegration<br />
for survivors <strong>of</strong> landmines<br />
and ERW is enshrined in<br />
international human rights and<br />
humanitarian law. However,<br />
few survivor assistance programmes<br />
have taken into consideration<br />
<strong>the</strong> specific needs<br />
<strong>of</strong> children, whe<strong>the</strong>r <strong>the</strong>y are<br />
direct survivors or victims in <strong>the</strong><br />
broader sense.<br />
The impact on children<br />
There has been a significant<br />
decrease in <strong>the</strong> numbers <strong>of</strong><br />
people killed or injured by<br />
landmine blasts. Between 2001<br />
and 2010, <strong>the</strong> number <strong>of</strong> new<br />
landmine and ERW casualties<br />
reported through <strong>the</strong> Landmine<br />
and Cluster Munitions Monitor,<br />
<strong>the</strong> monitoring arm <strong>of</strong> <strong>the</strong> Mine<br />
Ban Treaty and <strong>the</strong> Convention<br />
on Cluster Munitions, fell from<br />
7,987 to 4,191. The chart on<br />
<strong>the</strong> next page demonstrates<br />
a significant reduction in <strong>the</strong><br />
total number <strong>of</strong> civilian deaths<br />
and injuries from landmines<br />
and ERW in <strong>the</strong> five-year period<br />
between 2005 and 2010.<br />
54<br />
THE STATE OF THE WORLD’S CHILDREN <strong>2013</strong>: <strong>Children</strong> with Disabilities
Since monitoring began in 1999, <strong>the</strong>re have been at least 1,000<br />
child casualties every year. Many casualties go unrecorded, so <strong>the</strong><br />
real number is likely much higher.<br />
Never<strong>the</strong>less, <strong>the</strong> percentage<br />
<strong>of</strong> total casualties represented<br />
by child casualties<br />
has increased. Annually, since<br />
2005, children have accounted<br />
for approximately 20–30 per<br />
cent <strong>of</strong> all casualties from<br />
landmines, remnants <strong>of</strong> cluster<br />
munitions and o<strong>the</strong>r ERW.<br />
Since monitoring began in<br />
1999, <strong>the</strong>re have been at least<br />
1,000 child casualties every<br />
year. The number <strong>of</strong> child<br />
casualties <strong>of</strong> landmines and<br />
ERW in 2010 surpassed 1,200,<br />
and children accounted for 55<br />
per cent <strong>of</strong> all civilian deaths<br />
– children are now <strong>the</strong> civilian<br />
group for whom landmines<br />
and ERW are most deadly.<br />
Given that numerous casualties<br />
go unrecorded in many<br />
countries, <strong>the</strong> total number<br />
<strong>of</strong> child casualties annually<br />
is likely much higher, and<br />
in some <strong>of</strong> <strong>the</strong> world’s most<br />
mine-affected countries, <strong>the</strong><br />
percentage <strong>of</strong> casualties represented<br />
by children is higher<br />
still: In 2011, children constituted<br />
61 per cent <strong>of</strong> all civilian<br />
casualties in Afghanistan. In<br />
<strong>the</strong> same year, <strong>the</strong>y were 58<br />
per cent <strong>of</strong> civilian casualties<br />
in <strong>the</strong> Lao People’s Democratic<br />
Republic, 50 per cent in Iraq<br />
and 48 per cent in <strong>the</strong> Sudan.<br />
by landmines, remnants <strong>of</strong><br />
cluster munitions and o<strong>the</strong>r<br />
ERW, since 2008, boys have<br />
made up <strong>the</strong> single largest<br />
casualty group, approximately<br />
50 per cent <strong>of</strong> all civilian casualties.<br />
In 2006, <strong>the</strong> first year in<br />
which <strong>the</strong> Landmine Monitor<br />
began disaggregating casualty<br />
data by both age and gender,<br />
boys represented 83 per cent<br />
<strong>of</strong> child casualties and made<br />
up <strong>the</strong> largest single casualty<br />
group among civilians in 17<br />
countries. In 2008, boys represented<br />
73 per cent <strong>of</strong> child<br />
casualties, and were <strong>the</strong> largest<br />
casualty group in 10 countries.<br />
In many contaminated countries,<br />
boys are more likely than<br />
girls to come across mines or<br />
ERW, because <strong>the</strong>y are more<br />
involved in outdoor activities<br />
such as herding livestock, ga<strong>the</strong>ring<br />
wood and food, or collecting<br />
scrap metal. <strong>Children</strong> in<br />
general are more likely to deliberately<br />
handle explosive devices<br />
than adults, <strong>of</strong>ten unknowingly,<br />
out <strong>of</strong> curiosity or by mistaking<br />
<strong>the</strong>m for toys. Boys are<br />
more likely than girls to tamper<br />
with <strong>the</strong> explosive devices <strong>the</strong>y<br />
come across. These factors,<br />
If children now constitute <strong>the</strong><br />
majority <strong>of</strong> casualties caused<br />
Monica and Luis, both 14 in this 2004 photograph from Colombia, sit at poolside.<br />
Monica lost a foot when a younger cousin brought home a grenade. It exploded,<br />
killing <strong>the</strong> cousin. © UNICEF/HQ2004-0793/DeCesare<br />
HUMANITARIAN RESPONSE<br />
55
FOCUS<br />
(continued)<br />
as well as a tendency towards<br />
engaging in risk-taking behaviour,<br />
make well-planned risk<br />
education especially important<br />
for children.<br />
Assistance for child<br />
survivors<br />
ERW and landmine incidents<br />
affect children differently than<br />
<strong>the</strong>y do adults, whe<strong>the</strong>r <strong>the</strong>y<br />
are directly killed or injured,<br />
or become victims as a result<br />
<strong>of</strong> <strong>the</strong> death or injury <strong>of</strong> family<br />
and community members.<br />
Child survivors who are injured<br />
have specific needs that must<br />
be taken into consideration, in<br />
terms <strong>of</strong> both physical rescue<br />
and rehabilitation and social<br />
and economic reintegration.<br />
Smaller than adults, children<br />
are more likely to die or suffer<br />
serious injuries from a blast,<br />
including severe burns, shrapnel<br />
wounds, damaged limbs<br />
and o<strong>the</strong>r injuries that can<br />
lead to blindness or deafness.<br />
Child casualties in countries heavily<br />
affected by mines and explosive<br />
remnants <strong>of</strong> war, 2011*<br />
Country<br />
Total civilian<br />
casualties<br />
Their height means that <strong>the</strong>ir<br />
vital organs are closer to <strong>the</strong><br />
detonation, and children have<br />
a lower threshold for substantial<br />
blood loss than adults. If<br />
an anti-personnel landmine is<br />
stepped on, its blast will invariably<br />
cause foot and leg injuries,<br />
with secondary infections that<br />
usually result in amputation,<br />
causing lifelong disabilities and<br />
requiring long-term rehabilitation<br />
support.<br />
More than one third <strong>of</strong> all<br />
survivors require amputation,<br />
and while data concerning <strong>the</strong><br />
exact percentage <strong>of</strong> affected<br />
children requiring amputation<br />
are lacking, <strong>the</strong> percentage can<br />
be expected to be higher for<br />
children, given <strong>the</strong>ir smaller<br />
size. When children survive<br />
<strong>the</strong>ir injuries, <strong>the</strong>ir physical<br />
rehabilitation is more complex<br />
than that <strong>of</strong> adult survivors.<br />
<strong>Children</strong> whose injuries result<br />
in amputated limbs require<br />
Child<br />
casualties<br />
Child casualties<br />
as percentage<br />
<strong>of</strong> total<br />
casualties<br />
Afghanistan 609 373 61%<br />
Democratic Republic <strong>of</strong> <strong>the</strong> Congo 22 15 68%<br />
Iraq 100 50 50%<br />
Lao People’s Democratic Republic 97 56 58%<br />
Sudan 62 30 48%<br />
* Includes only casualties for which <strong>the</strong> civilian/security status and <strong>the</strong> age was known.<br />
Source: Landmine and Cluster Munition Monitor.<br />
more complicated rehabilitation<br />
and, because <strong>the</strong>ir bones grow<br />
more quickly than <strong>the</strong>ir s<strong>of</strong>t<br />
tissue, several re-amputations<br />
may be required. They also<br />
need to have pros<strong>the</strong>ses made<br />
as <strong>the</strong>y grow. Few countries<br />
affected by landmines and<br />
ERW have <strong>the</strong> capacity necessary<br />
to address <strong>the</strong> specific,<br />
complex medical and physical<br />
rehabilitation needs <strong>of</strong> child<br />
survivors.<br />
In addition to <strong>the</strong> physical<br />
trauma, <strong>the</strong> psychological<br />
consequences <strong>of</strong> surviving<br />
an ERW or landmine blast<br />
are <strong>of</strong>ten devastating for <strong>the</strong><br />
development <strong>of</strong> <strong>the</strong> child. They<br />
include a sense <strong>of</strong> guilt, loss<br />
<strong>of</strong> self-esteem, phobias and<br />
fear, sleep disorders, inability<br />
to speak and trauma that if left<br />
untreated can result in longterm<br />
mental disorder. Such<br />
psychological effects <strong>of</strong> war on<br />
children are difficult to document,<br />
and <strong>the</strong>y are not limited<br />
to children who have sustained<br />
physical injuries.<br />
The social and economic<br />
reintegration needs <strong>of</strong> child<br />
survivors also vary considerably<br />
from <strong>the</strong> needs <strong>of</strong> adults.<br />
Addressing <strong>the</strong> psychosocial<br />
impacts outlined above relies<br />
heavily on age-appropriate<br />
psychosocial support and<br />
access to education. In many<br />
countries, child survivors are<br />
forced to cut short <strong>the</strong>ir education<br />
because <strong>of</strong> <strong>the</strong> time needed<br />
for recovery, and because<br />
56<br />
THE STATE OF THE WORLD’S CHILDREN <strong>2013</strong>: <strong>Children</strong> with Disabilities
FOCUS<br />
(continued)<br />
Child casualties in <strong>the</strong> most affected countries*<br />
Percentage <strong>of</strong> children among civilian casualties (1999–2011)<br />
100%<br />
90%<br />
80%<br />
70%<br />
Afghanistan<br />
Cambodia<br />
Colombia<br />
60%<br />
50%<br />
40%<br />
30%<br />
20%<br />
10%<br />
0%<br />
1999 2000 2001 2002 2003 2004 2005 2006 2007 2008 2009 2010 2011<br />
* The three <strong>State</strong>s parties to <strong>the</strong> Mine Ban Treaty with <strong>the</strong> highest annual casualty rates.<br />
Source: Landmine and Cluster Munition Monitor.<br />
rehabilitation represents a<br />
financial burden for families.<br />
Access to free education for<br />
children with disabilities as a<br />
result <strong>of</strong> a landmine or ERW<br />
injury is necessary both to<br />
promote a sense <strong>of</strong> normalcy<br />
in <strong>the</strong>ir lives, enabling <strong>the</strong>m to<br />
recover from <strong>the</strong> psychosocial<br />
distress <strong>of</strong> <strong>the</strong>ir injury, and to<br />
reintegrate <strong>the</strong>m with <strong>the</strong>ir<br />
peer group and allow <strong>the</strong>m to<br />
fully participate in society. Yet<br />
children left with a disability<br />
following a landmine or ERW<br />
blast are more vulnerable than<br />
o<strong>the</strong>rs to <strong>the</strong> denial <strong>of</strong> this<br />
right: They may no longer be<br />
able to walk to school, and<br />
o<strong>the</strong>r transportation alternatives<br />
are seldom in place. Even<br />
when <strong>the</strong>y are able to get to<br />
school, classrooms may not be<br />
accessible for children with disabilities,<br />
and <strong>the</strong>ir teachers may<br />
not be trained<br />
in adapting to <strong>the</strong> needs <strong>of</strong><br />
children with disabilities.<br />
Opportunities for income<br />
generation and livelihood<br />
support are especially necessary<br />
to support children and<br />
adolescents left with a disability<br />
as a result <strong>of</strong> landmines<br />
or ERW. Unfortunately, such<br />
opportunities seldom if ever<br />
take age considerations into<br />
account. Where age has been<br />
considered, as it was during a<br />
2008–2010 project in Cambodia,<br />
<strong>the</strong> challenges to ensuring ageappropriate<br />
interventions for<br />
children and adolescents were<br />
such as to exclude those under<br />
18 from victim assistance livelihood<br />
interventions altoge<strong>the</strong>r.<br />
This failure to address <strong>the</strong><br />
specific needs <strong>of</strong> and risks to<br />
children and adolescents is<br />
reflected in <strong>the</strong> livelihood and<br />
economic streng<strong>the</strong>ning sector<br />
more generally: A 2011 review<br />
HUMANITARIAN RESPONSE<br />
57
FOCUS<br />
(continued)<br />
<strong>of</strong> 43 studies on <strong>the</strong> impact <strong>of</strong><br />
economic streng<strong>the</strong>ning programmes<br />
in crisis contexts in<br />
low-income countries found<br />
that some <strong>of</strong> <strong>the</strong>se efforts had,<br />
paradoxically, increased <strong>the</strong> risk<br />
that children would be pulled<br />
out <strong>of</strong> school and put to work<br />
or that girls would be subject<br />
to violence. The programmes<br />
studied featured such initiatives<br />
as microcredit, skills training,<br />
and agricultural interventions.<br />
The review called on economic<br />
streng<strong>the</strong>ning practitioners to<br />
“build children’s protection<br />
and well-being into <strong>the</strong> assessment,<br />
design, implementation,<br />
monitoring and evaluation <strong>of</strong><br />
economic streng<strong>the</strong>ning programs.”<br />
In addition, livelihood<br />
and income generation opportunities<br />
for children and adolescents<br />
must take into account<br />
not only <strong>the</strong>ir age but also <strong>the</strong>ir<br />
sex and <strong>the</strong> cultural context<br />
in which <strong>the</strong>y live. Because<br />
children with disabilities are<br />
among those most vulnerable<br />
to deprivation, violence, abuse<br />
and exploitation, <strong>the</strong>re is an<br />
urgent need to ensure that<br />
victim assistance programmes<br />
take <strong>the</strong> specific needs <strong>of</strong> child<br />
survivors into consideration.<br />
Meanwhile, children who are<br />
victims <strong>of</strong> landmines and o<strong>the</strong>r<br />
ERW as a result <strong>of</strong> <strong>the</strong> death or<br />
injury <strong>of</strong> caregivers and family<br />
members, including family<br />
breadwinners, also have needs<br />
that differ from those <strong>of</strong> adults.<br />
Like child survivors, <strong>the</strong>y too<br />
may be more vulnerable to <strong>the</strong><br />
loss <strong>of</strong> education opportunities,<br />
separation from <strong>the</strong>ir families,<br />
child labour and o<strong>the</strong>r forms <strong>of</strong><br />
exploitation or neglect.<br />
Despite <strong>the</strong> particular victim<br />
assistance needs <strong>of</strong> children,<br />
few victim assistance<br />
programmes take age- and<br />
gender-specific considerations<br />
into account. While research<br />
has been conducted on victim<br />
assistance in general, and guidance<br />
has been developed on<br />
what such programmes should<br />
look like, to date <strong>the</strong>re has been<br />
little if any focus on children<br />
and adolescents. Meanwhile,<br />
while <strong>State</strong>s parties to <strong>the</strong> Mine<br />
Ban Treaty, Protocols II and V<br />
<strong>of</strong> <strong>the</strong> Convention on Certain<br />
Conventional Weapons, and<br />
<strong>the</strong> Convention on Cluster<br />
Munitions must regularly report<br />
on national-level implementation<br />
<strong>of</strong> <strong>the</strong>se international<br />
instruments, <strong>the</strong>y do not report<br />
on <strong>the</strong>ir efforts to address <strong>the</strong><br />
specific needs <strong>of</strong> survivors<br />
according to <strong>the</strong>ir age. It is not<br />
surprising <strong>the</strong>n that in a 2009<br />
survey <strong>of</strong> more than 1,600 survivors<br />
from 25 affected countries<br />
conducted by Handicap<br />
International, almost two thirds<br />
<strong>of</strong> respondents reported that<br />
services for children were<br />
“never” or “almost never”<br />
adapted to address <strong>the</strong>ir specific<br />
needs or ensure that services<br />
were age appropriate.<br />
Child victims, including those<br />
directly and indirectly affected,<br />
have specific and additional<br />
needs in all aspects <strong>of</strong> assistance.<br />
However, <strong>the</strong> information<br />
available about efforts to<br />
address <strong>the</strong>se needs is limited.<br />
Most children involved in mine<br />
or ERW incidents are injured.<br />
Yet most data collection systems<br />
do not record <strong>the</strong>ir needs.<br />
As children account for an<br />
increasing percentage <strong>of</strong> <strong>the</strong><br />
total civilian casualties from<br />
ERW and landmines, it is<br />
essential to implement specific<br />
policy and programmatic recommendations<br />
on victim assistance<br />
that meets <strong>the</strong> needs <strong>of</strong><br />
child survivors. These recommendations<br />
include:<br />
• Supporting and promoting<br />
<strong>the</strong> establishment <strong>of</strong><br />
national injury surveillance<br />
systems able to provide<br />
systematic and continuous<br />
information on <strong>the</strong> magnitude<br />
and nature <strong>of</strong> ERW and<br />
landmine injuries (and o<strong>the</strong>r<br />
types <strong>of</strong> injuries if appropriate),<br />
including age- and<br />
gender-disaggregated data<br />
about child casualties.<br />
• Integrating a victim assistance<br />
component into <strong>the</strong><br />
International Mine Action<br />
Standards, including through<br />
technical notes and bestpractices<br />
guidelines, with<br />
specific guidance and considerations<br />
on child-specific survivor<br />
and victim assistance.<br />
• Developing and promoting<br />
<strong>the</strong> establishment <strong>of</strong> victim<br />
assistance databases able<br />
to provide systematic data<br />
58<br />
THE STATE OF THE WORLD’S CHILDREN <strong>2013</strong>: <strong>Children</strong> with Disabilities
Child casualties by type <strong>of</strong> explosive*<br />
Undefined mine<br />
5%<br />
ERW/Cluster<br />
submunitions<br />
67%<br />
ERW, 65%<br />
Cluster<br />
submunition, 2%<br />
Anti-personnel mine<br />
21%<br />
Anti-vehicle mine<br />
4%<br />
Victim-activated improvised<br />
explosive device<br />
3%<br />
*Not including unknown explosive item types.<br />
Source: Landmine and Cluster Munition Monitor.<br />
to monitor <strong>the</strong> rehabilitation,<br />
psychosocial and socioeconomic<br />
needs <strong>of</strong> each child<br />
and adult survivor appropriately<br />
and across time.<br />
• Sensitizing governments,<br />
mine action actors, donors<br />
and o<strong>the</strong>r relevant stakeholders,<br />
through both international<br />
and national forums, on<br />
<strong>the</strong> importance <strong>of</strong> prioritizing<br />
victim assistance (including<br />
for child survivors and <strong>the</strong><br />
children <strong>of</strong> people killed by<br />
victim-activated explosives)<br />
as a key pillar <strong>of</strong> mine action<br />
and international laws.<br />
• Making government, humanitarian<br />
and developmental<br />
actors and service providers<br />
aware <strong>of</strong> <strong>the</strong> importance<br />
<strong>of</strong> ensuring <strong>the</strong> availability<br />
<strong>of</strong> age- and gender-specific<br />
health and physical rehabilitation,<br />
psychosocial support,<br />
protection, education and<br />
livelihood support services<br />
for child survivors and victims<br />
<strong>of</strong> ERW and landmines.<br />
• Training health pr<strong>of</strong>essionals,<br />
including emergency<br />
response personnel, surgeons<br />
and ortho-pros<strong>the</strong>tic<br />
service providers, in <strong>the</strong><br />
specific considerations<br />
and special needs <strong>of</strong><br />
child survivors.<br />
• Training education service<br />
providers, including school<br />
management, teachers and<br />
educators, in providing<br />
accessible and appropriate<br />
education for child survivors<br />
and victims.<br />
• Formulating national laws,<br />
plans and policies responding<br />
to <strong>the</strong> needs <strong>of</strong> survivors<br />
and victims <strong>of</strong> ERW and landmines,<br />
or <strong>of</strong> persons with<br />
disabilities in general, so that<br />
<strong>the</strong>y integrate and respond to<br />
<strong>the</strong> age- and gender-specific<br />
needs <strong>of</strong> child survivors<br />
and victims.<br />
• Integrating a strong victim<br />
assistance component into<br />
<strong>the</strong> draft UN Inter-Agency<br />
Mine Action Strategy, including<br />
specific child-survivor<br />
assistance considerations.<br />
HUMANITARIAN RESPONSE<br />
59
PERSPECTIVE<br />
One bite <strong>of</strong> <strong>the</strong> elephant<br />
at a time<br />
By Chaeli Mycr<strong>of</strong>t<br />
Chaeli Mycr<strong>of</strong>t, recipient <strong>of</strong> <strong>the</strong><br />
2011 International <strong>Children</strong>’s<br />
Peace Prize, is an ability activist<br />
and avid wheelchair dancer. She<br />
is preparing to study politics and<br />
philosophy at <strong>the</strong> University <strong>of</strong><br />
Cape Town, South Africa.<br />
Some people see disability as<br />
a burden, o<strong>the</strong>rs as a gift. My<br />
disability has given me very<br />
unique opportunities and experiences<br />
that would not have<br />
happened if I were not disabled.<br />
I am happy and grateful<br />
for my disability because it has<br />
moulded me into <strong>the</strong> person<br />
that I am today.<br />
I am in no way saying that<br />
having a disability is an easy<br />
thing to deal with. It is a very<br />
complex situation, and it affects<br />
almost every aspect <strong>of</strong> your<br />
life. But I hope, throughout<br />
my life, to inspire o<strong>the</strong>r young<br />
people to see <strong>the</strong>ir disabilities<br />
as an opportunity to focus<br />
on ability, not just on <strong>the</strong>ir<br />
limitations.<br />
My family has always challenged<br />
me to focus on my<br />
abilities and has never viewed<br />
or treated me with pity. For<br />
this, I will be eternally grateful<br />
because it made me see myself<br />
as equal to any able-bodied<br />
person. I was also raised knowing<br />
that my contribution is <strong>of</strong><br />
equal importance to anyone<br />
else’s, and to stand up (metaphorically)<br />
for my rights. My<br />
friends view me as an equal<br />
and accept that my disability<br />
sometimes makes it difficult for<br />
me to do things in <strong>the</strong> same<br />
manner as <strong>the</strong>y do, so we just<br />
have to be slightly more creative<br />
to include me in whatever<br />
we’re doing – playing cricket<br />
when we were younger, for<br />
example. I would be <strong>the</strong> scorer.<br />
The incredible support I<br />
received enabled me to work<br />
with children with disabilities<br />
in South Africa. For this I won<br />
<strong>the</strong> International <strong>Children</strong>’s<br />
Peace Prize in 2011 – an event<br />
that has changed my life in an<br />
amazing way. The KidsRights<br />
Foundation, which awards this<br />
prize annually, has given me<br />
<strong>the</strong> opportunity to spread my<br />
message through a worldwide<br />
platform and to meet people<br />
I would o<strong>the</strong>rwise never meet.<br />
They also pay for my education<br />
and are making it possible<br />
60<br />
THE STATE OF THE WORLD’S CHILDREN <strong>2013</strong>: <strong>Children</strong> with Disabilities
If people with disabilities can’t believe in <strong>the</strong>mselves or if o<strong>the</strong>rs<br />
don’t believe in <strong>the</strong>m, I will believe in <strong>the</strong>m – and hopefully my<br />
positivity will spread and encourage more positivity.<br />
for me to go to university next<br />
year with all <strong>the</strong> adjustments<br />
I need.<br />
So many children with disabilities<br />
are not celebrated for <strong>the</strong>ir<br />
capabilities and are hidden<br />
away from <strong>the</strong> world because<br />
<strong>of</strong> fear and ignorance. We need<br />
to realize that people with disabilities<br />
are crucial in our population.<br />
People with disabilities<br />
are <strong>of</strong>ten <strong>the</strong> ones who think<br />
outside <strong>the</strong> box – because we<br />
have to. We have to make our<br />
disabilities work for us and not<br />
against us, and teach o<strong>the</strong>rs<br />
to be caring and empa<strong>the</strong>tic.<br />
Empathy, something <strong>the</strong> world<br />
desperately needs.<br />
I believe that <strong>the</strong>re are two<br />
main issues to be tackled on a<br />
worldwide level – accessibility<br />
and attitudes. These issues<br />
are interconnected and cannot<br />
be dealt with one by one. If<br />
people can change <strong>the</strong> worldwide<br />
attitude towards disability<br />
from one <strong>of</strong> pity, shame and<br />
inferiority to one <strong>of</strong> abundance,<br />
acceptance and equality, <strong>the</strong>n<br />
we will see amazing progress.<br />
Positive attitudes can lead to<br />
improved accessibility – just as<br />
inaccessibility is an expression<br />
<strong>of</strong> <strong>the</strong> view that <strong>the</strong> needs <strong>of</strong><br />
people with disabilities are less<br />
important than those <strong>of</strong> ablebodied<br />
people, an attitude that<br />
has negative consequences<br />
for people with and without<br />
disabilities.<br />
Improved attitudes should<br />
also help address o<strong>the</strong>r major<br />
issues, such as our experiences<br />
<strong>of</strong> education. I have been in<br />
every form <strong>of</strong> education that<br />
a person with a disability can<br />
do: special needs school, mainstream<br />
state primary and high<br />
school, mainstream private<br />
high school. I wouldn’t say I’m<br />
an expert, but <strong>the</strong>re’s a lot to<br />
be said for experience. It was<br />
certainly not always easy and<br />
simple. Often it was a struggle,<br />
and at times I was incredibly<br />
unhappy. I worked really hard<br />
to be included and to make it<br />
easier for <strong>the</strong> people who are<br />
going to come after me. I am<br />
finishing my school career in a<br />
place where I am fully included<br />
and accepted. When I think<br />
about it, all I feel is relief –<br />
relief that I don’t have to fight<br />
so hard for my own happiness<br />
anymore. Now I can fight<br />
harder for o<strong>the</strong>r people with<br />
disabilities and <strong>the</strong>ir right to<br />
happiness.<br />
It may seem that I am always<br />
a super-positive person. This<br />
is not <strong>the</strong> case. I have had my<br />
struggles, and I am sure that<br />
<strong>the</strong>y are not over. The thing<br />
that tips <strong>the</strong> scale towards positivity<br />
is <strong>the</strong> fact that I am surrounded<br />
by people who believe<br />
in my ability and are positive<br />
about my contribution to society<br />
– people who counter my<br />
negative days. I really love<br />
<strong>the</strong>m for that.<br />
My lifetime goal is to have disability<br />
become something that<br />
is completely accepted and<br />
embraced by <strong>the</strong> global community.<br />
It may be a big task,<br />
and it may have many facets,<br />
but I believe it’s entirely<br />
possible.<br />
It starts with believing. I believe<br />
in my abilities; I believe wholeheartedly<br />
that I can make<br />
change happen – that I can<br />
change lives. If people with disabilities<br />
can’t believe in <strong>the</strong>mselves<br />
or if o<strong>the</strong>rs don’t believe<br />
in <strong>the</strong>m, I will believe in <strong>the</strong>m –<br />
and hopefully my positivity will<br />
spread and encourage more<br />
positivity. This might seem<br />
insignificant to some but it’s<br />
still change.<br />
One bite <strong>of</strong> <strong>the</strong> elephant at<br />
a time.<br />
HUMANITARIAN RESPONSE<br />
61
A health worker assesses a boy at <strong>the</strong> Atfaluna Society for Deaf <strong>Children</strong>, <strong>State</strong> <strong>of</strong> Palestine. The organization <strong>of</strong>fers education<br />
and vocational training, free health care, psychosocial services and job placement. © UNICEF/HQ2008-0159/Davey
CHAPTER 6<br />
MEASURING CHILD<br />
DISABILITY<br />
A society cannot be equitable unless all children are<br />
included, and children with disabilities cannot be<br />
included unless sound data collection and analysis<br />
render <strong>the</strong>m visible.<br />
Measuring child disability presents a unique set<br />
<strong>of</strong> challenges. Because children develop and<br />
learn to perform basic tasks at different speeds,<br />
it can be difficult to assess function and distinguish<br />
significant limitations from variations in<br />
normal development. 114 The varying nature and<br />
severity <strong>of</strong> disabilities, toge<strong>the</strong>r with <strong>the</strong> need to<br />
apply age-specific definitions and measures, fur<strong>the</strong>r<br />
complicate data collection efforts. In addition,<br />
<strong>the</strong> poor quality <strong>of</strong> data on child disability<br />
stems, in some cases, from a limited understanding<br />
<strong>of</strong> what disability is in children and, in<br />
o<strong>the</strong>r cases, from stigma or insufficient investment<br />
in improving measurement. The lack <strong>of</strong><br />
evidence that results from such difficulties hinders<br />
<strong>the</strong> development <strong>of</strong> good policies and <strong>the</strong><br />
delivery <strong>of</strong> vital services. As discussed below,<br />
however, efforts to improve data collection are<br />
under way – and <strong>the</strong> very act <strong>of</strong> ga<strong>the</strong>ring information<br />
is sparking positive change.<br />
Evolving definitions<br />
While <strong>the</strong>re is general agreement that definitions<br />
<strong>of</strong> disability should incorporate both<br />
medical and social determinants, <strong>the</strong> measurement<br />
<strong>of</strong> disability is still predominantly medical,<br />
with a focus on specific physical or<br />
mental impairments.<br />
Estimates <strong>of</strong> disability prevalence vary depending<br />
on what definition <strong>of</strong> disability is used.<br />
Narrow, medical definitions are likely to yield<br />
lower estimates than broader ones that take<br />
into account social barriers to functioning and<br />
participation. 115<br />
One framework for seeing health and disability<br />
within a broader context <strong>of</strong> social barriers is<br />
<strong>the</strong> International Classification <strong>of</strong> Functioning,<br />
Disability and Health (ICF), developed by <strong>the</strong><br />
World Health Organization. 116 This classification<br />
regards disability in two main ways: as a matter<br />
<strong>of</strong> <strong>the</strong> body’s structure and functions, and in<br />
terms <strong>of</strong> <strong>the</strong> person’s activity and participation.<br />
Disability, as defined by <strong>the</strong> ICF, is an ordinary<br />
part <strong>of</strong> human existence. ICF’s definition effectively<br />
mainstreams disability, shifting <strong>the</strong> focus<br />
from cause to effect and acknowledging that<br />
every person can experience some degree <strong>of</strong><br />
disability. The ICF definition also recognizes that<br />
functioning and disability occur in context, and<br />
<strong>the</strong>refore it is meaningful to assess not only bodily<br />
but also societal and environmental factors.<br />
While <strong>the</strong> ICF was principally designed for<br />
adult disability, a classification derived from it,<br />
<strong>the</strong> International Classification <strong>of</strong> Functioning,<br />
Disability and Health for <strong>Children</strong> and Youth<br />
(ICF-CY) takes a step towards incorporating<br />
<strong>the</strong> social dimension by capturing not only <strong>the</strong><br />
impairment but also its effect on children’s functioning<br />
and participation in <strong>the</strong>ir environment.<br />
The classification covers four main areas: body<br />
MEASURING CHILD DISABILITY<br />
63
structures (e.g., organs, limbs and structures <strong>of</strong><br />
<strong>the</strong> nervous, visual, auditory and musculoskeletal<br />
systems), body functions (physiological functions<br />
<strong>of</strong> body systems, such as listening or remembering),<br />
limitations on activity (e.g., walking, climbing,<br />
dressing) and restrictions on participation<br />
(e.g., playing with caregivers or o<strong>the</strong>r children,<br />
performing simple chores). 117<br />
Putting disability in context<br />
Data should be interpreted in context. Estimates<br />
<strong>of</strong> disability prevalence are a function <strong>of</strong> both<br />
incidence and survival, and <strong>the</strong> results should<br />
be interpreted with caution, particularly in countries<br />
where infant and child mortality rates are<br />
high. 118 A low reported prevalence <strong>of</strong> disability<br />
may be <strong>the</strong> consequence <strong>of</strong> low survival rates<br />
for young children with disabilities, or it may<br />
reflect <strong>the</strong> failure to count children with<br />
disabilities who are confined to institutions,<br />
who are hidden away by families fearful <strong>of</strong><br />
discrimination, or who live and work on<br />
<strong>the</strong> streets.<br />
Culture also plays an important role. The interpretation<br />
<strong>of</strong> what may be considered ‘normal’<br />
functioning varies across contexts and influences<br />
measurement outcomes. The attainment<br />
<strong>of</strong> certain milestones may not only vary among<br />
children, but differ also by culture. <strong>Children</strong> may<br />
be encouraged to experiment with new activities<br />
at different stages <strong>of</strong> development. For instance,<br />
in one study, 50 per cent <strong>of</strong> children were ‘able<br />
to use a cup’ at about 35 months <strong>of</strong> age in urban<br />
India, while <strong>the</strong> corresponding milestone was<br />
reached around 10 months <strong>of</strong> age in Thailand. 119<br />
It is <strong>the</strong>refore important to assess children<br />
against reference values appropriate to local<br />
circumstances and understanding.<br />
For <strong>the</strong>se reasons, assessment tools developed<br />
in high-income countries, such as <strong>the</strong> Wechsler<br />
Intelligence Scale for <strong>Children</strong> and Griffith’s<br />
Four case studies:<br />
Percentage <strong>of</strong> population<br />
reporting some form <strong>of</strong> disability<br />
6 questions asked,<br />
including:<br />
Does (name) have<br />
difficulty seeing,<br />
even if he/she is<br />
wearing glasses?<br />
uUganda<br />
One question<br />
asked:<br />
Is anyone who<br />
was in <strong>the</strong><br />
household on<br />
census night<br />
disabled?<br />
One question<br />
asked:<br />
Does (name)<br />
have any<br />
difficulty in<br />
moving, seeing,<br />
hearing,<br />
speaking or<br />
learning, which<br />
has lasted or is<br />
expected to last<br />
6 months or<br />
more?<br />
One question<br />
asked:<br />
Do you have<br />
(serious)<br />
difficulty in<br />
moving, seeing,<br />
hearing,<br />
speaking or<br />
learning which<br />
has lasted or<br />
is expected to<br />
last 6 months<br />
or more?<br />
20%<br />
7%<br />
4%<br />
1%<br />
Census<br />
1991<br />
Census<br />
2002<br />
Source: UNICEF, from surveys and censuses identified above.<br />
Uganda National<br />
Household Survey<br />
2005/2006<br />
Demographic and<br />
Health Survey<br />
(DHS) 2006<br />
64<br />
THE STATE OF THE WORLD’S CHILDREN <strong>2013</strong>: <strong>Children</strong> with Disabilities
Mental Development Scale, 120 cannot be indiscriminately<br />
applied in o<strong>the</strong>r countries or communities,<br />
as <strong>the</strong>ir capacity to detect and accurately measure<br />
disability in different sociocultural contexts<br />
is <strong>of</strong>ten untested. Frames <strong>of</strong> reference may vary,<br />
and survey tools may fail to sufficiently capture<br />
local customs, cultural understanding, languages<br />
or expressions. For example, questionnaires that<br />
evaluate child development on <strong>the</strong> basis <strong>of</strong> such<br />
‘standard’ activities as preparing breakfast cereal<br />
or playing board games may be appropriate in<br />
some places but not in those where children do<br />
not routinely engage in <strong>the</strong>se activities. 121<br />
Data collection<br />
The specific objectives <strong>of</strong> <strong>the</strong> data collection are<br />
likely to influence <strong>the</strong> definition <strong>of</strong> what constitutes<br />
‘disability’, <strong>the</strong> questions asked and <strong>the</strong><br />
resulting figures. The measurement <strong>of</strong> disability<br />
type and prevalence is frequently tied to specific<br />
political initiatives, such as social protection<br />
schemes. Results may be used to determine<br />
benefit entitlement or to plan and determine support<br />
provision. For example, <strong>the</strong> criteria used to<br />
define eligibility for a disability benefit are likely<br />
to be more restrictive than criteria for a survey<br />
conducted to identify all persons with a functional<br />
limitation, yielding dramatically different<br />
numbers. 122<br />
Many children are identified as having a disability<br />
when <strong>the</strong>y come into contact with education<br />
or health-care systems. However, in low-income<br />
countries or communities, school and clinic staff<br />
may not be able to routinely recognize or register<br />
<strong>the</strong> presence <strong>of</strong> children with disabilities. The<br />
resulting paucity <strong>of</strong> information about children<br />
with disabilities in low-income countries has contributed<br />
to a misconception that disability does<br />
not merit global priority. 123<br />
Where schooling or o<strong>the</strong>r formal services for children<br />
with disabilities are lacking, o<strong>the</strong>r methods<br />
uAustralia<br />
One question asked:<br />
Is this person<br />
handicapped by a<br />
serious long-term<br />
illness or physical<br />
or mental<br />
condition?<br />
5%<br />
12 questions<br />
asked, including:<br />
Is <strong>the</strong>re<br />
anyone in<br />
<strong>the</strong> household<br />
who has any<br />
loss <strong>of</strong> sight?<br />
Does everyone<br />
have full use <strong>of</strong><br />
<strong>the</strong>ir arms and<br />
fingers?<br />
Is anyone<br />
receiving<br />
treatment for<br />
nerves or any<br />
emotional<br />
condition?<br />
Is anyone having<br />
long-term<br />
treatment or<br />
taking any<br />
medicine or<br />
tablets for a<br />
condition or<br />
ailment?<br />
4%<br />
13 questions asked, including:<br />
Does anyone have any loss <strong>of</strong> hearing?<br />
Does anyone have any condition that makes <strong>the</strong>m<br />
slow at learning or understanding things?<br />
Does anyone have any condition that restricts <strong>the</strong>m<br />
in physical activities, or in doing physical work?<br />
Does anyone have any disfigurement or deformity?<br />
Does anyone ever need to be helped or supervised<br />
in doing things because <strong>of</strong> any mental illness?<br />
18%<br />
4 questions asked,<br />
including:<br />
Does <strong>the</strong> person ever<br />
need someone to help<br />
with, or be with <strong>the</strong>m<br />
for, self-care activities?<br />
Does <strong>the</strong> person ever<br />
need someone to help<br />
with, or be with <strong>the</strong>m<br />
for, communication<br />
activities?<br />
4%<br />
19%<br />
17 questions<br />
asked, including:<br />
Do you/does<br />
anyone in <strong>the</strong><br />
household have<br />
anything wrong<br />
with your/<strong>the</strong>ir<br />
speech?<br />
Do you/does<br />
anyone in <strong>the</strong><br />
household have<br />
shortness <strong>of</strong><br />
breath or<br />
difficulty<br />
breathing?<br />
Do you/does<br />
anyone in <strong>the</strong><br />
household have<br />
chronic or<br />
recurrent pain or<br />
discomfort?<br />
Do you/does<br />
anyone in <strong>the</strong><br />
household have<br />
a nervous or<br />
emotional<br />
condition?<br />
CONTINUED u<br />
Census<br />
1976<br />
Survey <strong>of</strong><br />
Handicapped<br />
Persons 1981<br />
Survey <strong>of</strong><br />
Disability, Ageing<br />
and Carers 1993<br />
Census<br />
2006<br />
Survey <strong>of</strong><br />
Disability, Ageing<br />
and Carers 2009<br />
MEASURING CHILD DISABILITY<br />
65
<strong>of</strong> enumeration, such as censuses, general and<br />
targeted household surveys, and interviews with<br />
key informants, have been used to estimate<br />
disability prevalence.<br />
General data collection instruments are likely to<br />
underestimate <strong>the</strong> number <strong>of</strong> children with disabilities.<br />
124 They typically employ a generic or<br />
filter question, such as whe<strong>the</strong>r anyone in <strong>the</strong><br />
household ‘is disabled’, or use <strong>the</strong> same questions<br />
for all household members regardless <strong>of</strong><br />
<strong>the</strong>ir age. <strong>Children</strong> in particular are likely to be<br />
overlooked in surveys that do not specifically ask<br />
about <strong>the</strong>m. 125<br />
Targeted household surveys that specifically<br />
address <strong>the</strong> issue <strong>of</strong> child disability or include<br />
measures specifically designed to evaluate disability<br />
in children have produced more accurate<br />
results than household surveys or censuses that<br />
ask about disability in general. 126 Such surveys<br />
tend to report higher prevalence rates because<br />
<strong>the</strong>y usually include more numerous and<br />
detailed questions.<br />
Questionnaire design<br />
Even well-designed surveys can misreport disability<br />
if a single set <strong>of</strong> questions is applied to<br />
children across <strong>the</strong> age spectrum. The choice<br />
<strong>of</strong> questions must be tailored to a child’s age in<br />
order to reflect <strong>the</strong> developmental stages and<br />
evolving capacities <strong>of</strong> children. 127 Some domains,<br />
such as self-care (e.g., washing and dressing),<br />
will not be appropriate for very young children.<br />
Given <strong>the</strong> complexity <strong>of</strong> developmental processes<br />
that take place over <strong>the</strong> first two years <strong>of</strong> life,<br />
it can be difficult to distinguish disability from<br />
variations in normal development without specialized<br />
tools or assessment. 128<br />
Questions designed to assess disability in <strong>the</strong><br />
adult population are not always applicable to<br />
children, yet many survey instruments use a<br />
FOUR CASE STUDIES (Continued)<br />
uCambodia<br />
3 questions asked:<br />
Does (name) have<br />
any disability?<br />
If yes, what type?<br />
What was <strong>the</strong><br />
cause?<br />
2 questions asked:<br />
Is <strong>the</strong>re a person<br />
who usually lives in<br />
your household<br />
who has any type<br />
<strong>of</strong> physical<br />
impairment?<br />
2 questions asked:<br />
Does (name) have<br />
any disability?<br />
What was <strong>the</strong><br />
cause?<br />
One question asked:<br />
If <strong>the</strong> person is<br />
physically/mentally<br />
disabled, give<br />
appropriate code<br />
from <strong>the</strong> list<br />
1: in seeing;<br />
2: in speech;<br />
3: in hearing;<br />
4: in movement;<br />
5: mental<br />
One question asked:<br />
Does (name) have<br />
any <strong>of</strong> <strong>the</strong> following:<br />
Difficulty seeing,<br />
difficulty hearing,<br />
difficulty speaking,<br />
difficulty moving,<br />
difficulties in feeling<br />
or sensing,<br />
psychological or<br />
behavioural<br />
difficulties, learning<br />
difficulties, fits, o<strong>the</strong>r<br />
(specify)?<br />
Impaired since<br />
birth or due to an<br />
accident?<br />
2%<br />
2%<br />
4%<br />
1%<br />
5%<br />
Socio-Economic<br />
Survey 1999<br />
Demographic and<br />
Health Survey 2000<br />
Socio-Economic<br />
Survey 2003–2004<br />
Census<br />
2008<br />
Socio-Economic<br />
Survey 2010<br />
66<br />
THE STATE OF THE WORLD’S CHILDREN <strong>2013</strong>: <strong>Children</strong> with Disabilities
single set <strong>of</strong> questions for both groups. Examples<br />
<strong>of</strong> questions with limited relevance to children<br />
include those about falling down or memory<br />
loss, as well as questions about tasks children<br />
may be too young to accomplish independently.<br />
Questions that link disability with an<br />
elderly population are not only irrelevant to child<br />
assessment but may also introduce a bias in <strong>the</strong><br />
respondent’s mind as to which should be considered<br />
disability and thus affect <strong>the</strong> nature and<br />
quality <strong>of</strong> <strong>the</strong> response. 129 In order to accurately<br />
assess disability in children, care must be taken<br />
to use questionnaires specifically designed for<br />
<strong>the</strong> purpose.<br />
Many data collection instruments, including<br />
household surveys and censuses, are based<br />
on parental responses only, with caregivers<br />
normally expected to assess and report <strong>the</strong> disability<br />
status <strong>of</strong> children under <strong>the</strong>ir care. While<br />
parents and o<strong>the</strong>r caregivers are <strong>of</strong>ten very well<br />
placed to identify difficulties that <strong>the</strong>ir children<br />
uTurkey<br />
3 questions<br />
asked:<br />
Do you have a<br />
visible physical<br />
disability, mental<br />
disorder or<br />
psychological<br />
defect?<br />
What is its<br />
nature?<br />
What was <strong>the</strong><br />
cause?<br />
1%<br />
Census<br />
1985<br />
2 questions<br />
asked:<br />
Do you have<br />
any physical<br />
or mental<br />
disability?<br />
What kind?<br />
2%<br />
Census<br />
2000<br />
12%<br />
Turkey Disability Survey<br />
2002<br />
5 questions<br />
asked,<br />
including:<br />
Do you<br />
have any<br />
disfigurement;<br />
restriction <strong>of</strong><br />
movement;<br />
bone disease;<br />
muscular<br />
weakness; lack,<br />
shortness or<br />
excess <strong>of</strong> your<br />
hands, arms,<br />
feet, legs,<br />
fingers or<br />
backbone?<br />
Are you able to<br />
speak, do you<br />
have a speech<br />
impediment,<br />
do you<br />
speak with a<br />
stammer?<br />
may experience in performing specific tasks,<br />
<strong>the</strong>ir responses alone are not sufficient to diagnose<br />
disabilities or establish a prevalence <strong>of</strong><br />
disability. Accurate assessment <strong>of</strong> disability in<br />
a child requires a thorough understanding <strong>of</strong><br />
age-appropriate behaviours. Survey respondents<br />
may have limited knowledge <strong>of</strong> specific benchmarks<br />
used for evaluating children at each stage<br />
<strong>of</strong> development and may not be in a position to<br />
adequately detect manifestations <strong>of</strong> particular<br />
types <strong>of</strong> disability. Certain temporary conditions,<br />
such as an ear infection, may cause acute difficulties<br />
in performing certain tasks and be reported<br />
as a form <strong>of</strong> disability. At <strong>the</strong> same time, parents<br />
may overlook certain signs, or hesitate to report<br />
<strong>the</strong>m, because <strong>of</strong> a lack <strong>of</strong> acceptance or stigma<br />
surrounding disability in <strong>the</strong>ir culture. The choice<br />
<strong>of</strong> terminology used in questionnaires can ei<strong>the</strong>r<br />
reinforce or correct such statistically distorting<br />
and socially discriminatory phenomena.<br />
Purpose and consequences<br />
Efforts to measure child disability represent an<br />
opportunity to link assessment with intervention<br />
strategies. Often an assessment provides<br />
<strong>the</strong> first chance for a child with a disability to be<br />
identified and referred to or receive some form<br />
<strong>of</strong> immediate care. Unfortunately, capacity and<br />
resources for follow-up assessment and support<br />
for those children who screen positive for disability<br />
are <strong>of</strong>ten scarce. 130 Recognizing <strong>the</strong> critical<br />
role <strong>of</strong> early intervention, <strong>the</strong> possibility <strong>of</strong> linking<br />
screening and assessment with simple interventions<br />
should be explored, especially in low- and<br />
middle-income settings.<br />
Data that capture <strong>the</strong> type and severity <strong>of</strong> children’s<br />
disabilities as well as <strong>the</strong> barriers to <strong>the</strong><br />
functioning and community participation <strong>of</strong> children<br />
with disabilities, when combined with relevant<br />
socio-economic indicators, help to inform<br />
decisions about how to allocate resources,<br />
eliminate barriers, design and provide services<br />
and meaningfully evaluate such interventions.<br />
For instance, data can be used to map whe<strong>the</strong>r<br />
income, gender or minority status affects access<br />
MEASURING CHILD DISABILITY<br />
67
to education, immunization or nutritional<br />
supplementation for children with disabilities.<br />
Regular monitoring makes it possible to assess<br />
whe<strong>the</strong>r initiatives designed to benefit children<br />
are meeting <strong>the</strong>ir goals.<br />
There is a clear need to harmonize child disability<br />
measurement in order to produce estimates<br />
that are reliable, valid and internationally comparable.<br />
This would facilitate appropriate policy<br />
and programmatic responses by governments<br />
and <strong>the</strong>ir international partners, and thus fulfil<br />
a requirement <strong>of</strong> <strong>the</strong> Convention on <strong>the</strong> Rights<br />
<strong>of</strong> Persons with Disabilities. However, <strong>the</strong> currently<br />
fragmented state <strong>of</strong> child disability data<br />
collection is no excuse to defer meaningful action<br />
towards inclusion. As new data and analyses<br />
emerge, <strong>the</strong>y will present opportunities to adapt<br />
existing and planned programmes for children<br />
with disabilities and <strong>the</strong>ir families.<br />
A way forward<br />
UNICEF is holding consultations to improve <strong>the</strong> methodology used to measure child disability in Multiple<br />
Indicator Cluster Surveys and o<strong>the</strong>r data collection efforts. This work is taking place in partnership with <strong>the</strong><br />
Washington Group on Disability Statistics, national statistical <strong>of</strong>fices and data collection agencies, academics,<br />
practitioners, disabled people’s organizations and o<strong>the</strong>r stakeholders. Partnership is seen as essential to achieving<br />
a reliable and globally relevant monitoring and reporting system on child disability.<br />
The Washington Group was established in 2001 under United Nations sponsorship to improve <strong>the</strong> quality and<br />
international comparability <strong>of</strong> disability measures. It has developed or endorsed questions on disability in adults<br />
that have been used by several countries in censuses and surveys and, in 2010, began work on developing a set<br />
<strong>of</strong> questions to measure functioning and disability among children and youth.<br />
Work by UNICEF and <strong>the</strong> Washington Group to develop a screening tool that reflects current thinking on<br />
child functioning and disability is based on <strong>the</strong> conceptual framework <strong>of</strong> <strong>the</strong> World Health Organization’s<br />
International Classification <strong>of</strong> Functioning, Disability and Health for <strong>Children</strong> and Youth. The screening tool<br />
under development focuses on limitations to activity and is intended to serve <strong>the</strong> purposes <strong>of</strong> any individual<br />
country in identifying those children at risk <strong>of</strong> social exclusion and reduced social participation in family life<br />
or education, for example. The collaborative effort aims to develop a survey module on child functioning and<br />
disability that would produce nationally comparable figures and promote <strong>the</strong> harmonization <strong>of</strong> data on child<br />
functioning and disability internationally. The module covers children aged 2–17 years and assesses speech and<br />
language, hearing, vision, learning (cognition and intellectual development), mobility and motor skills, emotions<br />
and behaviours. In addition to <strong>the</strong>se relatively basic types <strong>of</strong> activity, <strong>the</strong> screening tool also includes aspects <strong>of</strong><br />
children’s ability to participate in a range <strong>of</strong> activities and social interactions. Ra<strong>the</strong>r than rely on a simple yes/<br />
no approach, <strong>the</strong>se aspects are to be assessed against a rating scale, to better reflect <strong>the</strong> degree <strong>of</strong> disability.<br />
Also in development is a standardized overall methodology for a more in-depth assessment <strong>of</strong> disability in children.<br />
This will consist <strong>of</strong> data collection protocols and assessment tools, as well as a framework for <strong>the</strong> analysis<br />
<strong>of</strong> findings. Recognizing that specialists may be in short supply in some areas, a toolkit is being designed to<br />
enable teachers, community workers and o<strong>the</strong>r trained pr<strong>of</strong>essionals to administer <strong>the</strong> new methodology. This<br />
will serve to streng<strong>the</strong>n local capacity to identify and assess children with disabilities.<br />
68<br />
THE STATE OF THE WORLD’S CHILDREN <strong>2013</strong>: <strong>Children</strong> with Disabilities
FOCUS<br />
Lessons learned<br />
Since 1995, UNICEF has supported<br />
countries in tracking<br />
progress in key areas <strong>of</strong> children’s<br />
and women’s wellbeing<br />
through <strong>the</strong> Multiple<br />
Indicator Cluster Surveys<br />
(MICS). These nationally<br />
representative household<br />
surveys have been conducted<br />
in more than 100 low- and<br />
middle-income countries, and<br />
some have included a module<br />
designed to screen child disability.<br />
This information is now<br />
being built upon to design an<br />
improved measurement tool<br />
to assess child disability.<br />
Disability became part <strong>of</strong> <strong>the</strong><br />
MICS questionnaires in 2000–<br />
2001 (MICS2). Since <strong>the</strong>n, data<br />
on disability have been collected<br />
through more than 50<br />
surveys, making <strong>the</strong> MICS <strong>the</strong><br />
largest source <strong>of</strong> comparable<br />
data on child disability in lowand<br />
middle-income countries.<br />
The standard disability module<br />
included in MICS surveys<br />
conducted between 2000 and<br />
2010 is <strong>the</strong> Ten Questions<br />
Screen (TQ), which was<br />
developed as part <strong>of</strong> <strong>the</strong><br />
International Pilot Study <strong>of</strong><br />
Severe Childhood Disability in<br />
1984. Its design reflects how<br />
disability was understood and<br />
measured at <strong>the</strong> time.<br />
The TQ process starts with<br />
an interview with <strong>the</strong> primary<br />
caregivers <strong>of</strong> children aged<br />
2–9 years, who are asked to<br />
provide a personal assessment<br />
<strong>of</strong> <strong>the</strong> physical and mental<br />
development and functioning<br />
<strong>of</strong> <strong>the</strong> children under <strong>the</strong>ir care.<br />
Questions include whe<strong>the</strong>r <strong>the</strong><br />
child appears to have difficulty<br />
hearing; whe<strong>the</strong>r she or he<br />
seems to understand instructions,<br />
has fits or loses consciousness;<br />
and whe<strong>the</strong>r she<br />
or he was delayed in sitting,<br />
standing or walking compared<br />
to o<strong>the</strong>r children. Response categories<br />
do not accommodate<br />
nuances, and children are classified<br />
as screening positive or<br />
negative to each question.<br />
The validity <strong>of</strong> <strong>the</strong> Ten<br />
Questions approach has been<br />
widely tested, but results must<br />
be interpreted with caution.<br />
The TQ is a screening tool, and<br />
requires follow-up medical and<br />
developmental assessment in<br />
order to yield a reliable estimate<br />
<strong>of</strong> <strong>the</strong> number <strong>of</strong> children<br />
in a given population who have<br />
disabilities. <strong>Children</strong> who have<br />
a serious disability are very<br />
likely to screen positive, but<br />
some who screen positive may<br />
be found to have no disability<br />
on fur<strong>the</strong>r evaluation. Some<br />
children who screen positive<br />
may do so because <strong>of</strong> temporary<br />
health conditions that can<br />
be easily treated. Although <strong>the</strong><br />
TQ comes with a recommendation<br />
that it be followed by an<br />
in-depth assessment, few countries<br />
have had <strong>the</strong> budgets or<br />
capacity to conduct <strong>the</strong> secondstage<br />
clinical assessment to<br />
validate results, and <strong>the</strong>y have<br />
been fur<strong>the</strong>r hampered by <strong>the</strong><br />
lack <strong>of</strong> a standardized methodology<br />
for conducting <strong>the</strong><br />
assessment.<br />
Applying <strong>the</strong> Ten Questions<br />
Screen during <strong>the</strong> 2005–2006<br />
MICS yielded a wide range<br />
<strong>of</strong> results across participating<br />
countries: The percentage <strong>of</strong><br />
children who screened positive<br />
for disability ranged from<br />
3 per cent in Uzbekistan to 48<br />
per cent in <strong>the</strong> Central African<br />
Republic. It was not clear<br />
whe<strong>the</strong>r this variance reflected<br />
true differences among <strong>the</strong><br />
populations sampled or additional<br />
factors. For instance, <strong>the</strong><br />
low reported rate in Uzbekistan<br />
might have reflected, among<br />
o<strong>the</strong>r things, a large population<br />
<strong>of</strong> children with disabilities<br />
living in institutions, which<br />
are not subject to household<br />
surveys.<br />
MEASURING CHILD DISABILITY<br />
69
FOCUS<br />
From screening<br />
to assessment<br />
Child disability measurement<br />
experts agree that screening<br />
efforts, such as interviews<br />
using <strong>the</strong> Ten Questions Screen<br />
(TQ), need to be followed by<br />
in-depth assessments. These<br />
allow <strong>the</strong> initial screening<br />
results to be validated, and<br />
make possible a better understanding<br />
<strong>of</strong> <strong>the</strong> extent and<br />
nature <strong>of</strong> child disability in a<br />
country. Cambodia, Bhutan and<br />
<strong>the</strong> former Yugoslav Republic<br />
<strong>of</strong> Macedonia are three countries<br />
to have undertaken such<br />
assessments. Their experiences<br />
provide important lessons for<br />
<strong>the</strong> measurement <strong>of</strong> child disability<br />
and adaptation <strong>of</strong> methodology<br />
to local context. They<br />
also testify to <strong>the</strong> transformative<br />
power <strong>of</strong> data collection.<br />
In Cambodia, all children<br />
who screened positive under<br />
<strong>the</strong> Ten Questions and a randomly<br />
selected 10 per cent<br />
who screened negative were<br />
referred for fur<strong>the</strong>r assessment<br />
by a multi-pr<strong>of</strong>essional<br />
team consisting <strong>of</strong> doctors,<br />
hearing and vision specialists,<br />
and psychologists. The team<br />
was trained and dispatched<br />
around <strong>the</strong> country to conduct<br />
child disability assessments in<br />
local health centres and similar<br />
facilities. The decision to use<br />
a mobile team <strong>of</strong> specialists<br />
was made to ensure consistent<br />
quality <strong>of</strong> screening across <strong>the</strong><br />
country and to minimize <strong>the</strong><br />
lag between screening and<br />
assessment.<br />
The same sampling approach<br />
was employed in Bhutan,<br />
where <strong>the</strong> screening stage<br />
identified 3,500 children at risk,<br />
out <strong>of</strong> a sample <strong>of</strong> 11,370 children.<br />
A core team <strong>of</strong> seven pr<strong>of</strong>essionals<br />
received two weeks<br />
<strong>of</strong> training in how to conduct<br />
<strong>the</strong> assessment. In turn, <strong>the</strong>y<br />
were responsible for training<br />
ano<strong>the</strong>r 120 health and education<br />
pr<strong>of</strong>essionals. These pr<strong>of</strong>essionals<br />
were <strong>the</strong>n split into<br />
two groups. The first consisted<br />
<strong>of</strong> 30 supervisors recruited<br />
from among general-practice<br />
physicians, paediatricians, eye<br />
specialists, physio<strong>the</strong>rapists<br />
and special educators. The second<br />
group <strong>of</strong> 90 field surveyors<br />
and assessors was made<br />
up largely <strong>of</strong> primary school<br />
teachers and health workers.<br />
The methodology used in <strong>the</strong><br />
former Yugoslav Republic <strong>of</strong><br />
Macedonia was derived from<br />
that used in Cambodia, with<br />
some adaptations shaped by<br />
<strong>the</strong> technical expertise and<br />
tools available in <strong>the</strong> local<br />
context. Two studies were<br />
conducted: a national study<br />
and one focusing on <strong>the</strong> Roma<br />
population. The assessment<br />
consisted <strong>of</strong> one hour with a<br />
physician and psychologist and<br />
a 10–15 minute assessment<br />
with an ophthalmologist and<br />
audiologist.<br />
Experiences in all three<br />
countries demonstrate <strong>the</strong><br />
importance <strong>of</strong> partnerships in<br />
mobilizing limited resources<br />
and ensuring high response<br />
rates, which in turn provide for<br />
robust findings. These partnerships<br />
involved government<br />
agencies and <strong>the</strong>ir international<br />
partners, disabled people’s<br />
organizations and o<strong>the</strong>r civil<br />
society organizations. In <strong>the</strong><br />
former Yugoslav Republic<br />
<strong>of</strong> Macedonia, for example,<br />
partners made it possible<br />
to conduct assessments in<br />
local kindergartens during<br />
70<br />
THE STATE OF THE WORLD’S CHILDREN <strong>2013</strong>: <strong>Children</strong> with Disabilities
A strategy for intervention on behalf <strong>of</strong> children identified as<br />
having a disability should be incorporated in <strong>the</strong> assessment<br />
from <strong>the</strong> earliest stages <strong>of</strong> planning.<br />
weekends, which was convenient<br />
for children and <strong>the</strong>ir<br />
families.<br />
It is also important to adapt<br />
<strong>the</strong> composition <strong>of</strong> <strong>the</strong> core<br />
assessment team and <strong>the</strong> type<br />
<strong>of</strong> tools used to local capacity.<br />
At <strong>the</strong> time <strong>of</strong> <strong>the</strong> study, both<br />
Cambodia and Bhutan faced a<br />
shortage <strong>of</strong> qualified assessors.<br />
In Cambodia this was overcome<br />
by employing a mobile assessment<br />
team, while in Bhutan<br />
emphasis was put on training<br />
mid-level pr<strong>of</strong>essionals. The<br />
availability <strong>of</strong> specialists cannot<br />
be taken for granted – in<br />
<strong>the</strong> case <strong>of</strong> Cambodia, <strong>the</strong> lead<br />
hearing specialist was brought<br />
in from abroad.<br />
Assessment tools – questionnaires<br />
and tests – should be<br />
locally validated and culturally<br />
appropriate. Careful attention<br />
must be paid to language. One<br />
<strong>of</strong> <strong>the</strong> challenges encountered<br />
in Cambodia pertained to<br />
translating assessment instruments<br />
from English to Khmer,<br />
and especially finding linguistic<br />
equivalents for <strong>the</strong> concepts<br />
<strong>of</strong> impairment and disability.<br />
The diagnostic assessment<br />
form used in <strong>the</strong> Cambodian<br />
study was revised to suit <strong>the</strong><br />
former Yugoslav Republic<br />
<strong>of</strong> Macedonia and <strong>the</strong> local<br />
Chuturich test was utilized for<br />
<strong>the</strong> psychological component<br />
<strong>of</strong> <strong>the</strong> assessment.<br />
Assessment leads<br />
to action<br />
With assessment comes <strong>the</strong><br />
potential for immediate intervention.<br />
In Cambodia, some<br />
children who screened positive<br />
for hearing impairment were<br />
found to have an ear infection<br />
or a build-up <strong>of</strong> ear wax.<br />
This limited <strong>the</strong>ir hearing and<br />
in many cases also <strong>the</strong>ir participation<br />
in school, but, once<br />
identified, <strong>the</strong>ir conditions were<br />
easily treated and more serious<br />
secondary infections and<br />
longer-term impairments were<br />
thus prevented.<br />
Assessment can also aid<br />
awareness raising and spark<br />
change even while <strong>the</strong> processes<br />
<strong>of</strong> collecting and analysing<br />
data are still under way. When<br />
clinical assessments in Bhutan<br />
showed a higher incidence<br />
<strong>of</strong> mild cognitive disabilities<br />
among children from poorer<br />
households and those whose<br />
mo<strong>the</strong>rs had less education,<br />
<strong>the</strong> government decided to<br />
focus on early childhood development<br />
and childcare services<br />
in rural areas, where income<br />
and education levels are lower.<br />
And in <strong>the</strong> former Yugoslav<br />
Republic <strong>of</strong> Macedonia, findings<br />
that revealed unequal<br />
access to education have<br />
spurred plans to improve<br />
school participation and fight<br />
discrimination against children<br />
with disabilities.<br />
A strategy for intervention on<br />
behalf <strong>of</strong> children identified as<br />
having a disability should be<br />
incorporated in <strong>the</strong> assessment<br />
from <strong>the</strong> earliest stages <strong>of</strong> planning.<br />
Such a strategy should<br />
include a mapping <strong>of</strong> <strong>the</strong> available<br />
services, <strong>the</strong> development<br />
<strong>of</strong> referral protocols and <strong>the</strong><br />
preparation <strong>of</strong> informative<br />
materials for families on how<br />
to adjust children’s surroundings<br />
to enhance functioning<br />
and participation in home and<br />
community life.<br />
MEASURING CHILD DISABILITY<br />
71
PERSPECTIVE<br />
From invisibility to inclusion for<br />
indigenous children with disabilities<br />
By Olga Montufar Contreras<br />
Olga Montufar Contreras is <strong>the</strong><br />
president <strong>of</strong> <strong>the</strong> Step by Step<br />
Foundation, a multicultural<br />
organization that promotes<br />
<strong>the</strong> social mainstreaming <strong>of</strong><br />
indigenous people with disabilities<br />
in Mexico. The daughter <strong>of</strong> a<br />
deaf woman, she was trained as<br />
an engineer and has a Master’s<br />
degree in development and<br />
social policy.<br />
Indigenous people have long<br />
had to live with extreme<br />
poverty, discrimination and<br />
exclusion from society and<br />
social services. Within our<br />
communities, girls and boys<br />
with disabilities are <strong>the</strong> most<br />
vulnerable and fare <strong>the</strong> worst.<br />
Their marginalization persists<br />
even though three international<br />
human rights instruments – <strong>the</strong><br />
Convention on <strong>the</strong> Rights <strong>of</strong><br />
Persons with Disabilities, <strong>the</strong><br />
United Nations Declaration<br />
on <strong>the</strong> Rights <strong>of</strong> Indigenous<br />
Peoples and <strong>the</strong> Convention on<br />
<strong>the</strong> Rights <strong>of</strong> <strong>the</strong> Child – afford<br />
us a historic opportunity to<br />
address <strong>the</strong> challenges faced<br />
by indigenous children with<br />
disabilities.<br />
I grew up with physical disability,<br />
brought on by poliomyelitis,<br />
in an indigenous community<br />
and I have seen that despite <strong>the</strong><br />
passing <strong>of</strong> <strong>the</strong> years, <strong>the</strong> situation<br />
has changed little – if at all.<br />
Today, just as when I was little,<br />
children with disabilities are<br />
ostracized and <strong>the</strong>ir rejection<br />
by <strong>the</strong> community extends to<br />
parents and siblings, because<br />
<strong>the</strong> disability is considered as<br />
divine punishment and a child<br />
with a disability is seen as a<br />
liability for <strong>the</strong> community.<br />
Now as <strong>the</strong>n, it is extremely<br />
difficult to access services and<br />
meet <strong>the</strong> additional expenses<br />
generated by a family member<br />
with a disability. Grinding poverty,<br />
geographic isolation and<br />
political marginalization sustain<br />
and are reinforced by discrimination<br />
and prejudice. The consequences<br />
can be severe: Many<br />
mo<strong>the</strong>rs, weak and lacking <strong>the</strong><br />
power to change things, remain<br />
silent about our condition or<br />
resort to infanticide.<br />
My family is one <strong>of</strong> few that<br />
show solidarity towards <strong>the</strong>ir<br />
sons and daughters who have<br />
disabilities. In our case, this<br />
was partly because we had<br />
migrated to <strong>the</strong> city and could<br />
obtain housing closer to services.<br />
But in <strong>the</strong> desperate circumstances<br />
under which most<br />
<strong>of</strong> our families live, violations<br />
<strong>of</strong> our human rights are common<br />
and fail to spark concern<br />
among o<strong>the</strong>rs. This is why it<br />
is necessary to mobilize <strong>the</strong><br />
will and resources to take<br />
meaningful action.<br />
One <strong>of</strong> <strong>the</strong> most pressing<br />
problems to be addressed is<br />
<strong>the</strong> lack <strong>of</strong> data on indigenous<br />
communities in general and<br />
our children with disabilities in<br />
particular. Data can be<br />
hard to ga<strong>the</strong>r: Indigenous<br />
72<br />
THE STATE OF THE WORLD’S CHILDREN <strong>2013</strong>: <strong>Children</strong> with Disabilities
Data can be hard to ga<strong>the</strong>r: Indigenous households can be<br />
scattered, <strong>of</strong>ten in remote areas. There might not be enough<br />
interviewers who speak indigenous languages.<br />
households can be scattered,<br />
<strong>of</strong>ten in remote areas. There<br />
might not be enough interviewers<br />
who speak indigenous languages.<br />
In many cases, families<br />
deny our existence to <strong>the</strong> people<br />
who conduct surveys. Even<br />
where parents acknowledge<br />
and want to support us, <strong>the</strong>y<br />
can end up providing insufficient<br />
information because <strong>the</strong>y<br />
have little <strong>of</strong> it to begin with, as<br />
<strong>the</strong>re are few if any screening<br />
or diagnostic services. Because<br />
<strong>the</strong> lack <strong>of</strong> such services contributes<br />
to our invisibility, it is<br />
a threat to our physical and<br />
intellectual condition. Adding<br />
to <strong>the</strong> problems, girls and boys<br />
with disabilities <strong>of</strong>ten go unregistered<br />
at birth, and this is one<br />
<strong>of</strong> <strong>the</strong> main obstacles to <strong>the</strong><br />
recognition <strong>of</strong> our citizenship<br />
and our right to public services.<br />
This should motivate research<br />
into disability among indigenous<br />
populations – and <strong>the</strong><br />
results can serve as a starting<br />
point for developing public policies<br />
and services that address<br />
our needs and guarantee our<br />
rights.<br />
The lack <strong>of</strong> access to <strong>the</strong> mainstream<br />
education system must<br />
also be corrected. The inclusion<br />
<strong>of</strong> indigenous children with disabilities<br />
is required under <strong>the</strong><br />
Convention on <strong>the</strong> Rights <strong>of</strong><br />
Persons with Disabilities, but<br />
in practice, inclusion is <strong>of</strong>ten<br />
beyond <strong>the</strong> reach <strong>of</strong> children<br />
from our communities: The<br />
distances <strong>the</strong>y must travel daily<br />
to get to school can be prohibitive.<br />
Few schools have <strong>the</strong><br />
minimum services and facilities<br />
to make learning accessible.<br />
And again, traditional community<br />
practices contribute to <strong>the</strong><br />
lack <strong>of</strong> educational inclusion.<br />
Clan chiefs determine <strong>the</strong> roles<br />
<strong>of</strong> boys and girls from birth and<br />
if a child has a disability, it is<br />
generally thought that sending<br />
her or him to school is a waste<br />
<strong>of</strong> time as well as an undue<br />
economic burden on <strong>the</strong> family.<br />
Many people think that those<br />
<strong>of</strong> us who have a disability are<br />
broken objects that will not be<br />
useful even if we are patched<br />
up. The situation is even worse<br />
for girls, as it is harder for us to<br />
obtain permission to study than<br />
it is for boys with disabilities.<br />
Even when <strong>the</strong> community’s<br />
stigmas are overcome and we<br />
manage to attend school, our<br />
teachers face two obstacles:<br />
insufficient knowledge <strong>of</strong><br />
indigenous languages and<br />
inadequate teacher training in<br />
inclusive education. This lack <strong>of</strong><br />
training makes it more difficult<br />
to include children with disabilities.<br />
As a consequence, we are<br />
forced to rely on <strong>the</strong> goodwill<br />
<strong>of</strong> individual teachers to accept<br />
<strong>the</strong> challenge <strong>of</strong> including<br />
indigenous children with disabilities<br />
in <strong>the</strong>ir classrooms.<br />
In Mexico as elsewhere, governments,<br />
international agencies<br />
and community groups are<br />
striving to eliminate <strong>the</strong> gap<br />
between what is ideal and what<br />
is currently possible. We must<br />
continue to work toge<strong>the</strong>r to<br />
ensure more just and equitable<br />
childhoods, to transform <strong>the</strong><br />
lives <strong>of</strong> indigenous girls and<br />
boys with disabilities with hope<br />
and opportunity – so <strong>the</strong>y, too,<br />
can be free to let <strong>the</strong>ir dreams<br />
take flight.<br />
MEASURING CHILD DISABILITY<br />
73
Nguyen, who has autism, attends a class specifically tailored to his needs at <strong>the</strong> Da Nang Inclusive Education Resource Centre in Viet Nam.<br />
Such centres were set up to help children prepare for admission to inclusive mainstream schools. © UNICEF/Viet Nam/2012/Bisin
CHAPTER 7<br />
AN AGENDA<br />
FOR ACTION<br />
The nations <strong>of</strong> <strong>the</strong> world have repeatedly affirmed <strong>the</strong>ir<br />
commitment to building more inclusive societies. As a result,<br />
<strong>the</strong> situation <strong>of</strong> many children with disabilities and <strong>the</strong>ir<br />
families has improved.<br />
Progress has varied between and within countries,<br />
however. Too many children with disabilities<br />
continue to face barriers to <strong>the</strong>ir participation<br />
in <strong>the</strong> civic, social and cultural affairs <strong>of</strong> <strong>the</strong>ir<br />
communities. This is true in situations that may<br />
be considered normal as well as during humanitarian<br />
crises. The following recommendations<br />
apply equally urgently in humanitarian situations,<br />
and <strong>the</strong>ir application in that context is detailed<br />
in Chapter 5. Realizing <strong>the</strong> promise <strong>of</strong> equity<br />
through inclusion will require action in <strong>the</strong><br />
areas and by <strong>the</strong> actors identified below and<br />
throughout this report.<br />
Ratify and implement <strong>the</strong><br />
Conventions<br />
The Convention on <strong>the</strong> Rights <strong>of</strong> Persons with<br />
Disabilities (CRPD) and <strong>the</strong> Convention on <strong>the</strong><br />
Rights <strong>of</strong> <strong>the</strong> Child (CRC) provide detailed guidance<br />
for <strong>the</strong> development <strong>of</strong> inclusive societies. As<br />
this year began, 127 countries and <strong>the</strong> European<br />
Union had ratified <strong>the</strong> CRPD and 193 had ratified<br />
<strong>the</strong> CRC. They have thus shown a commitment to<br />
all <strong>the</strong>ir citizens. O<strong>the</strong>rs have yet to join <strong>the</strong> global<br />
movement that <strong>the</strong>se countries represent.<br />
Ratification alone will not be enough. The process<br />
<strong>of</strong> honouring commitments in practice will<br />
require effort on <strong>the</strong> part <strong>of</strong> national governments,<br />
local authorities, employers, disabled people’s<br />
organizations and parents’ associations. In<br />
addition, international organizations and donors<br />
can align <strong>the</strong>ir assistance with <strong>the</strong>se international<br />
instruments. Making good on <strong>the</strong> promises <strong>of</strong><br />
<strong>the</strong> Conventions will require not only diligent<br />
enforcement but also rigorous monitoring and an<br />
unflagging commitment by all to accountability<br />
and adaptation.<br />
Fight discrimination<br />
Discrimination lies at <strong>the</strong> root <strong>of</strong> many <strong>of</strong> <strong>the</strong><br />
challenges confronted by children with disabilities<br />
and <strong>the</strong>ir families. The principles <strong>of</strong> equal<br />
rights and non-discrimination should be reflected<br />
in law and policy and need to be complemented<br />
by efforts to enhance awareness <strong>of</strong> disability<br />
among <strong>the</strong> general public, starting with those<br />
who provide essential services for children in<br />
such fields as health, education and protection.<br />
To this end, international agencies and <strong>the</strong>ir government<br />
and community partners can increase<br />
efforts to provide <strong>of</strong>ficials and public servants at<br />
all levels <strong>of</strong> seniority with a deeper understanding<br />
<strong>of</strong> <strong>the</strong> rights, capacities and challenges <strong>of</strong><br />
children with disabilities so that policymakers<br />
and service providers are able to prevail against<br />
prejudice – be it society’s or <strong>the</strong>ir own.<br />
When communities are accepting <strong>of</strong> disability as<br />
part <strong>of</strong> human diversity, when generic systems<br />
like education and recreation are available and<br />
inclusive, and when parents are not forced to<br />
AN AGENDA FOR ACTION<br />
75
carry <strong>the</strong> entire additional costs associated with<br />
disability, <strong>the</strong> families <strong>of</strong> children with disabilities<br />
can cope and thrive much like o<strong>the</strong>r families.<br />
Parents’ organizations can play a pivotal role and<br />
should be reinforced so that children with disabilities<br />
are valued, cherished and supported by<br />
<strong>the</strong>ir families and communities.<br />
<strong>State</strong>s parties to <strong>the</strong> CRPD and <strong>the</strong> United<br />
Nations and its agencies have committed <strong>the</strong>mselves<br />
to conducting awareness-raising campaigns<br />
to change attitudes towards children<br />
with disabilities and <strong>the</strong>ir families. Among o<strong>the</strong>r<br />
things, this will involve highlighting <strong>the</strong>ir abilities<br />
and capacities, and promoting community<br />
engagement with and by children with disabilities.<br />
<strong>State</strong>s parties are also required to provide<br />
information to families on how to avoid, recognize<br />
and report instances <strong>of</strong> exploitation, violence<br />
and abuse.<br />
Discrimination on <strong>the</strong> grounds <strong>of</strong> disability is<br />
a form <strong>of</strong> oppression. The establishment <strong>of</strong><br />
a clear, legal entitlement to protection from<br />
Convention on <strong>the</strong> Rights <strong>of</strong> Persons with Disabilities and<br />
Optional Protocol: Signatures and ratifications<br />
155<br />
128<br />
91<br />
76<br />
27<br />
COUNTRIES HAVE<br />
SIGNED THE<br />
CONVENTION*<br />
COUNTRIES HAVE<br />
RATIFIED THE<br />
CONVENTION*<br />
COUNTRIES HAVE<br />
SIGNED THE<br />
PROTOCOL<br />
COUNTRIES HAVE<br />
RATIFIED THE<br />
PROTOCOL<br />
COUNTRIES HAVE<br />
NOT SIGNED<br />
Afghanistan<br />
Bolivia (Plurinational <strong>State</strong> <strong>of</strong>)<br />
Costa Rica<br />
Ethiopia<br />
Albania<br />
Bosnia and Herzegovina<br />
Côte d’Ivoire<br />
Fiji<br />
Algeria<br />
Botswana<br />
Croatia<br />
Finland<br />
Andorra<br />
Brazil<br />
Cuba<br />
France<br />
Angola<br />
Brunei Darussalam<br />
Cyprus<br />
Gabon<br />
Antigua and Barbuda<br />
Bulgaria<br />
Czech Republic<br />
Gambia<br />
Argentina<br />
Burkina Faso<br />
Democratic People’s<br />
Georgia<br />
Armenia<br />
Burundi<br />
Republic <strong>of</strong> Korea<br />
Germany<br />
Australia<br />
Cambodia<br />
Democratic Republic<br />
Ghana<br />
Austria<br />
Cameroon<br />
<strong>of</strong> <strong>the</strong> Congo<br />
Greece<br />
Azerbaijan<br />
Canada<br />
Denmark<br />
Grenada<br />
Bahamas<br />
Cape Verde<br />
Djibouti<br />
Guatemala<br />
Bahrain<br />
Central African Republic<br />
Dominica<br />
Guinea<br />
Bangladesh<br />
Chad<br />
Dominican Republic<br />
Guinea-Bissau<br />
Barbados<br />
Chile<br />
Ecuador<br />
Guyana<br />
Belarus<br />
China<br />
Egypt<br />
Haiti<br />
Belgium<br />
Colombia<br />
El Salvador<br />
Honduras<br />
Belize<br />
Comoros<br />
Equatorial Guinea<br />
Hungary<br />
Benin<br />
Congo<br />
Eritrea<br />
Iceland<br />
Bhutan<br />
Cook Islands<br />
Estonia<br />
India<br />
*Includes <strong>the</strong> European Union.<br />
Source: UN Enable; United Nations Treaty Collection. For notes on terms used, see p.154.<br />
76<br />
THE STATE OF THE WORLD’S CHILDREN <strong>2013</strong>: <strong>Children</strong> with Disabilities
discrimination is vital in reducing <strong>the</strong> vulnerability<br />
<strong>of</strong> children with disabilities. Legislation is made<br />
more meaningful when children with disabilities<br />
are informed <strong>of</strong> <strong>the</strong>ir right to protection from discrimination<br />
and are shown how to exercise this<br />
right. Where legislation banning discrimination<br />
on <strong>the</strong> basis <strong>of</strong> disability does not exist, disabled<br />
people’s organizations and civil society as a<br />
whole will continue to have a crucial role to play<br />
in pressing for such laws – as <strong>the</strong>y do in providing<br />
services and promoting transparency<br />
and accountability.<br />
Dismantle barriers to inclusion<br />
All children’s environments – early childhood<br />
centres, schools, health facilities, public transport,<br />
playgrounds and so on – can be built to<br />
facilitate access and encourage <strong>the</strong> participation<br />
<strong>of</strong> children with disabilities alongside <strong>the</strong>ir peers.<br />
Universal design – <strong>the</strong> idea that all products, built<br />
environments, programmes and services should<br />
be usable to <strong>the</strong> greatest extent possible by all<br />
people, regardless <strong>of</strong> <strong>the</strong>ir ability, age or social<br />
status – should be applied in <strong>the</strong> construction <strong>of</strong><br />
(continued on p. 80)<br />
Signed Convention Ratified Convention Signed Protocol Ratified Protocol Not signed<br />
Indonesia<br />
Mauritius<br />
Romania<br />
The former Yugoslav Republic<br />
Iran (Islamic Republic <strong>of</strong>)<br />
Mexico<br />
Russian Federation<br />
<strong>of</strong> Macedonia<br />
Iraq<br />
Micronesia (Federated <strong>State</strong>s <strong>of</strong>)<br />
Rwanda<br />
Timor-Leste<br />
Ireland<br />
Monaco<br />
Saint Kitts and Nevis<br />
Togo<br />
Israel<br />
Mongolia<br />
Saint Lucia<br />
Tonga<br />
Italy<br />
Montenegro<br />
Saint Vincent and <strong>the</strong><br />
Trinidad and Tobago<br />
Jamaica<br />
Morocco<br />
Grenadines<br />
Tunisia<br />
Japan<br />
Mozambique<br />
Samoa<br />
Turkey<br />
Jordan<br />
Myanmar<br />
San Marino<br />
Turkmenistan<br />
Kazakhstan<br />
Namibia<br />
Sao Tome and Principe<br />
Tuvalu<br />
Kenya<br />
Nauru<br />
Saudi Arabia<br />
Uganda<br />
Kiribati<br />
Nepal<br />
Senegal<br />
Ukraine<br />
Kuwait<br />
Ne<strong>the</strong>rlands<br />
Serbia<br />
United Arab Emirates<br />
Kyrgyzstan<br />
New Zealand<br />
Seychelles<br />
United Kingdom<br />
Lao People’s<br />
Nicaragua<br />
Sierra Leone<br />
United Republic <strong>of</strong> Tanzania<br />
Democratic Republic<br />
Niger<br />
Singapore<br />
United <strong>State</strong>s<br />
Latvia<br />
Nigeria<br />
Slovakia<br />
Uruguay<br />
Lebanon<br />
Niue<br />
Slovenia<br />
Uzbekistan<br />
Lesotho<br />
Norway<br />
Solomon Islands<br />
Vanuatu<br />
Liberia<br />
Oman<br />
Somalia<br />
Venezuela (Bolivarian<br />
Libya<br />
Pakistan<br />
South Africa<br />
Republic <strong>of</strong>)<br />
Liechtenstein<br />
Palau<br />
South Sudanδ<br />
Viet Nam<br />
Lithuania<br />
Panama<br />
Spain<br />
Yemen<br />
Luxembourg<br />
Papua New Guinea<br />
Sri Lanka<br />
Zambia<br />
Madagascar<br />
Paraguay<br />
Sudanδ<br />
Zimbabwe<br />
Malawi<br />
Peru<br />
Suriname<br />
Malaysia<br />
Philippines<br />
Swaziland<br />
Maldives<br />
Poland<br />
Sweden<br />
Mali<br />
Portugal<br />
Switzerland<br />
Malta<br />
Qatar<br />
Syrian Arab Republic<br />
Marshall Islands<br />
Republic <strong>of</strong> Korea<br />
Tajikistan<br />
Mauritania<br />
Republic <strong>of</strong> Moldova<br />
Thailand<br />
AN AGENDA FOR ACTION<br />
77
PERSPECTIVE<br />
Open <strong>the</strong> doors to<br />
education – and employment<br />
By Ivory Duncan<br />
Born in 1991, Ivory Duncan<br />
is pursuing a degree in<br />
Communications Studies from<br />
<strong>the</strong> University <strong>of</strong> Guyana. She<br />
advocates for <strong>the</strong> rights <strong>of</strong> youth<br />
with disabilities through <strong>the</strong><br />
Leonard Cheshire Disability Young<br />
Voices network and volunteers<br />
at <strong>the</strong> National Commission on<br />
Disability in Guyana.<br />
Like me, countless o<strong>the</strong>r young<br />
people with disabilities are<br />
striving towards a future that<br />
cannot be taken for granted.<br />
Will we overcome <strong>the</strong> physical<br />
and financial barriers to<br />
higher education? If we make<br />
it through to graduation from<br />
university or vocational school,<br />
what jobs await us? Will we<br />
have equal opportunity, or face<br />
discrimination? Will we get<br />
<strong>the</strong> chance to prove ourselves<br />
in <strong>the</strong> competitive world <strong>of</strong><br />
employment? And if not, how<br />
are we to be full citizens and<br />
producers, members <strong>of</strong> society<br />
in equal standing with those<br />
who do not have disabilities?<br />
I lost my right leg following a<br />
traffic accident when I was 15<br />
years old. My parents, people<br />
<strong>of</strong> humble means, persevere in<br />
helping to meet my expenses<br />
so I can pursue a university<br />
education, even as <strong>the</strong>y try to<br />
raise two o<strong>the</strong>r children with<br />
disabilities. Life can be hard,<br />
but I am grateful for my good<br />
fortune: I have a loving family<br />
and am working to accomplish<br />
my dream <strong>of</strong> getting a degree<br />
and having a career.<br />
Fulfilling our dreams takes<br />
effort not required <strong>of</strong> young<br />
people without disabilities. To<br />
get from home to <strong>the</strong> university,<br />
I have no option but to go<br />
by taxi because <strong>the</strong> only o<strong>the</strong>r<br />
way would be to take a boat or<br />
cross <strong>the</strong> Demerara Harbour<br />
Bridge, nei<strong>the</strong>r <strong>of</strong> which I can<br />
do in my wheelchair. Paying<br />
for a taxi is expensive, and my<br />
parents struggle to make ends<br />
meet. Attending university<br />
is also a physical challenge.<br />
It is difficult making my way<br />
to classes because <strong>the</strong> classrooms<br />
are <strong>of</strong>ten not accessible<br />
to wheelchair users. There are<br />
long flights <strong>of</strong> stairs, and when<br />
I finally manage to get to a<br />
class, I am tired and frustrated<br />
and find it hard to focus on<br />
<strong>the</strong> lectures. But I am trying<br />
because I know it is better to<br />
try and fail than to fail to try.<br />
The challenges begin long<br />
before reaching higher education.<br />
<strong>Children</strong> with disabilities<br />
can easily become shut-ins,<br />
hidden away from society and<br />
unable to attend school or<br />
make a meaningful contribution<br />
to society. They should be<br />
encouraged to attend mainstream<br />
schools if possible,<br />
while special schools that<br />
include vocational training<br />
and support services should<br />
also be available. Specialneeds<br />
schools should <strong>of</strong>fer a<br />
78<br />
THE STATE OF THE WORLD’S CHILDREN <strong>2013</strong>: <strong>Children</strong> with Disabilities
I would like to be confident that when I graduate and look for a<br />
job, I will not be discriminated against because <strong>of</strong> my disability,<br />
but instead be recognized for my abilities, qualifications and<br />
potential.<br />
complete curriculum for students<br />
with disabilities, to help<br />
to develop <strong>the</strong>ir minds and give<br />
<strong>the</strong>m opportunities to achieve<br />
academic excellence. Many<br />
children and young people with<br />
disabilities want to go on to<br />
higher education, so it is very<br />
important that <strong>the</strong>y be included<br />
in schools and o<strong>the</strong>r learning<br />
institutions and given <strong>the</strong> same<br />
options as o<strong>the</strong>r students in<br />
terms <strong>of</strong> choosing courses and<br />
activities. It is up to educational<br />
institutions and governments<br />
to accommodate and support<br />
students like me, so that we are<br />
able to pursue <strong>the</strong> education<br />
we need to achieve whatever<br />
goals we may have.<br />
Accommodating children and<br />
young people with disabilities<br />
includes things like adjusting<br />
<strong>the</strong> entry requirements and<br />
criteria for passing, and making<br />
sure that learning materials,<br />
examinations and class<br />
schedules take our needs into<br />
account. Teachers need to be<br />
properly trained and given a<br />
chance to pursue additional<br />
overseas instruction in order<br />
to improve <strong>the</strong> quality <strong>of</strong> education.<br />
Schools should teach<br />
Braille and o<strong>the</strong>r forms <strong>of</strong> communication<br />
where necessary,<br />
and <strong>the</strong>re is also a great need<br />
for special equipment, which<br />
many schools in Guyana do<br />
not have. Making educational<br />
institutions disability-friendly<br />
also means setting up facilities<br />
and transportation services that<br />
persons with disabilities can<br />
use; <strong>the</strong>re should be ramps for<br />
wheelchair users, accessible<br />
toilets and elevators for people<br />
who cannot take <strong>the</strong> stairs. All<br />
aspects and all levels <strong>of</strong> education,<br />
from elementary school<br />
to university, need to be made<br />
accessible.<br />
The ministries for education<br />
and public service should also<br />
work toge<strong>the</strong>r to assist academically<br />
inclined students<br />
with disabilities who wish to<br />
go beyond secondary school.<br />
Because financial difficulties<br />
are a major reason why young<br />
people with disabilities are<br />
unable to continue <strong>the</strong>ir education,<br />
this assistance should<br />
include grants, loans and<br />
scholarships.<br />
Governments also need to<br />
make sure that education<br />
opens <strong>the</strong> same doors for students<br />
with disabilities as for<br />
everybody else. My parents<br />
have put in a lot <strong>of</strong> effort and<br />
more money than <strong>the</strong>y can<br />
really afford to help me to get<br />
through school and to university<br />
– and now I am working<br />
hard, in spite <strong>of</strong> <strong>the</strong> challenges,<br />
to come to classes and learn,<br />
because I know that is what I<br />
need to do to get <strong>the</strong> best out<br />
<strong>of</strong> life. So I would also like to<br />
be confident that when I graduate<br />
and look for a job, I will<br />
not be discriminated against<br />
because <strong>of</strong> my disability, but<br />
instead be recognized for my<br />
abilities, qualifications and<br />
potential. As a young person<br />
with a disability who has<br />
worked hard to educate herself,<br />
I deserve as much as anyone<br />
else <strong>the</strong> opportunity to fulfill<br />
my dreams, make a good living<br />
for myself and contribute<br />
to our society.<br />
AN AGENDA FOR ACTION<br />
79
(continued from p. 77)<br />
public and private infrastructure. When children<br />
interact and understand each o<strong>the</strong>r across levels<br />
<strong>of</strong> ability, <strong>the</strong>y all benefit.<br />
The principles <strong>of</strong> universal design also apply to<br />
<strong>the</strong> development <strong>of</strong> inclusive school curricula and<br />
vocational training programmes as well as child<br />
protection laws, policies and services. <strong>Children</strong><br />
need access to systems designed to equip <strong>the</strong>m<br />
with <strong>the</strong> educational and life skills to see <strong>the</strong>m<br />
into and through <strong>the</strong>ir adult years, and those that<br />
protect <strong>the</strong>m from neglect, abuse and violence<br />
on <strong>the</strong>ir way to adulthood. If protection fails, <strong>the</strong>y<br />
need to be able to make complaints and seek justice.<br />
Governments have <strong>the</strong> decisive role to play<br />
in introducing and implementing <strong>the</strong> legislative,<br />
administrative and educational measures necessary<br />
to protect children with disabilities from all<br />
forms <strong>of</strong> exploitation, violence and abuse in all<br />
settings. It is not appropriate to create separate<br />
systems for children with disabilities – <strong>the</strong> goal<br />
must be inclusive, high-quality child protection<br />
mechanisms suitable for and accessible<br />
to all children. One such mechanism is birth<br />
registration. Although not a guarantee in itself,<br />
it is an essential element <strong>of</strong> protection. Efforts to<br />
register children with disabilities – and <strong>the</strong>reby<br />
render <strong>the</strong>m visible – deserve priority.<br />
End institutionalization<br />
All too <strong>of</strong>ten, invisibility and abuse are <strong>the</strong> fate<br />
<strong>of</strong> children and adolescents with disabilities<br />
who are confined to institutions. Facilities are<br />
poor substitutes for a nurturing home life even if<br />
<strong>the</strong>y are well run, responsive to children’s needs<br />
and subject to inspection. Immediate measures<br />
to reduce overreliance on institutions could<br />
include a moratorium on new admissions. This<br />
should be accompanied by <strong>the</strong> promotion <strong>of</strong><br />
and increased support for family-based care and<br />
community-based rehabilitation. Additionally,<br />
<strong>the</strong>re is a need for broader measures that reduce<br />
<strong>the</strong> pressure for children to be sent away in<br />
<strong>the</strong> first place. These include <strong>the</strong> development<br />
<strong>of</strong> public services, schools and health systems<br />
accessible and responsive to children with disabilities<br />
and <strong>the</strong>ir families.<br />
<strong>Children</strong> with hearing and visual impairments learn <strong>the</strong> craft <strong>of</strong> pottery at an orphanage in Moscow Oblast, Russian<br />
Federation. © UNICEF/RUSS/2011/Kochineva<br />
80<br />
THE STATE OF THE WORLD’S CHILDREN <strong>2013</strong>: <strong>Children</strong> with Disabilities
Support families<br />
The CRC states that children should grow up in<br />
a family environment. It follows that <strong>the</strong> families<br />
<strong>of</strong> children and adolescents with disabilities must<br />
be adequately supported to provide <strong>the</strong> best<br />
possible environment and quality <strong>of</strong> life for <strong>the</strong>ir<br />
children. Support for families and caregivers –<br />
subsidized day care, for example, or by grants to<br />
<strong>of</strong>fset <strong>the</strong> increased costs and reduced income<br />
that come with caring for a child with a disability<br />
– can prove critical in reducing <strong>the</strong> pressure to<br />
admit children with disabilities to institutions in<br />
<strong>the</strong> first place. Such support can also improve <strong>the</strong><br />
prospects for children who return to <strong>the</strong> community<br />
after living in an institution.<br />
Disability in <strong>the</strong> family is <strong>of</strong>ten associated with<br />
higher costs <strong>of</strong> living and lost opportunities to<br />
earn income, and thus may increase <strong>the</strong> risk <strong>of</strong><br />
becoming or remaining poor. <strong>Children</strong> with disabilities<br />
who live in poverty can find it especially<br />
difficult to obtain such services as rehabilitation<br />
and assistive technology. To leave <strong>the</strong>m and <strong>the</strong>ir<br />
families to fend for <strong>the</strong>mselves would be to dangle<br />
<strong>the</strong> promise <strong>of</strong> inclusion just beyond <strong>the</strong>ir reach.<br />
Social policies should take into account <strong>the</strong> monetary<br />
and time costs associated with disability.<br />
These costs can be <strong>of</strong>fset with social grants,<br />
subsidies for transportation or funding for personal<br />
assistants or respite care. Cash benefits are<br />
easier to administer and more flexible at meeting<br />
<strong>the</strong> particular needs <strong>of</strong> children with disabilities<br />
and <strong>the</strong>ir families. They also respect <strong>the</strong> decisionmaking<br />
rights <strong>of</strong> parents and children. Where<br />
cash transfer programmes for families living in<br />
difficult circumstances already exist, <strong>the</strong>y can be<br />
adapted so that <strong>the</strong> families <strong>of</strong> children with disabilities<br />
are not unintentionally left out or <strong>of</strong>fered<br />
inadequate support. These recommendations<br />
would be urgent under any circumstances but<br />
are especially so in <strong>the</strong>se straitened times: Aid<br />
and social budgets are being cut, unemployment<br />
remains high, goods and services grow increasingly<br />
expensive. Families around <strong>the</strong> world face<br />
an increased risk <strong>of</strong> poverty.<br />
Move beyond minimum standards<br />
Existing supports and services should be continuously<br />
assessed with a view to achieving <strong>the</strong><br />
best possible quality. The aim must be to move<br />
beyond minimum standards. Attention needs to<br />
be focused on serving <strong>the</strong> individual child with<br />
a disability as well as on transforming entire<br />
systems or societies. The ongoing involvement<br />
<strong>of</strong> children with disabilities and <strong>the</strong>ir families<br />
in evaluating services will help to guarantee<br />
adequate and appropriate provision as children<br />
grow and <strong>the</strong>ir needs change. The importance <strong>of</strong><br />
this participation cannot be overstated. <strong>Children</strong><br />
and young people with disabilities are among<br />
<strong>the</strong> most authoritative sources <strong>of</strong> information<br />
on what <strong>the</strong>y need and whe<strong>the</strong>r <strong>the</strong>ir needs are<br />
being met.<br />
Coordinate services to support<br />
<strong>the</strong> child<br />
Because <strong>the</strong> effects <strong>of</strong> disability cut across sectors,<br />
services can be coordinated to take into<br />
account <strong>the</strong> full range <strong>of</strong> challenges confronting<br />
children with disabilities and <strong>the</strong>ir families.<br />
A coordinated programme <strong>of</strong> early intervention<br />
across <strong>the</strong> health, education and welfare sectors<br />
would help to promote <strong>the</strong> early identification<br />
and management <strong>of</strong> childhood disabilities.<br />
Across all sectors, early childhood interventions<br />
should be streng<strong>the</strong>ned. Studies have shown that<br />
gains in functional capacity can be largest when<br />
interventions occur early in a child’s development.<br />
When barriers are removed earlier in life,<br />
<strong>the</strong> compounding effect <strong>of</strong> <strong>the</strong> multiple barriers<br />
faced by children with disabilities is lessened.<br />
As children advance through <strong>the</strong>ir early years,<br />
<strong>the</strong>ir ability to function can be enhanced through<br />
rehabilitation. Improvements in ability will have<br />
greater impact if school systems are willing and<br />
able to accept <strong>the</strong>m and meet <strong>the</strong>ir educational<br />
needs. Moreover, acquiring an education would<br />
be more meaningful if <strong>the</strong>re were also inclusive<br />
school-to-work transition programmes and<br />
economy-wide efforts to promote <strong>the</strong> employment<br />
<strong>of</strong> people with disabilities.<br />
(continued on p. 84)<br />
AN AGENDA FOR ACTION<br />
81
PERSPECTIVE<br />
End <strong>the</strong> ‘book famine’ with better<br />
technology, attitudes and copyright law<br />
By Kartik Sawhney<br />
Kartik Sawhney is a nationalaward-winning<br />
high school student<br />
in New Delhi, India. He is active<br />
in advocating for <strong>the</strong> rights <strong>of</strong><br />
persons with disabilities and is a<br />
member <strong>of</strong> <strong>the</strong> Leonard Cheshire<br />
Disability Young Voices network.<br />
Visually impaired people<br />
face what at least one writer<br />
has called a ‘book famine’.<br />
This is not news to us: The<br />
visually challenged and printimpaired<br />
have been struggling<br />
for accessibility for a<br />
long time. ‘Accessibility’ is an<br />
all-encompassing term that<br />
includes access to <strong>the</strong> physical<br />
environment, transportation,<br />
information and communication<br />
technology, education and<br />
o<strong>the</strong>r facilities. In my view, it<br />
is crucial that accessible material<br />
be readily available. The<br />
urgency is even greater when<br />
we consider <strong>the</strong> situation in<br />
developing nations.<br />
When I conducted an informal<br />
survey <strong>of</strong> nearly 60 visually<br />
challenged students in primary<br />
and secondary grades in<br />
mainstream schools in India,<br />
I found that less than 20 per<br />
cent <strong>of</strong> <strong>the</strong>m had access to<br />
material in <strong>the</strong>ir preferred<br />
format, and less than 35 per<br />
cent to material in any format.<br />
Being visually challenged, I’ve<br />
had several experiences where<br />
lack <strong>of</strong> accessibility has impeded<br />
me from availing myself<br />
<strong>of</strong> <strong>the</strong> same opportunities as<br />
o<strong>the</strong>rs. The effort needed to<br />
make reading material accessible<br />
is monumental. Thanks<br />
to advances in optical character<br />
recognition (OCR) – a technology<br />
that converts printed,<br />
handwritten or typewritten text<br />
into machine-encoded text,<br />
making it possible for computerized<br />
voices to read <strong>the</strong> text<br />
aloud – <strong>the</strong>re has been some<br />
improvement. However, technical<br />
content remains inaccessible.<br />
I spend around two hours<br />
a day typing out <strong>the</strong> printed<br />
material from my science and<br />
math classes, for example,<br />
because OCR s<strong>of</strong>tware cannot<br />
read diagrams and special symbols<br />
with sufficient accuracy.<br />
The plight <strong>of</strong> rural students is<br />
even worse: They depend on<br />
humans to read volumes <strong>of</strong><br />
information aloud to <strong>the</strong>m. For<br />
instance, my friends in a small<br />
village have no option but to<br />
rely completely on volunteers<br />
who come by weekly.<br />
Even much online content cannot<br />
be read by standard screen<br />
reading utilities, primarily as a<br />
result <strong>of</strong> <strong>the</strong> varying standards<br />
and platforms used by authors<br />
and designers. Although <strong>the</strong><br />
World Wide Web Consortium<br />
(W3C) has produced guidelines<br />
for websites to follow in<br />
order to ensure a wonderful<br />
82<br />
THE STATE OF THE WORLD’S CHILDREN <strong>2013</strong>: <strong>Children</strong> with Disabilities
Being visually challenged, I’ve had several experiences where<br />
lack <strong>of</strong> accessibility has impeded me from availing myself <strong>of</strong><br />
<strong>the</strong> same opportunities as o<strong>the</strong>rs.<br />
experience for all, this vision<br />
is far from achieved. I come<br />
across websites daily that are<br />
not W3C-standard compliant.<br />
This calls for greater scrutiny<br />
by not only governments, but<br />
also civil society, academia and<br />
international organizations. The<br />
Government <strong>of</strong> India has taken<br />
steps to bring about a positive<br />
change on this front; it now<br />
<strong>of</strong>fers a National Award for <strong>the</strong><br />
Empowerment <strong>of</strong> Persons with<br />
Disabilities in <strong>the</strong> category <strong>of</strong><br />
‘Best Accessible Website’. This<br />
incentive drives organizations<br />
to make <strong>the</strong>ir websites accessible.<br />
If applied by enough<br />
countries, such measures<br />
could usher in a revolution.<br />
This is not just a matter for<br />
governments: Anyone can<br />
make a positive difference.<br />
I recall a historic achievement<br />
made in 2011 by a group <strong>of</strong><br />
visually challenged youth in<br />
Bangalore, India. Preparing for<br />
<strong>the</strong> entrance exams to prestigious<br />
business schools in <strong>the</strong><br />
country, <strong>the</strong>y contacted <strong>the</strong><br />
well-known educational publisher<br />
Pearson Education and<br />
requested that <strong>the</strong>y publish<br />
<strong>the</strong>ir material in an accessible<br />
format. Pearson agreed and<br />
has since <strong>the</strong>n made much <strong>of</strong><br />
<strong>the</strong>ir material available for <strong>the</strong><br />
visually challenged. However,<br />
not all publishers are as sensitive<br />
and understanding. Lack <strong>of</strong><br />
awareness and insensitivity are<br />
two <strong>of</strong> <strong>the</strong> biggest challenges.<br />
Unless – until – <strong>the</strong>re is a paradigm<br />
shift in attitudes towards<br />
people who are visually challenged,<br />
it will be difficult to<br />
overcome <strong>the</strong> challenges that<br />
plague <strong>the</strong> print-impaired<br />
community today.<br />
But <strong>the</strong>re is ano<strong>the</strong>r barrier to<br />
access – a political and legal,<br />
not technical or attitudinal, one.<br />
Currently, only 57 countries<br />
have amended <strong>the</strong>ir copyright<br />
laws to provide concessions<br />
for people with visual impairments.<br />
Thus, providing e-books<br />
for <strong>the</strong> visually challenged is<br />
unfortunately still considered<br />
an infringement <strong>of</strong> copyright<br />
in many countries – and this<br />
prevents local publishers from<br />
helping out within <strong>the</strong> community.<br />
For a young student, <strong>the</strong>se<br />
facts are extremely disturbing:<br />
Since most countries have<br />
pledged to provide maximum<br />
support and cooperation for <strong>the</strong><br />
welfare and empowerment <strong>of</strong><br />
persons with disabilities, <strong>the</strong>re<br />
turns out to be a vast difference<br />
between <strong>the</strong> laws on paper and<br />
actual, real-world implementation.<br />
The need <strong>of</strong> <strong>the</strong> hour is to<br />
translate words into action.<br />
I suggest an international body<br />
to oversee implementation <strong>of</strong><br />
international disability legislation,<br />
to <strong>the</strong> extent that it does<br />
not violate national sovereignty.<br />
Copyright law must be<br />
amended. I hope that countries<br />
will continue to work on <strong>the</strong><br />
legal framework, and that <strong>the</strong><br />
United Nations will take action<br />
towards a referendum on this<br />
issue. With concerted effort,<br />
I believe we will secure this<br />
inalienable right for all people<br />
with disabilities, everywhere:<br />
<strong>the</strong> right to access all material!<br />
AN AGENDA FOR ACTION<br />
83
(continued from p. 81)<br />
Involve children with disabilities in<br />
making decisions<br />
<strong>Children</strong> and adolescents with disabilities belong<br />
at <strong>the</strong> centre <strong>of</strong> efforts to build inclusive societies<br />
– not just as beneficiaries, but as agents <strong>of</strong><br />
change. <strong>State</strong>s parties to <strong>the</strong> CRPD have affirmed<br />
<strong>the</strong> right <strong>of</strong> children with disabilities to express<br />
<strong>the</strong>ir views freely on all matters affecting <strong>the</strong>m. In<br />
so doing, governments have reaffirmed <strong>the</strong> principles<br />
<strong>of</strong> <strong>the</strong> CRC and have obligated <strong>the</strong>mselves<br />
to consult children with disabilities when developing<br />
and implementing legislation and policies<br />
that concern <strong>the</strong>m. This is in <strong>State</strong>s’ interest, for<br />
children and young people with disabilities can<br />
enrich policymaking and service provision with<br />
<strong>the</strong>ir daily experiences and are uniquely qualified<br />
to provide information on whe<strong>the</strong>r <strong>the</strong>ir needs<br />
are being met and <strong>the</strong>ir contributions utilized<br />
across <strong>the</strong> full spectrum <strong>of</strong> issues and interventions:<br />
from health and nutrition to sexual and<br />
reproductive health, education and services for<br />
<strong>the</strong> transition to adulthood.<br />
The right to be heard applies to all children,<br />
regardless <strong>of</strong> type or degree <strong>of</strong> disability, and<br />
even children with pr<strong>of</strong>ound disabilities can be<br />
supported to express <strong>the</strong>ir choices and desires.<br />
A child who is able to express herself or himself<br />
is a child who is much less likely to be abused<br />
or exploited. Conversely, abuse and exploitation<br />
thrive where children lack <strong>the</strong> means to challenge<br />
<strong>the</strong>ir oppression. Participation is especially<br />
important for such marginalized groups as<br />
children who live in institutions.<br />
To recognize that children and adolescents with<br />
disabilities are <strong>the</strong> holders <strong>of</strong> rights, not <strong>the</strong> recipients<br />
<strong>of</strong> charity, is not to eliminate <strong>the</strong> need for<br />
appropriate rehabilitation, medical treatment or<br />
aids and appliances. It does mean, however, that<br />
children’s rights, perspectives and choices must<br />
be respected. In turn, this will entail decision-makers<br />
communicating in ways and by means that<br />
are easily accessed and used by children with disabilities,<br />
so <strong>the</strong>ir views can be incorporated in <strong>the</strong><br />
<strong>Children</strong> play netball at Ojwina Primary School in Lira, Uganda. © UNICEF/UGDA2012-00120/Sibiloni<br />
84<br />
THE STATE OF THE WORLD’S CHILDREN <strong>2013</strong>: <strong>Children</strong> with Disabilities
Six-year-old Nemanja (far left) sits with classmates in Novi Sad, Serbia. His primary school was <strong>the</strong> first to integrate<br />
children with disabilities under a law aimed at reducing institutionalization. © UNICEF/HQ2011-1156/Holt<br />
design, implementation and evaluation <strong>of</strong> policies<br />
and services.<br />
Global promise, local test<br />
In order to fulfil <strong>the</strong> promises <strong>of</strong> <strong>the</strong> CRPD and<br />
CRC, international agencies and donors and <strong>the</strong>ir<br />
national and local partners can include children<br />
with disabilities in <strong>the</strong> objectives, targets and<br />
monitoring indicators <strong>of</strong> all development programmes.<br />
Reliable and objective data are important<br />
to assist in planning and resource allocation,<br />
and to place children with disabilities more clearly<br />
on <strong>the</strong> development agenda. The necessary statistical<br />
work will take time but would be given vital<br />
impetus were international donors to promote a<br />
concerted global research agenda on disability. In<br />
<strong>the</strong> meanwhile, planning and programming will<br />
have to continue; denying or delaying services to<br />
children with disabilities because more data are<br />
needed would be unacceptable. Ra<strong>the</strong>r, plans,<br />
programmes and budgets can be designed to<br />
allow for modifications as additional information<br />
is made available.<br />
The ultimate pro<strong>of</strong> <strong>of</strong> all global and national<br />
efforts will be local, <strong>the</strong> test being whe<strong>the</strong>r every<br />
child with a disability enjoys her or his rights –<br />
including access to services, support and opportunities<br />
– on a par with o<strong>the</strong>r children, even<br />
in <strong>the</strong> most remote settings and <strong>the</strong> most<br />
deprived circumstances.<br />
AN AGENDA FOR ACTION<br />
85
PERSPECTIVE<br />
<strong>Children</strong> with disabilities and<br />
universal human rights<br />
By Lenín Voltaire Moreno Garcés<br />
There can be no such thing<br />
as <strong>the</strong> universal exercise <strong>of</strong><br />
human rights unless <strong>the</strong>se<br />
rights are enjoyed by all people<br />
– including <strong>the</strong> most vulnerable.<br />
Spurred by this conviction,<br />
<strong>the</strong> Office <strong>of</strong> <strong>the</strong> Vice-President<br />
<strong>of</strong> <strong>the</strong> Republic <strong>of</strong> Ecuador has<br />
focused on ascertaining and<br />
improving <strong>the</strong> situation <strong>of</strong> people<br />
with disabilities – starting<br />
with children.<br />
technical assistance donations<br />
consisting <strong>of</strong> such items<br />
as wheelchairs, walkers, antibedsore<br />
mattresses, walking<br />
sticks, hearing aids and visual<br />
kits, depending on <strong>the</strong> need<br />
or needs identified. Three new<br />
pros<strong>the</strong>tics shops were established<br />
and expected to deliver<br />
1,960 pros<strong>the</strong>tic and orthopaedic<br />
devices to <strong>the</strong> country’s<br />
children in 2012 alone.<br />
Lenín Voltaire Moreno Garcés,<br />
Vice-President <strong>of</strong> <strong>the</strong> Republic <strong>of</strong><br />
Ecuador from 2007 until May <strong>2013</strong>,<br />
was Latin America’s only holder<br />
<strong>of</strong> high <strong>of</strong>fice with a physical<br />
disability. The statistics in this<br />
essay were drawn from national<br />
programme documents.<br />
Beginning in July 2009, we<br />
conducted surveys throughout<br />
Ecuador under a project<br />
known as <strong>the</strong> Manuela Espejo<br />
Solidarity Mission. By visiting<br />
1,286,331 households in <strong>the</strong><br />
country’s 24 provinces and 221<br />
cantons, we were able to identify<br />
293,743 persons with disabilities.<br />
Of this total, some 24<br />
per cent had intellectual disabilities<br />
and <strong>the</strong> remaining 76 per<br />
cent had physical or sensory<br />
disabilities. We estimated <strong>the</strong><br />
prevalence <strong>of</strong> major disabilities<br />
at over 2 per cent <strong>of</strong> <strong>the</strong> national<br />
population, as measured by<br />
<strong>the</strong> 2010 census.<br />
We found that about 55,000<br />
boys and girls under 18 years<br />
<strong>of</strong> age had disabilities, accounting<br />
for about 19 per cent <strong>of</strong><br />
all persons with disabilities in<br />
Ecuador. As <strong>of</strong> June 2012, <strong>the</strong>se<br />
children had received 87,629<br />
We also found that many families<br />
live in extremely difficult<br />
circumstances. The care <strong>of</strong><br />
children with severe disabilities<br />
can be particularly expensive,<br />
forcing mo<strong>the</strong>rs to abandon<br />
<strong>the</strong>m in order to earn money.<br />
So <strong>the</strong> Joaquín Gallegos Lara<br />
Subsidy was established and<br />
provides <strong>the</strong> equivalent <strong>of</strong><br />
US$240 per month in financial<br />
assistance to <strong>the</strong> primary caregiver<br />
<strong>of</strong> a child or adult with a<br />
disability. Training in first-aid<br />
services, hygiene and rehabilitation<br />
is also provided. Ecuador<br />
is thus recognizing, for <strong>the</strong> first<br />
time, <strong>the</strong> labour <strong>of</strong> love performed<br />
by families who care<br />
for persons with disabilities.<br />
As <strong>of</strong> June 2012, <strong>the</strong> subsidies<br />
had benefited 6,585 children,<br />
43 per cent <strong>of</strong> <strong>the</strong>m girls.<br />
In addition to support, our<br />
approach attaches importance<br />
86<br />
THE STATE OF THE WORLD’S CHILDREN <strong>2013</strong>: <strong>Children</strong> with Disabilities
We [in government] must understand that disability is not a<br />
problem but ra<strong>the</strong>r a circumstance. . . . [We must] assist our<br />
youngest citizens in entering <strong>the</strong> mainstream.<br />
to early detection and intervention.<br />
By 2012, some 1.1 million<br />
children under age 9 had been<br />
screened to detect hearing<br />
impairments and promote early<br />
intervention. To this end, 1,401<br />
diagnostic and aural screening<br />
service units were set up<br />
in <strong>the</strong> Ministry <strong>of</strong> Public Health<br />
network; 1,500 health pr<strong>of</strong>essionals<br />
were trained; 30 speech<br />
<strong>the</strong>rapy service units were<br />
established; and 1,508 hearing<br />
aids were provided.<br />
In <strong>2013</strong>, 714,000 children will<br />
have been screened at 24<br />
impaired-sight service centres<br />
and we expect that some 2,500<br />
children will receive aids to<br />
help <strong>the</strong>m improve <strong>the</strong>ir vision<br />
or function with blindness.<br />
We have also set up a national<br />
programme to screen newborns<br />
for congenital conditions<br />
that can be treated. By<br />
December 2011, this effort,<br />
known as ‘Right Foot Forward:<br />
The Footprint <strong>of</strong> <strong>the</strong> Future’,<br />
had screened 98,034 newborns<br />
and found 30 cases <strong>of</strong> congenital<br />
hypothyroidism, galactosaemia,<br />
congenital adrenal<br />
hyperplasia or phenylketonuria.<br />
Each <strong>of</strong> <strong>the</strong>se 30 girls and boys<br />
has received treatment for<br />
conditions that, if left untreated<br />
in <strong>the</strong> first few weeks or<br />
months <strong>of</strong> life, place children at<br />
increased risk <strong>of</strong> low cognition,<br />
speech impairment and tremors,<br />
among o<strong>the</strong>r impairments.<br />
Beyond bio-social support and<br />
early intervention, we are pursuing<br />
social and cultural inclusion.<br />
Under <strong>the</strong> banner <strong>of</strong> ‘An<br />
Ecuador <strong>of</strong> Joy and Solidarity’,<br />
70,000 children and young people<br />
with and without disabilities<br />
have participated in inclusive<br />
fairs held throughout <strong>the</strong> country.<br />
Play and games are being<br />
promoted as means <strong>of</strong> creating<br />
space for integration. At <strong>the</strong>se<br />
fairs, persons with disabilities<br />
take <strong>the</strong> lead as instructors<br />
in physical exercise, arts and<br />
crafts, games and storytelling.<br />
Some 7,700 marginalized or<br />
vulnerable children and young<br />
people are advancing <strong>the</strong>ir personal<br />
development, self-esteem<br />
and social integration through<br />
such pursuits as dance, music,<br />
painting and literature. They<br />
include 1,100 children and<br />
young people who are involved<br />
in <strong>the</strong> Social Circus, an initiative<br />
run in collaboration with<br />
<strong>the</strong> Canadian entertainment<br />
company Cirque du Soleil.<br />
These innovations have awakened<br />
interest among Ecuador’s<br />
neighbours, a number <strong>of</strong> whom<br />
are seeking to learn more about<br />
our experience. The first thing<br />
to note is that <strong>the</strong>re is no time<br />
to lose. No child should have to<br />
wait for <strong>the</strong> services and supports<br />
that are rightfully hers or<br />
his, but this is especially <strong>the</strong><br />
case for children with disabilities,<br />
because <strong>the</strong>ir vulnerability<br />
can increase with age.<br />
We in government must tackle<br />
<strong>the</strong> tasks at hand without<br />
delay. We must understand<br />
that disability is not a problem<br />
but ra<strong>the</strong>r a circumstance. It<br />
is up to us, regardless <strong>of</strong> <strong>the</strong><br />
place or <strong>the</strong> role we have<br />
to play, to assist our youngest<br />
citizens in entering <strong>the</strong><br />
mainstream. We cannot even<br />
dream <strong>of</strong> a country with social<br />
justice, one that abides by<br />
<strong>the</strong> principles <strong>of</strong> good living,<br />
unless we guarantee that<br />
persons with disabilities,<br />
especially children and<br />
adolescents, can fully<br />
exercise <strong>the</strong>ir rights.<br />
Disability does not mean<br />
incapability: It is <strong>the</strong> wonderful<br />
diversity that enriches<br />
humankind.<br />
AN AGENDA FOR ACTION<br />
87
REFERENCES<br />
Chapter 1 Introduction<br />
1 World Health Organization, ‘Communitybased<br />
Rehabilitation Guidelines’, WHO,<br />
Geneva, 2010, , accessed<br />
31 January <strong>2013</strong>.<br />
2 Groce, Nora Ellen, ‘Adolescents and Youth<br />
with Disabilities: Issues and challenges’,<br />
Asia Pacific Disability Rehabilitation<br />
Journal, vol. 15, no. 2, July 2004,<br />
pp. 13–32.<br />
3 Committee on <strong>the</strong> Rights <strong>of</strong> <strong>the</strong> Child,<br />
Convention on <strong>the</strong> Rights <strong>of</strong> <strong>the</strong> Child<br />
General Comment No. 9 (2006): The rights<br />
<strong>of</strong> children with disabilities, CRC/C/GC/9,<br />
Geneva, 27 February 2007, pp. 2, 9; Jones,<br />
Lisa, et al., ‘Prevalence and Risk <strong>of</strong> Violence<br />
against <strong>Children</strong> with Disabilities: A systematic<br />
review and meta-analysis <strong>of</strong> observational<br />
studies’, The Lancet, vol. 380,<br />
no. 9845, 8 September 2012, pp. 899–907;<br />
World Health Organization and <strong>the</strong> World<br />
Bank, World Report on Disability, WHO,<br />
Geneva, 2011, p. 59.<br />
BOX: On <strong>the</strong> numbers<br />
World Health Organization, The Global Burden<br />
<strong>of</strong> Disease: 2004 update, WHO, Geneva, 2008;<br />
United Nations, Department <strong>of</strong> Economic and<br />
Social Affairs, Population Division, World<br />
Population Prospects: The 2010 revision,<br />
United Nations, New York, 2011.<br />
Chapter 2 Fundamentals <strong>of</strong> inclusion<br />
4 Bruce Marks, Susan, ‘Reducing Prejudice<br />
against <strong>Children</strong> with Disabilities in<br />
Inclusive Settings’, International Journal<br />
<strong>of</strong> Disability, Development and Education,<br />
vol. 44, no. 2, 1997, pp. 119–120.<br />
5 Contact a Family, ‘What Makes My Family<br />
Stronger: A report into what makes<br />
families with disabled children stronger<br />
– socially, emotionally and practically’,<br />
London, May 2009, , accessed 31 January <strong>2013</strong>.<br />
6 United Kingdom Government, ‘The<br />
Consolidated 3rd and 4th Periodic Report<br />
to UN Committee on <strong>the</strong> Rights <strong>of</strong> <strong>the</strong><br />
Child’, United Kingdom, July 2007, p. 31,<br />
,<br />
accessed 31 January <strong>2013</strong>.<br />
7 D’Aiglepierre, Rohen, Focus Development<br />
Association and United Nations<br />
<strong>Children</strong>’s Fund, ‘Exclusion Scolaire et<br />
Moyens D’Inclusion au Cycle Primaire a<br />
Madagascar’, February 2012, p. 67,<br />
,<br />
accessed 31 January <strong>2013</strong>.<br />
8 TNS and United Nations <strong>Children</strong>’s<br />
Fund, ‘Research Report on <strong>Children</strong> with<br />
Disabilities and <strong>the</strong>ir Families in Da Nang:<br />
Knowledge – attitudes – practices’,<br />
Viet Nam, November 2009, p. 14.<br />
9 World Health Organization and <strong>the</strong> World<br />
Bank, World Report on Disability, 2011, p. 3.<br />
10 Maras, Pam, and Rupert Brown, ‘Effects <strong>of</strong><br />
Contact on <strong>Children</strong>’s Attitudes Towards<br />
Disability: A longitudinal study’, Journal<br />
<strong>of</strong> Applied Social Psychology, vol. 26, no.<br />
23, December 1996, pp. 2113–2134, cited<br />
in Maras, Pam, and Rupert Brown, ‘Effects<br />
<strong>of</strong> Different Forms <strong>of</strong> School Contact on<br />
<strong>Children</strong>’s Attitudes toward Disabled and<br />
Non-Disabled Peers’, British Journal <strong>of</strong><br />
Educational Psychology, vol. 70, no. 3,<br />
September 2000, p. 339.<br />
11 Barg, Carolyn J., et al., ‘Physical Disability,<br />
Stigma, and Physical Activity in <strong>Children</strong>’,<br />
International Journal <strong>of</strong> Disability,<br />
Development and Education, vol. 57, no. 4,<br />
December 2010, p. 378.<br />
12 International Disability in Sport Working<br />
Group and <strong>the</strong> United Nations Office <strong>of</strong> <strong>the</strong><br />
Special Advisor to <strong>the</strong> Secretary-General on<br />
Sport for Development and Peace, ‘Sport<br />
in <strong>the</strong> United Nations Convention on <strong>the</strong><br />
Rights <strong>of</strong> Persons with Disabilities’, IDSWG,<br />
Nor<strong>the</strong>astern University, Boston, 2007.<br />
13 Convention on <strong>the</strong> Rights <strong>of</strong> Persons with<br />
Disabilities (CRPD) Preamble.<br />
14 World Health Organization and <strong>the</strong> World<br />
Bank, World Report on Disability, 2011,<br />
p. 43.<br />
15 Mont, Daniel M., and Nguyen Viet Cuong,<br />
‘Disability and Poverty in Vietnam’, World<br />
Bank Economic Review, vol. 25, no. 2,<br />
2011, pp. 323–359.<br />
16 Buckup, Sebastian, ‘The Price <strong>of</strong> Exclusion:<br />
The economic consequences <strong>of</strong> excluding<br />
people with disabilities from <strong>the</strong> world<br />
<strong>of</strong> work’, International Labour Office<br />
Employment Working Paper No. 43,<br />
International Labour Organization,<br />
Geneva, 2009.<br />
17 Mitra, Sophie, Aleksandra Posarac and<br />
Brandon Vick, ‘Disability and Poverty in<br />
Developing Countries: A snapshot from<br />
<strong>the</strong> World Health Survey’, Social Protection<br />
Discussion Paper No. 1109, The World<br />
Bank, Washington, D.C., April 2011.<br />
18 Groce, Nora, et al., ‘Disability and Poverty:<br />
The need for a more nuanced understanding<br />
<strong>of</strong> implications for development policy<br />
and practice’, Third World Quarterly,<br />
vol. 32, no. 8, 2011, pp. 1493–1513.<br />
19 Loeb, M. E., and Arne H. Eide, eds.,<br />
‘Living Conditions among People with<br />
Activity Limitations in Malawi: A national<br />
representa tive study’, SINTEF Health<br />
Research, Oslo, 26 August 2004,<br />
, accessed<br />
31 January <strong>2013</strong>; Hoogeveen, Johannes<br />
G., ‘Measuring Welfare for Small but<br />
Vulnerable Groups: Poverty and disability<br />
in Uganda’, Journal <strong>of</strong> African Economies,<br />
vol. 14, no. 4, 1 August 2005, pp. 603–631.<br />
20 World Health Organization and <strong>the</strong> World<br />
Bank, World Report on Disability, 2011,<br />
pp. 10, 39–40.<br />
21 Gertler, Paul J., and Lia C. Fernald, ‘The<br />
Medium Term Impact <strong>of</strong> Oportunidades on<br />
Child Development in Rural Areas’, Instituto<br />
Nacional de Salud Pública, Cuernavaca,<br />
Mexico, 30 November 2004; Behrman,<br />
Jere R., and John Hoddinott, ‘Programme<br />
Evaluation with Unobserved Heterogeneity<br />
and Selective Implementation: The Mexican<br />
PROGRESA impact on child nutrition’,<br />
Oxford Bulletin <strong>of</strong> Economics and Statistics,<br />
vol. 67, no. 4, August 2005, pp. 547–569;<br />
Hoddinott, John, and Emmanuel Skoufias,<br />
‘The Impact <strong>of</strong> PROGRESA on Food<br />
Consumption’, Economic Development<br />
and Cultural Change, vol. 53, no. 1,<br />
October 2004, pp. 37–61; Maluccio, John<br />
A., et al., ‘The Impact <strong>of</strong> an Experimental<br />
Nutritional Intervention in Childhood on<br />
Education among Guatemalan Adults’,<br />
Food Consumption and Nutrition Division<br />
Discussion Paper 207, International Food<br />
Policy Research Institute, Washington, D.C.,<br />
June 2006.<br />
22 Groce, Nora, et al., ‘Poverty and Disability:<br />
A critical review <strong>of</strong> <strong>the</strong> literature in low and<br />
middle-income countries’, Working Paper<br />
Series No. 16, Leonard Cheshire Disability<br />
and Inclusive Development Centre,<br />
University College London, London,<br />
September 2011.<br />
23 Office <strong>of</strong> <strong>the</strong> United Nations High<br />
Commissioner for Human Rights,<br />
Convention on <strong>the</strong> Rights <strong>of</strong> <strong>the</strong> Child,<br />
article 23.<br />
24 World Health Organization, ‘Community-<br />
Based Rehabilitation’, WHO, Geneva,<br />
,<br />
accessed 31 January <strong>2013</strong>.<br />
25 Allen-Leigh, Betania, et al., Iniciativa<br />
Evaluation: Evaluación externa de diseño<br />
y resultados del proyecto piloto<br />
‘Atención Integral a Niños y Niñas con<br />
Discapacidad en Comunidades Rurales<br />
en Oaxaca’, Instituto Nacional de Salud<br />
Pública, Cuernavaca, Mexico, 2010, as<br />
cited in Secretariat for <strong>the</strong> Convention<br />
on <strong>the</strong> Rights <strong>of</strong> Persons with Disabilities<br />
(SCRPD), ’Compilation <strong>of</strong> best practices<br />
for including persons with disabilities<br />
in all aspects <strong>of</strong> development efforts’,<br />
Working document in response to General<br />
Assembly Resolution A/65/186 and with<br />
<strong>the</strong> intention <strong>of</strong> facilitating <strong>the</strong> discussions<br />
leading up to <strong>the</strong> envisaged High Level<br />
Meeting on disability and development at<br />
<strong>the</strong> 67th session <strong>of</strong> <strong>the</strong> General Assembly<br />
in 2012.<br />
26 Municipalities <strong>of</strong> Santa Maria Guienagati,<br />
San Martín Peras, Coicoyan de las Flores<br />
and San José Tanago.<br />
27 Allen-Leigh, Betania, et al., Iniciativa<br />
Evaluation: Evaluación externa de diseño<br />
y resultados del proyecto piloto ‘Atención<br />
Integral a Niños y Niñas con Discapacidad<br />
en Comunidades Rurales en Oaxaca’, 2010.<br />
28 World Health Organization, ‘Assistive<br />
Devices/Technologies: What WHO is doing’,<br />
WHO, Geneva, , accessed<br />
31 January <strong>2013</strong>.<br />
29 Borg, Johan, Anna Lindström and<br />
Stig Larsson,‘Assistive Technology in<br />
Developing Countries: National and international<br />
responsibilities to implement <strong>the</strong><br />
Convention on <strong>the</strong> Rights <strong>of</strong> Persons with<br />
Disabilities’, The Lancet, vol. 374, no. 9704,<br />
28 November 2009, pp. 1863–1865.<br />
30 François, Isabelle, et al., ‘Causes <strong>of</strong><br />
Locomotor Disability and Need for<br />
Orthopaedic Devices in a Heavily<br />
Mined Taliban-Controlled Province <strong>of</strong><br />
Afghanistan: Issues and challenges for<br />
public health managers’, Tropical Medicine<br />
& International Health, vol. 3, no. 5, May<br />
1998, pp. 391–396; Matsen, S. L., ‘A Closer<br />
Look at Amputees in Vietnam: A field<br />
survey <strong>of</strong> Vietnamese using pros<strong>the</strong>ses’,<br />
Pros<strong>the</strong>tics and Orthotics International,<br />
vol. 23, no. 2, August 1999, pp. 93–101;<br />
May-Teerink, Teresa Lynn, ‘A Survey <strong>of</strong><br />
Rehabilitative Services and People Coping<br />
with Physical Disabilities in Uganda, East<br />
Africa’, pp. 311–316; Bigelow, Jeffrey,<br />
et al., ‘A Picture <strong>of</strong> Amputees and <strong>the</strong><br />
Pros<strong>the</strong>tic Situation in Haiti’, Disability<br />
& Rehabilitation, vol. 26, no. 4, 2004,<br />
pp. 246–252; Lindsay, Sally, and Irina<br />
Tsybina, ‘Predictors <strong>of</strong> Unmet Needs for<br />
Communication and Mobility Assistive<br />
Devices among Youth with a Disability: The<br />
role <strong>of</strong> socio-cultural factors’, Disability and<br />
Rehabilitation: Assistive Technology, vol. 6,<br />
no. 1, January 2011, pp. 10–21.<br />
31 Steinfeld, Edward, ‘Education for All: The<br />
cost <strong>of</strong> accessibility’, Education Notes, The<br />
World Bank, Washington, D.C., August<br />
2005, , accessed<br />
31 January <strong>2013</strong><br />
32 Based on evaluations by <strong>the</strong> Department<br />
<strong>of</strong> Public Works in South Africa, Accessible<br />
Design Case Studies, 2004, in Metts,<br />
Robert, ‘Disability and Development’,<br />
Background paper prepared for <strong>the</strong> disability<br />
and development research agenda<br />
meeting, 16 November 2004, The World<br />
Bank, Washington, D.C., pp. 15–45.<br />
88<br />
THE STATE OF THE WORLD’S CHILDREN <strong>2013</strong>: <strong>Children</strong> with Disabilities
33 South African Disability Institute, Special<br />
Housing for Disabled People, data provided<br />
by Philip Thompson, Africa Chair,<br />
International Commission on Technology<br />
and Accessibility, as cited in Metts, Robert,<br />
‘Disability and Development’, p. 17; Metts,<br />
Robert, ‘Disability and Development’,<br />
pp. 15–45.<br />
BOX: It’s about ability<br />
United Nations <strong>Children</strong>’s Fund Montenegro,<br />
‘“It’s about Ability” Campaign Honoured for<br />
<strong>the</strong> Best Humanitarian Action in Montenegro’,<br />
UNICEF Montenegro, Podgorica, Montenegro,<br />
15 February 2011, , accessed 31 January <strong>2013</strong>.<br />
Perovic, Jelena, ‘Survey: It’s about ability<br />
campaign results in positive change for children<br />
with disability in Montenegro’, UNICEF<br />
Montenegro, Podgorica, Montenegro, 14<br />
December 2011, ,<br />
accessed 31 January<br />
<strong>2013</strong>.<br />
Chapter 3 A strong foundation<br />
34 World Health Organization, ‘Fact Sheet:<br />
Poliomyelitis’, WHO, Geneva, 2011; Polio<br />
News, Global Polio Eradication Initiative,<br />
January <strong>2013</strong>.<br />
35 World Health Organization, ‘Global<br />
Immunization Data’, WHO, Geneva,<br />
October 2012.<br />
36 United Nations Department <strong>of</strong> Economic<br />
and Social Affairs, ‘Disability and <strong>the</strong><br />
Millennium Development Goals: A review<br />
<strong>of</strong> <strong>the</strong> MDG process and strategies for<br />
inclusion <strong>of</strong> disability issues in Millennium<br />
Development Goal efforts’, United Nations,<br />
New York, December 2011.<br />
37 World Health Organization and <strong>the</strong> World<br />
Bank, World Report on Disability, 2011,<br />
pp. 58–60.<br />
38 Gakidou, Emmanuela, et al., ‘Improving<br />
Child Survival through Environmental and<br />
Nutritional Interventions: The importance<br />
<strong>of</strong> targeting interventions toward <strong>the</strong><br />
poor’, Journal <strong>of</strong> <strong>the</strong> American Medical<br />
Association, vol. 298, no. 16, October 2007,<br />
pp. 1876–1887.<br />
39 World Health Organization, Nutrition for<br />
Health and Development: A global agenda<br />
for combating malnutrition – Progress<br />
report, WHO, Geneva, 2000, pp. 14–15.<br />
40 World Health Organization, ‘Micronutrient<br />
deficiencies: Iodine deficiency disorders’,<br />
WHO, Geneva, 2012, , accessed<br />
31 January <strong>2013</strong><br />
41 Checkley William, et al., ‘Multi-Country<br />
Analysis <strong>of</strong> <strong>the</strong> Effects <strong>of</strong> Diarrhoea on<br />
Childhood Stunting’, International Journal<br />
<strong>of</strong> Epidemiology, vol. 37, no. 4, August<br />
2008, pp. 816–830.<br />
42 Walker, Susan P., et al., ‘Inequality in Early<br />
Childhood: Risk and protective factors<br />
for early child development’, The Lancet,<br />
vol. 378, no. 9799, 8 October 2011,<br />
pp. 1325–1338.<br />
43 United Nations <strong>Children</strong>’s Fund, Tracking<br />
Progress on Child and Maternal Nutrition:<br />
A survival and development priority’,<br />
UNICEF, New York, November 2009, p. 16.<br />
44 Walker, Susan P., et al., ‘Inequality in Early<br />
Childhood: Risk and protective factors for<br />
early child development’, pp. 1325–1338.<br />
45 World Health Organization, ‘Medical<br />
Devices: Anaemia prevention and control’,<br />
WHO, Geneva, 2012, , accessed 31 January <strong>2013</strong>.<br />
46 Scholl, Theresa O., ‘Maternal Iron Status:<br />
Relation to fetal growth, length <strong>of</strong> gestation,<br />
and iron endowment <strong>of</strong> <strong>the</strong> neonate’,<br />
Nutrition Reviews, vol. 69, no. 11,<br />
November 2011, S23–S29; Vaughan, Owen<br />
R., et al., ‘Environmental Regulation <strong>of</strong><br />
Placental Phenotype: Implications for<br />
fetal growth’, Reproduction, Fertility and<br />
Development, vol. 24, no. 1, 6 December<br />
2011, pp. 80–96.<br />
47 Adams, Melanie S., et al., ‘Feeding<br />
Difficulties in <strong>Children</strong> with Cerebral Palsy:<br />
Low-cost caregiver training in Dhaka,<br />
Bangladesh’, Child: Care, Health and<br />
Development, vol. 38, no. 6, November<br />
2012, pp. 878–888.<br />
48 National Institutes for Health (NIH),<br />
MedlinePlus, ‘Cystic Fibrosis – Nutritional<br />
Considerations’, ,<br />
accessed 31 January <strong>2013</strong>; O’Brien, S., et<br />
al., ‘Intestinal Bile Acid Malabsorption in<br />
Cystic Fibrosis’, Gut, vol. 34, no. 8, August<br />
1993, pp. 1137–1141.<br />
49 United Nations <strong>Children</strong>’s Fund, ‘Violence<br />
against Disabled <strong>Children</strong>: UN Secretary-<br />
General’s report on violence against children<br />
– Summary report’, UNICEF, New York,<br />
28 July 2005, pp. 6–7; World Bank, May<br />
2004, “Disability in Bangladesh: A situation<br />
analysis” The Danish Bilharziasis Laboratory<br />
for <strong>the</strong> World Bank, People’s Republic <strong>of</strong><br />
Bangladesh ,<br />
p. 15, accessed 31 January <strong>2013</strong><br />
50 World Health Organization, Developmental<br />
Difficulties in Early Childhood: Prevention,<br />
early identification, assessment and<br />
intervention in low- and middle-income<br />
countries – A review, WHO, Geneva,<br />
2012; Thommessen, M., et al., ‘Feeding<br />
Problems, Height and Weight in<br />
Different Groups <strong>of</strong> Disabled <strong>Children</strong>’,<br />
ActaPaediatrica, vol. 80, no. 5, May 1991,<br />
pp. 527–533; Sullivan, Peter B., ed.,<br />
Feeding and Nutrition in <strong>Children</strong> with<br />
Neurodevelopmental Disability, Mac Keith<br />
Press, London, 2009, p. 61; Adams, Melanie<br />
S., et al., ‘Feeding Difficulties in <strong>Children</strong><br />
with Cerebral Palsy’, pp. 878–888.<br />
51 Groce, N., et al., ‘Water and Sanitation<br />
Issues for Persons with Disabilities in Lowand<br />
Middle-Income Countries: A literature<br />
review and discussion <strong>of</strong> implications for<br />
global health and international development,’<br />
Journal <strong>of</strong> Water and Health, vol. 9,<br />
no. 4, 2011, pp. 617–627.<br />
52 Human Rights Watch, ‘Fact Sheet: HIV<br />
and disability’, Human Rights Watch,<br />
New York, June 2011. Also, see World<br />
Health Organization and <strong>the</strong> World Bank,<br />
World Report on Disability, 2011, p. 77 for<br />
misconceptions on sexual activity, p. 59<br />
for drug/alcohol use and p. 147 for risk<br />
<strong>of</strong> abuse.<br />
53 United Nations <strong>Children</strong>’s Fund, ‘Towards<br />
an AIDS-Free Generation: Promoting<br />
community-based strategies for and with<br />
children and adolescents with disabilities’,<br />
UNICEF, July 2012.<br />
54 World Health Organization and United<br />
Nations Population Fund, Promoting<br />
Sexual and Reproductive Health for<br />
Persons with Disabilities: WHO/UNFPA<br />
guidance note, WHO, 2009, pp. 5–9, 12,<br />
, accessed 31 January <strong>2013</strong>; United<br />
Nations Educational, Scientific and<br />
Cultural Organization, Sexuality Education<br />
in Asia and <strong>the</strong> Pacific: Review <strong>of</strong> policies<br />
and strategies to implement and<br />
scale up, UNESCO Bangkok, Bangkok,<br />
2012, p. 2, ,<br />
accessed 31 January <strong>2013</strong>.<br />
55 Willemse, Karin, Ruth Morgan and John<br />
Meletse, ‘Deaf, Gay, HIV Positive, and<br />
Proud: Narrating an alternative identity in<br />
post-Apar<strong>the</strong>id South Africa’, Canadian<br />
Journal <strong>of</strong> African Studies, vol. 43, no. 1,<br />
April 2009, pp. 83–104.<br />
56 Sices, Laura, ‘Developmental Screening<br />
in Primary Care: The effectiveness <strong>of</strong><br />
current practice and recommendations<br />
for improvement’, The Commonwealth<br />
Fund, New York, December 2007, pp. v<br />
and 6; Johnson-Staub, Christine, ‘Charting<br />
Progress for Babies in Child Care Project:<br />
Promote access to early, regular, and comprehensive<br />
screening’, CLASP, Washington,<br />
D.C., February 2012, p. 1.<br />
57 Ertem, Ilgi O., et al., ’A Guide for<br />
Monitoring Child Development in Low- and<br />
Middle-Income Countries’, Pediatrics, vol.<br />
121, no. 3, March 2008, pp. e581–e589;<br />
World Health Organization, Developmental<br />
Difficulties in Early Childhood: Prevention,<br />
Early Identification, Assessment and<br />
Intervention in low-and middle income<br />
countries, WHO 2012pp.1<br />
58 World Health Organization, ‘Epilepsy: Fact<br />
sheet No. 999’, WHO, Geneva, October<br />
2012, , accessed<br />
31 January <strong>2013</strong>.<br />
59 Metts, Robert, ‘Disability and<br />
Development’, pp. 15–45.<br />
60 Filmer, Deon, ‘Disability, Poverty, and<br />
Schooling in Developing Countries: Results<br />
from 14 household surveys’, World Bank<br />
Economic Review, vol. 22, no. 1, 2008,<br />
pp. 141–163, as cited in World Health<br />
Organization and <strong>the</strong> World Bank, World<br />
Report on Disability, 2011.<br />
61 United Nations Educational, Scientific<br />
and Cultural Organization, EFA Global<br />
Monitoring Report 2010: Reaching <strong>the</strong><br />
marginalized, UNESCO and Oxford<br />
University Press, Paris and Oxford,<br />
UK, 2010, ,<br />
accessed 31 January <strong>2013</strong>; Loeb, M. E.,<br />
and Arne H. Eide, eds., ‘Living Conditions<br />
among People with Activity Limitations in<br />
Malawi: A national representative study’,<br />
SINTEF Health Research, Oslo, 26 August<br />
2004, ,<br />
31 January <strong>2013</strong>; Government <strong>of</strong> <strong>the</strong><br />
United Republic <strong>of</strong> Tanzania, ‘2008<br />
Tanzania Disability Survey’, United<br />
Republic <strong>of</strong> Tanzania National Bureau <strong>of</strong><br />
Statistics, Dar es Salaam, United Republic<br />
<strong>of</strong> Tanzania, 2009, p. 19, ,<br />
31 January <strong>2013</strong>.<br />
62 World Health Organization and <strong>the</strong> World<br />
Bank, World Report on Disability, 2011,<br />
p. 206.<br />
63 United Nations, Report <strong>of</strong> <strong>the</strong> Secretary-<br />
General on <strong>the</strong> Status <strong>of</strong> <strong>the</strong> Convention<br />
on <strong>the</strong> Rights <strong>of</strong> <strong>the</strong> Child, A/66/230, United<br />
Nations, New York, 3 August 2011, p. 8.<br />
64 For review, see World Health Organization<br />
and <strong>the</strong> World Bank, World Report on<br />
Disability, 2011, pp. 39–40; Filmer, Deon,<br />
‘Disability, Poverty, and Schooling in<br />
Developing Countries: Results from<br />
14 household surveys’, pp. 141–163;<br />
Sundrum, Ratna, et al., ‘Cerebral Palsy<br />
and Socioeconomic Status: A retrospective<br />
cohort study’, Archives <strong>of</strong> Disease in<br />
Childhood, vol. 90, no. 1, January 2005,<br />
pp. 15–18; Newacheck, Paul W., et al.,<br />
‘Disparities in <strong>the</strong> Prevalence <strong>of</strong> Disability<br />
between Black and White <strong>Children</strong>’,<br />
Archives <strong>of</strong> Pediatrics & Adolescent<br />
Medicine, vol. 157, no. 3, March 2003,<br />
pp. 244–248.<br />
REFERENCES<br />
89
65 United Nations <strong>Children</strong>’s Fund, Promoting<br />
<strong>the</strong> Rights <strong>of</strong> <strong>Children</strong> with Disabilities,<br />
Innocenti Digest No. 13, UNICEF Innocenti<br />
Research Centre, Florence, October 2007,<br />
p. 15, box 5.1, , accessed 31 January <strong>2013</strong>.<br />
66 van der Berg, Servaas, Poverty and<br />
Education, United Nations Educational,<br />
Scientific and Cultural Organization, Paris,<br />
2008.<br />
67 United Nations <strong>Children</strong>’s Fund, Promoting<br />
<strong>the</strong> Rights <strong>of</strong> <strong>Children</strong> with Disabilities,<br />
Innocenti Digest No. 13, p. 27, box 5.1.<br />
68 UNICEF, The Right <strong>of</strong> <strong>Children</strong> with<br />
Disabilities to Education: A rights-based<br />
approach to inclusive education, 2012, p.<br />
8; United Nations Educational, Scientific<br />
and Cultural Organization, ‘The Right to<br />
Education for Persons with Disabilities:<br />
Towards inclusion – An Education for All<br />
flagship’, Paris, ,<br />
accessed 31 January <strong>2013</strong>.<br />
69 United Nations Educational, Scientific<br />
and Cultural Organization, ‘Inclusion <strong>of</strong><br />
<strong>Children</strong> with Disabilities: The early childhood<br />
imperative’, UNESCO Policy Brief on<br />
Early Childhood No. 46, UNESCO, Paris,<br />
April–June 2009, ,<br />
accessed 31 January <strong>2013</strong>.<br />
70 Nahar, Baitun, et al., ‘Effects <strong>of</strong><br />
Psychosocial Stimulation on Growth and<br />
Development <strong>of</strong> Severely Malnourished<br />
<strong>Children</strong> in a Nutrition Unit in Bangladesh’,<br />
European Journal <strong>of</strong> Clinical Nutrition, vol.<br />
63, no. 6, June 2009, pp. 725–731.<br />
71 Jin, X., et al., ‘”Care for Development”<br />
Intervention in Rural China: A prospective<br />
follow-up study’, Journal <strong>of</strong> Developmental<br />
and Behavioral Pediatrics, vol. 28, no. 3,<br />
2007, pp. 213–218.<br />
72 Nair, M. K., et al., ’Effect <strong>of</strong> Child<br />
Development Centre Model Early<br />
Stimulation among At Risk Babies: A<br />
randomized controlled trial’, Indian<br />
Pediatrics, vol. 46, supplement, January<br />
2009, pp. s20–s26.<br />
73 Potterton, Joanne, et al., ‘The Effect <strong>of</strong> a<br />
Basic Home Stimulation Programme on <strong>the</strong><br />
Development <strong>of</strong> Young children Infected<br />
with HIV’, Developmental Medicine & Child<br />
Neurology, vol. 52, no. 6, June 2010,<br />
pp. 547–551.<br />
74 Walker, Susan P., et al., ’Inequality in Early<br />
Childhood: Risk and protective factors for<br />
early child development’, pp. 1325–1338.<br />
75 Forlin, Chris, et al., ‘Demographic<br />
Differences in Changing Pre-Service<br />
Teachers’ Attitudes, Sentiments and<br />
Concerns about Inclusive Education’,<br />
International Journal <strong>of</strong> Inclusive Education,<br />
vol. 13, no. 2, March 2009, pp. 195–209.<br />
Felicia Wilczenski’s ‘Attitudes toward<br />
Inclusive Education Scale’ (ATIES),<br />
developed in 1992, has been particularly<br />
influential in studies <strong>of</strong> teacher attitudes:<br />
Wilczenski, Felicia L., ‘Measuring Attitudes<br />
toward Inclusive Education’, Psychology in<br />
<strong>the</strong> Schools, vol. 29, no. 4, October 1992,<br />
pp. 306–312. For a review, see Kuyini,<br />
Ahmed Bawa, and Ishwar Desai, ‘Principals’<br />
and Teachers’ Attitudes and Knowledge<br />
<strong>of</strong> Inclusive Education as Predictors <strong>of</strong><br />
Effective Teaching Practices in Ghana’,<br />
Journal <strong>of</strong> Research in Special Educational<br />
Needs, vol. 7, no. 2, June 2007, pp. 104–113.<br />
76 Tur-Kaspa, Hana, Amatzia Weisel and Tova<br />
Most, ‘A Multidimensional Study <strong>of</strong> Special<br />
Education Students’ Attitudes towards<br />
People with Disabilities: A focus on deafness’,<br />
European Journal <strong>of</strong> Special Needs<br />
Education, vol. 15, no. 1, March 2000,<br />
pp. 13–23.<br />
77 Latimier, Camille, and Jan Šiška, ‘<strong>Children</strong>’s<br />
Rights for All!: Implementation <strong>of</strong> <strong>the</strong><br />
United Nations Convention on <strong>the</strong> Rights<br />
<strong>of</strong> <strong>the</strong> Child for children with intellectual<br />
disabilities’, Inclusion Europe, Brussels,<br />
October 2011, p. 21.<br />
78 Praisner, Cindy L., ‘Attitudes <strong>of</strong> Elementary<br />
School Principals toward <strong>the</strong> Inclusion <strong>of</strong><br />
Students with Disabilities’, Exceptional<br />
<strong>Children</strong>, vol. 69, no. 2, 2003, pp. 135–145.<br />
79 Shade, Richard A., and Roger Stewart,<br />
‘General Education and Special Education<br />
Preservice Teachers’ Attitudes towards<br />
Inclusion’, Preventing School Failure,<br />
vol. 46, no. 1, 2001, pp. 37–41.<br />
80 de Boer, Anke, Sip Jan Pijl and Alexander<br />
Minnaert, ‘Regular Primary Schoolteachers’<br />
Attitudes towards Inclusive Education:<br />
A review <strong>of</strong> <strong>the</strong> literature’, International<br />
Journal <strong>of</strong> Inclusive Education, vol. 15,<br />
no 3, April 2011, pp. 345–346.<br />
81 Miles, Susie, and Ian Kaplan, ‘Using<br />
Images to Promote Reflection: An action<br />
research study in Zambia and Tanzania’,<br />
Journal <strong>of</strong> Research in Special Educational<br />
Needs, vol. 5, no. 2, June 2005, pp. 79–80.<br />
82 Kalyanpur, Maya, ‘Paradigm and Paradox:<br />
Education for All and <strong>the</strong> inclusion <strong>of</strong><br />
children with disabilities in Cambodia’,<br />
International Journal <strong>of</strong> Inclusive<br />
Education, vol. 15, no. 10, December<br />
2011, p. 1058.<br />
83 Miles, Susie, et al., ‘Education for Diversity:<br />
The role <strong>of</strong> networking in resisting disabled<br />
people’s marginalisation in Bangladesh’,<br />
Compare: A Journal <strong>of</strong> Comparative and<br />
International Education, vol. 42, no. 2,<br />
2012, p. 293.<br />
84 Schurmann, Erik, ‘Training Disabled<br />
Teachers in Mozambique’, Enabling<br />
Education No. 10, Enabling Education<br />
Network, Manchester, UK, 2006,<br />
, accessed<br />
31 January <strong>2013</strong>.<br />
85 United Nations <strong>Children</strong>’s Fund, Promoting<br />
<strong>the</strong> Rights <strong>of</strong> <strong>Children</strong> with Disabilities,<br />
Innocenti Digest No. 13, p. 30.<br />
86 Lynch, Paul, et al., ‘Inclusive Educational<br />
Practices in Uganda: Evidencing practice <strong>of</strong><br />
itinerant teachers who work with children<br />
with visual impairment in local mainstream<br />
schools’, International Journal <strong>of</strong> Inclusive<br />
Education, vol. 15, no. 10, December 2011,<br />
pp. 1119–1134; Miles, Susie, and Sue<br />
Stubbs, ‘Inclusive Education and <strong>Children</strong><br />
with Disabilities’, UNICEF background discussion<br />
paper written for The <strong>State</strong> <strong>of</strong> <strong>the</strong><br />
World’s <strong>Children</strong> <strong>2013</strong>, 2012, p. 23.<br />
87 Prag, Anat, ‘Fostering Partnerships for<br />
Education Policy and Reform: Vietnam’,<br />
Enabling Education No. 8, Enabling<br />
Education Network, Manchester, UK,<br />
2004, , accessed 31 January<br />
<strong>2013</strong>.<br />
88 Report <strong>of</strong> <strong>the</strong> Secretary-General on <strong>the</strong><br />
Status <strong>of</strong> <strong>the</strong> Convention on <strong>the</strong> Rights<br />
<strong>of</strong> <strong>the</strong> Child, 3 August 2011.<br />
89 Stubbs, Sue, ‘Inclusive Education: Where<br />
<strong>the</strong>re are few resources’, The Atlas<br />
Alliance, Oslo, September 2008, p. 36,<br />
, accessed 31 January <strong>2013</strong>; Fosere,<br />
Mamello, ‘Mamello’s Story’, Enabling<br />
Education No. 5, Enabling Education<br />
Network, Manchester, UK, 2001, p. 10,<br />
.<br />
90 Lewis, Ingrid, ‘Water, Sanitation, Hygiene<br />
(WASH) and Inclusive Education’, Enabling<br />
Education No. 14, Enabling Education<br />
Network, Manchester, UK, 2010, pp.<br />
9–13, , accessed 31 January <strong>2013</strong>.<br />
91 Bines, Hazel, ‘Education’s Missing Millions:<br />
Including disabled children in education<br />
through EFA FTI processes and national<br />
sector plans – Main report <strong>of</strong> study findings’,<br />
World Vision UK, Milton Keynes,<br />
UK, September 2007, p. 3.<br />
92 Munir, Shirin Z., and Sultana S. Zaman,<br />
‘Models <strong>of</strong> Inclusion: Bangladesh experience’,<br />
ch. 19 in Inclusive Education across<br />
Cultures: Crossing boundaries, sharing<br />
ideas, edited by Mithu Alur and Vianne<br />
Timmons, Sage Publications India,<br />
New Delhi, 2009, p. 292.<br />
93 Ahsan, Mohammad Tariq, and Lindsay<br />
Burnip, ‘Inclusive Education in<br />
Bangladesh’, Australasian Journal<br />
<strong>of</strong> Special Education, vol. 31, no. 1,<br />
April 2007, p. 65.<br />
94 Miles, Susie, et al., ‘Education for Diversity:<br />
The role <strong>of</strong> networking in resisting disabled<br />
people’s marginalisation in Bangladesh’,<br />
Compare: A Journal <strong>of</strong> Comparative and<br />
International Education, vol. 42, no. 2,<br />
2012, pp. 283–302.<br />
95 United Nations Educational, Scientific and<br />
Cultural Organization, Building Human<br />
Capacities in Least Developed Countries<br />
to Promote Poverty Eradication and<br />
Sustainable Development, UNESCO,<br />
Paris, 2011, p. 8.<br />
96 Lansdown, Gerison, ‘Vulnerability <strong>of</strong><br />
<strong>Children</strong> with Disabilities’, UNICEF background<br />
research paper written for The <strong>State</strong><br />
<strong>of</strong> <strong>the</strong> World’s <strong>Children</strong> <strong>2013</strong>, 2012, p. 8.<br />
97 United Nations Educational, Scientific and<br />
Cultural Organization, Education Counts:<br />
Towards <strong>the</strong> Millennium Development<br />
Goals, UNESCO, Paris, 2011, p. 17.<br />
98 Abuya, Benta A., James Ciera and<br />
Elizabeth Kimani-Murage, ‘Effect <strong>of</strong><br />
Mo<strong>the</strong>r’s Education on Child’s Nutritional<br />
Status in <strong>the</strong> Slums <strong>of</strong> Nairobi’, BMC<br />
Pediatrics, vol. 12, no. 80, June 2012.<br />
99 Janevic, Teresa, et al., ‘Risk Factors<br />
for Childhood Malnutrition in Roma<br />
Settlements in Serbia’, BMC Public Health,<br />
vol. 10, August 2010.<br />
100 Miller, Jane E., and Yana V. Rodgers,<br />
‘Mo<strong>the</strong>r’s Education and <strong>Children</strong>’s<br />
Nutritional Status: New evidence from<br />
Cambodia’, Asian Development Review,<br />
vol. 26, no. 1, 2009, pp. 131–165.<br />
101 Semba, Richard D., et al., ‘Effect <strong>of</strong> Paternal<br />
Formal Education on Risk <strong>of</strong> Child Stunting<br />
in Indonesia and Bangladesh: A crosssectional<br />
study’, The Lancet, vol. 371,<br />
no. 9609, January 2008, pp. 322–328.<br />
102 Convention on <strong>the</strong> Rights <strong>of</strong> <strong>the</strong> Child,<br />
article 29.<br />
Chapter 4 Essentials <strong>of</strong> protection<br />
103 Cody, Clare, Count Every Child: The right<br />
to birth registration, Plan Ltd., Woking,<br />
UK, 2009.<br />
104 Algood, C. L., et al., ’Maltreatment <strong>of</strong><br />
<strong>Children</strong> with Developmental Disabilities:<br />
An ecological systems analysis,’ <strong>Children</strong><br />
and Youth Services Review, vol. 33, no. 7,<br />
July 2011, pp. 1142–1148; Stalker, K., and<br />
K. McArthur, ’Child Abuse, Child Protection<br />
and Disabled <strong>Children</strong>: A review <strong>of</strong> recent<br />
research,’ Child Abuse Review, vol. 21,<br />
no. 1, January/February 2012, pp. 24–40.<br />
105 Kvam, Marit Hoem, ‘Sexual Abuse <strong>of</strong> Deaf<br />
<strong>Children</strong>: A retrospective analysis <strong>of</strong> <strong>the</strong><br />
prevalence and characteristics <strong>of</strong> childhood<br />
sexual abuse among deaf adults in<br />
Norway’, Child Abuse & Neglect, vol. 28,<br />
no. 3, March 2004, pp. 241–251; Lansdown,<br />
Gerison, ‘Vulnerability <strong>of</strong> <strong>Children</strong> with<br />
Disabilities’, p. 6.<br />
90<br />
THE STATE OF THE WORLD’S CHILDREN <strong>2013</strong>: <strong>Children</strong> with Disabilities
106 Mental Disability Rights International,<br />
‘Behind Closed Doors: Human rights abuses<br />
in <strong>the</strong> psychiatric facilities, orphanages<br />
and rehabilitation centers <strong>of</strong> Turkey’, MDRI,<br />
Washington, D.C., 28 September 2005,<br />
pp. 1, 23, 72, ,<br />
accessed 31 January<br />
<strong>2013</strong>; Mental Disability Rights International,<br />
‘Torture Not Treatment: Electric shock and<br />
long-term restraint in <strong>the</strong> United <strong>State</strong>s<br />
on children and adults with disabilities<br />
at <strong>the</strong> Judge Rotenberg Center’, MDRI,<br />
Washington, D.C., 2010, pp. 1–2,<br />
,<br />
accessed 31 January <strong>2013</strong>.<br />
107 Human Rights Watch, Open Society<br />
Foundations, Women with Disabilities<br />
Australia, International Disability<br />
Alliance and Stop Torture in Health Care,<br />
‘Sterilization <strong>of</strong> Women and Girls with<br />
Disabilities: A briefing paper’, November<br />
2011, ,<br />
accessed 31 January <strong>2013</strong>.<br />
108 Dowse, Leanne, ‘Moving Forward or Losing<br />
Ground?: The sterilisation <strong>of</strong> women and<br />
girls with disabilities in Australia’, Paper<br />
prepared for Women with Disabilities<br />
Australia and presented at <strong>the</strong> Disabled<br />
Peoples’ International World Summit,<br />
Winnipeg, Canada, 8–10 September 2004.<br />
109 Information obtained from UNICEF<br />
Serbia; United Nations <strong>Children</strong>’s Fund<br />
and Serbian Government Ministry <strong>of</strong><br />
Labour and Social Policy, ‘Transforming<br />
Residential Institutions for <strong>Children</strong> and<br />
Developing Sustainable Alternatives’,<br />
Belgrade, 2011, pp. 4–8.<br />
110 Convention on <strong>the</strong> Rights <strong>of</strong> <strong>the</strong> Child<br />
General Comment No. 9 (2006), p. 21.<br />
FOCUS<br />
Violence against children with disabilities<br />
Jones, Lisa, et al., ‘Prevalence and Risk <strong>of</strong><br />
Violence against <strong>Children</strong> with Disabilities’,<br />
pp. 899–907.<br />
World Health Organization and <strong>the</strong> World Bank,<br />
World Report on Disability, 2011, pp. 29, 59 and<br />
137, pp. 29, 59 and 137.<br />
Pinheiro, Paulo Sérgio, World Report on<br />
Violence against <strong>Children</strong>, United Nations<br />
Secretary-General’s Study on Violence against<br />
<strong>Children</strong>, Geneva, 2006.<br />
Krug, Etienne G., et al., eds., World Report<br />
on Violence and Health, World Health<br />
Organization, Geneva, 2002.<br />
Hibbard, Roberta A., et al., ‘Maltreatment <strong>of</strong><br />
<strong>Children</strong> with Disabilities’, Pediatrics, vol. 119,<br />
no. 5, 1 May 2007, pp. 1018–1025.<br />
Ammerman, Robert T., et al., ‘Maltreatment<br />
in Psychiatrically Hospitalized <strong>Children</strong> and<br />
Adolescents with Developmental Disabilities:<br />
Prevalence and correlates’, Journal <strong>of</strong> <strong>the</strong><br />
American Academy <strong>of</strong> Child & Adolescent<br />
Psychiatry, vol. 33, no. 4, May 1994,<br />
pp. 567–576.<br />
Sullivan, Patricia M., ‘Violence Exposure among<br />
<strong>Children</strong> with Disabilities’, Clinical Child and<br />
Family Psychology Review, vol. 12, no. 2,<br />
June 2009, pp. 196–216.<br />
Ammerman, Robert T., and Nora J. Baladerian,<br />
Maltreatment <strong>of</strong> <strong>Children</strong> with Disabilities,<br />
National Committee to Prevent Child Abuse,<br />
Chicago, 1993.<br />
United Nations, Convention on <strong>the</strong> Rights <strong>of</strong><br />
Persons with Disabilities, A/RES/61/106,<br />
United Nations, New York, 2008.<br />
Gilbert, Ruth, et al., ‘Burden and Consequences<br />
<strong>of</strong> Child Maltreatment in High-Income<br />
Countries’, The Lancet, vol. 373, no. 9657,<br />
3 January 2009, pp. 68–81.<br />
Felitti, Vincent J., et al., ‘Relationship <strong>of</strong><br />
Childhood Abuse and Household Dysfunction<br />
to Many <strong>of</strong> <strong>the</strong> Leading Causes <strong>of</strong> Death in<br />
Adults: The adverse childhood experiences<br />
(ACE) study’, American Journal <strong>of</strong> Preventive<br />
Medicine, vol. 14, no. 4, May 1998, pp. 245–258.<br />
MacMillan, Harriet L., et al., ‘Interventions to<br />
Prevent Child Maltreatment and Associated<br />
Impairment’, The Lancet, vol. 373, no. 9659,<br />
17 January 2009, pp. 250–266.<br />
Chapter 5 Humanitarian Response<br />
111 Von der Assen, Nina, Mathijs Euwema and<br />
Huib Cornielje, ‘Including Disabled <strong>Children</strong><br />
in Psychological Programmes in Areas<br />
Affected by Armed Conflict’, Intervention,<br />
vol. 8, no. 1, March 2010, pp. 29–39.<br />
112 Bartlett, Sheridan, ‘The Implications <strong>of</strong><br />
Climate Change for <strong>Children</strong> in Lower-<br />
Income Countries’, <strong>Children</strong>, Youth and<br />
Environments, vol. 18, no. 1, 2008,<br />
pp. 71–98.<br />
113 Convention on <strong>the</strong> Rights <strong>of</strong> <strong>the</strong> Child<br />
General Comment No. 9 (2006), p. 22.<br />
FOCUS<br />
Risk, resilience and inclusive<br />
humanitarian action<br />
African Child Policy Forum, ‘Violence against<br />
<strong>Children</strong> in Africa: A compilation <strong>of</strong> <strong>the</strong> main<br />
findings <strong>of</strong> <strong>the</strong> various research projects<br />
conducted by <strong>the</strong> African Child Policy Forum<br />
(ACPF) since 2006’, ACPF, Addis Ababa,<br />
March 2011.<br />
Handicap International, ‘Mainstreaming<br />
Disability into Disaster Risk Reduction:<br />
A training manual’, Handicap<br />
International, Kathmandu, January 2009,<br />
,<br />
accessed 31 January <strong>2013</strong>.<br />
International Committee <strong>of</strong> <strong>the</strong> Red Cross,<br />
‘Promotion and Protection <strong>of</strong> <strong>the</strong> Rights <strong>of</strong><br />
<strong>Children</strong>: ICRC statement to <strong>the</strong> United Nations,<br />
2011’, ICRC, Geneva, 17 October 2011,<br />
,<br />
accessed<br />
31 January <strong>2013</strong>.<br />
IRIN, ‘DRC: Child disability, <strong>the</strong> forgotten<br />
crisis’, IRIN, Goma, Democratic Republic <strong>of</strong><br />
<strong>the</strong> Congo, 23 October 2009, ,<br />
accessed 2 October 2012.<br />
Kett, Maria, and Mark van Ommeren,<br />
‘Disability, Conflict and Emergencies’, The<br />
Lancet, vol. 374, no. 9704, 28 November 2009,<br />
pp. 1801–1803, , accessed 31 January <strong>2013</strong>.<br />
Kett, Maria, and Jean-François Trani,<br />
‘Vulnerability and Disability in Darfur’, Forced<br />
Migration Review, vol. 35, July 2010, pp. 12–14.<br />
Nelson, Brett D., et al., ‘Impact <strong>of</strong> Sexual<br />
Violence on <strong>Children</strong> in <strong>the</strong> Eastern Democratic<br />
Republic <strong>of</strong> Congo’, Medicine, Conflict and<br />
Survival, vol. 27, no. 4, October–December<br />
2011, pp. 211–225.<br />
Pearn, John H., ‘The Cost <strong>of</strong> War: Child<br />
injury and death’, in Contemporary Issues in<br />
Childhood Diarrhoea and Malnutrition, 1st<br />
edition, edited by Zulfigar Ahmed Bhutta,<br />
Oxford University Press, Karachi, Pakistan,<br />
pp. 334–343.<br />
Penrose, Angela, and Mie Takaki, ‘<strong>Children</strong>’s<br />
Rights in Emergencies and Disasters’, The<br />
Lancet, vol. 367, no. 9511, 25 February 2006,<br />
pp. 698–699.<br />
Plan International, ‘Child-Centred Disaster Risk<br />
Reduction: Building resilience through participation<br />
– Lessons from Plan International’,<br />
Plan UK, London, 2010.<br />
Handicap International and Save <strong>the</strong> <strong>Children</strong>,<br />
Out from <strong>the</strong> Shadows: Sexual Violence against<br />
<strong>Children</strong> with Disabilities, Save <strong>the</strong> <strong>Children</strong><br />
UK, London, 2011.<br />
Tamashiro, Tami, ‘Impact <strong>of</strong> Conflict on<br />
<strong>Children</strong>’s Health and Disability’, Background<br />
paper prepared for <strong>the</strong> Education for All<br />
Global Monitoring Report 2011: The hidden<br />
crisis – Armed conflict and education, United<br />
Nations Educational, Scientific and Cultural<br />
Organization, Paris, June 2010,,<br />
accessed 31 January <strong>2013</strong>.<br />
Trani, Jean-François, et al., ‘Disability,<br />
Vulnerability and Citizenship: To what extent<br />
is education a protective mechanism for children<br />
with disabilities in countries affected by<br />
conflict?’, International Journal <strong>of</strong> Inclusive<br />
Education, vol. 15, no. 10, 2011, pp. 1187–1203.<br />
United Nations <strong>Children</strong>’s Fund, ‘Violence<br />
against Disabled <strong>Children</strong>: UN Secretary-<br />
General’s Report on Violence against <strong>Children</strong><br />
– Summary report’, UNICEF, New York, 28 July<br />
2005, pp. 4–5, ,<br />
accessed 31 January <strong>2013</strong>.<br />
United Nations General Assembly, Report <strong>of</strong><br />
<strong>the</strong> Special Representative <strong>of</strong> <strong>the</strong> Secretary-<br />
General for <strong>Children</strong> and Armed Conflict,<br />
A/62/228, United Nations, New York,<br />
13 August 2007.<br />
Women’s Commission for Refugee Women<br />
and <strong>Children</strong>, Disabilities among Refugees<br />
and Conflict-Affected Populations: Resource<br />
kit for fieldworkers, Women’s Commission for<br />
Refugee Women and <strong>Children</strong>, New York, June<br />
2008, ,<br />
accessed 31 January <strong>2013</strong>.<br />
World Health Organization and <strong>the</strong> World Bank,<br />
World Report on Disability, 2011, pp. 34–37.<br />
FOCUS<br />
Explosive remnants <strong>of</strong> war<br />
Under <strong>the</strong> Mine Ban Treaty, victims are defined<br />
as those who are directly impacted and <strong>the</strong>refore<br />
have been killed by a landmine blast or<br />
survived one, as well as <strong>the</strong> surviving family<br />
members <strong>of</strong> those killed and injured. Under <strong>the</strong><br />
Convention on Cluster Munitions, victims also<br />
include affected family members and affected<br />
communities. Throughout this document,<br />
‘victims’ refers to survivors, family members<br />
<strong>of</strong> those affected and affected communities;<br />
‘casualties’ refers to those directly killed or<br />
injured by blasts; while ‘survivors’ specifically<br />
refers to those who have been directly impacted<br />
and survived landmines/Explosive Remnants<br />
<strong>of</strong> War blasts.<br />
Landmine and Cluster Munition Monitor,<br />
Landmine Monitor 2011, Mines Action Canada,<br />
October 2011, p. 51.<br />
‘Mines’ include victim-activated anti-personnel<br />
mines, anti-vehicle mines and improvised<br />
explosive devices; 2010 is <strong>the</strong> most recent year<br />
for which verified casualty totals were available<br />
for all countries at <strong>the</strong> time <strong>of</strong> publication.<br />
Please see , accessed<br />
31 January <strong>2013</strong>, for a full definition <strong>of</strong> casualties<br />
and devices as presented here and for<br />
updated casualty data.<br />
REFERENCES<br />
91
The Landmine Monitor identified more than<br />
1,500 child casualties in 1999 and more than<br />
1,600 in 2001.<br />
This includes only <strong>the</strong> casualties for which <strong>the</strong><br />
civilian/security status and <strong>the</strong> age were known.<br />
Boys accounted for 1,371 <strong>of</strong> <strong>the</strong> 2,735 civilian<br />
casualties caused by explosive remnants <strong>of</strong> war<br />
(ERW) between 2008 and 2010.<br />
Landmine and Cluster Munition Monitor,<br />
Landmine and Cluster Munition Monitor Fact<br />
Sheet: Impact <strong>of</strong> mines/ERW on children<br />
– November 2011, Landmine and Cluster<br />
Munition Monitor, Geneva, p. 2.<br />
Landmine and Cluster Munition Monitor Fact<br />
Sheet: Impact <strong>of</strong> mines/ERW on children –<br />
November 2010, pp. 1–3.<br />
Landmine and Cluster Munition Monitor Fact<br />
Sheet: Landmines and children – March 2010,<br />
pp. 2, 3.<br />
Percentages are <strong>of</strong> civilian casualties for<br />
which <strong>the</strong> age was known. <strong>Children</strong> made<br />
up 30 per cent <strong>of</strong> casualties from all types<br />
<strong>of</strong> mines.<br />
Landmine and Cluster Munition Monitor, ‘The<br />
Issues: Landmines’, Landmine and Cluster<br />
Munition Monitor, Geneva, ,<br />
accessed 31 January <strong>2013</strong>.<br />
Walsh, Nicolas E., and Wendy S. Walsh,<br />
‘Rehabilitation <strong>of</strong> Landmine Victims: The ultimate<br />
challenge’, Bulletin <strong>of</strong> <strong>the</strong> World Health<br />
Organization, vol. 81, no. 9, 2003, pp. 665–670.<br />
International Save <strong>the</strong> <strong>Children</strong> Alliance, ‘Child<br />
Landmine Survivors: An inclusive approach<br />
to policy and practice’, International Save <strong>the</strong><br />
<strong>Children</strong> Alliance, London, 2000.<br />
Watts, Hugh G., ‘The Consequences for<br />
<strong>Children</strong> <strong>of</strong> Explosive Remnants <strong>of</strong> War: Land<br />
mines, unexploded ordnance, improvised<br />
explosive devices and cluster bombs’, Journal<br />
<strong>of</strong> Pediatric Rehabilitation Medicine: An<br />
Interdisciplinary Approach, vol. 2, 2009,<br />
pp. 217–227.<br />
Landmine and Cluster Munition Monitor Fact<br />
Sheet: Impact <strong>of</strong> mines/ERW on children –<br />
November 2010, pp. 1–3.<br />
Watts, Hugh G., ‘The Consequences for<br />
<strong>Children</strong> <strong>of</strong> Explosive Remnants <strong>of</strong> War’,<br />
pp. 217–227.<br />
Landmine and Cluster Munition Monitor Fact<br />
Sheet: Landmines and children – June 2009,<br />
pp. 1–4.<br />
Munoz, Wanda, Ulrike Last and Teng Kimsean,<br />
Good Practices from <strong>the</strong> Project: Towards sustainable<br />
income generating activities for mine<br />
victim and o<strong>the</strong>r persons with disabilities in<br />
Cambodia, Handicap International Federation<br />
(HIC) Cambodia, Phnom Penh, Cambodia, 2010.<br />
Child Protection in Crisis (CPC) Network,<br />
Livelihoods and Economic Streng<strong>the</strong>ning Task<br />
Force, The Impacts <strong>of</strong> Economic Streng<strong>the</strong>ning<br />
Programs on <strong>Children</strong>: a review <strong>of</strong> <strong>the</strong> evidence,<br />
CPC Network, August 2011, pp. ii, 1, 18.<br />
Landmine and Cluster Munition Monitor Fact<br />
Sheet: Impact <strong>of</strong> mines/ERW on children –<br />
November 2010, pp. 1–3.<br />
Handicap International, Voices from <strong>the</strong><br />
Ground: Landmine and explosive remnants <strong>of</strong><br />
war survivors speak out on victim assistance,<br />
Handicap International, Brussels, September<br />
2009, p. 210.<br />
Chapter 6 Measuring child disability<br />
114 United Nations <strong>Children</strong>’s Fund and <strong>the</strong><br />
University <strong>of</strong> Wisconsin, Monitoring<br />
Child Disability in Developing Countries:<br />
Results from <strong>the</strong> Multiple Indicator Cluster<br />
Surveys, UNICEF, New York, 2008, p. 9.<br />
115 Mont, Daniel, ‘Measuring Disability<br />
Prevalence’, Social Protection Discussion<br />
Paper No. 0706, The World Bank,<br />
Washington, D.C., March 2007, p. 35;<br />
Maulik, Pallab K., and Gary L. Darmstadt,<br />
‘Childhood Disability in Low- and Middle-<br />
Income Countries: Overview <strong>of</strong> screening,<br />
prevention, services, legislation, and<br />
epidemiology’, Pediatrics, vol. 120,<br />
Supplement 1, July 2007, p. S21.<br />
116 World Health Organization, Towards a<br />
Common Language for Functioning,<br />
Disability and Health: ICF – The international<br />
classification <strong>of</strong> functioning, disability<br />
and health, WHO, Geneva, 2002.<br />
117 Msall, Michael E., and Dennis P. Hogan,<br />
‘Counting <strong>Children</strong> with Disability in Low-<br />
Income Countries: Enhancing prevention,<br />
promoting child development, and investing<br />
in economic well-being’, Pediatrics,<br />
vol. 120, no. 1, July 2007, p. 183.<br />
118 Durkin, Maureen, S., ‘The Epidemiology<br />
<strong>of</strong> Developmental Disabilities in Low-<br />
Income Countries’, Mental Retardation<br />
and Developmental Disabilities Research<br />
Review, vol. 8, no. 3, 2002, p. 211; United<br />
Nations <strong>Children</strong>’s Fund and <strong>the</strong> University<br />
<strong>of</strong> Wisconsin, Monitoring Child Disability in<br />
Developing Countries, p. 8.<br />
119 Lansdown, R. G., et al., ‘Culturally<br />
Appropriate Measures for Monitoring Child<br />
Development at Family and Community<br />
Level: A WHO collaborative study’, Bulletin<br />
<strong>of</strong> <strong>the</strong> World Health Organization, vol. 74,<br />
no. 3, 1996, p. 287<br />
120 See appendix 2 <strong>of</strong> Maulik and Darmstadt,<br />
2007.<br />
121 Robertson, Janet, Chris Hatton and Eric<br />
Emerson, ‘The Identification <strong>of</strong> <strong>Children</strong><br />
with or at Significant Risk <strong>of</strong> Intellectual<br />
Disabilities in Low and Middle Income<br />
Countries: A review’, CeDR Research<br />
Report, no. 3, Centre for Disability<br />
Research, Lancaster University, Lancaster,<br />
UK, July 2009, p. 22; United Nations<br />
<strong>Children</strong>’s Fund and <strong>the</strong> University <strong>of</strong><br />
Wisconsin, Monitoring Child Disability in<br />
Developing Countries, pp. 9, 58; Gladstone,<br />
M. J., et al., ‘Can Western Developmental<br />
Screening Tools Be Modified for Use in<br />
a Rural Malawian Setting?’, Archives <strong>of</strong><br />
Diseases in Childhood, vol. 93, no. 1,<br />
January 2008, pp. 23–29.<br />
122 Mont, Daniel, ‘Measuring Disability<br />
Prevalence’, p. 35; Washington Group on<br />
Disability Statistics, ‘Understanding and<br />
Interpreting Disability as Measured Using<br />
<strong>the</strong> WG Short Set <strong>of</strong> Questions’, 20 April<br />
2009, p. 2.<br />
123 United Nations <strong>Children</strong>’s Fund and <strong>the</strong><br />
University <strong>of</strong> Wisconsin, Monitoring Child<br />
Disability in Developing Countries, p. 8.<br />
124 Durkin, Maureen S., ‘Population-Based<br />
Studies <strong>of</strong> Childhood Disability in<br />
Developing Countries: Rationale and study<br />
design’, International Journal <strong>of</strong> Mental<br />
Health, vol. 20, no. 2, 1991, pp. 47–60;<br />
United Nations <strong>Children</strong>’s Fund and <strong>the</strong><br />
University <strong>of</strong> Wisconsin, Monitoring Child<br />
Disability in Developing Countries, p. 8.<br />
125 Durkin, Maureen S., ‘Population-Based<br />
Studies <strong>of</strong> Childhood Disability in<br />
Developing Countries’, pp. 47–60.<br />
126 Ibid.; United Nations <strong>Children</strong>’s Fund and <strong>the</strong><br />
University <strong>of</strong> Wisconsin, Monitoring Child<br />
Disability in Developing Countries, p. 9.<br />
127 World Health Organization and <strong>the</strong> United<br />
Nations Economic and Social Commission<br />
for Asia and <strong>the</strong> Pacific, Training Manual<br />
on Disability Statistics, Bangkok, 2008, pp.<br />
107–108.<br />
128 United Nations <strong>Children</strong>’s Fund and <strong>the</strong><br />
University <strong>of</strong> Wisconsin, Monitoring Child<br />
Disability in Developing Countries, pp.<br />
8–9; Nair, M. K., et al., ‘Developmental<br />
Screening Chart’, Indian Pediatrics, vol. 28,<br />
no. 8, 1991, pp. 869–872.<br />
129 United Nations <strong>Children</strong>’s Fund and <strong>the</strong><br />
University <strong>of</strong> Wisconsin, Monitoring<br />
Child Disability in Developing Countries,<br />
p. 9; Durkin, Maureen S., ‘Population-<br />
Based Studies <strong>of</strong> Childhood Disability in<br />
Developing Countries’, pp. 47–60.<br />
130 Robertson, Janet, Chris Hatton and Eric<br />
Emerson, ‘The Identification <strong>of</strong> <strong>Children</strong><br />
with or at Significant Risk <strong>of</strong> Intellectual<br />
Disabilities in Low and Middle Income<br />
Countries: A review’, p. 20.<br />
FOCUS<br />
Lessons learned<br />
United Nations <strong>Children</strong>’s Fund and <strong>the</strong><br />
University <strong>of</strong> Wisconsin, Monitoring Child<br />
Disability in Developing Countries: Results<br />
from <strong>the</strong> Multiple Indicator Cluster Surveys,<br />
p. 9; Thorburn Marigold, et al., ‘Identification<br />
<strong>of</strong> Childhood Disability in Jamaica: The ten<br />
question screen’, International Journal <strong>of</strong><br />
Rehabilitation Research, vol. 15, no. 2,<br />
June 1992, pp. 115–127.<br />
United Nations <strong>Children</strong>’s Fund and <strong>the</strong><br />
University <strong>of</strong> Wisconsin, Monitoring Child<br />
Disability in Developing Countries: Results from<br />
<strong>the</strong> Multiple Indicator Cluster Surveys, p. 9.<br />
Durkin, Maureen S., ‘Population-Based<br />
Studies <strong>of</strong> Childhood Disability in Developing<br />
Countries’, pp. 47–60; United Nations <strong>Children</strong>’s<br />
Fund and <strong>the</strong> University <strong>of</strong> Wisconsin,<br />
Monitoring Child Disability in Developing<br />
Countries, pp. 9–10.<br />
Zaman, Sultana S., et al., ‘Validity <strong>of</strong> <strong>the</strong> ‘Ten<br />
Questions’ for Screening Serious Childhood<br />
Disability: Results from urban Bangladesh’,<br />
International Journal <strong>of</strong> Epidemiology, vol. 19,<br />
no. 3, 1990, p. 613.<br />
Previous UNICEF publications reported that <strong>the</strong><br />
number <strong>of</strong> participating countries was 20. This<br />
number was correct when those publications<br />
were printed, but <strong>the</strong> final number <strong>of</strong> countries<br />
that administered <strong>the</strong> Ten Questions as part <strong>of</strong><br />
MICS3 was 25.<br />
United Nations <strong>Children</strong>’s Fund and University<br />
<strong>of</strong> Wisconsin, Monitoring Child Disability in<br />
Developing Countries, p. 23.<br />
FOCUS<br />
From screening to assessment<br />
Maulik, Pallab K., and Gary L. Darmstadt,<br />
‘Childhood Disability in Low- and Middle-<br />
Income Countries’, July 2007, p. S6; United<br />
Nations <strong>Children</strong>’s Fund and <strong>the</strong> University<br />
<strong>of</strong> Wisconsin, Monitoring Child Disability in<br />
Developing Countries, p. 58.<br />
92<br />
THE STATE OF THE WORLD’S CHILDREN <strong>2013</strong>: <strong>Children</strong> with Disabilities
Statistical Tables<br />
Economic and social statistics on <strong>the</strong> countries and areas<br />
<strong>of</strong> <strong>the</strong> world, with particular reference to children’s well-being.<br />
Overview ..............................................................................................94<br />
General note on <strong>the</strong> data ....................................................................94<br />
Child mortality estimates ....................................................................94<br />
Notes on specific tables ......................................................................95<br />
Explanation <strong>of</strong> symbols .......................................................................98<br />
Regional classification .........................................................................98<br />
Under-five mortality rankings .............................................................99<br />
TABLES<br />
1 Basic indicators ...........................................................................100<br />
2 Nutrition .......................................................................................104<br />
3 Health ...........................................................................................108<br />
4 HIV/AIDS ......................................................................................112<br />
5 Education .....................................................................................116<br />
6 Demographic indicators .............................................................120<br />
7 Economic indicators ...................................................................124<br />
8 Women .........................................................................................128<br />
9 Child protection ...........................................................................132<br />
10 The rate <strong>of</strong> progress ....................................................................136<br />
11 Adolescents .................................................................................140<br />
12 Disparities by residence .............................................................144<br />
13 Disparities by household wealth ...............................................148<br />
14 Early childhood development ....................................................152<br />
STATISTICAL TABLES 93
STATISTICAL TABLES<br />
OVERVIEW<br />
This reference guide presents <strong>the</strong> most recent key statistics on child survival, development and<br />
protection for <strong>the</strong> world’s countries, areas and regions. It includes, for <strong>the</strong> first time, a table on early<br />
childhood development.<br />
The statistical tables in this volume also support UNICEF’s focus on progress and results towards<br />
internationally agreed-upon goals and compacts relating to children’s rights and development.<br />
UNICEF is <strong>the</strong> lead agency responsible for monitoring <strong>the</strong> child-related goals <strong>of</strong> <strong>the</strong> Millennium<br />
Declaration as well as <strong>the</strong> Millennium Development Goals (MDGs) and indicators. UNICEF is also<br />
a key partner in <strong>the</strong> United Nations’ work on monitoring <strong>the</strong>se targets and indicators.<br />
Efforts have been made to maximize <strong>the</strong> comparability <strong>of</strong> statistics across countries and time.<br />
Never<strong>the</strong>less, data used at <strong>the</strong> country level may differ in terms <strong>of</strong> <strong>the</strong> methods used to collect data<br />
or arrive at estimates, and in terms <strong>of</strong> <strong>the</strong> populations covered. Fur<strong>the</strong>rmore, data presented here<br />
are subject to evolving methodologies, revisions <strong>of</strong> time series data (e.g., immunization, maternal<br />
mortality ratios) and changing regional classifications. Also, data comparable from one year to<br />
<strong>the</strong> next are unavailable for some indicators. It is <strong>the</strong>refore not advisable to compare data from<br />
consecutive editions <strong>of</strong> The <strong>State</strong> <strong>of</strong> <strong>the</strong> World’s <strong>Children</strong>.<br />
The numbers presented in this reference guide are available online at <br />
and via <strong>the</strong> UNICEF global statistical databases at . Please refer to <strong>the</strong>se websites<br />
for <strong>the</strong> latest tables and for any updates or corrigenda subsequent to printing.<br />
General note on <strong>the</strong> data<br />
Data presented in <strong>the</strong> following statistical tables are<br />
derived from <strong>the</strong> UNICEF global databases and are accompanied<br />
by definitions, sources and, where necessary,<br />
additional footnotes. The tables draw on inter-agency<br />
estimates and nationally representative household surveys<br />
such as Multiple Indicator Cluster Surveys (MICS) and<br />
Demographic and Health Surveys (DHS). In addition, data<br />
from o<strong>the</strong>r United Nations organizations have been used.<br />
Data presented in this year’s statistical tables generally reflect<br />
information available as <strong>of</strong> August 2012. More detailed<br />
information on methodology and data sources is available<br />
at .<br />
This volume includes <strong>the</strong> latest population estimates and<br />
projections from World Population Prospects: The 2010 revision<br />
and World Urbanization Prospects: The 2011 revision<br />
(United Nations Department <strong>of</strong> Economic and Social Affairs,<br />
Population Division). Data quality is likely to be adversely<br />
affected for countries that have recently suffered disasters,<br />
especially where basic country infrastructure has been<br />
fragmented or where major population movements<br />
have occurred.<br />
Multiple Indicator Cluster Surveys (MICS): UNICEF supports<br />
countries in collecting reliable and globally mapped<br />
data through MICS. Since 1995, around 240 surveys have<br />
been conducted in over 100 countries and areas. The fifth<br />
round <strong>of</strong> MICS, involving around 60 countries, is under way.<br />
MICS are among <strong>the</strong> largest sources <strong>of</strong> data for monitoring<br />
progress towards internationally agreed-upon development<br />
goals for children, including <strong>the</strong> MDGs. More information is<br />
available at .<br />
Child mortality estimates<br />
Each year, in The <strong>State</strong> <strong>of</strong> <strong>the</strong> World’s <strong>Children</strong>, UNICEF<br />
reports a series <strong>of</strong> mortality estimates for children – including<br />
<strong>the</strong> annual infant mortality rate, <strong>the</strong> under-five mortality<br />
rate and <strong>the</strong> number <strong>of</strong> under-five deaths – for at least two<br />
reference years. These figures represent <strong>the</strong> best estimates<br />
available at <strong>the</strong> time <strong>of</strong> printing and are based on <strong>the</strong> work<br />
<strong>of</strong> <strong>the</strong> United Nations Inter-agency Group for Child Mortality<br />
Estimation (IGME), which includes UNICEF, <strong>the</strong> World Health<br />
Organization (WHO), <strong>the</strong> World Bank and <strong>the</strong> United Nations<br />
Population Division. IGME mortality estimates are updated<br />
annually through a detailed review <strong>of</strong> all newly available<br />
data points, which <strong>of</strong>ten results in adjustments to previously<br />
reported estimates. As a result, consecutive editions<br />
<strong>of</strong> The <strong>State</strong> <strong>of</strong> <strong>the</strong> World’s <strong>Children</strong> should not be used for<br />
analysing mortality trends over time. Comparable global and<br />
regional under-five mortality estimates for <strong>the</strong> period 1970–<br />
2011 are presented on page 95. Country-specific mortality<br />
indicators for 1970–2011, based on <strong>the</strong> most recent IGME estimates,<br />
are presented in Table 10 (for <strong>the</strong> years 1970, 1990,<br />
2000 and 2011) and are available at <br />
and .<br />
94<br />
THE STATE OF THE WORLD’S CHILDREN <strong>2013</strong>: <strong>Children</strong> with Disabilities
under-five mortality rate (per 1,000 live births)<br />
uNICEF Region 1970 1975 1980 1985 1990 1995 2000 2005 2010 2011<br />
Sub-Saharan Africa 236 212 197 184 178 170 154 133 112 109<br />
Eastern and Sou<strong>the</strong>rn Africa 214 191 183 170 162 155 135 112 88 84<br />
West and Central Africa 259 237 215 202 197 190 175 155 135 132<br />
Middle East and North Africa 190 157 122 90 72 61 52 44 37 36<br />
South Asia 195 175 154 135 119 104 89 75 64 62<br />
East Asia and Pacific 120 92 75 62 55 49 39 29 22 20<br />
Latin America and Caribbean 117 100 81 65 53 43 34 26 22 19<br />
CEE/CIS 88 75 68 56 48 45 35 28 22 21<br />
Least developed countries 238 223 206 186 171 156 136 118 102 98<br />
World 141 123 111 96 87 82 73 63 53 51<br />
under-five deaths (millions)<br />
uNICEF Region 1970 1975 1980 1985 1990 1995 2000 2005 2010 2011<br />
Sub-Saharan Africa 3.1 3.2 3.4 3.5 3.8 4.0 4.0 3.8 3.4 3.4<br />
Eastern and Sou<strong>the</strong>rn Africa 1.3 1.4 1.5 1.6 1.7 1.7 1.6 1.5 1.2 1.2<br />
West and Central Africa 1.6 1.7 1.8 1.9 2.1 2.2 2.2 2.2 2.1 2.1<br />
Middle East and North Africa 1.2 1.1 1.0 0.8 0.7 0.5 0.4 0.4 0.4 0.4<br />
South Asia 5.3 5.1 5.0 4.6 4.3 3.9 3.3 2.7 2.4 2.3<br />
East Asia and Pacific 5.2 3.5 2.3 2.4 2.2 1.6 1.3 0.9 0.6 0.6<br />
Latin America and Caribbean 1.2 1.1 0.9 0.8 0.6 0.5 0.4 0.3 0.2 0.2<br />
CEE/CIS 0.5 0.6 0.5 0.4 0.4 0.2 0.2 0.1 0.1 0.1<br />
Least developed countries 3.3 3.4 3.5 3.5 3.5 3.5 3.3 3.0 2.7 2.6<br />
World 16.9 14.8 13.1 12.7 12.0 10.8 9.6 8.2 7.1 6.9<br />
Notes on specific tables<br />
TABLE 1. BASIC INdICATORS<br />
Under-five mortality rate by gender: For <strong>the</strong> first time, IGME<br />
has produced gender-specific estimates <strong>of</strong> <strong>the</strong> under-five<br />
mortality rate. Details on <strong>the</strong> estimation methods are<br />
available in <strong>the</strong> annex <strong>of</strong> <strong>the</strong> latest IGME report, at<br />
.<br />
Share <strong>of</strong> household income: The percentage share <strong>of</strong><br />
household income received by <strong>the</strong> wealthiest 20 per cent<br />
and <strong>the</strong> poorest 40 per cent <strong>of</strong> households has been moved<br />
from Table 1 to Table 7, where it is now presented alongside<br />
o<strong>the</strong>r economic indicators.<br />
TABLE 2. NuTRITION<br />
Underweight, stunting, wasting and overweight: UNICEF<br />
and WHO have initiated a process to harmonize anthropometric<br />
data used for computation and estimation <strong>of</strong><br />
regional and global averages and trend analysis. As part<br />
<strong>of</strong> this process, regional and global averages for underweight<br />
(moderate and severe), stunting, wasting and<br />
overweight prevalences are derived from a model<br />
described in M. de Onis et al., ‘Methodology for Estimating<br />
Regional and Global Trends <strong>of</strong> Child Malnutrition’<br />
(International Journal <strong>of</strong> Epidemiology, vol. 33, 2004,<br />
pp. 1260–1270). Owing to differences in data sources<br />
(i.e., new empirical data are incorporated as made available)<br />
and estimation methodology, <strong>the</strong>se regional average<br />
prevalence estimates may not be comparable to <strong>the</strong> averages<br />
published in previous editions <strong>of</strong> The <strong>State</strong> <strong>of</strong> <strong>the</strong><br />
World’s <strong>Children</strong>.<br />
Vitamin A supplementation: Emphasizing <strong>the</strong> importance<br />
for children <strong>of</strong> receiving two annual doses <strong>of</strong> vitamin A<br />
(spaced 4–6 months apart), this report presents only full<br />
coverage <strong>of</strong> vitamin A supplementation. In <strong>the</strong> absence <strong>of</strong><br />
a direct method to measure this indicator, full coverage<br />
is reported as <strong>the</strong> lower coverage estimate from rounds<br />
1 and 2 in a given year.<br />
TABLE 3. HEALTH<br />
Diarrhoea treatment: For <strong>the</strong> first time, <strong>the</strong> table includes<br />
diarrhoea treatment with oral rehydration salts (ORS). ORS<br />
is a key commodity for child survival and <strong>the</strong>refore it is crucial<br />
to monitor its coverage. This replaces <strong>the</strong> indicator used<br />
in previous years, diarrhoea treatment with oral rehydration<br />
<strong>the</strong>rapy and continued feeding, which will continue to be<br />
available at .<br />
STATISTICAL TABLES 95
STATISTICAL TABLES<br />
Water and sanitation: The drinking water and sanitation<br />
coverage estimates in this report come from <strong>the</strong><br />
WHO/UNICEF Joint Monitoring Programme for Water<br />
Supply and Sanitation (JMP). These are <strong>the</strong> <strong>of</strong>ficial United<br />
Nations estimates for measuring progress towards <strong>the</strong> MDG<br />
target for drinking water and sanitation. Full details <strong>of</strong> <strong>the</strong><br />
JMP methodology can be found at <br />
and . As <strong>the</strong> JMP estimates use linear<br />
regression applied to data from all available household<br />
sample surveys and censuses, and additional data become<br />
available between each issue <strong>of</strong> estimates, subsequent<br />
JMP estimates should not be compared.<br />
Immunization: This report presents WHO and UNICEF<br />
estimates <strong>of</strong> national immunization coverage. These are<br />
<strong>of</strong>ficial United Nations estimates for measuring progress<br />
towards <strong>the</strong> MDG indicator for measles-containing<br />
vaccine coverage. Since 2000, <strong>the</strong> estimates are updated<br />
once annually in July, following a consultation process<br />
wherein countries are provided draft reports for review<br />
and comment. As <strong>the</strong> system incorporates new empirical<br />
data, each annual revision supersedes prior data releases,<br />
and coverage levels from earlier revisions are not<br />
comparable. A more detailed explanation <strong>of</strong> <strong>the</strong> process<br />
can be found at .<br />
Regional averages for <strong>the</strong> six reported antigens are computed<br />
as follows:<br />
• For BCG, regional averages include only those countries<br />
where BCG is included in <strong>the</strong> national routine immunization<br />
schedule.<br />
• For DPT, polio, measles, HepB and Hib vaccines, regional<br />
averages include all countries.<br />
• For protection at birth (PAB) from tetanus, regional averages<br />
include only <strong>the</strong> countries where maternal and neonatal<br />
tetanus is endemic.<br />
TABLE 4. HIV/AIdS<br />
In 2012, <strong>the</strong> Joint United Nations Programme on HIV/AIDS<br />
(UNAIDS) released new global, regional and country level<br />
HIV and AIDS estimates for 2011 that reflect key changes in<br />
WHO HIV treatment guidelines for adults and children and<br />
for prevention <strong>of</strong> mo<strong>the</strong>r-to-child transmission <strong>of</strong> HIV as well<br />
as improvements in assumptions <strong>of</strong> <strong>the</strong> probability <strong>of</strong> HIV<br />
transmission from mo<strong>the</strong>r to child and net survival rates for<br />
infected children. In addition, <strong>the</strong>re are also more reliable<br />
data available from population-based surveys, expanded<br />
national sentinel surveillance systems and programme service<br />
statistics in a number <strong>of</strong> countries. Based on <strong>the</strong> refined<br />
methodology, UNAIDS has retrospectively generated new<br />
estimates <strong>of</strong> HIV prevalence, <strong>the</strong> number <strong>of</strong> people living<br />
with HIV and those needing treatment, AIDS-related deaths,<br />
new HIV infections and <strong>the</strong> number <strong>of</strong> children whose parents<br />
have died due to all causes including AIDS for past<br />
years. Only new estimates should be used for trend analysis.<br />
The new HIV and AIDS estimates included in this table will<br />
also be published in <strong>the</strong> forthcoming UNAIDS Global AIDS<br />
Report, 2012.<br />
Overall, <strong>the</strong> global and regional figures published in The<br />
<strong>State</strong> <strong>of</strong> <strong>the</strong> World’s <strong>Children</strong> <strong>2013</strong> are not comparable to estimates<br />
previously published. More information on HIV and<br />
AIDS estimates, methodology and updates can be found at<br />
.<br />
TABLE 8. WOmEN<br />
Maternal mortality ratio (adjusted): The table presents <strong>the</strong><br />
‘adjusted’ maternal mortality ratios for <strong>the</strong> year 2010, as<br />
produced by <strong>the</strong> Maternal Mortality Estimation Inter-agency<br />
Group (MMEIG), composed <strong>of</strong> WHO, UNICEF, <strong>the</strong> United<br />
Nations Population Fund (UNFPA) and <strong>the</strong> World Bank, toge<strong>the</strong>r<br />
with independent technical experts. To derive <strong>the</strong>se<br />
estimates, <strong>the</strong> inter-agency group used a dual approach:<br />
making adjustments to correct misclassification and underreporting<br />
in existing estimates <strong>of</strong> maternal mortality from<br />
civil registration systems, and using a model to generate<br />
estimates for countries without reliable national-level estimates<br />
<strong>of</strong> maternal mortality. These ‘adjusted’ estimates<br />
should not be compared to previous inter-agency estimates.<br />
The full report – with complete country and regional estimates<br />
for <strong>the</strong> years 1990, 1995, 2000, 2005 and 2010, as<br />
well as details on <strong>the</strong> methodology – can be found at<br />
.<br />
TABLE 9. CHILd pROTECTION<br />
Violent discipline: Estimates used in UNICEF publications<br />
and in MICS country reports prior to 2010 were calculated<br />
using household weights that did not take into account <strong>the</strong><br />
last-stage selection <strong>of</strong> children for <strong>the</strong> administration <strong>of</strong> <strong>the</strong><br />
child discipline module in MICS surveys. (A random selection<br />
<strong>of</strong> one child aged 2–14 is undertaken for <strong>the</strong> administration<br />
<strong>of</strong> <strong>the</strong> child discipline module.) In January 2010, it<br />
was decided that more accurate estimates are produced by<br />
using a household weight that takes <strong>the</strong> last-stage selection<br />
into account. MICS 3 data were recalculated using this<br />
approach. All UNICEF publications produced after 2010,<br />
including The <strong>State</strong> <strong>of</strong> <strong>the</strong> World’s <strong>Children</strong> <strong>2013</strong>, use <strong>the</strong><br />
revised estimates.<br />
Child labour: New data from <strong>the</strong> fourth round <strong>of</strong> MICS<br />
(MICS4, 2009–2012) included in <strong>the</strong> table have been recalculated<br />
according to <strong>the</strong> indicator definition used in MICS3<br />
surveys, to ensure cross-country comparability. In this<br />
definition, <strong>the</strong> activities <strong>of</strong> fetching water or collecting firewood<br />
are classified as household chores ra<strong>the</strong>r than as an<br />
economic activity. Under this approach, a child between <strong>the</strong><br />
ages <strong>of</strong> 5–14 years old would have to be engaged in fetching<br />
water or collecting firewood for at least 28 hours per<br />
week to be considered as a child labourer.<br />
96<br />
THE STATE OF THE WORLD’S CHILDREN <strong>2013</strong>: <strong>Children</strong> with Disabilities
TABLE 10. THE RATE OF pROGRESS<br />
The under-five mortality rate (U5MR) is used as <strong>the</strong><br />
principal indicator <strong>of</strong> progress in child well-being. In 1970,<br />
around 16.9 million children under 5 years old were dying<br />
every year. In 2011, by comparison, <strong>the</strong> estimated number<br />
<strong>of</strong> children who died before <strong>the</strong>ir fifth birthday stood at<br />
6.9 million – highlighting a significant long-term decline<br />
in <strong>the</strong> global number <strong>of</strong> under-five deaths.<br />
u5mR has several advantages as a gauge <strong>of</strong> child<br />
well-being:<br />
• First, U5MR measures an end result <strong>of</strong> <strong>the</strong> development<br />
process ra<strong>the</strong>r than an ‘input’ such as school enrolment<br />
level, per capita calorie availability or number <strong>of</strong> doctors<br />
per thousand population – all <strong>of</strong> which are means to<br />
an end.<br />
• Second, U5MR is known to be <strong>the</strong> result <strong>of</strong> a wide variety<br />
<strong>of</strong> inputs: for example, antibiotics to treat pneumonia;<br />
insecticide-treated mosquito nets to prevent malaria;<br />
<strong>the</strong> nutritional well-being and health knowledge <strong>of</strong><br />
mo<strong>the</strong>rs; <strong>the</strong> level <strong>of</strong> immunization and oral rehydration<br />
<strong>the</strong>rapy use; <strong>the</strong> availability <strong>of</strong> maternal and child health<br />
services, including antenatal care; income and food<br />
availability in <strong>the</strong> family; <strong>the</strong> availability <strong>of</strong> safe drinking<br />
water and basic sanitation; and <strong>the</strong> overall safety <strong>of</strong> <strong>the</strong><br />
child’s environment.<br />
• Third, U5MR is less susceptible to <strong>the</strong> fallacy <strong>of</strong> <strong>the</strong> average<br />
than, for example, per capita gross national income<br />
(GNI). This is because <strong>the</strong> natural scale does not allow<br />
<strong>the</strong> children <strong>of</strong> <strong>the</strong> rich to be one thousand times more<br />
likely to survive, even if <strong>the</strong> human-made scale does permit<br />
<strong>the</strong>m to have one thousand times as much income.<br />
In o<strong>the</strong>r words, it is much more difficult for a wealthy<br />
minority to affect a nation’s U5MR, and this indicator<br />
<strong>the</strong>refore presents a more accurate, if far from perfect,<br />
picture <strong>of</strong> <strong>the</strong> health status <strong>of</strong> <strong>the</strong> majority <strong>of</strong> children<br />
and <strong>of</strong> society as a whole.<br />
The speed <strong>of</strong> progress in reducing U5MR can be assessed<br />
by calculating its annual rate <strong>of</strong> reduction (ARR). Unlike<br />
<strong>the</strong> comparison <strong>of</strong> absolute changes, ARR measures<br />
relative changes that reflect differences compared to <strong>the</strong><br />
starting value.<br />
As lower levels <strong>of</strong> under-five mortality are reached, <strong>the</strong><br />
same absolute reduction represents a greater percentage<br />
reduction. ARR <strong>the</strong>refore shows a higher rate <strong>of</strong> progress<br />
for a 10-point absolute reduction, for example, if that<br />
reduction happens at a lower level <strong>of</strong> under-five mortality<br />
versus a higher level over <strong>the</strong> same time period. A 10-point<br />
decrease in U5MR from 100 in 1990 to 90 in 2011 represents<br />
a reduction <strong>of</strong> 10 per cent, corresponding to an ARR <strong>of</strong><br />
about 0.5 per cent, whereas <strong>the</strong> same 10-point decrease<br />
from 20 to 10 over <strong>the</strong> same period represents a reduction<br />
<strong>of</strong> 50 per cent or an ARR <strong>of</strong> 3.3 per cent. (A negative value<br />
for <strong>the</strong> percentage reduction indicates an increase in U5MR<br />
during <strong>the</strong> period specified.)<br />
When used in conjunction with gross domestic product<br />
(GDP) growth rates, U5MR and its rate <strong>of</strong> reduction can<br />
<strong>the</strong>refore give a picture <strong>of</strong> <strong>the</strong> progress being made by any<br />
country, area or region, over any period <strong>of</strong> time, towards<br />
<strong>the</strong> satisfaction <strong>of</strong> some <strong>of</strong> <strong>the</strong> most essential<br />
human needs.<br />
As Table 10 shows, <strong>the</strong>re is no fixed relationship between<br />
<strong>the</strong> annual reduction rate <strong>of</strong> U5MR and <strong>the</strong> annual rate <strong>of</strong><br />
growth in per capita GDP. Comparing <strong>the</strong>se two indicators<br />
helps shed light on <strong>the</strong> relationship between economic<br />
advances and human development.<br />
Finally, <strong>the</strong> table gives <strong>the</strong> total fertility rate for each country<br />
and area and <strong>the</strong> corresponding ARR. It is clear that<br />
many <strong>of</strong> <strong>the</strong> nations that have achieved significant reductions<br />
in <strong>the</strong>ir U5MR have also achieved significant reductions<br />
in fertility.<br />
TABLES 12–13. EquITy<br />
Diarrhoea treatment: For <strong>the</strong> first time, <strong>the</strong>se tables include<br />
diarrhoea treatment with oral rehydration salts. This replaces<br />
<strong>the</strong> indicator used in previous years, diarrhoea treatment<br />
with oral rehydration <strong>the</strong>rapy and continued feeding.<br />
STATISTICAL TABLES 97
STATISTICAL TABLES<br />
Explanation <strong>of</strong> symbols<br />
The following symbols are common across all tables:<br />
– Data are not available.<br />
x Data refer to years or periods o<strong>the</strong>r than those specified in <strong>the</strong> column heading. Such data are not included in <strong>the</strong><br />
calculation <strong>of</strong> regional and global averages, with <strong>the</strong> exception <strong>of</strong> 2005–2006 data from India.<br />
y Data differ from <strong>the</strong> standard definition or refer to only part <strong>of</strong> a country. If <strong>the</strong>y fall within <strong>the</strong> noted reference<br />
period, such data are included in <strong>the</strong> calculation <strong>of</strong> regional and global averages.<br />
* Data refer to <strong>the</strong> most recent year available during <strong>the</strong> period specified in <strong>the</strong> column heading.<br />
** Excludes China.<br />
Sources and years for specific data points are available at . Symbols that appear in specific tables<br />
are explained in <strong>the</strong> footnotes to those tables.<br />
Regional classification<br />
Averages presented at <strong>the</strong> end <strong>of</strong> each <strong>of</strong> <strong>the</strong> 14 statistical tables are calculated using data from countries and areas as<br />
classified below.<br />
Sub-Saharan Africa<br />
Eastern and Sou<strong>the</strong>rn Africa; West and Central Africa;<br />
Djibouti; Sudan 1<br />
Eastern and Sou<strong>the</strong>rn Africa<br />
Angola; Botswana; Burundi; Comoros; Eritrea; Ethiopia;<br />
Kenya; Lesotho; Madagascar; Malawi; Mauritius;<br />
Mozambique; Namibia; Rwanda; Seychelles; Somalia; South<br />
Africa; South Sudan 1 ; Swaziland; Uganda; United Republic <strong>of</strong><br />
Tanzania; Zambia; Zimbabwe<br />
West and Central Africa<br />
Benin; Burkina Faso; Cameroon; Cape Verde; Central African<br />
Republic; Chad; Congo; Côte d’Ivoire; Democratic Republic<br />
<strong>of</strong> <strong>the</strong> Congo; Equatorial Guinea; Gabon; Gambia; Ghana;<br />
Guinea; Guinea-Bissau; Liberia; Mali; Mauritania; Niger;<br />
Nigeria; Sao Tome and Principe; Senegal; Sierra Leone; Togo<br />
middle East and North Africa<br />
Algeria; Bahrain; Djibouti; Egypt; Iran (Islamic Republic<br />
<strong>of</strong>); Iraq; Jordan; Kuwait; Lebanon; Libya; Morocco; Oman;<br />
Qatar; Saudi Arabia; <strong>State</strong> <strong>of</strong> Palestine; Sudan 1 ; Syrian Arab<br />
Republic; Tunisia; United Arab Emirates; Yemen<br />
South Asia<br />
Afghanistan; Bangladesh; Bhutan; India; Maldives; Nepal;<br />
Pakistan; Sri Lanka<br />
East Asia and pacific<br />
Brunei Darussalam; Cambodia; China; Cook Islands;<br />
Democratic People’s Republic <strong>of</strong> Korea; Fiji; Indonesia;<br />
Kiribati; Lao People’s Democratic Republic; Malaysia;<br />
Marshall Islands; Micronesia (Federated <strong>State</strong>s <strong>of</strong>);<br />
Mongolia; Myanmar; Nauru; Niue; Palau; Papua New<br />
Guinea; Philippines; Republic <strong>of</strong> Korea; Samoa; Singapore;<br />
Solomon Islands; Thailand; Timor-Leste; Tonga; Tuvalu;<br />
Vanuatu; Viet Nam<br />
Latin America and Caribbean<br />
Antigua and Barbuda; Argentina; Bahamas; Barbados;<br />
Belize; Bolivia (Plurinational <strong>State</strong> <strong>of</strong>); Brazil; Chile;<br />
Colombia; Costa Rica; Cuba; Dominica; Dominican Republic;<br />
Ecuador; El Salvador; Grenada; Guatemala; Guyana; Haiti;<br />
Honduras; Jamaica; Mexico; Nicaragua; Panama; Paraguay;<br />
Peru; Saint Kitts and Nevis; Saint Lucia; Saint Vincent and<br />
<strong>the</strong> Grenadines; Suriname; Trinidad and Tobago; Uruguay;<br />
Venezuela (Bolivarian Republic <strong>of</strong>)<br />
CEE/CIS<br />
Albania; Armenia; Azerbaijan; Belarus; Bosnia and<br />
Herzegovina; Bulgaria; Croatia; Georgia; Kazakhstan;<br />
Kyrgyzstan; Montenegro; Republic <strong>of</strong> Moldova; Romania;<br />
Russian Federation; Serbia; Tajikistan; <strong>the</strong> former Yugoslav<br />
Republic <strong>of</strong> Macedonia; Turkey; Turkmenistan; Ukraine;<br />
Uzbekistan<br />
Least developed countries/areas<br />
[Classified as such by <strong>the</strong> United Nations High<br />
Representative for <strong>the</strong> Least Developed Countries,<br />
Landlocked Developing Countries and Small Island<br />
Developing <strong>State</strong>s (UN-OHRLLS)]. Afghanistan; Angola;<br />
Bangladesh; Benin; Bhutan; Burkina Faso; Burundi;<br />
Cambodia; Central African Republic; Chad; Comoros;<br />
Democratic Republic <strong>of</strong> <strong>the</strong> Congo; Djibouti; Equatorial<br />
Guinea; Eritrea; Ethiopia; Gambia; Guinea; Guinea-Bissau;<br />
Haiti; Kiribati; Lao People’s Democratic Republic;<br />
Lesotho; Liberia; Madagascar; Malawi; Mali; Mauritania;<br />
Mozambique; Myanmar; Nepal; Niger; Rwanda; Samoa;<br />
Sao Tome and Principe; Senegal; Sierra Leone; Solomon<br />
Islands; Somalia; South Sudan 1 ; Sudan 1 ; Timor-Leste; Togo;<br />
Tuvalu; Uganda; United Republic <strong>of</strong> Tanzania; Vanuatu;<br />
Yemen; Zambia<br />
98<br />
THE STATE OF THE WORLD’S CHILDREN <strong>2013</strong>: <strong>Children</strong> with Disabilities
under-five mortality rankings<br />
The following list ranks countries and areas in descending order <strong>of</strong> <strong>the</strong>ir estimated 2011 under-five mortality<br />
rate (U5MR), a critical indicator <strong>of</strong> <strong>the</strong> well-being <strong>of</strong> children. Countries and areas are listed alphabetically in<br />
<strong>the</strong> tables on <strong>the</strong> following pages.<br />
Under-5<br />
mortality<br />
rate (2011)<br />
Countries and areas<br />
Value Rank<br />
Sierra Leone 185 1<br />
Somalia 180 2<br />
Mali 176 3<br />
Chad 169 4<br />
Democratic Republic <strong>of</strong> <strong>the</strong> Congo 168 5<br />
Central African Republic 164 6<br />
Guinea-Bissau 161 7<br />
Angola 158 8<br />
Burkina Faso 146 9<br />
Burundi 139 10<br />
Cameroon 127 11<br />
Guinea 126 12<br />
Niger 125 13<br />
Nigeria 124 14<br />
South Sudan 1 121 15<br />
Equatorial Guinea 118 16<br />
Côte d’Ivoire 115 17<br />
Mauritania 112 18<br />
Togo 110 19<br />
Benin 106 20<br />
Swaziland 104 21<br />
Mozambique 103 22<br />
Afghanistan 101 23<br />
Gambia 101 23<br />
Congo 99 25<br />
Djibouti 90 26<br />
Uganda 90 26<br />
Sao Tome and Principe 89 28<br />
Lesotho 86 29<br />
Sudan 1 86 29<br />
Malawi 83 31<br />
Zambia 83 31<br />
Comoros 79 33<br />
Ghana 78 34<br />
Liberia 78 34<br />
Ethiopia 77 36<br />
Yemen 77 36<br />
Kenya 73 38<br />
Pakistan 72 39<br />
Haiti 70 40<br />
Eritrea 68 41<br />
United Republic <strong>of</strong> Tanzania 68 41<br />
Zimbabwe 67 43<br />
Gabon 66 44<br />
Senegal 65 45<br />
Tajikistan 63 46<br />
Madagascar 62 47<br />
Myanmar 62 47<br />
India 61 49<br />
Papua New Guinea 58 50<br />
Bhutan 54 51<br />
Rwanda 54 51<br />
Timor-Leste 54 51<br />
Turkmenistan 53 54<br />
Bolivia (Plurinational <strong>State</strong> <strong>of</strong>) 51 55<br />
Uzbekistan 49 56<br />
Nepal 48 57<br />
Kiribati 47 58<br />
South Africa 47 58<br />
Bangladesh 46 60<br />
Azerbaijan 45 61<br />
Cambodia 43 62<br />
Lao People’s Democratic Republic 42 63<br />
Micronesia (Federated <strong>State</strong>s <strong>of</strong>) 42 63<br />
Namibia 42 63<br />
Nauru 40 66<br />
Under-5<br />
mortality<br />
rate (2011)<br />
Countries and areas<br />
Value Rank<br />
Iraq 38 67<br />
Guyana 36 68<br />
Democratic People’s Republic <strong>of</strong> Korea 33 69<br />
Morocco 33 69<br />
Indonesia 32 71<br />
Kyrgyzstan 31 72<br />
Mongolia 31 72<br />
Algeria 30 74<br />
Guatemala 30 74<br />
Suriname 30 74<br />
Tuvalu 30 74<br />
Kazakhstan 28 78<br />
Trinidad and Tobago 28 78<br />
Botswana 26 80<br />
Marshall Islands 26 80<br />
Nicaragua 26 80<br />
Dominican Republic 25 83<br />
Iran (Islamic Republic <strong>of</strong>) 25 83<br />
Philippines 25 83<br />
Ecuador 23 86<br />
<strong>State</strong> <strong>of</strong> Palestine 22 87<br />
Paraguay 22 87<br />
Solomon Islands 22 87<br />
Viet Nam 22 87<br />
Cape Verde 21 91<br />
Egypt 21 91<br />
Georgia 21 91<br />
Honduras 21 91<br />
Jordan 21 91<br />
Niue 21 91<br />
Saint Vincent and <strong>the</strong> Grenadines 21 91<br />
Barbados 20 98<br />
Panama 20 98<br />
Palau 19 100<br />
Samoa 19 100<br />
Armenia 18 102<br />
Colombia 18 102<br />
Jamaica 18 102<br />
Peru 18 102<br />
Belize 17 106<br />
Bahamas 16 107<br />
Brazil 16 107<br />
Fiji 16 107<br />
Libya 16 107<br />
Mexico 16 107<br />
Republic <strong>of</strong> Moldova 16 107<br />
Saint Lucia 16 107<br />
Tunisia 16 107<br />
China 15 115<br />
El Salvador 15 115<br />
Mauritius 15 115<br />
Syrian Arab Republic 15 115<br />
Tonga 15 115<br />
Turkey 15 115<br />
Venezuela (Bolivarian Republic <strong>of</strong>) 15 115<br />
Albania 14 122<br />
Argentina 14 122<br />
Seychelles 14 122<br />
Grenada 13 125<br />
Romania 13 125<br />
Vanuatu 13 125<br />
Bulgaria 12 128<br />
Dominica 12 128<br />
Russian Federation 12 128<br />
Sri Lanka 12 128<br />
Thailand 12 128<br />
Under-5<br />
mortality<br />
rate (2011)<br />
Countries and areas<br />
Value Rank<br />
Kuwait 11 133<br />
Maldives 11 133<br />
Bahrain 10 135<br />
Cook Islands 10 135<br />
Costa Rica 10 135<br />
The former Yugoslav Republic <strong>of</strong> Macedonia 10 135<br />
Ukraine 10 135<br />
Uruguay 10 135<br />
Chile 9 141<br />
Lebanon 9 141<br />
Oman 9 141<br />
Saudi Arabia 9 141<br />
Antigua and Barbuda 8 145<br />
Bosnia and Herzegovina 8 145<br />
Latvia 8 145<br />
Qatar 8 145<br />
Slovakia 8 145<br />
United <strong>State</strong>s 8 145<br />
Brunei Darussalam 7 151<br />
Malaysia 7 151<br />
Montenegro 7 151<br />
Saint Kitts and Nevis 7 151<br />
Serbia 7 151<br />
United Arab Emirates 7 151<br />
Belarus 6 157<br />
Canada 6 157<br />
Cuba 6 157<br />
Hungary 6 157<br />
Lithuania 6 157<br />
Malta 6 157<br />
New Zealand 6 157<br />
Poland 6 157<br />
Australia 5 165<br />
Croatia 5 165<br />
Republic <strong>of</strong> Korea 5 165<br />
United Kingdom 5 165<br />
Austria 4 169<br />
Belgium 4 169<br />
Czech Republic 4 169<br />
Denmark 4 169<br />
Estonia 4 169<br />
France 4 169<br />
Germany 4 169<br />
Greece 4 169<br />
Ireland 4 169<br />
Israel 4 169<br />
Italy 4 169<br />
Monaco 4 169<br />
Ne<strong>the</strong>rlands 4 169<br />
Spain 4 169<br />
Switzerland 4 169<br />
Andorra 3 184<br />
Cyprus 3 184<br />
Finland 3 184<br />
Iceland 3 184<br />
Japan 3 184<br />
Luxembourg 3 184<br />
Norway 3 184<br />
Portugal 3 184<br />
Singapore 3 184<br />
Slovenia 3 184<br />
Sweden 3 184<br />
San Marino 2 195<br />
Holy See – –<br />
Liechtenstein – –<br />
1<br />
Due to <strong>the</strong> cession in July 2011 <strong>of</strong> <strong>the</strong> Republic <strong>of</strong> South Sudan by <strong>the</strong> Republic <strong>of</strong> <strong>the</strong> Sudan, and its subsequent admission to <strong>the</strong> United Nations on 14 July 2011, disaggregated data for <strong>the</strong><br />
Sudan and South Sudan as separate <strong>State</strong>s are not yet available for all indicators. Aggregated data presented are for <strong>the</strong> Sudan pre-cession, and <strong>the</strong>se data are included in <strong>the</strong> averages for <strong>the</strong><br />
Eastern and Sou<strong>the</strong>rn Africa, Middle East and North Africa, and sub-Saharan Africa regions as well as <strong>the</strong> least developed countries/areas category. For <strong>the</strong> purposes <strong>of</strong> this report, South Sudan<br />
is designated as a least developed country.<br />
STATISTICAL TABLES 99
TABLE 1: BASIC INdICATORS<br />
Countries<br />
and areas<br />
Under-5<br />
mortality<br />
rank<br />
Under-5 mortality rate<br />
(U5MR)<br />
U5MR by sex<br />
2011<br />
Infant mortality rate<br />
(under 1)<br />
1990 2011 male female 1990 2011<br />
Afghanistan 23 192 101 103 99 129 73 36 32,358 1,408 128 410 x 49 – –<br />
Albania 122 41 14 15 14 36 13 7 3,216 41 1 3,980 77 96 80<br />
Algeria 74 66 30 32 28 54 26 17 35,980 712 21 4,470 73 73 97<br />
Andorra 184 8 3 4 3 7 3 1 86 − 0 41,750 x – – 79<br />
Angola 8 243 158 165 150 144 96 43 19,618 803 120 4,060 51 70 86<br />
Antigua and Barbuda 145 27 8 9 7 23 6 4 90 − 0 12,060 – 99 88<br />
Argentina 122 28 14 16 13 24 13 8 40,765 693 10 9,740 76 98 –<br />
Armenia 102 47 18 19 15 40 16 11 3,100 47 1 3,360 74 100 –<br />
Australia 165 9 5 5 4 8 4 3 22,606 307 1 46,200 x 82 – 97<br />
Austria 169 9 4 5 4 8 4 3 8,413 74 0 48,300 81 – –<br />
Azerbaijan 61 95 45 47 43 75 39 19 9,306 184 8 5,290 71 100 85<br />
Bahamas 107 22 16 17 15 18 14 7 347 5 0 21,970 x 76 – 98<br />
Bahrain 135 21 10 10 10 18 9 4 1,324 23 0 15,920 x 75 92 –<br />
Bangladesh 60 139 46 48 44 97 37 26 150,494 3,016 134 770 69 57 –<br />
Barbados 98 18 20 22 18 16 18 10 274 3 0 12,660 x 77 – 95<br />
Belarus 157 17 6 6 5 14 4 3 9,559 107 1 5,830 70 100 92<br />
Belgium 169 10 4 5 4 9 4 2 10,754 123 1 46,160 80 – 99<br />
Belize 106 44 17 19 15 35 15 8 318 8 0 3,690 76 – 97<br />
Benin 20 177 106 109 103 107 68 31 9,100 356 36 780 56 42 94<br />
Bhutan 51 138 54 57 50 96 42 25 738 15 1 2,070 67 53 x 90<br />
Bolivia (Plurinational<br />
<strong>State</strong> <strong>of</strong>) 55 120 51 54 48 83 39 22 10,088 264 13 2,040 67 91 –<br />
Bosnia and Herzegovina 145 19 8 9 7 17 7 5 3,752 32 0 4,780 76 98 87<br />
Botswana 80 53 26 28 24 41 20 11 2,031 47 1 7,480 53 84 87<br />
Brazil 107 58 16 17 14 49 14 10 196,655 2,996 44 10,720 73 90 –<br />
Brunei Darussalam 151 12 7 8 7 9 6 4 406 8 0 31,800 x 78 95 –<br />
Bulgaria 128 22 12 13 11 19 11 7 7,446 75 1 6,550 73 98 100<br />
Burkina Faso 9 208 146 151 142 105 82 34 16,968 730 101 570 55 29 58<br />
Burundi 10 183 139 145 133 110 86 43 8,575 288 39 250 50 67 –<br />
Cambodia 62 117 43 47 37 85 36 19 14,305 317 13 830 63 74 96<br />
Cameroon 11 145 127 135 120 90 79 33 20,030 716 88 1,210 52 71 94<br />
Canada 157 8 6 6 5 7 5 4 34,350 388 2 45,560 81 – –<br />
Cape Verde 91 58 21 23 20 45 18 10 501 10 0 3,540 74 84 93<br />
Central African Republic 6 169 164 170 157 112 108 46 4,487 156 25 470 48 56 71<br />
Chad 4 208 169 177 160 113 97 42 11,525 511 79 690 50 34 –<br />
Chile 141 19 9 10 8 16 8 5 17,270 245 2 12,280 79 99 94<br />
China 115 49 15 15 14 39 13 9 1,347,565 16,364 249 4,930 73 94 100 z<br />
Colombia 102 34 18 20 16 28 15 11 46,927 910 16 6,110 74 93 92<br />
Comoros 33 122 79 85 74 86 59 32 754 28 2 770 61 75 –<br />
Congo 25 119 99 103 94 75 64 32 4,140 145 14 2,270 57 – 91<br />
Cook Islands 135 19 10 11 8 16 8 5 20 − 0 − – – 98<br />
Costa Rica 135 17 10 11 9 15 9 6 4,727 73 1 7,660 79 96 –<br />
Côte d’Ivoire 17 151 115 125 105 104 81 41 20,153 679 75 1,100 55 56 61<br />
Croatia 165 13 5 6 5 11 4 3 4,396 43 0 13,850 77 99 96<br />
Cuba 157 13 6 6 5 11 5 3 11,254 110 1 5,460 x 79 100 100<br />
Cyprus 184 11 3 3 3 10 3 1 1,117 13 0 29,450 x 80 98 99<br />
Czech Republic 169 14 4 4 4 13 3 2 10,534 116 0 18,520 78 – –<br />
Democratic People’s<br />
Republic <strong>of</strong> Korea 69 45 33 35 32 23 26 18 24,451 348 12 d 69 100 –<br />
Democratic Republic<br />
<strong>of</strong> <strong>the</strong> Congo 5 181 168 178 158 117 111 47 67,758 2,912 465 190 48 67 –<br />
Denmark 169 9 4 4 3 7 3 2 5,573 64 0 60,390 79 – 96<br />
Djibouti 26 122 90 95 84 94 72 33 906 26 2 1,270 x 58 – 45<br />
Dominica 128 17 12 13 11 14 11 8 68 − 0 7,090 – – 98<br />
Dominican Republic 83 58 25 27 23 45 21 14 10,056 216 5 5,240 73 90 93<br />
Ecuador 86 52 23 25 21 41 20 10 14,666 298 7 4,140 76 92 98<br />
Egypt 91 86 21 22 20 63 18 7 82,537 1,886 40 2,600 73 72 96<br />
El Salvador 115 60 15 17 14 47 13 6 6,227 126 2 3,480 72 84 95<br />
Equatorial Guinea 16 190 118 124 112 118 80 37 720 26 3 14,540 51 94 56<br />
Eritrea 41 138 68 74 61 86 46 22 5,415 193 13 430 62 68 35<br />
Estonia 169 20 4 4 3 16 3 2 1,341 16 0 15,200 75 100 96<br />
Ethiopia 36 198 77 82 72 118 52 31 84,734 2,613 194 400 59 39 82<br />
Fiji 107 30 16 18 15 25 14 8 868 18 0 3,680 69 – 99<br />
Finland 184 7 3 3 3 6 2 2 5,385 61 0 48,420 80 – 98<br />
France 169 9 4 5 4 7 3 2 63,126 792 3 42,420 82 – 99<br />
Gabon 44 94 66 72 59 69 49 25 1,534 42 3 7,980 63 88 –<br />
Neonatal<br />
mortality<br />
rate<br />
2011<br />
Total<br />
population<br />
(thousands)<br />
2011<br />
Annual no.<br />
<strong>of</strong> births<br />
(thousands)<br />
2011<br />
Annual no.<br />
<strong>of</strong> under-5<br />
deaths<br />
(thousands)<br />
2011<br />
GNI per<br />
capita (US$)<br />
2011<br />
Life<br />
expectancy<br />
at birth<br />
(years)<br />
2011<br />
Total adult<br />
literacy rate<br />
(%)<br />
2007–2011*<br />
Primary<br />
school net<br />
enrolment<br />
ratio (%)<br />
2008–2011*<br />
100<br />
THE STATE OF THE WORLD’S CHILDREN <strong>2013</strong>: <strong>Children</strong> with Disabilities
TABLE 1<br />
BASIC INdICATORS<br />
Countries<br />
and areas<br />
Under-5<br />
mortality<br />
rank<br />
Under-5 mortality rate<br />
(U5MR)<br />
U5MR by sex<br />
2011<br />
Infant mortality rate<br />
(under 1)<br />
1990 2011 male female 1990 2011<br />
Gambia 23 165 101 107 94 78 58 34 1,776 67 6 610 58 50 69<br />
Georgia 91 47 21 23 18 40 18 15 4,329 51 1 2,860 74 100 100<br />
Germany 169 9 4 4 4 7 3 2 82,163 699 3 43,980 80 – 100<br />
Ghana 34 121 78 83 72 76 52 30 24,966 776 60 1,410 64 67 84<br />
Greece 169 13 4 5 4 12 4 3 11,390 117 1 25,030 80 97 –<br />
Grenada 125 21 13 13 12 17 10 7 105 2 0 7,220 76 – 97<br />
Guatemala 74 78 30 33 28 56 24 15 14,757 473 14 2,870 71 75 99<br />
Guinea 12 228 126 128 123 135 79 39 10,222 394 48 440 54 41 77<br />
Guinea-Bissau 7 210 161 174 147 125 98 44 1,547 59 9 600 48 54 75<br />
Guyana 68 63 36 40 32 48 29 20 756 13 0 2,900 x 70 – 84<br />
Haiti 40 143 70 74 66 99 53 25 10,124 266 19 700 62 49 x –<br />
Holy See – – – – – – – – 0 – – – – – –<br />
Honduras 91 55 21 23 20 43 18 11 7,755 205 4 1,970 73 85 96<br />
Hungary 157 19 6 7 6 17 5 4 9,966 100 1 12,730 74 99 98<br />
Iceland 184 6 3 3 2 5 2 1 324 5 0 35,020 82 – 99<br />
India 49 114 61 59 64 81 47 32 1,241,492 27,098 1,655 1,410 65 63 98<br />
Indonesia 71 82 32 34 29 54 25 15 242,326 4,331 134 2,940 69 93 99<br />
Iran (Islamic Republic <strong>of</strong>) 83 61 25 25 25 47 21 14 74,799 1,255 33 4,520 x 73 85 –<br />
Iraq 67 46 38 41 35 37 31 20 32,665 1,144 42 2,640 69 78 –<br />
Ireland 169 9 4 4 4 8 3 2 4,526 72 0 38,580 81 – 100<br />
Israel 169 12 4 5 4 10 4 2 7,562 156 1 28,930 82 – 97<br />
Italy 169 10 4 4 3 8 3 2 60,789 557 2 35,330 82 99 99<br />
Jamaica 102 35 18 21 16 28 16 11 2,751 50 1 4,980 73 87 82<br />
Japan 184 6 3 4 3 5 2 1 126,497 1,073 4 45,180 83 – 100<br />
Jordan 91 37 21 22 19 31 18 12 6,330 154 3 4,380 73 93 91<br />
Kazakhstan 78 57 28 32 24 48 25 14 16,207 345 11 8,220 67 100 100<br />
Kenya 38 98 73 78 67 64 48 27 41,610 1,560 107 820 57 87 84<br />
Kiribati 58 88 47 50 45 64 38 19 101 – 0 2,110 – – –<br />
Kuwait 133 17 11 12 10 14 9 5 2,818 50 1 48,900 x 75 94 98<br />
Kyrgyzstan 72 70 31 34 28 58 27 16 5,393 131 4 920 68 99 95<br />
Lao People’s<br />
Democratic Republic 63 148 42 44 39 102 34 18 6,288 140 6 1,130 67 73 x 97<br />
Latvia 145 21 8 9 8 17 7 5 2,243 24 0 12,350 73 100 96<br />
Lebanon 141 33 9 10 9 27 8 5 4,259 65 1 9,110 73 90 93<br />
Lesotho 29 88 86 93 79 71 63 39 2,194 60 5 1,220 48 90 74<br />
Liberia 34 241 78 83 74 161 58 27 4,129 157 12 240 57 61 –<br />
Libya 107 44 16 17 16 33 13 10 6,423 144 2 12,320 x 75 89 –<br />
Liechtenstein – – – – – – – – 36 – – 137,070 x – – 99<br />
Lithuania 157 17 6 6 5 14 5 3 3,307 35 0 12,280 72 100 96<br />
Luxembourg 184 8 3 3 3 7 2 2 516 6 0 78,130 80 – 97<br />
Madagascar 47 161 62 65 58 98 43 23 21,315 747 45 430 67 64 –<br />
Malawi 31 227 83 87 79 134 53 27 15,381 686 52 340 54 75 97<br />
Malaysia 151 17 7 7 6 15 6 3 28,859 579 4 8,420 74 93 –<br />
Maldives 133 105 11 12 10 76 9 7 320 5 0 6,530 77 98 x 97<br />
Mali 3 257 176 182 169 132 98 49 15,840 728 121 610 51 31 66<br />
Malta 157 11 6 7 5 10 5 4 418 4 0 18,620 x 80 92 x 94<br />
Marshall Islands 80 52 26 29 23 41 22 12 55 − 0 3,910 – – 99<br />
Mauritania 18 125 112 120 104 81 76 40 3,542 118 13 1,000 59 58 74<br />
Mauritius 115 24 15 16 14 21 13 9 1,307 16 0 8,240 73 89 93<br />
Mexico 107 49 16 17 14 38 13 7 114,793 2,195 34 9,240 77 93 100<br />
Micronesia<br />
(Federated <strong>State</strong>s <strong>of</strong>) 63 56 42 47 36 44 34 17 112 3 0 2,900 69 – –<br />
Monaco 169 8 4 4 3 6 3 2 35 − 0 183,150 x – – –<br />
Mongolia 72 107 31 35 26 76 26 12 2,800 65 2 2,320 68 97 99<br />
Montenegro 151 18 7 8 7 16 7 5 632 8 0 7,060 75 98 83<br />
Morocco 69 81 33 35 30 64 28 19 32,273 620 21 2,970 72 56 94<br />
Mozambique 22 226 103 107 99 151 72 34 23,930 889 86 470 50 56 92<br />
Myanmar 47 107 62 69 56 77 48 30 48,337 824 53 d 65 92 –<br />
Namibia 63 73 42 45 38 49 30 18 2,324 60 2 4,700 62 89 86<br />
Nauru 66 40 40 56 24 32 32 22 10 − 0 − – – –<br />
Nepal 57 135 48 49 47 94 39 27 30,486 722 34 540 69 60 –<br />
Ne<strong>the</strong>rlands 169 8 4 4 4 7 3 3 16,665 181 1 49,730 81 – 100<br />
New Zealand 157 11 6 7 5 9 5 3 4,415 64 0 29,350 x 81 – 99<br />
Nicaragua 80 66 26 29 22 50 22 13 5,870 138 4 1,170 74 78 x 94<br />
Niger 13 314 125 127 122 133 66 32 16,069 777 89 360 55 29 x 58<br />
Neonatal<br />
mortality<br />
rate<br />
2011<br />
Total<br />
population<br />
(thousands)<br />
2011<br />
Annual no.<br />
<strong>of</strong> births<br />
(thousands)<br />
2011<br />
Annual no.<br />
<strong>of</strong> under-5<br />
deaths<br />
(thousands)<br />
2011<br />
GNI per<br />
capita (US$)<br />
2011<br />
Life<br />
expectancy<br />
at birth<br />
(years)<br />
2011<br />
Total adult<br />
literacy rate<br />
(%)<br />
2007–2011*<br />
Primary<br />
school net<br />
enrolment<br />
ratio (%)<br />
2008–2011*<br />
STATISTICAL TABLES 101
TABLE 1<br />
BASIC INdICATORS<br />
Countries<br />
and areas<br />
Under-5<br />
mortality<br />
rank<br />
Under-5 mortality rate<br />
(U5MR)<br />
U5MR by sex<br />
2011<br />
Infant mortality rate<br />
(under 1)<br />
1990 2011 male female 1990 2011<br />
Nigeria 14 214 124 129 119 127 78 39 162,471 6,458 756 1,200 52 61 58<br />
Niue 91 14 21 21 21 12 18 10 1 – 0 – – – –<br />
Norway 184 8 3 3 3 7 3 2 4,925 61 0 88,890 81 – 99<br />
Oman 141 48 9 9 8 36 7 5 2,846 50 0 19,260 x 73 87 98<br />
Pakistan 39 122 72 76 68 95 59 36 176,745 4,764 352 1,120 65 55 74<br />
Palau 100 32 19 23 14 27 14 9 21 – 0 7,250 – – –<br />
Panama 98 33 20 21 18 26 17 9 3,571 70 1 7,910 76 94 99<br />
Papua New Guinea 50 88 58 60 55 64 45 23 7,014 208 12 1,480 63 61 –<br />
Paraguay 87 53 22 25 20 41 19 13 6,568 158 3 2,970 72 94 86<br />
Peru 102 75 18 20 17 54 14 9 29,400 591 11 5,500 74 90 98<br />
Philippines 83 57 25 29 22 40 20 12 94,852 2,358 57 2,210 69 95 89<br />
Poland 157 17 6 6 5 15 5 4 38,299 410 2 12,480 76 100 96<br />
Portugal 184 15 3 4 3 11 3 2 10,690 97 0 21,250 79 95 99<br />
Qatar 145 20 8 8 7 17 6 4 1,870 21 0 80,440 78 96 96<br />
Republic <strong>of</strong> Korea 165 8 5 5 4 6 4 2 48,391 479 3 20,870 81 – 99<br />
Republic <strong>of</strong> Moldova 107 35 16 17 15 29 14 8 3,545 44 1 1,980 69 99 90<br />
Romania 125 37 13 14 11 31 11 8 21,436 221 3 7,910 74 98 88<br />
Russian Federation 128 27 12 13 10 23 10 7 142,836 1,689 20 10,400 69 100 96<br />
Rwanda 51 156 54 57 51 95 38 21 10,943 449 23 570 55 71 99<br />
Saint Kitts and Nevis 151 28 7 8 6 22 6 5 53 – 0 12,480 – – 86<br />
Saint Lucia 107 23 16 17 14 18 14 9 176 3 0 6,680 75 – 90<br />
Saint Vincent and<br />
<strong>the</strong> Grenadines 91 27 21 23 19 21 20 13 109 2 0 6,100 72 – 98<br />
Samoa 100 30 19 21 16 25 16 8 184 4 0 3,190 72 99 95<br />
San Marino 195 12 2 2 2 11 2 1 32 – 0 50,400 x – – 92<br />
Sao Tome and Principe 28 96 89 92 86 62 58 29 169 5 0 1,360 65 89 99<br />
Saudi Arabia 141 43 9 10 8 34 8 5 28,083 605 6 17,820 74 87 90<br />
Senegal 45 136 65 69 60 69 47 26 12,768 471 30 1,070 59 50 78<br />
Serbia 151 29 7 8 6 25 6 4 9,854 110 1 5,680 75 98 95<br />
Seychelles 122 17 14 15 13 14 12 9 87 − 0 11,130 – 92 –<br />
Sierra Leone 1 267 185 194 176 158 119 49 5,997 227 42 340 48 42 –<br />
Singapore 184 8 3 3 2 6 2 1 5,188 47 0 42,930 81 96 –<br />
Slovakia 145 18 8 9 7 16 7 4 5,472 58 0 16,070 75 – –<br />
Slovenia 184 10 3 3 3 9 2 2 2,035 20 0 23,610 79 100 97<br />
Solomon Islands 87 42 22 21 22 34 18 11 552 17 0 1,110 68 – –<br />
Somalia 2 180 180 190 170 108 108 50 9,557 416 71 d 51 – –<br />
South Africa 58 62 47 50 44 48 35 19 50,460 1,052 47 6,960 53 89 90<br />
South Sudan s 15 217 121 122 119 129 76 38 10,314 − 43 a – – –<br />
Spain 169 11 4 5 4 9 4 3 46,455 499 2 30,990 81 98 100<br />
Sri Lanka 128 29 12 13 11 24 11 8 21,045 373 5 2,580 75 91 94<br />
<strong>State</strong> <strong>of</strong> Palestine 87 43 22 23 21 36 20 13 4,152 137 3 a 73 95 89<br />
Sudan s 29 123 86 91 81 77 57 31 34,318 − 95 − – – –<br />
Suriname 74 52 30 33 26 44 26 16 529 10 0 7,640 x 71 95 91<br />
Swaziland 21 83 104 113 94 61 69 35 1,203 35 4 3,300 49 87 86<br />
Sweden 184 7 3 3 3 6 2 2 9,441 113 0 53,230 81 – 99<br />
Switzerland 169 8 4 5 4 7 4 3 7,702 77 0 76,380 82 – 99<br />
Syrian Arab Republic 115 36 15 16 14 30 13 9 20,766 466 7 2,750 x 76 83 99<br />
Tajikistan 46 114 63 70 56 89 53 25 6,977 194 12 870 68 100 98<br />
Thailand 128 35 12 13 11 29 11 8 69,519 824 10 4,420 74 94 x 90<br />
The former Yugoslav<br />
Republic <strong>of</strong> Macedonia 135 38 10 11 9 34 9 6 2,064 22 0 4,730 75 97 98<br />
Timor-Leste 51 180 54 57 51 135 46 24 1,154 44 2 2,730 x 62 58 86<br />
Togo 19 147 110 118 102 85 73 36 6,155 195 21 560 57 57 94<br />
Tonga 115 25 15 18 13 21 13 8 105 3 0 3,580 72 99 x –<br />
Trinidad and Tobago 78 37 28 31 24 32 25 18 1,346 20 1 15,040 70 99 97<br />
Tunisia 107 51 16 18 15 40 14 10 10,594 179 3 4,070 75 78 99<br />
Turkey 115 72 15 16 14 60 12 9 73,640 1,289 20 10,410 74 91 97<br />
Turkmenistan 54 94 53 57 48 75 45 22 5,105 109 5 4,110 65 100 –<br />
Tuvalu 74 58 30 33 27 45 25 14 10 − 0 5,010 – – –<br />
Uganda 26 178 90 97 83 106 58 28 34,509 1,545 131 510 54 73 91<br />
Ukraine 135 19 10 11 9 17 9 5 45,190 494 5 3,120 68 100 91<br />
United Arab Emirates 151 22 7 7 6 19 6 4 7,891 94 1 40,760 77 90 x –<br />
United Kingdom 165 9 5 6 5 8 4 3 62,417 761 4 37,780 80 – 100<br />
United Republic<br />
<strong>of</strong> Tanzania 41 158 68 70 65 97 45 25 46,218 1,913 122 540 58 73 98<br />
United <strong>State</strong>s 145 11 8 8 7 9 6 4 313,085 4,322 32 48,450 79 – 96<br />
Neonatal<br />
mortality<br />
rate<br />
2011<br />
Total<br />
population<br />
(thousands)<br />
2011<br />
Annual no.<br />
<strong>of</strong> births<br />
(thousands)<br />
2011<br />
Annual no.<br />
<strong>of</strong> under-5<br />
deaths<br />
(thousands)<br />
2011<br />
GNI per<br />
capita (US$)<br />
2011<br />
Life<br />
expectancy<br />
at birth<br />
(years)<br />
2011<br />
Total adult<br />
literacy rate<br />
(%)<br />
2007–2011*<br />
Primary<br />
school net<br />
enrolment<br />
ratio (%)<br />
2008–2011*<br />
102<br />
THE STATE OF THE WORLD’S CHILDREN <strong>2013</strong>: <strong>Children</strong> with Disabilities
TABLE 1<br />
BASIC INdICATORS<br />
Countries<br />
and areas<br />
Under-5<br />
mortality<br />
rank<br />
Under-5 mortality rate<br />
(U5MR)<br />
U5MR by sex<br />
2011<br />
Infant mortality rate<br />
(under 1)<br />
1990 2011 male female 1990 2011<br />
Uruguay 135 23 10 11 9 20 9 5 3,380 49 1 11,860 77 98 99<br />
Uzbekistan 56 75 49 55 42 62 42 15 27,760 589 30 1,510 68 99 92<br />
Vanuatu 125 39 13 14 12 31 11 7 246 7 0 2,870 71 83 –<br />
Venezuela<br />
(Bolivarian Republic <strong>of</strong>) 115 31 15 17 13 26 13 8 29,437 598 9 11,920 74 96 95<br />
Viet Nam 87 50 22 25 19 36 17 12 88,792 1,458 32 1,260 75 93 98<br />
Yemen 36 126 77 80 73 89 57 32 24,800 940 70 1,070 65 64 78<br />
Zambia 31 193 83 86 80 114 53 27 13,475 622 46 1,160 49 71 93<br />
Zimbabwe 43 79 67 73 61 53 43 30 12,754 377 24 640 51 – –<br />
Neonatal<br />
mortality<br />
rate<br />
2011<br />
Total<br />
population<br />
(thousands)<br />
2011<br />
Annual no.<br />
<strong>of</strong> births<br />
(thousands)<br />
2011<br />
Annual no.<br />
<strong>of</strong> under-5<br />
deaths<br />
(thousands)<br />
2011<br />
GNI per<br />
capita (US$)<br />
2011<br />
Life<br />
expectancy<br />
at birth<br />
(years)<br />
2011<br />
Total adult<br />
literacy rate<br />
(%)<br />
2007–2011*<br />
Primary<br />
school net<br />
enrolment<br />
ratio (%)<br />
2008–2011*<br />
MEMORANDUM<br />
Sudan and<br />
South Sudan s – – – – – – – – – 1,447 – 1,300 x 61 – –<br />
SUMMARY INDICATORS #<br />
Sub-Saharan Africa 178 109 114 103 107 69 34 876,497 32,584 3,370 1,269 55 63 76<br />
Eastern and<br />
Sou<strong>the</strong>rn Africa 162 84 89 79 100 55 29 418,709 14,399 1,177 1,621 56 68 86<br />
West and<br />
Central Africa 197 132 138 126 116 83 39 422,564 16,712 2,096 937 53 57 67<br />
Middle East and<br />
North Africa 72 36 38 34 54 28 16 415,633 10,017 351 6,234 71 77 90<br />
South Asia 119 62 61 63 85 48 32 1,653,679 37,402 2,309 1,319 66 62 92<br />
East Asia and Pacific 55 20 21 19 41 17 11 2,032,532 28,448 590 4,853 73 94 96<br />
Latin America<br />
and Caribbean 53 19 21 17 42 16 10 591,212 10,790 203 8,595 74 91 95<br />
CEE/CIS 48 21 23 19 40 18 10 405,743 5,823 125 7,678 70 98 95<br />
Least developed<br />
countries 171 98 102 93 107 65 33 851,103 28,334 2,649 695 59 60 80<br />
World 87 51 53 50 61 37 22 6,934,761 135,056 6,914 9,513 69 84 91<br />
s Due to <strong>the</strong> cession in July 2011 <strong>of</strong> <strong>the</strong> Republic <strong>of</strong> South Sudan by <strong>the</strong> Republic <strong>of</strong> <strong>the</strong> Sudan, and its subsequent admission to <strong>the</strong> United Nations on 14 July 2011, disaggregated data for <strong>the</strong> Sudan<br />
and South Sudan as separate <strong>State</strong>s are not yet available for all indicators. Aggregated data presented are for <strong>the</strong> Sudan pre-cession (see Memorandum item).<br />
# For a complete list <strong>of</strong> countries and areas in <strong>the</strong> regions, subregions and country categories, see page 98.<br />
DEFINITIONS OF THE INDICATORS<br />
Under-5 mortality rate – Probability <strong>of</strong> dying between birth and exactly 5 years <strong>of</strong> age,<br />
expressed per 1,000 live births.<br />
Infant mortality rate – Probability <strong>of</strong> dying between birth and exactly 1 year <strong>of</strong> age, expressed<br />
per 1,000 live births.<br />
Neonatal mortality rate – Probability <strong>of</strong> dying during <strong>the</strong> first 28 completed days <strong>of</strong> life,<br />
expressed per 1,000 live births.<br />
GNI per capita – Gross national income (GNI) is <strong>the</strong> sum <strong>of</strong> value added by all resident<br />
producers, plus any product taxes (less subsidies) not included in <strong>the</strong> valuation <strong>of</strong> output, plus<br />
net receipts <strong>of</strong> primary income (compensation <strong>of</strong> employees and property income) from abroad.<br />
GNI per capita is GNI divided by midyear population. GNI per capita in US dollars is converted<br />
using <strong>the</strong> World Bank Atlas method.<br />
Life expectancy at birth – Number <strong>of</strong> years newborn children would live if subject to <strong>the</strong><br />
mortality risks prevailing for <strong>the</strong> cross section <strong>of</strong> population at <strong>the</strong> time <strong>of</strong> <strong>the</strong>ir birth.<br />
Total adult literacy rate – Number <strong>of</strong> literate persons aged 15 and above, expressed as a<br />
percentage <strong>of</strong> <strong>the</strong> total population in that age group.<br />
Primary school net enrolment ratio – Number <strong>of</strong> children enrolled in primary or secondary<br />
school who are <strong>of</strong> <strong>of</strong>ficial primary school age, expressed as a percentage <strong>of</strong> <strong>the</strong> total number <strong>of</strong><br />
children <strong>of</strong> <strong>of</strong>ficial primary school age. Because <strong>of</strong> <strong>the</strong> inclusion <strong>of</strong> primary-school-aged children<br />
enrolled in secondary school, this indicator can also be referred to as a primary adjusted net<br />
enrolment ratio.<br />
MAIN DATA SOURCES<br />
Under-5 and infant mortality rates – United Nations Inter-agency Group for Child Mortality<br />
Estimation (UNICEF, World Health Organization, United Nations Population Division and <strong>the</strong><br />
World Bank).<br />
Neonatal mortality rate – World Health Organization, using civil registrations, surveillance<br />
systems and household surveys.<br />
Total population and births – United Nations Population Division.<br />
Under-5 deaths – United Nations Inter-agency Group for Child Mortality Estimation (UNICEF,<br />
World Health Organization, United Nations Population Division and <strong>the</strong> World Bank).<br />
GNI per capita – The World Bank.<br />
Life expectancy at birth – United Nations Population Division.<br />
Total adult literacy rate and primary school net enrolment ratio – UNESCO Institute for<br />
Statistics.<br />
NOTES<br />
a low-income country (GNI per capita is $1,025 or less).<br />
b lower-middle-income country (GNI per capita is $1,026 to $4,035).<br />
c upper-middle-income country (GNI per capita is $4,036 to $12,475).<br />
d high-income country (GNI per capita is $12,476 or more).<br />
− Data not available.<br />
x Data refer to years or periods o<strong>the</strong>r than those specified in <strong>the</strong> column heading. Such data<br />
are not included in <strong>the</strong> calculation <strong>of</strong> regional and global averages.<br />
z Data provided by <strong>the</strong> Chinese Ministry <strong>of</strong> Education. The UNESCO Institute for Statistics<br />
dataset does not currently include net enrolment rates for China.<br />
* Data refer to <strong>the</strong> most recent year available during <strong>the</strong> period specified in <strong>the</strong> column heading.<br />
STATISTICAL TABLES 103
TABLE 2: NuTRITION<br />
Countries<br />
and areas<br />
Low<br />
birthweight<br />
(%)<br />
2007–2011*<br />
Early<br />
initiation <strong>of</strong><br />
breastfeeding<br />
(%)<br />
2007–2011*<br />
Exclusive<br />
breastfeeding<br />
TABLE 2<br />
NuTRITION<br />
Countries<br />
and areas<br />
Low<br />
birthweight<br />
(%)<br />
2007–2011*<br />
Early<br />
initiation <strong>of</strong><br />
breastfeeding<br />
(%)<br />
2007–2011*<br />
Exclusive<br />
breastfeeding<br />
TABLE 2<br />
NuTRITION<br />
Countries<br />
and areas<br />
Low<br />
birthweight<br />
(%)<br />
2007–2011*<br />
Early<br />
initiation <strong>of</strong><br />
breastfeeding<br />
(%)<br />
2007–2011*<br />
Exclusive<br />
breastfeeding<br />
TABLE 2<br />
NuTRITION<br />
Countries<br />
and areas<br />
Low<br />
birthweight<br />
(%)<br />
2007–2011*<br />
Early<br />
initiation <strong>of</strong><br />
breastfeeding<br />
(%)<br />
2007–2011*<br />
Exclusive<br />
breastfeeding<br />
TABLE 3: HEALTH<br />
Countries<br />
Use <strong>of</strong> improved<br />
drinking water<br />
sources (%) 2010<br />
Use <strong>of</strong> improved<br />
sanitation facilities<br />
(%) 2010<br />
Routine<br />
EPI<br />
vaccines<br />
financed<br />
by govt.<br />
Immunization coverage (%)<br />
2011<br />
Pneumonia (%)<br />
2007–2012*<br />
Diarrhoea<br />
(%)<br />
2007–2012*<br />
Malaria (%)<br />
2007–2012*<br />
and areas<br />
(%)<br />
rehydration<br />
total urban rural total urban rural 2011 BCG DPT1 b DPT3 b Polio3 MCV HepB3 Hib3<br />
pneumonia salts (ORS)<br />
Afghanistan 50 78 42 37 60 30 – 68 86 66 66 62 66 66 60 61 64 53 – – –<br />
Albania 95 96 94 94 95 93 – 99 99 99 99 99 99 99 87 70 60 54 – – –<br />
Algeria 83 85 79 95 98 88 – 99 99 95 95 95 95 95 90 53 x 59 x 19 x – – –<br />
Andorra 100 100 100 100 100 100 – – 99 99 99 99 99 99 – – – – – – –<br />
Angola 51 60 38 58 85 19 – 88 99 86 85 88 86 86 70 – – – 28 26 35<br />
Antigua and Barbuda – 95 – – 98 – – – 99 99 99 99 99 99 – – – – – – –<br />
Argentina – 98 – – – – – 99 98 93 95 93 93 93 – – – – – – –<br />
Armenia 98 99 97 90 95 80 – 96 98 95 96 97 95 95 – 57 36 33 – – –<br />
Australia 100 100 100 100 100 100 – – 92 92 92 94 92 92 – – – – – – –<br />
Austria 100 100 100 100 100 100 – – 93 83 83 76 83 83 – – – – – – –<br />
Azerbaijan 80 88 71 82 86 78 78 82 79 74 80 67 48 38 – 36 x – 21 x 1 x 1 x –<br />
Bahamas – 98 – 100 100 100 – – 99 98 97 90 95 98 92 – – – – – –<br />
Bahrain – 100 – – 100 – 100 – 99 99 99 99 99 99 94 – – – – – –<br />
Bangladesh 81 85 80 56 57 55 30 95 99 96 96 96 96 96 94 35 71 78 – – –<br />
Barbados 100 100 100 100 100 100 – – 93 91 91 93 91 91 – – – – – – –<br />
Belarus 100 100 99 93 91 97 – 99 99 98 98 99 98 21 – 90 x 67 x 36 x – – –<br />
Belgium 100 100 100 100 100 100 – – 99 98 98 95 97 98 – – – – – – –<br />
Belize 98 98 99 90 93 87 – 98 98 95 95 98 95 95 88 71 x 44 x 27 x – – –<br />
Benin 75 84 68 13 25 5 17 97 94 85 85 72 85 85 92 31 – 50 38 71 80<br />
Bhutan 96 100 94 44 73 29 4 95 98 95 95 95 95 – 89 74 49 61 – – –<br />
Bolivia (Plurinational<br />
<strong>State</strong> <strong>of</strong>) 88 96 71 27 35 10 – 90 90 82 82 84 82 82 74 51 64 35 – – –<br />
Bosnia and Herzegovina 99 100 98 95 99 92 – 94 94 88 89 89 88 85 – 91 x 73 x 35 x – – –<br />
Botswana 96 99 92 62 75 41 100 99 98 96 96 94 93 96 92 14 x – 49 x – – –<br />
Brazil 98 100 85 79 85 44 – 99 99 96 97 97 96 97 92 50 – – – – –<br />
Brunei Darussalam – – – – – – – 96 99 97 99 91 93 96 95 – – – – – –<br />
Bulgaria 100 100 100 100 100 100 – 98 96 95 95 95 96 95 – – – – – – –<br />
Burkina Faso 79 95 73 17 50 6 32 99 93 91 90 63 91 91 88 56 47 21 35 47 57<br />
Burundi 72 83 71 46 49 46 3 90 99 96 94 92 96 96 80 55 43 38 17 45 52<br />
Cambodia 64 87 58 31 73 20 23 94 96 94 94 93 94 94 91 64 39 34 – 4 x 5 x<br />
Cameroon 77 95 52 49 58 36 9 80 90 66 67 76 66 66 75 30 – 17 21 21 36<br />
Canada 100 100 99 100 100 99 – – 98 95 99 98 70 95 – – – – – – –<br />
Cape Verde 88 90 85 61 73 43 100 99 99 90 90 96 90 90 92 – – – – – –<br />
Central African Republic 67 92 51 34 43 28 – 74 64 54 47 62 54 54 80 30 31 16 32 36 47<br />
Chad 51 70 44 13 30 6 11 53 45 22 31 28 22 22 60 26 31 13 36 10 42<br />
Chile 96 99 75 96 98 83 – 91 98 94 93 91 94 94 – – – – – – –<br />
China 91 98 85 64 74 56 100 99 99 99 99 99 99 – – – – – – – –<br />
Colombia 92 99 72 77 82 63 – 83 95 85 85 88 85 85 79 64 – 54 – – 3 x<br />
Comoros 95 91 97 36 50 30 – 76 94 83 85 72 83 83 85 56 x – 19 x 63 x 9 x –<br />
Congo 71 95 32 18 20 15 9 95 90 90 90 90 90 90 83 52 – 35 25 26 27<br />
Cook Islands – 98 – 100 100 100 – 98 98 93 93 89 93 93 – – – – – – –<br />
Costa Rica 97 100 91 95 95 96 – 78 87 85 82 83 84 81 – – – – – – –<br />
Côte d’Ivoire 80 91 68 24 36 11 30 74 75 62 58 49 62 62 82 38 – 17 18 39 68<br />
Croatia 99 100 97 99 99 98 – 99 97 96 96 96 97 96 – – – – – – –<br />
Cuba 94 96 89 91 94 81 – 99 96 96 99 99 96 96 – 97 70 51 – – –<br />
Cyprus 100 100 100 100 100 100 – – 99 99 99 87 96 96 – – – – – – –<br />
Czech Republic 100 100 100 98 99 97 – – 99 99 99 98 99 99 – – – – – – –<br />
Democratic People’s<br />
Republic <strong>of</strong> Korea 98 99 97 80 86 71 – 98 95 94 99 99 94 – 93 80 88 74 – – –<br />
Democratic Republic<br />
<strong>of</strong> <strong>the</strong> Congo 45 79 27 24 24 24 0 67 79 70 78 71 70 70 70 40 42 27 39 38 51<br />
Denmark 100 100 100 100 100 100 – – 94 91 91 87 – 91 – – – – – – –<br />
Djibouti 88 99 54 50 63 10 0 89 89 87 87 84 87 87 79 62 x 43 x 62 x 1 20 30<br />
Dominica – 96 – – – – – 99 99 98 99 99 98 98 – – – – – – –<br />
Dominican Republic 86 87 84 83 87 75 – 98 91 84 84 79 80 71 90 70 57 41 – – –<br />
Ecuador 94 96 89 92 96 84 – 99 99 99 99 98 98 99 85 – – – – – –<br />
Egypt 99 100 99 95 97 93 100 98 97 96 96 96 96 – 86 73 58 28 – – –<br />
El Salvador 88 94 76 87 89 83 – 91 90 89 89 89 90 90 88 67 51 58 – – –<br />
Equatorial Guinea – – – – – – 100 73 65 33 39 51 – – 75 – – 29 x 49 x 1 x –<br />
Eritrea – – – – – 4 3 99 99 99 99 99 99 99 93 44 x – 45 x 13 49 71<br />
Estonia 98 99 97 95 96 94 100 99 96 93 93 94 94 93 – – – – – – –<br />
Ethiopia 44 97 34 21 29 19 – 69 61 51 62 57 51 51 88 27 7 26 10 33 53<br />
Fiji 98 100 95 83 94 71 – 99 99 99 99 94 99 99 94 – – – – – –<br />
Finland 100 100 100 100 100 100 100 – 99 99 99 97 – 99 – – – – – – –<br />
Newborns<br />
protected<br />
against<br />
tetanus l<br />
Careseeking<br />
for<br />
suspected<br />
pneumonia<br />
Antibiotic<br />
treatment<br />
for<br />
suspected<br />
Treatment<br />
with oral<br />
Antimalarial<br />
treatment<br />
among<br />
febrile<br />
children<br />
<strong>Children</strong><br />
sleeping<br />
under<br />
ITNs<br />
Households<br />
with at<br />
least<br />
one ITN<br />
108<br />
THE STATE OF THE WORLD’S CHILDREN <strong>2013</strong>: <strong>Children</strong> with Disabilities
TABLE 3<br />
HEALTH<br />
Countries<br />
Use <strong>of</strong> improved<br />
drinking water<br />
sources (%) 2010<br />
Use <strong>of</strong> improved<br />
sanitation facilities<br />
(%) 2010<br />
Routine<br />
EPI<br />
vaccines<br />
financed<br />
by govt.<br />
Immunization coverage (%)<br />
2011<br />
Pneumonia (%)<br />
2007-2012*<br />
Diarrhoea<br />
(%)<br />
2007-2012*<br />
Malaria (%)<br />
2007-2012*<br />
and areas<br />
(%)<br />
rehydration<br />
total urban rural total urban rural 2011 BCG DPT1 b DPT3 b Polio3 MCV HepB3 Hib3<br />
pneumonia salts (ORS)<br />
France 100 100 100 100 100 100 – – 99 99 99 89 65 97 – – – – – – –<br />
Gabon 87 95 41 33 33 30 100 89 69 45 44 55 45 45 75 48 x – 25 x – 55 70<br />
Gambia 89 92 85 68 70 65 100 90 99 96 95 91 96 96 91 69 70 39 30 33 51<br />
Georgia 98 100 96 95 96 93 78 96 95 94 90 94 92 92 – 74 x 56 x 40 x – – –<br />
Germany 100 100 100 100 100 100 – – 99 99 95 99 93 93 – – – – – – –<br />
Ghana 86 91 80 14 19 8 – 98 94 91 91 91 91 91 88 41 56 35 53 39 48<br />
Greece 100 100 99 98 99 97 – 91 99 99 99 99 95 83 – – – – – – –<br />
Grenada – 97 – 97 96 97 – – 98 94 95 95 94 94 – – – – – – –<br />
Guatemala 92 98 87 78 87 70 – 89 91 85 86 87 85 85 85 64 x – 37 – – –<br />
Guinea 74 90 65 18 32 11 24 93 86 59 57 58 59 59 80 42 x – 33 x 74 5 8<br />
Guinea-Bissau 64 91 53 20 44 9 – 93 92 76 73 61 76 76 80 52 35 19 51 36 53<br />
Guyana 94 98 93 84 88 82 – 97 97 93 93 98 93 93 90 65 18 50 6 24 26<br />
Haiti 69 85 51 17 24 10 – 75 83 59 59 59 – – 70 31 x 3 x 40 x 5 x – –<br />
Holy See – – – – – – – – – – – – – – – – – – – – –<br />
Honduras 87 95 79 77 85 69 – 99 99 98 98 99 98 98 94 56 x 54 x 56 x 1 x – –<br />
Hungary 100 100 100 100 100 100 100 99 99 99 99 99 – 99 – – – – – – –<br />
Iceland 100 100 100 100 100 100 – – 98 96 96 93 – 96 – – – – – – –<br />
India 92 97 90 34 58 23 100 87 83 72 70 74 47 – 87 69 x 13 x 26 x 8 x – –<br />
Indonesia 82 92 74 54 73 39 100 82 86 63 70 89 63 – 85 66 – 35 1 3 3<br />
Iran (Islamic Republic <strong>of</strong>) 96 97 92 100 100 100 100 99 99 99 99 99 99 – 95 93 x – – – – –<br />
Iraq 79 91 56 73 76 67 – 92 90 77 78 76 76 – 85 82 x 82 x 31 x 1 x 0 x –<br />
Ireland 100 100 100 99 100 98 – 41 98 95 95 92 95 95 – – – – – – –<br />
Israel 100 100 100 100 100 100 – – 96 94 94 98 99 93 – – – – – – –<br />
Italy 100 100 100 – – – – – 98 96 96 90 96 96 – – – – – – –<br />
Jamaica 93 98 88 80 78 82 – 99 99 99 99 88 99 99 80 75 x 52 x 40 x – – –<br />
Japan 100 100 100 100 100 100 – 94 99 98 96 94 – – – – – – – – –<br />
Jordan 97 98 92 98 98 98 100 95 98 98 98 98 98 98 90 75 79 20 – – –<br />
Kazakhstan 95 99 90 97 97 98 – 96 99 99 99 99 99 95 – 71 x 32 x 74 x – – –<br />
Kenya 59 82 52 32 32 32 57 92 95 88 88 87 88 88 73 56 50 39 23 47 56<br />
Kiribati – – – – – – – 86 99 99 95 90 95 95 – 81 51 62 – – –<br />
Kuwait 99 99 99 100 100 100 – 99 99 99 99 99 99 99 95 – – – – – –<br />
Kyrgyzstan 90 99 85 93 94 93 – 98 97 96 94 97 96 96 – 62 x 45 x 20 x – – –<br />
Lao People’s<br />
Democratic Republic 67 77 62 63 89 50 6 77 83 78 79 69 78 78 80 32 x 52 x 46 x 8 x 41 x 45 x<br />
Latvia 99 100 96 – – – 100 95 97 94 94 99 91 93 – – – – – – –<br />
Lebanon 100 100 100 – 100 – – – 84 81 75 79 81 81 – 74 x – 44 x – – –<br />
Lesotho 78 91 73 26 32 24 42 95 93 83 91 85 83 83 83 66 – 51 – – –<br />
Liberia 73 88 60 18 29 7 91 73 61 49 56 40 49 49 91 62 – 53 57 37 50<br />
Libya – – – 97 97 96 – 99 98 98 98 98 98 98 – – – – – – –<br />
Liechtenstein – – – – – – – – – – – – – – – – – – – – –<br />
Lithuania – 98 – – 95 – 100 98 95 92 92 94 95 92 – – – – – – –<br />
Luxembourg 100 100 100 100 100 100 – – 99 99 99 96 95 99 – – – – – – –<br />
Madagascar 46 74 34 15 21 12 21 82 96 89 88 70 89 89 78 42 – 17 20 46 57<br />
Malawi 83 95 80 51 49 51 – 99 98 97 86 96 97 97 87 70 – 69 43 39 57<br />
Malaysia 100 100 99 96 96 95 – 99 99 99 99 95 97 99 90 – – – – – –<br />
Maldives 98 100 97 97 98 97 100 98 97 96 96 96 96 – 95 22 x – 57 – – –<br />
Mali 64 87 51 22 35 14 – 89 85 72 71 56 72 72 89 38 x – 14 x 35 70 85<br />
Malta 100 100 100 100 100 100 – – 99 96 96 84 82 96 – – – – – – –<br />
Marshall Islands 94 92 99 75 83 53 2 99 99 94 95 97 97 92 – – – – – – –<br />
Mauritania 50 52 48 26 51 9 21 86 91 75 73 67 75 75 80 45 24 20 21 – 12<br />
Mauritius 99 100 99 89 91 88 100 99 99 98 98 99 98 98 95 – – – – – –<br />
Mexico 96 97 91 85 87 79 – 99 99 97 97 98 98 97 88 – – – – – –<br />
Micronesia<br />
(Federated <strong>State</strong>s <strong>of</strong>) – – – – – – – 75 96 84 83 92 83 72 – – – – – – –<br />
Monaco 100 100 – 100 100 – – 89 99 99 99 99 99 99 – – – – – – –<br />
Mongolia 82 100 53 51 64 29 69 99 99 99 99 98 99 99 – 87 72 38 x – – –<br />
Montenegro 98 99 96 90 92 87 100 97 98 95 95 91 91 90 – 89 x 57 x 16 x – – –<br />
Morocco 83 98 61 70 83 52 – 99 99 99 98 95 98 99 89 70 – 23 x – – –<br />
Mozambique 47 77 29 18 38 5 20 91 90 76 73 82 76 76 83 65 22 55 30 18 28<br />
Myanmar 83 93 78 76 83 73 – 93 99 99 99 99 52 – 93 69 34 61 – 11 –<br />
Namibia 93 99 90 32 57 17 – 89 88 82 85 74 82 82 83 53 x – 63 20 34 54<br />
Nauru 88 88 – 65 65 – 100 99 99 99 99 99 99 99 – 69 47 – – – –<br />
Nepal 89 93 88 31 48 27 20 97 96 92 92 88 92 92 82 50 7 39 1 – –<br />
Ne<strong>the</strong>rlands 100 100 100 100 100 100 100 – 99 97 97 96 – 97 – – – – – – –<br />
Newborns<br />
protected<br />
against<br />
tetanus l<br />
Careseeking<br />
for<br />
suspected<br />
pneumonia<br />
Antibiotic<br />
treatment<br />
for<br />
suspected<br />
Treatment<br />
with oral<br />
Antimalarial<br />
treatment<br />
among<br />
febrile<br />
children<br />
<strong>Children</strong><br />
sleeping<br />
under<br />
ITNs<br />
Households<br />
with at<br />
least<br />
one ITN<br />
STATISTICAL TABLES 109
TABLE 3<br />
Countries<br />
HEALTH<br />
Use <strong>of</strong> improved<br />
drinking water<br />
sources (%) 2010<br />
Use <strong>of</strong> improved<br />
sanitation facilities<br />
(%) 2010<br />
Routine<br />
EPI<br />
vaccines<br />
financed<br />
by govt.<br />
Immunization coverage (%)<br />
2011<br />
Pneumonia (%)<br />
2007-2012*<br />
Diarrhoea<br />
(%)<br />
2007-2012*<br />
Malaria (%)<br />
2007-2012*<br />
and areas<br />
(%)<br />
rehydration<br />
total urban rural total urban rural 2011 BCG DPT1 b DPT3 b Polio3 MCV HepB3 Hib3<br />
pneumonia salts (ORS)<br />
New Zealand 100 100 100 – – – 100 – 95 95 95 93 95 94 – – – – – – –<br />
Nicaragua 85 98 68 52 63 37 – 98 99 98 99 99 98 98 81 58 x – 59 2 x – –<br />
Niger 49 100 39 9 34 4 14 61 80 75 44 76 75 75 84 51 – 34 – 64 76<br />
Nigeria 58 74 43 31 35 27 – 64 53 47 73 71 50 – 60 45 23 26 49 29 42<br />
Niue 100 100 100 100 100 100 5 99 99 98 98 99 98 99 – – – – – – –<br />
Norway 100 100 100 100 100 100 100 – 99 94 94 93 – 95 – – – – – – –<br />
Oman 89 93 78 99 100 95 – 99 99 99 99 99 99 99 91 – – – – – –<br />
Pakistan 92 96 89 48 72 34 – 85 88 80 75 80 80 80 75 69 50 41 3 – 0<br />
Palau 85 83 96 100 100 100 0 – 99 84 98 85 91 85 – – – – – – –<br />
Panama – 97 – – – – – 97 95 87 91 97 87 87 – – – – – – –<br />
Papua New Guinea 40 87 33 45 71 41 45 83 83 61 58 60 62 61 61 63 x – – – – –<br />
Paraguay 86 99 66 71 90 40 – 94 97 90 87 93 90 90 85 – – – – – –<br />
Peru 85 91 65 71 81 37 – 91 94 91 91 96 91 91 85 68 51 32 – – –<br />
Philippines 92 93 92 74 79 69 – 84 85 80 80 79 76 14 76 50 42 47 0 x – –<br />
Poland – 100 – – 96 – – 93 99 99 96 98 98 99 – – – – – – –<br />
Portugal 99 99 100 100 100 100 100 96 99 98 97 96 97 97 – – – – – – –<br />
Qatar 100 100 100 100 100 100 – 97 94 93 93 99 93 93 – – – – – – –<br />
Republic <strong>of</strong> Korea 98 100 88 100 100 100 – 99 99 99 98 99 99 – – – – – – – –<br />
Republic <strong>of</strong> Moldova 96 99 93 85 89 82 – 98 96 93 96 91 96 78 – 60 x – 33 x – – –<br />
Romania – 99 – – – – 100 99 96 89 89 93 96 89 – – – – – – –<br />
Russian Federation 97 99 92 70 74 59 – 95 97 97 97 98 97 – – – – – – – –<br />
Rwanda 65 76 63 55 52 56 11 99 98 97 93 95 97 97 85 50 – 29 11 70 82<br />
Saint Kitts and Nevis 99 99 99 96 96 96 – 99 99 97 98 99 98 98 – – – – – – –<br />
Saint Lucia 96 98 95 65 71 63 – 97 98 97 97 95 97 97 – – – – – – –<br />
Saint Vincent and<br />
<strong>the</strong> Grenadines – – – – – 96 – 99 98 95 95 99 96 96 – – – – – – –<br />
Samoa 96 96 96 98 98 98 100 99 99 91 91 67 91 91 – – – 68 – – –<br />
San Marino – – – – – – – – 90 86 86 83 86 85 – – – – – – –<br />
Sao Tome and Principe 89 89 88 26 30 19 15 99 98 96 96 91 96 96 – 75 – 49 8 56 61<br />
Saudi Arabia – 97 – – 100 – – 98 99 98 98 98 98 98 – – – – – – –<br />
Senegal 72 93 56 52 70 39 32 95 94 83 73 82 83 83 88 50 – 22 8 35 63<br />
Serbia 99 99 98 92 96 88 – 99 91 91 91 95 89 91 – 90 82 36 – – –<br />
Seychelles – 100 – – 98 – 100 99 99 99 99 99 99 99 – – – – – – –<br />
Sierra Leone 55 87 35 13 23 6 2 96 94 84 81 80 84 84 85 74 58 73 62 30 36<br />
Singapore 100 100 – 100 100 – – 99 98 96 96 95 96 – – – – – – – –<br />
Slovakia 100 100 100 100 100 99 100 97 99 99 99 98 99 99 – – – – – – –<br />
Slovenia 99 100 99 100 100 100 – – 98 96 96 95 – 96 – – – – – – –<br />
Solomon Islands – – – – 98 – 47 89 94 88 93 73 88 88 85 73 23 – 19 40 49<br />
Somalia 29 66 7 23 52 6 0 41 52 41 49 46 – – 64 13 x 32 x 13 x 8 x 11 x 12 x<br />
South Africa 91 99 79 79 86 67 100 78 77 72 73 78 76 72 77 65 x – 40 x – – –<br />
South Sudan s – – – – – – 0 57 58 46 46 64 – – 44 48 33 39 36 25 53<br />
Spain 100 100 100 100 100 100 – – 99 97 97 95 97 97 – – – – – – –<br />
Sri Lanka 91 99 90 92 88 93 39 99 99 99 99 99 99 99 95 58 – 50 0 3 5<br />
<strong>State</strong> <strong>of</strong> Palestine 85 86 81 92 92 92 – 98 99 99 99 99 98 – – 65 x – – – – –<br />
Sudan s – – – – – – 2 92 98 93 93 87 93 93 74 56 66 22 65 – 25<br />
Suriname 92 97 81 83 90 66 – – 90 86 86 85 86 86 93 74 x 37 x 44 x – 3 x –<br />
Swaziland 71 91 65 57 64 55 – 98 98 91 85 98 91 91 86 58 61 57 2 2 10<br />
Sweden 100 100 100 100 100 100 – 23 99 98 98 96 – 98 – – – – – – –<br />
Switzerland 100 100 100 100 100 100 0 – 95 95 95 92 – 95 – – – – – – –<br />
Syrian Arab Republic 90 93 86 95 96 93 – 90 86 72 75 80 66 72 94 77 x 71 x 50 x – – –<br />
Tajikistan 64 92 54 94 95 94 18 97 98 96 97 98 96 96 – 64 x 41 x 73 2 x 1 x 2 x<br />
Thailand 96 97 95 96 95 96 100 99 99 99 99 98 98 – 91 84 x 65 x 57 x – – –<br />
The former Yugoslav<br />
Republic <strong>of</strong> Macedonia 100 100 99 88 92 82 – 98 95 95 95 98 90 89 – 93 x 74 x 62 – – –<br />
Timor-Leste 69 91 60 47 73 37 100 68 69 67 66 62 67 – 81 71 45 71 6 42 42<br />
Togo 61 89 40 13 26 3 25 90 95 81 81 67 81 81 81 32 41 11 34 57 57<br />
Tonga 100 100 100 96 98 96 100 99 99 99 99 99 99 99 – – – – – – –<br />
Trinidad and Tobago 94 98 93 92 92 92 – – 96 90 91 92 90 90 – 74 x 34 x – – – –<br />
Tunisia – 99 – – 96 – – 98 98 98 98 96 98 43 96 59 x – 55 x – – –<br />
Turkey 100 100 99 90 97 75 – 97 98 97 97 97 96 97 90 41 x – – – – –<br />
Turkmenistan – 97 – 98 99 97 – 98 98 97 97 99 97 71 – 83 x 50 x 40 x – – –<br />
Tuvalu 98 98 97 85 88 81 – 99 99 96 96 98 96 96 – – – – – – –<br />
Uganda 72 95 68 34 34 34 19 86 91 82 82 75 82 82 85 79 47 44 65 43 60<br />
Ukraine 98 98 98 94 96 89 – 90 73 50 58 67 21 26 – – – – – – –<br />
United Arab Emirates 100 100 100 98 98 95 – 98 94 94 94 94 94 94 – – – – – – –<br />
Newborns<br />
protected<br />
against<br />
tetanus l<br />
Careseeking<br />
for<br />
suspected<br />
pneumonia<br />
Antibiotic<br />
treatment<br />
for<br />
suspected<br />
Treatment<br />
with oral<br />
Antimalarial<br />
treatment<br />
among<br />
febrile<br />
children<br />
<strong>Children</strong><br />
sleeping<br />
under<br />
ITNs<br />
Households<br />
with at<br />
least<br />
one ITN<br />
110<br />
THE STATE OF THE WORLD’S CHILDREN <strong>2013</strong>: <strong>Children</strong> with Disabilities
Countries<br />
Use <strong>of</strong> improved<br />
drinking water<br />
sources (%) 2010<br />
Use <strong>of</strong> improved<br />
sanitation facilities<br />
(%) 2010<br />
Routine<br />
EPI<br />
vaccines<br />
financed<br />
by govt.<br />
Immunization coverage (%)<br />
2011<br />
Pneumonia (%)<br />
2007-2012*<br />
Diarrhoea<br />
(%)<br />
2007-2012*<br />
Malaria (%)<br />
2007-2012*<br />
and areas<br />
(%)<br />
rehydration<br />
total urban rural total urban rural 2011 BCG DPT1 b DPT3 b Polio3 MCV HepB3 Hib3<br />
pneumonia salts (ORS)<br />
United Kingdom 100 100 100 100 100 100 – – 98 95 95 90 – 95 – – – – – – –<br />
United Republic<br />
<strong>of</strong> Tanzania 53 79 44 10 20 7 23 99 96 90 88 93 90 90 88 71 – 44 59 64 64<br />
United <strong>State</strong>s 99 100 94 100 100 99 – – 98 94 94 90 91 88 – – – – – – –<br />
Uruguay 100 100 100 100 100 99 – 99 99 95 95 95 95 95 – – – – – – –<br />
Uzbekistan 87 98 81 100 100 100 – 99 99 99 99 99 99 99 – 68 x 56 x 28 x _ – –<br />
Vanuatu 90 98 87 57 64 54 16 81 78 68 67 52 59 – 75 – – 23 53 56 68<br />
Venezuela (Bolivarian<br />
Republic <strong>of</strong>) – – – – – – – 95 90 78 78 86 78 78 50 72 x – 38 x – – –<br />
Viet Nam 95 99 93 76 94 68 30 98 97 95 96 96 95 95 87 73 68 47 1 9 10<br />
Yemen 55 72 47 53 93 34 13 59 89 81 81 71 81 81 66 44 x 38 x 33 x – – –<br />
Zambia 61 87 46 48 57 43 19 88 87 81 83 83 81 81 81 68 47 60 34 50 64<br />
Zimbabwe 80 98 69 40 52 32 – 98 99 99 99 92 93 93 66 48 31 21 2 10 29<br />
MEMORANDUM<br />
Sudan and South Sudan s 58 † 67 † 52 † 26 † 44 † 14 † – – – – – – – – – – – – – – –<br />
Newborns<br />
protected<br />
against<br />
tetanus l<br />
Careseeking<br />
for<br />
suspected<br />
pneumonia<br />
Antibiotic<br />
treatment<br />
for<br />
suspected<br />
Treatment<br />
with oral<br />
TABLE 3<br />
Antimalarial<br />
treatment<br />
among<br />
febrile<br />
children<br />
<strong>Children</strong><br />
sleeping<br />
under<br />
ITNs<br />
HEALTH<br />
Households<br />
with at<br />
least<br />
one ITN<br />
SUMMARY INDICATORS #<br />
Sub-Saharan Africa 61 83 49 30 43 23 27 79 79 71 76 74 70 60 76 49 34 32 38 38 50<br />
Eastern and<br />
Sou<strong>the</strong>rn Africa 61 87 50 35 54 27 39 85 85 79 79 79 76 76 81 55 30 39 31 41 54<br />
West and Central Africa 62 82 47 26 35 20 17 73 71 62 72 69 63 44 72 44 33 27 42 36 49<br />
Middle East and<br />
North Africa 86 93 76 82 91 70 75 93 96 92 92 90 91 48 85 – – – – – –<br />
South Asia 90 96 88 38 60 28 90 87 85 75 73 77 57 23 85 65 24 34 7 – –<br />
East Asia and Pacific 90 97 84 67 77 58 95 95 95 91 92 95 89 10 85 ** 64 ** – 43 ** – 6 ** –<br />
Latin America<br />
and Caribbean 94 98 81 79 84 60 – 95 96 92 92 93 90 90 85 – – – – – –<br />
CEE/CIS 96 99 91 85 87 80 – 96 95 92 93 94 89 58 – – – – – – –<br />
Least developed countries 63 82 56 35 48 30 19 82 87 78 79 76 75 74 81 50 43 42 36 41 53<br />
World 89 96 81 63 79 47 84 88 89 83 84 84 75 43 82 ** 60 ** 31 ** 35 ** 19 ** – –<br />
s Due to <strong>the</strong> cession in July 2011 <strong>of</strong> <strong>the</strong> Republic <strong>of</strong> South Sudan by <strong>the</strong> Republic <strong>of</strong> <strong>the</strong> Sudan, and its subsequent admission to <strong>the</strong> United Nations on 14 July 2011, disaggregated data for <strong>the</strong> Sudan and South Sudan as separate<br />
<strong>State</strong>s are not yet available for all indicators. Aggregated data presented are for <strong>the</strong> Sudan pre-cession (see Memorandum item).<br />
# For a complete list <strong>of</strong> countries and areas in <strong>the</strong> regions, subregions and country categories, see page 98.<br />
DEFINITIONS OF THE INDICATORS<br />
Use <strong>of</strong> improved drinking water sources – Percentage <strong>of</strong> <strong>the</strong> population using any <strong>of</strong> <strong>the</strong> following as <strong>the</strong><br />
main drinking water source: drinking water supply piped into dwelling, plot, yard or neighbour’s yard; public tap or<br />
standpipe; tube well or borehole; protected dug well; protected spring; rainwater; bottled water plus one <strong>of</strong> <strong>the</strong><br />
previous sources as a secondary source.<br />
Use <strong>of</strong> improved sanitation facilities – Percentage <strong>of</strong> <strong>the</strong> population using any <strong>of</strong> <strong>the</strong> following sanitation facilities,<br />
not shared with o<strong>the</strong>r households: flush or pour-flush latrine connected to a piped sewerage system, septic tank or pit<br />
latrine; ventilated improved pit latrine; pit latrine with a slab; covered pit; composting toilet.<br />
Routine EPI vaccines financed by government – Percentage <strong>of</strong> EPI vaccines that are routinely administered in<br />
a country to protect children and are financed by <strong>the</strong> national government (including loans).<br />
EPI – Expanded programme on immunization: The immunizations in this programme include those against<br />
tuberculosis (TB); diph<strong>the</strong>ria, pertussis (whooping cough) and tetanus (DPT); polio; and measles, as well as<br />
vaccination <strong>of</strong> pregnant women to protect babies against neonatal tetanus. O<strong>the</strong>r vaccines, e.g., against hepatitis B<br />
(HepB), Haemophilus influenzae type b (Hib) or yellow fever, may be included in <strong>the</strong> programme in some countries.<br />
BCG – Percentage <strong>of</strong> live births who received bacille Calmette-Guérin (vaccine against tuberculosis).<br />
DPT1 – Percentage <strong>of</strong> surviving infants who received <strong>the</strong>ir first dose <strong>of</strong> diph<strong>the</strong>ria, pertussis and tetanus vaccine.<br />
DPT3 – Percentage <strong>of</strong> surviving infants who received three doses <strong>of</strong> diph<strong>the</strong>ria, pertussis and tetanus vaccine.<br />
Polio3 – Percentage <strong>of</strong> surviving infants who received three doses <strong>of</strong> <strong>the</strong> polio vaccine.<br />
MCV – Percentage <strong>of</strong> surviving infants who received <strong>the</strong> first dose <strong>of</strong> <strong>the</strong> measles-containing vaccine.<br />
HepB3 – Percentage <strong>of</strong> surviving infants who received three doses <strong>of</strong> hepatitis B vaccine.<br />
Hib3 – Percentage <strong>of</strong> surviving infants who received three doses <strong>of</strong> Haemophilus influenzae type b vaccine.<br />
Newborns protected against tetanus – Percentage <strong>of</strong> newborns protected at birth against tetanus.<br />
Care-seeking for suspected pneumonia – Percentage <strong>of</strong> children under age 5 with suspected pneumonia<br />
(cough and fast or difficult breathing due to a problem in <strong>the</strong> chest) in <strong>the</strong> two weeks preceding <strong>the</strong> survey and who<br />
were taken to an appropriate health-care provider.<br />
Antibiotic treatment for suspected pneumonia – Percentage <strong>of</strong> children under age 5 with suspected<br />
pneumonia (cough and fast or difficult breathing due to a problem in <strong>the</strong> chest) in <strong>the</strong> two weeks preceding <strong>the</strong><br />
survey who received antibiotics.<br />
Diarrhoea treatment with oral rehydration salts (ORS) – Percentage <strong>of</strong> children under age 5 who had<br />
diarrhoea in <strong>the</strong> two weeks preceding <strong>the</strong> survey and who received oral rehydration salts (ORS packets or<br />
pre-packaged ORS fluids).<br />
Antimalarial treatment among febrile children – Percentage <strong>of</strong> children under age 5 who were ill with fever in<br />
<strong>the</strong> two weeks preceding <strong>the</strong> survey and received any antimalarial medicine. NB: This indicator refers to antimalarial<br />
treatment among all febrile children, ra<strong>the</strong>r than among confirmed malaria cases, and thus should be interpreted<br />
with caution. For more information, please refer to http://www.childinfo.org/malaria_maltreatment.php.<br />
<strong>Children</strong> sleeping under ITNs – Percentage <strong>of</strong> children under age 5 who slept under an insecticide-treated<br />
mosquito net <strong>the</strong> night prior to <strong>the</strong> survey.<br />
Households with at least one ITN – Percentage <strong>of</strong> households with at least one insecticide-treated mosquito net.<br />
MAIN DATA SOURCES<br />
Use <strong>of</strong> improved drinking water sources and improved sanitation facilities – UNICEF and<br />
World Health Organization (WHO), Joint Monitoring Programme.<br />
Routine EPI vaccines financed by government – As reported by governments on UNICEF and<br />
WHO Joint Reporting Form.<br />
Immunization – UNICEF and WHO.<br />
Suspected pneumonia care-seeking and treatment – Demographic and Health Surveys (DHS),<br />
Multiple Indicator Cluster Surveys (MICS) and o<strong>the</strong>r national household surveys.<br />
Diarrhoea treatment – DHS, MICS and o<strong>the</strong>r national household surveys.<br />
Malaria prevention and treatment – DHS, MICS, Malaria Indicator Surveys (MIS) and o<strong>the</strong>r<br />
national household surveys.<br />
NOTES<br />
– Data not available.<br />
x Data refer to years or periods o<strong>the</strong>r than those specified in <strong>the</strong> column heading. Such data are not<br />
included in <strong>the</strong> calculation <strong>of</strong> regional and global averages, with <strong>the</strong> exception <strong>of</strong> 2005–2006 data<br />
from India. Estimates from data years prior to 2000 are not displayed.<br />
b Coverage for DPT1 should be at least as high as DPT3. Discrepancies where DPT1 coverage is less<br />
than DPT3 reflect deficiencies in <strong>the</strong> data collection and reporting process. UNICEF and WHO are<br />
working with national and territorial systems to eliminate <strong>the</strong>se discrepancies.<br />
l WHO and UNICEF have employed a model to calculate <strong>the</strong> percentage <strong>of</strong> births that can be<br />
considered as protected against tetanus because pregnant women were given two doses or<br />
more <strong>of</strong> tetanus toxoid (TT) vaccine. The model aims to improve <strong>the</strong> accuracy <strong>of</strong> this indicator by<br />
capturing or including o<strong>the</strong>r potential scenarios where women might be protected (e.g., women<br />
who receive doses <strong>of</strong> TT in supplemental immunization activities). A fuller explanation <strong>of</strong> <strong>the</strong><br />
methodology can be found at .<br />
† The WHO/UNICEF Joint Monitoring Programme for Water Supply and Sanitation (JMP) closed its<br />
databases for <strong>the</strong>se estimates before <strong>the</strong> cession <strong>of</strong> <strong>the</strong> Republic <strong>of</strong> South Sudan by <strong>the</strong> Republic<br />
<strong>of</strong> <strong>the</strong> Sudan. Aggregated data presented are for <strong>the</strong> Sudan pre-cession. Disaggregated data for<br />
<strong>the</strong> Sudan and South Sudan as separate <strong>State</strong>s will be published by <strong>the</strong> JMP in <strong>2013</strong>.<br />
* Data refer to <strong>the</strong> most recent year available during <strong>the</strong> period specified in <strong>the</strong> column heading.<br />
** Excludes China.<br />
STATISTICAL TABLES 111
TABLE 4: HIV/AIdS<br />
Prevention among young people (aged 15–24)<br />
Orphans<br />
Countries<br />
and areas<br />
Afghanistan
TABLE 4<br />
HIV/AIdS<br />
Prevention among young people (aged 15–24)<br />
Orphans<br />
Countries<br />
and areas<br />
Adult HIV<br />
prevalence<br />
(%)<br />
2011<br />
People <strong>of</strong> all ages living with HIV<br />
(thousands) 2011<br />
Women<br />
living<br />
with HIV<br />
(thousands)<br />
2011<br />
<strong>Children</strong><br />
living<br />
with HIV<br />
(thousands)<br />
Comprehensive<br />
knowledge <strong>of</strong> HIV (%)<br />
2007–2011*<br />
Condom use among<br />
young people with<br />
multiple partners (%)<br />
2007–2011*<br />
HIV prevalence among young<br />
people (%) 2011<br />
(thousands) (thousands) ratio (%)<br />
estimate low high 2011 total male female male female male female 2011 2011 2007–2011*<br />
France 0.4 160 130 200 46 – 0.1 0.2 0.1 – – – – – – –<br />
Gabon 5.0 46 34 67 24 3 2.1 1.2 3.0 – – – – 21 64 –<br />
Gambia 1.5 14 7 28 8 – 0.8 0.4 1.2 – 33 – 49 p – – 103<br />
Georgia 0.2 5 2 8 1 – 0.2 0.2 0.1 – – – – – – –<br />
Germany 0.1 73 66 82 11 – 0.1 0.1
TABLE 4<br />
HIV/AIdS<br />
Prevention among young people (aged 15–24)<br />
Orphans<br />
Countries<br />
and areas<br />
Adult HIV<br />
prevalence<br />
(%)<br />
2011<br />
People <strong>of</strong> all ages living with HIV<br />
(thousands) 2011<br />
Women<br />
living<br />
with HIV<br />
(thousands)<br />
2011<br />
<strong>Children</strong><br />
living<br />
with HIV<br />
(thousands)<br />
Comprehensive<br />
knowledge <strong>of</strong> HIV (%)<br />
2007–2011*<br />
Condom use among<br />
young people with<br />
multiple partners (%)<br />
2007–2011*<br />
HIV prevalence among young<br />
people (%) 2011<br />
(thousands) (thousands) ratio (%)<br />
estimate low high 2011 total male female male female male female 2011 2011 2007–2011*<br />
New Zealand 0.1 3 2 3
TABLE 4<br />
HIV/AIdS<br />
Prevention among young people (aged 15–24)<br />
Orphans<br />
Countries<br />
and areas<br />
Adult HIV<br />
prevalence<br />
(%)<br />
2011<br />
People <strong>of</strong> all ages living with HIV<br />
(thousands) 2011<br />
Women<br />
living<br />
with HIV<br />
(thousands)<br />
2011<br />
<strong>Children</strong><br />
living<br />
with HIV<br />
(thousands)<br />
Comprehensive<br />
knowledge <strong>of</strong> HIV (%)<br />
2007–2011*<br />
Condom use among<br />
young people with<br />
multiple partners (%)<br />
2007–2011*<br />
<strong>Children</strong><br />
orphaned<br />
by AIDS<br />
<strong>Children</strong><br />
orphaned<br />
due to all<br />
causes<br />
HIV prevalence among young<br />
people (%) 2011<br />
(thousands) (thousands) ratio (%)<br />
estimate low high 2011 total male female male female male female 2011 2011 2007–2011*<br />
Ukraine 0.8 230 180 310 94 – 0.1 0.1 0.1 43 45 64 63 – – –<br />
United Arab Emirates – – – – – – – – – – – – – – – –<br />
United Kingdom 0.3 94 74 120 29 – 0.1 0.1 0.1 – – – – – – –<br />
United Republic<br />
<strong>of</strong> Tanzania 5.8 1,600 1,500 1,700 760 230 2.9 1.8 4.0 43 48 36 32 1,300 3,000 90<br />
United <strong>State</strong>s 0.6 1,300 1,000 2,000 300 – 0.2 0.3 0.2 – – – – – – –<br />
Uruguay 0.6 12 6 33 4 – 0.3 0.4 0.2 – – – – – – –<br />
Uzbekistan – – – – – – – – – – 31 x – – – – –<br />
Vanuatu – – – – – – – – – – 15 – – – – 92<br />
Venezuela (Bolivarian<br />
Republic <strong>of</strong>) 0.5 99 51 230 25 – 0.2 0.4 0.1 – – – – – – –<br />
Viet Nam 0.5 250 200 330 48 – 0.2 0.3 0.2 – 51 – – – – –<br />
Yemen 0.2 22 19 25 9 – 0.1 0.1 0.1 – 2 x,y – – – – –<br />
Zambia 12.5 970 900 1,100 460 170 5.0 3.1 7.0 41 38 43 42 p 680 1,200 92<br />
Zimbabwe 14.9 1,200 1,200 1,300 600 200 5.6 3.6 7.6 47 52 51 39 p 1,000 1,300 95<br />
MEMORANDUM<br />
Sudan and South Sudan s – – – – – – – – – – – – – – – –<br />
Orphan<br />
school<br />
attendance<br />
SUMMARY INDICATORS #<br />
Sub-Saharan Africa 4.8 23,500 22,100 24,900 11,800 3,100 2.2 1.3 3.0 36 28 49 30 15,200 53,600 95<br />
Eastern and Sou<strong>the</strong>rn<br />
Africa 7.0 17,200 16,300 17,800 8,700 2,200 3.1 1.9 4.3 40 36 44 30 10,700 27,200 89<br />
West and Central Africa 2.6 6,300 5,700 6,800 3,200 850 1.3 0.7 1.8 33 21 56 30 4,500 26,300 100<br />
Middle East and North<br />
Africa 0.1 260 220 320 74 32 0.1 0.1 0.1 – – – – 160 6,000 –<br />
South Asia 0.2 2,500 1,600 3,400 890 110 0.1 0.1 0.1 34 17 33 17 600 42,900 72<br />
East Asia and Pacific 0.2 2,400 2,100 2,700 720 64 0.1 0.1 0.1 – 23 ** – – 510 28,700 –<br />
Latin America and<br />
Caribbean 0.4 1,600 1,300 1,900 540 58 0.2 0.2 0.2 – – – – 600 9,500 –<br />
CEE/CIS 0.6 1,500 1,100 1,800 410 18 0.1 0.1 0.1 – – – – 170 6,500 –<br />
Least developed countries 1.9 10,300 9,600 10,900 5,000 1,600 0.9 0.6 1.3 30 24 – – 7,800 43,200 88<br />
World 0.8 34,000 31,400 35,900 15,000 3,400 0.4 0.3 0.5 – 21 ** – – 17,300 151,000 –<br />
s Due to <strong>the</strong> cession in July 2011 <strong>of</strong> <strong>the</strong> Republic <strong>of</strong> South Sudan by <strong>the</strong> Republic <strong>of</strong> <strong>the</strong> Sudan, and its subsequent admission to <strong>the</strong> United Nations on 14 July 2011, disaggregated data for <strong>the</strong> Sudan<br />
and South Sudan as separate <strong>State</strong>s are not yet available for all indicators. Aggregated data presented are for <strong>the</strong> Sudan pre-cession (see Memorandum item).<br />
# For a complete list <strong>of</strong> countries and areas in <strong>the</strong> regions, subregions and country categories, see page 98.<br />
DEFINITIONS OF THE INDICATORS<br />
Adult HIV prevalence – Estimated percentage <strong>of</strong> adults (aged 15–49) living with<br />
HIV as <strong>of</strong> 2011.<br />
People living with HIV – Estimated number <strong>of</strong> people (all ages) living with HIV as<br />
<strong>of</strong> 2011.<br />
Women living with HIV – Estimated number <strong>of</strong> women (aged 15+) living with HIV<br />
as <strong>of</strong> 2011.<br />
<strong>Children</strong> living with HIV – Estimated number <strong>of</strong> children (aged 0–14) living with<br />
HIV as <strong>of</strong> 2011.<br />
HIV prevalence among young people – Estimated percentage <strong>of</strong> young men and<br />
women (aged 15–24) living with HIV as <strong>of</strong> 2011.<br />
Comprehensive knowledge <strong>of</strong> HIV – Percentage <strong>of</strong> young men and women<br />
(aged 15–24) who correctly identify <strong>the</strong> two major ways <strong>of</strong> preventing <strong>the</strong> sexual<br />
transmission <strong>of</strong> HIV (using condoms and limiting sex to one faithful, uninfected<br />
partner), who reject <strong>the</strong> two most common local misconceptions about HIV<br />
transmission and who know that a healthy-looking person can be HIV-positive.<br />
Condom use among young people with multiple partners – Among young<br />
people (aged 15–24) who reported having had more than one sexual partner in <strong>the</strong><br />
past 12 months, <strong>the</strong> percentage who reported using a condom <strong>the</strong> last time <strong>the</strong>y had<br />
sex with any partner.<br />
<strong>Children</strong> orphaned by AIDS – Estimated number <strong>of</strong> children (aged 0–17) who have<br />
lost one or both parents to AIDS as <strong>of</strong> 2011.<br />
<strong>Children</strong> orphaned due to all causes – Estimated number <strong>of</strong> children (aged 0–17)<br />
who have lost one or both parents to any cause as <strong>of</strong> 2011.<br />
Orphan school attendance ratio – Percentage <strong>of</strong> children (aged 10–14) who<br />
have lost both biological parents and who are currently attending school as a<br />
percentage <strong>of</strong> non-orphaned children <strong>of</strong> <strong>the</strong> same age who live with at least one<br />
parent and who are attending school.<br />
MAIN DATA SOURCES<br />
Estimated adult HIV prevalence – UNAIDS, Report on <strong>the</strong> Global AIDS Epidemic, 2012.<br />
Estimated number <strong>of</strong> people living with HIV – UNAIDS, Report on <strong>the</strong> Global AIDS Epidemic, 2012.<br />
Estimated number <strong>of</strong> women living with HIV – UNAIDS, Report on <strong>the</strong> Global AIDS Epidemic, 2012.<br />
Estimated number <strong>of</strong> children living with HIV – UNAIDS, Report on <strong>the</strong> Global AIDS Epidemic, 2012.<br />
HIV prevalence among young people – UNAIDS, Report on <strong>the</strong> Global AIDS Epidemic, 2012.<br />
Comprehensive knowledge <strong>of</strong> HIV – AIDS Indicator Surveys (AIS), Demographic and Health Surveys<br />
(DHS), Multiple Indicator Cluster Surveys (MICS) and o<strong>the</strong>r national household surveys; HIV/AIDS Survey<br />
Indicators Database, .<br />
Condom use among young people with multiple partners – AIS, DHS, MICS and o<strong>the</strong>r national<br />
household surveys; HIV/AIDS Survey Indicators Database, .<br />
<strong>Children</strong> orphaned by AIDS – UNAIDS, Report on <strong>the</strong> Global AIDS Epidemic, 2012.<br />
<strong>Children</strong> orphaned by all causes – UNAIDS, Report on <strong>the</strong> Global AIDS Epidemic, 2012.<br />
Orphan school attendance ratio – AIS, DHS, MICS and o<strong>the</strong>r national household surveys; HIV/AIDS<br />
Survey Indicators Database, .<br />
NOTES<br />
– Data not available.<br />
x Data refer to years or periods o<strong>the</strong>r than those specified in <strong>the</strong> column heading. Such data are not<br />
included in <strong>the</strong> calculation <strong>of</strong> regional and global averages, with <strong>the</strong> exception <strong>of</strong> 2005–2006 data from<br />
India. Estimates from data years prior to 2000 are not displayed.<br />
y Data differ from <strong>the</strong> standard definition or refer to only part <strong>of</strong> a country. If <strong>the</strong>y fall within <strong>the</strong> noted<br />
reference period, such data are included in <strong>the</strong> calculation <strong>of</strong> regional and global averages.<br />
p Based on small denominators (typically 25–49 unweighted cases).<br />
* Data refer to <strong>the</strong> most recent year available during <strong>the</strong> period specified in <strong>the</strong> column heading.<br />
** Excludes China.<br />
STATISTICAL TABLES 115
TABLE 5: EduCATION<br />
Countries<br />
and areas<br />
Youth (15–24 years)<br />
literacy rate (%)<br />
2007–2011*<br />
male<br />
female<br />
Number per 100<br />
population<br />
2011<br />
mobile<br />
phones<br />
Pre-primary school<br />
participation Primary school participation Secondary school participation<br />
Gross enrolment<br />
ratio (%)<br />
2008–2011*<br />
Gross enrolment<br />
ratio (%)<br />
2008–2011*<br />
Net enrolment<br />
ratio (%)<br />
2008–2011*<br />
Net attendance<br />
ratio (%)<br />
2007–2011*<br />
Internet<br />
users male female male female male female male female<br />
Survival rate to last<br />
primary grade (%)<br />
2008–2011*2007–2011*<br />
Net enrolment<br />
ratio (%)<br />
2008–2011*<br />
Net attendance<br />
ratio (%)<br />
2007–2011*<br />
Afghanistan – – 54 5 – – 114 79 – – 66 x 40 x – 90 x – – 18 x 6 x<br />
Albania 99 99 96 49 56 55 87 87 80 80 90 91 95 100 – – 84 82<br />
Algeria 94 x 89 x 99 14 79 76 113 107 98 96 97 x 96 x 95 93 x – – 57 x 65 x<br />
Andorra – – 75 81 104 99 84 85 78 79 – – – – 74 75 – –<br />
Angola 80 66 48 15 103 105 137 112 93 78 77 75 32 83 x 12 11 21 17<br />
Antigua and Barbuda – – 182 82 76 76 106 97 91 84 – – – – 85 85 – –<br />
Argentina 99 99 135 48 73 75 118 117 – – – – 94 – 78 87 – –<br />
Armenia 100 100 104 – 29 34 101 104 – – 99 x 98 x – 100 x 85 88 93 x 95 x<br />
Australia – – 108 79 79 78 105 105 97 98 – – – – 85 86 – –<br />
Austria – – 155 80 100 100 100 99 – – – – 97 – – – – –<br />
Azerbaijan 100 100 109 50 26 25 94 93 85 84 74 x 72 x 96 100 x – – 83 82<br />
Bahamas – – 86 65 – – 113 115 – – – – 89 – 82 88 – –<br />
Bahrain 100 100 128 77 – – – – – – 86 x 87 x – 99 x – – 77 x 85 x<br />
Bangladesh 75 78 56 5 14 13 – – – – 85 y 88 y 66 94 x 45 50 – –<br />
Barbados – – 127 72 108 108 119 122 – – – – – – 81 88 – –<br />
Belarus 100 100 112 40 100 98 100 100 – – 93 x 94 x 100 100 x – – 95 x 97 x<br />
Belgium – – 117 78 118 118 105 104 99 99 – – 93 – – – – –<br />
Belize – – 64 – 45 47 127 116 – – 95 x 95 x 90 98 x – – 58 x 60 x<br />
Benin 66 45 85 4 18 19 135 117 – – 65 x 58 x – 89 x – – 34 x 23 x<br />
Bhutan 80 x 68 x 66 21 2 2 110 112 88 91 91 93 91 94 50 54 54 56<br />
Bolivia (Plurinational<br />
<strong>State</strong> <strong>of</strong>) 100 99 83 30 45 45 105 104 – – 97 97 – 96 68 69 78 75<br />
Bosnia and Herzegovina 100 100 85 60 17 17 111 113 86 88 97 x 98 x 99 100 x – – 89 x 89 x<br />
Botswana 94 97 143 7 19 19 112 108 87 88 86 88 93 – 57 65 36 x 44 x<br />
Brazil 97 99 123 45 – – – – – – 95 x 95 x – 88 x – – 74 x 80 x<br />
Brunei Darussalam 100 100 109 56 88 88 107 109 – – – – 96 – 95 99 – –<br />
Bulgaria 98 98 141 51 80 79 103 102 99 100 – – 97 – 84 82 – –<br />
Burkina Faso 47 33 45 3 3 3 79 72 61 56 49 x 44 x 64 89 x 18 14 17 x 15 x<br />
Burundi 78 78 14 1 9 9 157 155 – – 73 74 56 82 x 18 15 7 7<br />
Cambodia 88 86 70 3 13 13 130 124 96 95 85 y 85 y – 92 x – – 45 y 44 y<br />
Cameroon 89 77 52 5 28 29 129 111 – – 82 x 77 x 66 87 x – – 39 x 37 x<br />
Canada – – 75 83 71 71 99 98 – – – – – – – – – –<br />
Cape Verde 97 99 79 32 70 70 114 105 95 92 – – – – 61 71 – –<br />
Central African Republic 72 58 25 2 6 6 109 78 81 61 56 x 47 x 46 62 x 18 10 12 x 9 x<br />
Chad 53 41 32 2 2 2 107 78 – – 56 48 28 94 x – – 20 12<br />
Chile 99 99 130 54 55 58 108 103 94 94 – – – – 81 84 – –<br />
China 99 99 73 38 54 54 110 113 100 z 100 z – – 99 z – – – – –<br />
Colombia 98 99 98 40 49 49 116 114 92 91 90 92 85 95 72 77 73 79<br />
Comoros 86 85 29 6 22 21 109 100 – – 31 x 31 x – 19 x – – 10 x 11 x<br />
Congo 87 x 78 x 94 6 12 13 118 112 92 89 86 x 87 x – 93 x – – 39 x 40 x<br />
Cook Islands – – – – 166 149 107 110 98 99 – – – – 76 82 – –<br />
Costa Rica 98 99 92 42 71 72 110 109 – – 96 96 89 – – – 59 x 65 x<br />
Côte d’Ivoire 72 62 86 2 4 4 96 80 67 56 59 x 51 x 61 90 x – – 32 x 22 x<br />
Croatia 100 100 116 71 62 61 93 93 95 97 – – 99 – 88 94 – –<br />
Cuba 100 100 12 23 100 100 104 102 100 100 – – 95 – 86 85 – –<br />
Cyprus 100 100 98 58 81 81 106 105 99 99 – – – – 96 96 – –<br />
Czech Republic – – 122 73 107 105 106 106 – – – – 100 – – – – –<br />
Democratic People’s<br />
Republic <strong>of</strong> Korea 100 100 4 – – – – – – – 99 99 – – – – 98 98<br />
Democratic Republic<br />
<strong>of</strong> <strong>the</strong> Congo 68 62 23 1 3 3 100 87 – – 78 72 55 75 – – 35 28<br />
Denmark – – 126 90 97 96 99 99 95 97 – – 99 – 88 91 – –<br />
Djibouti – – 21 7 4 4 62 56 47 42 67 x 66 x 64 92 x 28 20 45 x 37 x<br />
Dominica – – 164 51 111 114 113 111 – – – – 88 – – – – –<br />
Dominican Republic 96 98 87 36 38 38 115 102 96 90 95 96 – 78 58 67 56 68<br />
Ecuador 98 99 105 31 109 115 114 115 – – 92 y 93 y – – – – 71 y 73 y<br />
Egypt 91 84 101 36 24 23 103 98 – – 90 87 – 99 71 69 70 70<br />
El Salvador 96 96 126 18 63 65 117 111 95 95 – – 86 – 57 59 – –<br />
Equatorial Guinea 98 98 59 – 47 63 88 85 57 56 61 x 60 x 62 – – – 23 x 22 x<br />
Eritrea 92 87 4 6 14 13 48 41 37 33 69 x 64 x 69 – 32 25 23 x 21 x<br />
Estonia 100 100 139 77 96 96 100 98 96 96 – – 98 – 91 93 – –<br />
Ethiopia 63 47 17 1 5 5 106 97 85 80 64 65 47 84 x – – 16 16<br />
Fiji – – 84 28 17 19 106 104 99 99 – – 91 – – – – –<br />
Finland – – 166 89 68 68 99 99 98 98 – – 100 – 94 94 – –<br />
admin.<br />
data<br />
survey<br />
data male female male female<br />
116<br />
THE STATE OF THE WORLD’S CHILDREN <strong>2013</strong>: <strong>Children</strong> with Disabilities
TABLE 5<br />
education<br />
Countries<br />
and areas<br />
Youth (15–24 years)<br />
literacy rate (%)<br />
2007–2011*<br />
male<br />
female<br />
Number per 100<br />
population<br />
2011<br />
mobile<br />
phones<br />
Pre-primary school<br />
participation Primary school participation Secondary school participation<br />
Gross enrolment<br />
ratio (%)<br />
2008–2011*<br />
Gross enrolment<br />
ratio (%)<br />
2008–2011*<br />
Net enrolment<br />
ratio (%)<br />
2008–2011*<br />
Net attendance<br />
ratio (%)<br />
2007–2011*<br />
Internet<br />
users male female male female male female male female<br />
Survival rate to last<br />
primary grade (%)<br />
2008–2011*2007–2011*<br />
Net enrolment<br />
ratio (%)<br />
2008–2011*<br />
Net attendance<br />
ratio (%)<br />
2007–2011*<br />
France – – 105 80 109 108 111 109 99 99 – – – – 98 99 – –<br />
Gabon 99 97 117 8 41 43 184 179 – – 94 x 94 x – – – – 34 x 36 x<br />
Gambia 72 62 89 11 30 31 82 84 68 70 40 45 61 93 – – 34 34<br />
Georgia 100 100 102 37 52 64 107 111 – – 95 96 96 98 x – – 85 x 88 x<br />
Germany – – 132 83 114 113 103 102 – – – – 96 – – – – –<br />
Ghana 82 80 85 14 68 70 107 107 84 85 72 74 72 81 51 47 40 44<br />
Greece 99 99 106 53 – – – – – – – – – – – – – –<br />
Grenada – – – – 95 102 103 103 96 99 – – – – 95 86 – –<br />
Guatemala 89 85 140 12 70 72 119 114 100 98 – – – – 43 40 23 x 24 x<br />
Guinea 70 57 44 1 14 14 103 86 83 70 55 x 48 x 66 96 x 36 22 27 x 17 x<br />
Guinea-Bissau 79 65 26 3 7 7 127 119 77 73 69 65 – 79 – – 27 20<br />
Guyana – – 69 32 74 78 83 86 82 86 94 96 83 100 78 83 70 79<br />
Haiti 74 70 41 – – – – – – – 48 x 52 x – 85 x – – 18 x 21 x<br />
Holy See – – – – – – – – – – – – – – – – – –<br />
Honduras 94 96 104 16 43 44 116 116 95 97 87 x 90 x – – – – 35 x 43 x<br />
Hungary 99 99 117 59 85 84 102 101 98 98 – – 98 – 91 91 – –<br />
Iceland – – 106 95 97 97 99 100 99 100 – – – – 87 89 – –<br />
India 88 74 72 10 54 56 116 116 99 98 85 x 81 x – 95 x – – 59 x 49 x<br />
Indonesia 100 99 98 18 43 44 117 119 – – 98 98 – – 68 67 57 y 59 y<br />
Iran (Islamic Republic <strong>of</strong>) 99 99 75 21 41 44 114 115 – – 94 x 91 x 94 – 92 80 – –<br />
Iraq 85 81 78 5 – – – – – – 91 x 80 x – 93 x – – 46 x 34 x<br />
Ireland – – 108 77 99 97 108 108 99 100 – – – – 98 100 – –<br />
Israel – – 122 70 103 109 103 103 97 97 – – 99 – 97 100 – –<br />
Italy 100 100 152 57 100 96 102 101 100 99 – – 100 – 94 94 – –<br />
Jamaica 93 98 108 32 113 113 91 87 83 81 97 x 98 x 95 99 x 80 87 89 x 93 x<br />
Japan – – 103 80 – – 103 103 – – – – 100 – 99 100 – –<br />
Jordan 99 99 118 35 33 31 92 92 91 91 99 99 – – 83 88 85 89<br />
Kazakhstan 100 100 143 45 48 47 111 111 – – 99 x 98 x 100 100 x 89 88 95 x 95 x<br />
Kenya 92 94 65 28 52 52 115 112 84 85 72 75 – 96 52 48 40 42<br />
Kiribati – – 14 10 – – 111 115 – – – – – – – – 55 y 63 y<br />
Kuwait 99 99 – 74 81 83 104 107 97 100 – – 96 – 86 93 – –<br />
Kyrgyzstan 100 100 105 20 19 19 100 99 95 95 91 x 93 x 98 99 x 79 79 88 x 91 x<br />
Lao People’s Democratic<br />
Republic 89 x 79 x 87 9 22 22 131 122 98 95 81 x 77 x – 65 x 42 38 39 x 32 x<br />
Latvia 100 100 103 72 85 82 101 100 95 97 – – 95 – 83 84 – –<br />
Lebanon 98 99 79 52 82 81 106 103 94 93 98 98 92 93 x 71 79 77 85<br />
Lesotho 86 98 48 4 – – 104 102 72 75 87 91 69 84 x 23 37 26 40<br />
Liberia 71 82 49 3 – – 101 91 – – 32 28 – – – – 14 14<br />
Libya 100 100 156 17 – – – – – – – – – – – – – –<br />
Liechtenstein – – 102 85 102 105 109 102 100 98 – – 79 – 64 64 – –<br />
Lithuania 100 100 151 65 75 73 96 95 96 96 – – 98 – 91 91 – –<br />
Luxembourg – – 148 91 87 86 99 100 96 98 – – – – 84 86 – –<br />
Madagascar 66 64 38 2 9 9 150 147 – – 78 80 35 89 23 24 27 28<br />
Malawi 87 87 25 3 – – 133 138 – – 76 x 79 x 53 81 x 28 27 19 20<br />
Malaysia 98 98 127 61 64 69 – – – – – – 98 – 65 71 – –<br />
Maldives 99 99 166 34 113 115 111 107 97 97 82 84 – 99 – – 52 63<br />
Mali 56 34 68 2 3 3 86 75 71 61 62 55 75 96 x 35 24 38 24<br />
Malta 97 99 125 69 119 115 101 101 93 94 – – 80 – 82 80 – –<br />
Marshall Islands – – – – 45 47 102 101 – – – – 83 – – – – –<br />
Mauritania 71 65 93 5 – – 99 105 73 76 56 59 71 77 – – 21 17<br />
Mauritius 96 98 99 35 97 96 99 100 92 94 – – 98 – – – – –<br />
Mexico 98 98 82 36 101 102 115 113 99 100 97 x 97 x 94 – 70 73 – –<br />
Micronesia<br />
(Federated <strong>State</strong>s <strong>of</strong>) – – – – – – – – – – – – – – – – – –<br />
Monaco – – 86 – – – – – – – – – – – – – – –<br />
Mongolia 94 97 105 20 76 79 123 121 100 99 95 97 94 99 – – 91 95<br />
Montenegro 99 99 – 40 32 30 107 106 – – 97 x 98 x – 97 x – – 90 x 92 x<br />
Morocco 87 72 113 51 65 50 115 108 95 93 91 x 88 x 91 – – – 39 x 36 x<br />
Mozambique 79 65 33 4 – – 121 109 95 89 82 80 27 60 17 15 21 20<br />
Myanmar 96 96 3 1 10 10 126 126 – – 90 91 75 93 49 52 52 y 53 y<br />
Namibia 91 95 105 12 – – 108 107 84 89 91 93 83 89 x – – 47 62<br />
Nauru – – 65 – 96 93 90 96 – – – – – – – – 52 y 69 y<br />
Nepal 88 78 44 9 – – – – – – 67 y 70 y – 95 x – – 46 x 38 x<br />
Ne<strong>the</strong>rlands – – – 92 93 93 108 107 – – – – – – 87 88 – –<br />
admin.<br />
data<br />
survey<br />
data male female male female<br />
STATISTICAL TABLES 117
TABLE 5<br />
EduCATION<br />
Countries<br />
and areas<br />
Youth (15–24 years)<br />
literacy rate (%)<br />
2007–2011*<br />
male<br />
female<br />
Number per 100<br />
population<br />
2011<br />
mobile<br />
phones<br />
Pre-primary school<br />
participation Primary school participation Secondary school participation<br />
Gross enrolment<br />
ratio (%)<br />
2008–2011*<br />
Gross enrolment<br />
ratio (%)<br />
2008–2011*<br />
Net enrolment<br />
ratio (%)<br />
2008–2011*<br />
Net attendance<br />
ratio (%)<br />
2007–2011*<br />
Internet<br />
users male female male female male female male female<br />
Survival rate to last<br />
primary grade (%)<br />
2008–2011*2007–2011*<br />
Net enrolment<br />
ratio (%)<br />
2008–2011*<br />
Net attendance<br />
ratio (%)<br />
2007–2011*<br />
New Zealand – – 109 86 91 95 101 101 99 100 – – – – 94 95 – –<br />
Nicaragua 85 x 89 x 82 11 55 56 119 116 93 95 71 y 70 y – 56 x 43 49 35 x 47 x<br />
Niger 52 x 23 x 27 1 4 4 73 60 64 52 44 x 31 x 69 88 x 13 8 13 x 8 x<br />
Nigeria 78 66 59 28 14 14 87 79 60 55 65 60 80 98 – – 45 43<br />
Niue – – – – – – – – – – – – – – – – – –<br />
Norway – – 117 94 100 98 99 99 99 99 – – 99 – 94 94 – –<br />
Oman 98 98 169 68 45 45 107 104 100 97 – – – – 89 90 – –<br />
Pakistan 79 61 62 9 – – 104 85 81 67 70 62 62 – 38 29 35 29<br />
Palau – – 75 – – – – – – – – – – – – – – –<br />
Panama 98 97 204 43 67 67 109 106 99 98 – – 94 – 66 72 – –<br />
Papua New Guinea 65 72 34 2 101 99 63 57 – – – – – – – – – –<br />
Paraguay 99 99 99 24 35 35 101 98 86 86 87 89 78 – 58 62 81 x 80 x<br />
Peru 98 97 110 37 79 79 108 108 98 98 96 96 90 95 77 78 81 y 82 y<br />
Philippines 97 98 92 29 51 52 107 105 88 90 88 x 89 x 76 90 x 56 67 55 x 70 x<br />
Poland 100 100 128 65 65 66 98 97 96 96 – – 98 – 90 92 – –<br />
Portugal 100 100 115 55 82 82 116 112 99 100 – – – – – – – –<br />
Qatar 96 98 123 86 57 54 103 103 96 97 – – – – 76 93 – –<br />
Republic <strong>of</strong> Korea – – 109 84 118 119 106 105 99 98 – – 99 – 96 95 – –<br />
Republic <strong>of</strong> Moldova 99 100 105 38 76 75 94 93 90 90 84 x 85 x 95 100 x 78 79 82 x 85 x<br />
Romania 97 97 109 44 79 79 96 95 88 87 – – 97 – 82 83 – –<br />
Russian Federation 100 100 179 49 91 89 99 99 95 96 – – 96 – – – – –<br />
Rwanda 77 78 41 7 10 11 141 144 – – 86 89 – 76 x – – 15 16<br />
Saint Kitts and Nevis – – – – 92 88 93 94 86 86 – – 74 – 89 88 – –<br />
Saint Lucia – – 123 42 62 59 96 92 90 89 – – 92 – 85 85 – –<br />
Saint Vincent<br />
and <strong>the</strong> Grenadines – – 121 43 79 80 109 101 – – – – – – 85 96 – –<br />
Samoa 99 100 – – 35 41 107 109 93 97 88 y 89 y – – 73 83 51 y 70 y<br />
San Marino – – 112 50 96 89 89 101 91 93 – – – – – – – –<br />
Sao Tome and Principe 95 96 68 20 44 48 131 130 – – 86 85 68 84 44 52 30 31<br />
Saudi Arabia 99 97 191 48 – – 106 106 90 89 – – – – 78 83 – –<br />
Senegal 74 56 73 18 12 14 84 89 76 80 60 63 60 93 x – – 35 32<br />
Serbia 99 99 125 42 53 53 96 96 95 94 98 99 99 99 89 91 88 90<br />
Seychelles 99 99 146 43 106 97 117 117 – – – – – – – – – –<br />
Sierra Leone 69 50 36 – 7 7 129 120 – – 73 76 – 93 – – 40 33<br />
Singapore 100 100 149 75 – – – – – – – – 99 – – – – –<br />
Slovakia – – 109 74 92 89 102 102 – – – – 98 – – – – –<br />
Slovenia 100 100 107 72 87 85 98 97 97 97 – – 100 – 91 92 – –<br />
Solomon Islands – – 50 6 49 50 – – – – 63 y 69 y – – – – 29 y 30 y<br />
Somalia – – 7 1 – – – – – – 18 x 15 x – 85 x – – 12 x 8 x<br />
South Africa 97 98 127 21 65 65 104 100 90 91 80 x 83 x – – – – 41 x 48 x<br />
South Sudan s – – – – – – – – – – 32 25 – 65 – – 8 4<br />
Spain 100 100 114 68 126 127 106 105 100 100 – – 99 – 94 96 – –<br />
Sri Lanka 98 99 87 15 – – 99 99 94 94 – – – – – – – –<br />
<strong>State</strong> <strong>of</strong> Palestine 99 99 – 55 40 39 92 90 90 88 91 x 92 x – – 81 87 – –<br />
Sudan s – – – – – – – – – – 78 72 – 82 – – 33 30<br />
Suriname 98 99 179 32 85 86 116 111 91 91 95 x 94 x 90 92 x 46 55 56 x 67 x<br />
Swaziland 92 95 64 18 22 23 121 111 86 85 96 97 84 93 29 37 42 52<br />
Sweden – – 119 91 95 95 102 101 100 99 – – 99 – 94 94 – –<br />
Switzerland – – 130 85 99 100 103 102 99 99 – – – – 84 82 – –<br />
Syrian Arab Republic 96 94 63 23 10 9 119 116 100 98 87 x 86 x 95 100 x 67 67 63 x 63 x<br />
Tajikistan 100 100 91 13 9 8 104 100 99 96 99 y 96 y 99 100 x 90 80 89 x 74 x<br />
Thailand 98 x 98 x 113 24 98 101 91 90 90 89 98 x 98 x – 99 x 68 76 77 x 83 x<br />
The former Yugoslav<br />
Republic <strong>of</strong> Macedonia 99 99 109 57 25 26 89 91 97 99 99 98 – 99 – – 84 81<br />
Timor-Leste 80 79 53 1 – – 119 115 86 86 71 73 67 91 34 39 43 48<br />
Togo 88 75 50 4 9 9 147 132 – – 91 87 59 90 – – 51 40<br />
Tonga 99 x 100 x 53 25 – – – – – – – – – – – – – –<br />
Trinidad and Tobago 100 100 136 55 – – 107 103 98 97 98 x 98 x 89 98 x – – 84 x 90 x<br />
Tunisia 98 96 117 39 – – 111 107 – – 95 x 93 x 95 – – – – –<br />
Turkey 99 97 89 42 22 21 103 101 98 97 94 y 92 y 92 95 x 77 71 – –<br />
Turkmenistan 100 100 69 5 – – – – – – 99 x 99 x – 100 x – – 84 x 84 x<br />
Tuvalu – – 22 30 – – – – – – – – – – – – 35 y 47 y<br />
Uganda 90 85 48 13 14 14 120 122 90 92 82 y 80 y 32 72 x – – 17 y 17 y<br />
Ukraine 100 100 123 31 99 96 99 100 91 91 70 76 98 100 86 86 85 85<br />
admin.<br />
data<br />
survey<br />
data male female male female<br />
118<br />
THE STATE OF THE WORLD’S CHILDREN <strong>2013</strong>: <strong>Children</strong> with Disabilities
TABLE 5<br />
EduCATION<br />
Countries<br />
and areas<br />
Youth (15–24 years)<br />
literacy rate (%)<br />
2007–2011*<br />
male<br />
female<br />
Number per 100<br />
population<br />
2011<br />
mobile<br />
phones<br />
Pre-primary school<br />
participation Primary school participation Secondary school participation<br />
Gross enrolment<br />
ratio (%)<br />
2008–2011*<br />
Gross enrolment<br />
ratio (%)<br />
2008–2011*<br />
Net enrolment<br />
ratio (%)<br />
2008–2011*<br />
Net attendance<br />
ratio (%)<br />
2007–2011*<br />
Internet<br />
users male female male female male female male female<br />
Survival rate to last<br />
primary grade (%)<br />
2008–2011*2007–2011*<br />
Net enrolment<br />
ratio (%)<br />
2008–2011*<br />
Net attendance<br />
ratio (%)<br />
2007–2011*<br />
United Arab Emirates 94 x 97 x 149 70 – – – – – – – – – – – – – –<br />
United Kingdom – – 131 82 81 82 106 106 100 100 – – – – 95 97 – –<br />
United Republic<br />
<strong>of</strong> Tanzania 78 76 56 12 33 34 101 103 98 98 79 82 81 91 x – – 26 24<br />
United <strong>State</strong>s – – 106 78 68 70 102 101 95 96 – – 93 – 89 90 – –<br />
Uruguay 98 99 141 51 89 89 115 111 100 99 – – 95 – 66 73 – –<br />
Uzbekistan 100 100 92 30 26 26 95 93 93 91 96 x 96 x 98 100 x 93 91 91 x 90 x<br />
Vanuatu 94 94 – – 58 59 120 114 – – 80 82 71 88 46 49 38 36<br />
Venezuela<br />
(Bolivarian Republic <strong>of</strong>) 98 99 98 40 71 76 104 101 95 95 91 x 93 x 92 82 x 68 76 30 x 43 x<br />
Viet Nam 97 96 143 35 84 79 109 103 – – 98 98 – 99 – – 78 84<br />
Yemen 96 74 47 15 1 1 96 78 86 70 75 x 64 x – 73 x 49 31 49 x 27 x<br />
Zambia 82 67 61 12 – – 115 116 91 94 81 82 53 87 – – 38 36<br />
Zimbabwe – – 72 16 – – – – – – 87 89 – 79 x – – 48 49<br />
admin.<br />
data<br />
survey<br />
data male female male female<br />
MEMORANDUM<br />
Sudan and South Sudan s – – 56 19 – – – – – – – – – – – – – –<br />
SUMMARY INDICATORS #<br />
Sub-Saharan Africa 76 67 53 13 18 18 103 96 78 74 72 70 60 – – – 31 29<br />
Eastern and<br />
Sou<strong>the</strong>rn Africa 80 72 51 11 21 22 113 108 88 85 75 75 49 – 33 30 23 23<br />
West and Central<br />
Africa 73 61 54 14 14 14 96 86 69 64 68 64 68 90 – – 40 36<br />
Middle East and<br />
North Africa 94 89 94 29 25 23 103 97 92 87 – – – – 68 63 – –<br />
South Asia 86 73 69 9 48 49 107 105 93 91 83 79 – 95 54 46 55 46<br />
East Asia and Pacific 99 99 81 35 56 56 110 112 96 96 96 ** 97 ** 95 – 70 74 61 ** 63 **<br />
Latin America<br />
and Caribbean 97 97 107 39 70 70 116 112 96 95 – – 91 – 71 76 – –<br />
CEE/CIS 99 99 132 42 57 56 100 99 95 95 – – 96 – 83 82 – –<br />
Least developed countries 76 68 42 6 13 13 106 100 82 78 76 75 56 – 35 29 27 24<br />
World 92 87 85 33 48 48 107 105 92 90 82 ** 79 ** 81 – 64 61 49 ** 45 **<br />
s Due to <strong>the</strong> cession in July 2011 <strong>of</strong> <strong>the</strong> Republic <strong>of</strong> South Sudan by <strong>the</strong> Republic <strong>of</strong> <strong>the</strong> Sudan, and its subsequent admission to <strong>the</strong> United Nations on 14 July 2011, disaggregated data for <strong>the</strong> Sudan and South Sudan as separate<br />
<strong>State</strong>s are not yet available for all indicators. Aggregated data presented are for <strong>the</strong> Sudan pre-cession (see Memorandum item).<br />
# For a complete list <strong>of</strong> countries and areas in <strong>the</strong> regions, subregions and country categories, see page 98.<br />
DEFINITIONS OF THE INDICATORS<br />
Youth literacy rate – Number <strong>of</strong> literate persons aged 15–24 years, expressed as a percentage <strong>of</strong> <strong>the</strong> total population in<br />
that group.<br />
Mobile phones – The number <strong>of</strong> active subscriptions to a public mobile telephone service, including <strong>the</strong> number <strong>of</strong> prepaid<br />
SIM cards active during <strong>the</strong> past three months.<br />
Internet users – The estimated number <strong>of</strong> Internet users, including those using <strong>the</strong> Internet from any device (including<br />
mobile phones) in <strong>the</strong> last 12 months.<br />
Pre-primary school gross enrolment ratio – Number <strong>of</strong> children enrolled in pre-primary school, regardless <strong>of</strong> age,<br />
expressed as a percentage <strong>of</strong> <strong>the</strong> total number <strong>of</strong> children <strong>of</strong> <strong>of</strong>ficial pre-primary school age.<br />
Primary school gross enrolment ratio – Number <strong>of</strong> children enrolled in primary school, regardless <strong>of</strong> age, expressed as a<br />
percentage <strong>of</strong> <strong>the</strong> total number <strong>of</strong> children <strong>of</strong> <strong>of</strong>ficial primary school age.<br />
Primary school net enrolment ratio – Number <strong>of</strong> children enrolled in primary or secondary school who are <strong>of</strong> <strong>of</strong>ficial<br />
primary school age, expressed as a percentage <strong>of</strong> <strong>the</strong> total number <strong>of</strong> children <strong>of</strong> <strong>of</strong>ficial primary school age. Because <strong>of</strong> <strong>the</strong><br />
inclusion <strong>of</strong> primary-school-aged children enrolled in secondary school, this indicator can also be referred to as a primary<br />
adjusted net enrolment ratio.<br />
Primary school net attendance ratio – Number <strong>of</strong> children attending primary or secondary school who are <strong>of</strong> <strong>of</strong>ficial<br />
primary school age, expressed as a percentage <strong>of</strong> <strong>the</strong> total number <strong>of</strong> children <strong>of</strong> <strong>of</strong>ficial primary school age. Because <strong>of</strong><br />
<strong>the</strong> inclusion <strong>of</strong> primary-school-aged children attending secondary school, this indicator can also be referred to as a primary<br />
adjusted net attendance ratio.<br />
Survival rate to last primary grade – Percentage <strong>of</strong> children entering <strong>the</strong> first grade <strong>of</strong> primary school who eventually<br />
reach <strong>the</strong> last grade <strong>of</strong> primary school.<br />
Secondary school net enrolment ratio – Number <strong>of</strong> children enrolled in secondary school who are <strong>of</strong> <strong>of</strong>ficial secondary<br />
school age, expressed as a percentage <strong>of</strong> <strong>the</strong> total number <strong>of</strong> children <strong>of</strong> <strong>of</strong>ficial secondary school age. Secondary net<br />
enrolment ratio does not include secondary-school-aged children enrolled in tertiary education owing to challenges in age<br />
reporting and recording at that level.<br />
Secondary school net attendance ratio – Number <strong>of</strong> children attending secondary or tertiary school who are <strong>of</strong> <strong>of</strong>ficial<br />
secondary school age, expressed as a percentage <strong>of</strong> <strong>the</strong> total number <strong>of</strong> children <strong>of</strong> <strong>of</strong>ficial secondary school age. Because <strong>of</strong><br />
<strong>the</strong> inclusion<br />
<strong>of</strong> secondary-school-aged children attending tertiary school, this indicator can also be referred to as a secondary adjusted net<br />
attendance ratio.<br />
All data refer to <strong>of</strong>ficial International Standard Classifications <strong>of</strong> Education (ISCED) for <strong>the</strong> primary and<br />
secondary education levels and thus may not directly correspond to a country-specific school system.<br />
MAIN DATA SOURCES<br />
Youth literacy – UNESCO Institute for Statistics (UIS).<br />
Phone and Internet use – International Telecommunications Union, Geneva.<br />
Pre-primary, primary and secondary enrolment – UIS. Estimates based on<br />
administrative data from International Education Management Information Systems (EMIS)<br />
with United Nations population estimates.<br />
Primary and secondary school attendance – Demographic and Health Surveys (DHS),<br />
Multiple Indicator Cluster Surveys (MICS) and o<strong>the</strong>r national household surveys.<br />
Survival rate to last primary grade – Administrative data: UIS; survey data: DHS and<br />
MICS. Regional and global averages calculated by UNICEF.<br />
NOTES<br />
− Data not available.<br />
x Data refer to years or periods o<strong>the</strong>r than those specified in <strong>the</strong> column heading. Such<br />
data are not included in <strong>the</strong> calculation <strong>of</strong> regional and global averages, with <strong>the</strong><br />
exception <strong>of</strong> 2005–2006 data from India. Estimates from data years prior to 2000 are not<br />
displayed.<br />
y Data differ from <strong>the</strong> standard definition or refer to only part <strong>of</strong> a country. If <strong>the</strong>y fall within<br />
<strong>the</strong> noted reference period, such data are included in <strong>the</strong> calculation <strong>of</strong> regional and global<br />
averages.<br />
z Data provided by <strong>the</strong> Chinese Ministry <strong>of</strong> Education. The UNESCO Institute for Statistics<br />
dataset does not currently include net enrolment rates or primary school survival for<br />
China.<br />
* Data refer to <strong>the</strong> most recent year available during <strong>the</strong> period specified in <strong>the</strong> column<br />
heading.<br />
** Excludes China.<br />
STATISTICAL TABLES 119
TABLE 6: dEmOGRApHIC INdICATORS<br />
Countries<br />
and areas<br />
Total Urbanized Average annual<br />
Population (thousands)<br />
Population annual<br />
fertility population growth rate <strong>of</strong> urban<br />
2011<br />
growth rate (%) Crude death rate Crude birth rate Life expectancy rate (%) population (%)<br />
total under 18 under 5 1990–2011 2011–2030 a 1970 1990 2011 1970 1990 2011 1970 1990 2011 2011 2011 1990–2011 2011–2030 a<br />
Afghanistan 32,358 17,219 5,686 4.3 2.6 29 22 16 52 52 43 35 42 49 6.2 24 5.6 4.1<br />
Albania 3,216 877 203 -0.1 0.1 8 6 6 33 25 13 67 72 77 1.5 53 1.7 1.5<br />
Algeria 35,980 11,641 3,464 1.7 1.0 16 6 5 49 32 20 53 67 73 2.2 73 3.3 1.7<br />
Andorra 86 16 4 2.3 1.4 – – – – – – – – – – 87 1.9 1.0<br />
Angola 19,618 10,399 3,393 3.1 2.4 27 23 14 52 53 41 37 41 51 5.3 59 5.3 3.3<br />
Antigua and Barbuda 90 28 8 1.7 0.8 – – – – – – – – – – 30 0.9 1.5<br />
Argentina 40,765 12,105 3,423 1.1 0.7 9 8 8 23 22 17 66 72 76 2.2 93 1.4 0.8<br />
Armenia 3,100 763 225 -0.6 0.0 5 8 9 23 21 15 70 68 74 1.7 64 -0.9 0.3<br />
Australia 22,606 5,190 1,504 1.3 1.1 9 7 7 20 15 14 71 77 82 2.0 89 1.5 1.2<br />
Austria 8,413 1,512 381 0.4 0.1 13 11 9 15 11 9 70 75 81 1.4 68 0.6 0.5<br />
Azerbaijan 9,306 2,430 846 1.2 0.8 7 7 7 29 27 20 65 65 71 2.2 54 1.2 1.4<br />
Bahamas 347 95 27 1.4 0.9 6 6 5 26 24 15 66 69 76 1.9 84 1.7 1.1<br />
Bahrain 1,324 311 102 4.7 1.2 7 3 3 38 29 19 64 72 75 2.5 89 4.7 1.3<br />
Bangladesh 150,494 55,515 14,421 1.7 1.0 23 10 6 47 36 20 42 59 69 2.2 28 3.4 2.7<br />
Barbados 274 59 15 0.3 0.1 9 8 9 22 16 11 69 75 77 1.6 44 1.7 1.1<br />
Belarus 9,559 1,766 527 -0.3 -0.4 7 11 14 16 14 11 71 71 70 1.5 75 0.3 0.0<br />
Belgium 10,754 2,182 619 0.4 0.2 12 11 10 15 12 11 71 76 80 1.8 97 0.4 0.3<br />
Belize 318 131 37 2.4 1.7 8 5 4 42 37 24 66 72 76 2.7 45 2.2 1.8<br />
Benin 9,100 4,568 1,546 3.1 2.5 26 17 12 48 47 39 40 49 56 5.2 45 4.3 3.7<br />
Bhutan 738 258 70 1.3 1.0 23 14 7 47 38 20 41 53 67 2.3 36 5.0 2.6<br />
Bolivia (Plurinational<br />
<strong>State</strong> <strong>of</strong>) 10,088 4,254 1,230 2.0 1.5 20 11 7 46 36 26 46 59 67 3.3 67 2.9 2.0<br />
Bosnia and Herzegovina 3,752 686 167 -0.7 -0.4 7 9 10 23 15 8 66 67 76 1.1 48 0.3 0.6<br />
Botswana 2,031 788 229 1.8 0.8 13 7 13 46 35 23 55 64 53 2.7 62 3.7 1.5<br />
Brazil 196,655 59,010 14,662 1.3 0.6 10 7 6 35 24 15 59 66 73 1.8 85 1.9 0.8<br />
Brunei Darussalam 406 124 37 2.3 1.3 7 4 3 36 29 19 67 73 78 2.0 76 3.0 1.7<br />
Bulgaria 7,446 1,249 378 -0.8 -0.8 9 12 15 16 12 10 71 71 73 1.5 73 -0.3 -0.2<br />
Burkina Faso 16,968 8,824 3,047 2.9 2.8 23 17 12 48 47 43 41 49 55 5.8 27 6.0 5.2<br />
Burundi 8,575 3,813 1,221 2.0 1.5 20 19 14 44 46 34 44 46 50 4.2 11 4.7 4.0<br />
Cambodia 14,305 5,480 1,505 1.9 1.0 20 12 8 42 44 22 44 56 63 2.5 20 3.1 2.4<br />
Cameroon 20,030 9,420 3,102 2.4 1.9 19 14 14 45 42 36 46 53 52 4.4 52 3.7 2.8<br />
Canada 34,350 6,926 1,936 1.0 0.8 7 7 8 17 14 11 73 77 81 1.7 81 1.3 0.9<br />
Cape Verde 501 190 50 1.7 0.8 15 9 5 41 39 20 53 65 74 2.3 63 3.4 1.7<br />
Central African Republic 4,487 2,098 658 2.0 1.8 23 17 16 43 41 35 42 49 48 4.5 39 2.3 2.8<br />
Chad 11,525 5,992 2,047 3.1 2.5 22 17 16 46 47 44 44 51 50 5.9 22 3.3 3.5<br />
Chile 17,270 4,615 1,222 1.3 0.6 10 6 6 29 23 14 62 74 79 1.8 89 1.6 0.8<br />
China 1,347,565 317,892 82,205 0.8 0.2 9 7 7 36 21 12 63 69 73 1.6 51 3.9 1.8<br />
Colombia 46,927 15,951 4,509 1.6 1.0 9 6 5 38 27 19 61 68 74 2.3 75 2.1 1.3<br />
Comoros 754 366 124 2.6 2.3 18 11 9 47 37 37 48 56 61 4.9 28 2.6 3.0<br />
Congo 4,140 1,940 637 2.6 2.1 14 12 11 43 38 35 53 56 57 4.5 64 3.4 2.7<br />
Cook Islands 20 8 2 0.7 0.4 – – – – – – – – – – 74 1.9 0.8<br />
Costa Rica 4,727 1,405 359 2.1 1.0 7 4 4 33 27 16 67 76 79 1.8 65 3.2 1.6<br />
Côte d’Ivoire 20,153 9,539 2,992 2.3 2.1 21 13 12 52 41 34 44 53 55 4.3 51 3.5 3.2<br />
Croatia 4,396 806 215 -0.1 -0.3 10 11 12 15 12 10 69 72 77 1.5 58 0.2 0.3<br />
Cuba 11,254 2,343 543 0.3 -0.1 7 7 7 29 17 10 70 74 79 1.5 75 0.4 0.0<br />
Cyprus 1,117 244 65 1.8 0.8 7 7 7 19 19 12 73 77 80 1.5 70 2.0 1.1<br />
Czech Republic 10,534 1,836 567 0.1 0.1 12 12 10 16 12 11 70 72 78 1.5 73 0.0 0.2<br />
Democratic People’s<br />
Republic <strong>of</strong> Korea 24,451 6,757 1,706 0.9 0.4 7 5 10 35 21 14 62 71 69 2.0 60 1.1 0.7<br />
Democratic Republic<br />
<strong>of</strong> <strong>the</strong> Congo 67,758 35,852 12,037 3.0 2.4 21 19 16 48 50 43 44 47 48 5.7 34 4.0 3.8<br />
Denmark 5,573 1,212 327 0.4 0.3 10 12 10 15 12 11 73 75 79 1.9 87 0.5 0.4<br />
Djibouti 906 382 115 2.3 1.8 20 14 10 49 42 29 43 51 58 3.7 77 2.4 1.9<br />
Dominica 68 21 6 -0.2 0.1 – – – – – – – – – – 67 -0.3 0.4<br />
Dominican Republic 10,056 3,672 1,051 1.6 1.0 11 6 6 42 30 21 58 68 73 2.5 70 2.7 1.5<br />
Ecuador 14,666 5,234 1,469 1.7 1.0 12 6 5 42 29 20 58 69 76 2.4 67 2.7 1.7<br />
Egypt 82,537 30,537 9,092 1.8 1.3 16 9 5 41 32 23 50 62 73 2.7 43 1.8 2.0<br />
El Salvador 6,227 2,394 631 0.7 0.7 13 8 7 43 32 20 57 66 72 2.2 65 2.0 1.3<br />
Equatorial Guinea 720 327 111 3.1 2.2 25 20 14 39 47 36 40 47 51 5.1 39 3.7 3.0<br />
Eritrea 5,415 2,588 879 2.6 2.3 21 16 8 47 41 36 43 48 62 4.4 21 4.0 4.4<br />
Estonia 1,341 250 80 -0.7 -0.2 11 13 13 15 14 12 71 69 75 1.7 69 -0.9 0.0<br />
Ethiopia 84,734 40,698 11,915 2.7 1.8 21 18 9 47 48 31 43 47 59 4.0 17 4.1 3.6<br />
Fiji 868 300 91 0.8 0.5 8 6 7 34 29 21 60 66 69 2.6 52 1.9 1.2<br />
Finland 5,385 1,084 303 0.4 0.2 10 10 10 14 13 11 70 75 80 1.9 84 0.6 0.4<br />
France 63,126 13,837 3,985 0.5 0.4 11 9 9 17 13 13 72 77 82 2.0 86 1.2 0.8<br />
Gabon 1,534 642 188 2.4 1.8 20 11 9 34 38 27 47 61 63 3.2 86 3.4 2.0<br />
120<br />
THE STATE OF THE WORLD’S CHILDREN <strong>2013</strong>: <strong>Children</strong> with Disabilities
TABLE 6<br />
dEmOGRApHIC INdICATORS<br />
Countries<br />
and areas<br />
Total Urbanized Average annual<br />
Population (thousands)<br />
Population annual<br />
fertility population growth rate <strong>of</strong> urban<br />
2011<br />
growth rate (%) Crude death rate Crude birth rate Life expectancy rate (%) population (%)<br />
total under 18 under 5 1990–2011 2011–2030 a 1970 1990 2011 1970 1990 2011 1970 1990 2011 2011 2011 1990–2011 2011–2030 a<br />
Gambia 1,776 897 292 2.9 2.4 26 13 9 51 47 38 38 53 58 4.8 57 4.8 3.2<br />
Georgia 4,329 892 258 -1.1 -0.7 9 9 11 19 17 12 67 71 74 1.5 53 -1.3 -0.3<br />
Germany 82,163 13,437 3,504 0.2 -0.2 12 11 11 14 11 9 71 75 80 1.4 74 0.2 0.1<br />
Ghana 24,966 11,174 3,591 2.5 2.0 17 11 8 47 39 31 49 57 64 4.1 52 4.2 3.0<br />
Greece 11,390 2,001 600 0.5 0.1 8 9 10 17 10 10 72 77 80 1.5 61 0.7 0.6<br />
Grenada 105 35 10 0.4 0.1 9 8 6 28 28 19 64 69 76 2.2 39 1.2 1.0<br />
Guatemala 14,757 7,072 2,192 2.4 2.3 15 9 5 44 39 32 52 62 71 3.9 50 3.3 3.2<br />
Guinea 10,222 5,045 1,691 2.7 2.3 30 21 13 49 46 38 34 44 54 5.2 35 3.8 3.7<br />
Guinea-Bissau 1,547 739 244 2.0 2.0 26 22 16 46 46 38 37 43 48 5.0 44 4.1 3.2<br />
Guyana 756 297 60 0.2 0.3 12 10 6 37 25 18 56 61 70 2.2 28 0.0 1.0<br />
Haiti 10,124 4,271 1,245 1.7 1.1 18 13 9 39 37 26 47 55 62 3.3 53 4.7 2.6<br />
Holy See 0 0 0 -2.5 -0.1 – – – – – – – – – – 100 -2.5 -0.1<br />
Honduras 7,755 3,338 975 2.2 1.7 15 7 5 47 38 26 52 66 73 3.1 52 3.4 2.6<br />
Hungary 9,966 1,800 493 -0.2 -0.2 11 14 13 15 12 10 69 69 74 1.4 69 0.1 0.4<br />
Iceland 324 81 24 1.1 1.0 7 7 6 21 17 15 74 78 82 2.1 94 1.3 1.1<br />
India 1,241,492 448,336 128,542 1.7 1.1 16 11 8 38 31 22 49 58 65 2.6 31 2.6 2.3<br />
Indonesia 242,326 77,471 21,210 1.3 0.8 15 8 7 40 26 18 52 62 69 2.1 51 3.7 1.9<br />
Iran (Islamic Republic <strong>of</strong>) 74,799 20,819 6,269 1.5 0.6 16 8 5 42 34 17 51 62 73 1.6 69 2.4 0.9<br />
Iraq 32,665 16,146 5,294 3.0 2.8 12 7 6 45 38 35 58 67 69 4.6 66 2.8 2.9<br />
Ireland 4,526 1,137 370 1.2 0.9 11 9 6 22 14 16 71 75 81 2.1 62 1.6 1.4<br />
Israel 7,562 2,417 754 2.5 1.4 7 6 5 26 22 21 72 76 82 2.9 92 2.6 1.4<br />
Italy 60,789 10,308 2,910 0.3 0.0 10 10 10 17 10 9 71 77 82 1.4 68 0.4 0.4<br />
Jamaica 2,751 956 254 0.7 0.2 8 7 7 36 26 18 68 71 73 2.3 52 1.0 0.6<br />
Japan 126,497 20,375 5,418 0.2 -0.3 7 7 9 19 10 8 72 79 83 1.4 91 1.0 0.0<br />
Jordan 6,330 2,747 817 2.9 1.5 11 5 4 51 36 25 61 70 73 3.0 83 3.6 1.7<br />
Kazakhstan 16,207 4,800 1,726 -0.1 0.8 9 9 10 26 23 21 62 67 67 2.5 54 -0.3 1.0<br />
Kenya 41,610 20,317 6,805 2.7 2.4 15 10 10 51 42 37 52 59 57 4.7 24 4.4 4.1<br />
Kiribati 101 36 10 1.6 1.4 – – – – – – – – – – 44 2.7 2.0<br />
Kuwait 2,818 863 282 1.4 1.9 6 3 3 49 21 18 67 72 75 2.3 98 1.4 1.9<br />
Kyrgyzstan 5,393 1,957 624 1.0 1.1 11 8 7 31 31 24 60 66 68 2.7 35 0.7 1.8<br />
Lao People’s<br />
Democratic Republic 6,288 2,581 682 1.9 1.1 18 13 6 42 42 22 46 54 67 2.7 34 5.7 3.3<br />
Latvia 2,243 382 117 -0.8 -0.4 11 13 14 14 14 11 70 69 73 1.5 68 -0.9 -0.2<br />
Lebanon 4,259 1,271 328 1.8 0.5 9 7 7 33 26 15 65 69 73 1.8 87 2.0 0.6<br />
Lesotho 2,194 970 276 1.4 0.8 17 10 15 43 36 28 49 59 48 3.1 28 4.6 2.9<br />
Liberia 4,129 2,057 700 3.2 2.4 23 21 11 49 46 39 41 42 57 5.2 48 2.2 3.2<br />
Libya 6,423 2,293 717 1.9 1.0 16 4 4 49 26 23 52 68 75 2.5 78 2.0 1.3<br />
Liechtenstein 36 7 2 1.1 0.7 – – – – – – – – – – 14 0.3 1.1<br />
Lithuania 3,307 616 173 -0.5 -0.4 9 11 14 17 15 11 71 71 72 1.5 67 -0.6 -0.1<br />
Luxembourg 516 110 29 1.4 1.1 12 10 8 13 13 12 70 75 80 1.7 85 1.7 1.3<br />
Madagascar 21,315 10,570 3,378 3.0 2.7 21 16 6 48 45 35 44 51 67 4.6 33 4.6 4.3<br />
Malawi 15,381 8,116 2,829 2.4 3.2 24 18 12 52 48 44 41 47 54 6.0 16 3.8 4.7<br />
Malaysia 28,859 10,244 2,796 2.2 1.3 7 5 5 33 28 20 64 70 74 2.6 73 4.0 1.9<br />
Maldives 320 104 26 1.8 0.9 21 9 4 50 41 17 44 61 77 1.7 41 4.0 2.6<br />
Mali 15,840 8,525 2,995 2.9 2.8 30 21 14 49 49 46 34 44 51 6.2 35 4.8 4.3<br />
Malta 418 77 20 0.6 0.2 9 8 8 16 16 9 70 75 80 1.3 95 0.8 0.3<br />
Marshall Islands 55 20 5 0.7 1.1 – – – – – – – – – – 72 1.2 1.5<br />
Mauritania 3,542 1,635 522 2.7 2.0 18 11 9 47 41 33 47 56 59 4.5 41 2.9 3.0<br />
Mauritius 1,307 344 81 1.0 0.3 7 6 7 29 22 13 63 69 73 1.6 42 0.8 0.8<br />
Mexico 114,793 39,440 10,943 1.5 0.9 10 5 5 43 28 19 61 71 77 2.3 78 1.9 1.2<br />
Micronesia<br />
(Federated <strong>State</strong>s <strong>of</strong>) 112 48 13 0.7 0.8 9 7 6 41 34 24 62 66 69 3.4 23 0.1 1.6<br />
Monaco 35 7 2 0.7 0.0 – – – – – – – – – – 100 0.7 0.0<br />
Mongolia 2,800 934 317 1.2 1.2 15 10 6 44 32 23 56 61 68 2.5 69 2.0 2.0<br />
Montenegro 632 145 39 0.2 0.0 3 5 10 10 11 12 69 76 75 1.6 63 1.5 0.4<br />
Morocco 32,273 10,790 3,048 1.3 0.8 17 8 6 47 30 19 52 64 72 2.2 57 2.0 1.4<br />
Mozambique 23,930 12,086 3,877 2.7 2.1 25 21 14 48 43 37 39 43 50 4.8 31 4.6 3.3<br />
Myanmar 48,337 14,832 3,981 1.0 0.6 16 11 8 40 27 17 50 57 65 2.0 33 2.3 2.2<br />
Namibia 2,324 994 288 2.4 1.4 15 9 8 43 38 26 53 61 62 3.2 38 3.9 2.8<br />
Nauru 10 4 1 0.6 0.4 – – – – – – – – – – 100 0.6 0.4<br />
Nepal 30,486 12,883 3,453 2.2 1.4 21 13 6 44 39 24 43 54 69 2.7 17 5.3 3.4<br />
Ne<strong>the</strong>rlands 16,665 3,526 907 0.5 0.2 8 9 8 17 13 11 74 77 81 1.8 83 1.4 0.5<br />
New Zealand 4,415 1,091 320 1.2 0.9 9 8 7 22 17 15 71 75 81 2.2 86 1.3 1.0<br />
Nicaragua 5,870 2,390 684 1.7 1.1 14 7 5 46 37 23 54 64 74 2.6 58 2.1 1.7<br />
Niger 16,069 8,922 3,196 3.4 3.4 26 24 13 56 56 48 38 41 55 7.0 18 4.2 5.3<br />
Nigeria 162,471 79,931 27,195 2.4 2.4 22 19 14 46 44 40 42 46 52 5.5 50 4.1 3.5<br />
STATISTICAL TABLES 121
TABLE 6<br />
dEmOGRApHIC INdICATORS<br />
Countries<br />
Population (thousands)<br />
2011<br />
Population annual<br />
growth rate (%) Crude death rate Crude birth rate Life expectancy<br />
and areas<br />
total under 18 under 5 1990–2011 2011–2030 a 1970 1990 2011 1970 1990 2011 1970 1990 2011 2011 2011 1990–2011 2011–2030 a<br />
Niue 1 1 0 -2.3 -1.5 – – – – – – – – – – 38 -1.4 -0.5<br />
Norway 4,925 1,117 309 0.7 0.7 10 11 8 17 14 12 74 77 81 1.9 79 1.2 0.9<br />
Oman 2,846 910 290 2.0 1.2 16 5 4 49 38 18 51 71 73 2.2 73 2.5 1.6<br />
Pakistan 176,745 73,756 22,064 2.2 1.5 15 10 7 43 40 27 53 61 65 3.3 36 3.0 2.6<br />
Palau 21 7 2 1.5 1.0 – – – – – – – – – – 84 2.4 1.4<br />
Panama 3,571 1,213 345 1.9 1.2 8 5 5 37 26 20 65 72 76 2.5 75 3.5 1.7<br />
Papua New Guinea 7,014 3,168 975 2.5 2.0 17 10 7 44 35 30 46 56 63 3.9 12 1.6 3.6<br />
Paraguay 6,568 2,587 744 2.1 1.5 7 6 5 37 33 24 65 68 72 2.9 62 3.2 2.1<br />
Peru 29,400 10,421 2,902 1.4 1.0 14 7 5 42 30 20 53 66 74 2.5 77 2.0 1.3<br />
Philippines 94,852 39,205 11,161 2.1 1.5 9 7 6 39 33 25 61 65 69 3.1 49 2.1 2.3<br />
Poland 38,299 7,023 2,008 0.0 -0.1 8 10 10 17 15 11 70 71 76 1.4 61 0.0 0.1<br />
Portugal 10,690 1,930 501 0.4 -0.2 11 10 10 21 11 9 67 74 79 1.3 61 1.5 0.5<br />
Qatar 1,870 302 97 6.5 1.2 6 2 2 36 24 12 66 74 78 2.2 99 6.8 1.3<br />
Republic <strong>of</strong> Korea 48,391 9,842 2,488 0.6 0.2 9 6 6 32 16 10 61 72 81 1.4 83 1.1 0.4<br />
Republic <strong>of</strong> Moldova 3,545 740 223 -1.0 -0.6 10 10 13 18 19 12 65 68 69 1.5 48 -0.9 0.6<br />
Romania 21,436 3,928 1,093 -0.4 -0.3 9 11 12 21 14 10 68 69 74 1.4 53 -0.4 0.0<br />
Russian Federation 142,836 26,115 8,264 -0.2 -0.2 9 12 14 14 14 12 69 68 69 1.5 74 -0.1 0.0<br />
Rwanda 10,943 5,352 1,909 2.1 2.5 20 32 12 51 45 41 44 33 55 5.3 19 8.1 4.3<br />
Saint Kitts and Nevis 53 17 5 1.3 0.9 – – – – – – – – – – 32 0.9 1.7<br />
Saint Lucia 176 55 15 1.2 0.7 9 6 6 39 28 17 64 71 75 2.0 18 -1.3 -1.4<br />
Saint Vincent<br />
and <strong>the</strong> Grenadines 109 35 9 0.1 0.1 11 7 7 40 25 17 61 69 72 2.0 49 0.9 0.8<br />
Samoa 184 81 22 0.6 0.5 10 7 5 39 32 24 55 65 72 3.8 20 0.3 0.3<br />
San Marino 32 6 2 1.3 0.3 – – – – – – – – – – 94 1.5 0.4<br />
Sao Tome and Principe 169 79 24 1.8 1.7 13 10 8 41 38 31 55 61 65 3.6 63 3.5 2.5<br />
Saudi Arabia 28,083 9,923 3,186 2.6 1.7 15 5 4 47 36 22 52 69 74 2.7 82 3.0 1.9<br />
Senegal 12,768 6,425 2,125 2.7 2.4 24 13 9 51 44 37 41 53 59 4.7 43 3.1 3.3<br />
Serbia 9,854 2,089 551 0.1 -0.2 9 10 12 18 15 11 68 72 75 1.6 56 0.7 0.4<br />
Seychelles 87 43 14 1.0 0.3 – – – – – – – – – – 54 1.4 1.0<br />
Sierra Leone 5,997 2,965 984 2.0 1.9 29 25 15 47 44 38 35 39 48 4.9 39 2.8 2.9<br />
Singapore 5,188 1,104 238 2.6 0.7 5 5 5 23 19 9 68 76 81 1.3 100 2.6 0.7<br />
Slovakia 5,472 1,024 281 0.2 0.1 9 10 10 18 15 11 70 71 75 1.3 55 0.0 0.3<br />
Slovenia 2,035 344 102 0.3 0.1 10 10 10 17 11 10 69 73 79 1.5 50 0.2 0.4<br />
Solomon Islands 552 254 81 2.8 2.2 13 11 6 45 40 31 54 57 68 4.2 20 4.7 4.0<br />
Somalia 9,557 4,896 1,701 1.8 2.8 24 20 15 51 45 43 40 45 51 6.3 38 2.9 4.1<br />
South Africa 50,460 18,045 4,989 1.5 0.4 14 8 15 38 29 21 53 62 53 2.4 62 2.3 1.1<br />
South Sudan s 10,314 – – 2.6 2.3 – – – – – – – – – – 18 4.0 3.9<br />
Spain 46,455 8,306 2,546 0.8 0.4 9 9 9 20 10 11 72 77 81 1.5 77 1.0 0.6<br />
Sri Lanka 21,045 6,183 1,886 0.9 0.5 9 7 7 31 20 18 63 70 75 2.3 15 0.3 2.0<br />
<strong>State</strong> <strong>of</strong> Palestine 4,152 2,051 635 3.3 2.6 13 5 4 50 45 33 56 68 73 4.4 74 3.7 2.9<br />
Sudan s 34,318 – – 2.5 2.1 – – – – – – – – – – 33 3.2 2.9<br />
Suriname 529 176 47 1.3 0.7 9 7 7 37 23 18 63 67 71 2.3 70 2.0 1.1<br />
Swaziland 1,203 548 158 1.6 1.0 18 10 14 49 43 29 48 59 49 3.3 21 1.2 1.5<br />
Sweden 9,441 1,916 562 0.5 0.5 10 11 10 14 14 12 74 78 81 1.9 85 0.6 0.7<br />
Switzerland 7,702 1,435 382 0.7 0.3 9 9 8 16 12 10 73 78 82 1.5 74 0.7 0.5<br />
Syrian Arab Republic 20,766 8,923 2,446 2.5 1.5 11 5 4 47 36 22 60 71 76 2.9 56 3.1 2.2<br />
Tajikistan 6,977 3,052 883 1.3 1.3 10 8 6 40 39 28 60 63 68 3.2 27 0.5 2.1<br />
Thailand 69,519 17,111 4,270 0.9 0.3 10 5 7 38 19 12 60 73 74 1.6 34 1.6 1.6<br />
The former Yugoslav<br />
Republic <strong>of</strong> Macedonia 2,064 445 112 0.4 -0.1 8 8 9 24 17 11 66 71 75 1.4 59 0.5 0.4<br />
Timor-Leste 1,154 616 201 2.1 2.9 23 18 8 42 43 38 40 46 62 6.1 28 3.6 4.1<br />
Togo 6,155 2,831 870 2.5 1.8 20 14 11 49 42 32 45 53 57 4.0 38 3.8 3.0<br />
Tonga 105 46 14 0.4 0.8 7 6 6 36 31 27 65 70 72 3.9 23 0.6 1.5<br />
Trinidad and Tobago 1,346 334 96 0.5 0.0 7 7 8 27 21 15 65 69 70 1.6 14 2.7 1.7<br />
Tunisia 10,594 3,001 885 1.2 0.7 14 6 6 39 27 17 54 69 75 2.0 66 1.9 1.1<br />
Turkey 73,640 23,107 6,489 1.5 0.9 16 8 5 39 26 18 50 63 74 2.1 72 2.4 1.6<br />
Turkmenistan 5,105 1,785 499 1.6 1.0 11 8 8 37 35 21 58 63 65 2.4 49 1.9 1.8<br />
Tuvalu 10 4 1 0.4 0.6 – – – – – – – – – – 51 1.5 1.3<br />
Uganda 34,509 19,042 6,638 3.2 2.9 16 17 12 49 50 45 50 47 54 6.1 16 4.8 5.3<br />
Ukraine 45,190 7,977 2,465 -0.6 -0.6 9 13 16 15 13 11 71 70 68 1.5 69 -0.5 -0.2<br />
United Arab Emirates 7,891 1,590 451 7.0 1.5 7 3 1 37 26 13 62 72 77 1.7 84 7.3 1.7<br />
United Kingdom 62,417 13,153 3,858 0.4 0.6 12 11 9 15 14 12 72 76 80 1.9 80 0.5 0.8<br />
United Republic<br />
<strong>of</strong> Tanzania 46,218 23,690 8,267 2.8 3.0 18 15 10 48 44 41 47 51 58 5.5 27 4.5 4.7<br />
United <strong>State</strong>s 313,085 75,491 21,629 1.0 0.8 9 9 8 16 16 14 71 75 79 2.1 82 1.4 1.0<br />
Uruguay 3,380 912 245 0.4 0.3 10 10 9 21 18 15 69 73 77 2.1 93 0.6 0.4<br />
Total<br />
fertility<br />
rate<br />
Urbanized<br />
population<br />
(%)<br />
Average annual<br />
growth rate <strong>of</strong> urban<br />
population (%)<br />
122<br />
THE STATE OF THE WORLD’S CHILDREN <strong>2013</strong>: <strong>Children</strong> with Disabilities
TABLE 6<br />
dEmOGRApHIC INdICATORS<br />
Countries<br />
Population (thousands)<br />
2011<br />
Population annual<br />
growth rate (%) Crude death rate Crude birth rate Life expectancy<br />
and areas<br />
total under 18 under 5 1990–2011 2011–2030 a 1970 1990 2011 1970 1990 2011 1970 1990 2011 2011 2011 1990–2011 2011–2030 a<br />
Uzbekistan 27,760 9,849 2,802 1.4 1.0 10 7 7 36 35 21 63 67 68 2.3 36 0.9 1.7<br />
Vanuatu 246 109 34 2.5 2.2 14 8 5 42 36 29 52 63 71 3.8 25 3.8 3.4<br />
Venezuela (Bolivarian<br />
Republic <strong>of</strong>) 29,437 10,215 2,935 1.9 1.2 7 5 5 37 29 20 64 71 74 2.4 94 2.4 1.3<br />
Viet Nam 88,792 25,532 7,202 1.3 0.7 18 8 5 41 30 16 48 66 75 1.8 31 3.4 2.5<br />
Yemen 24,800 12,697 4,179 3.5 2.7 24 12 6 51 52 38 40 56 65 5.1 32 5.5 4.3<br />
Zambia 13,475 7,169 2,509 2.6 3.1 17 17 15 49 44 46 49 47 49 6.3 39 2.5 4.3<br />
Zimbabwe 12,754 5,841 1,706 0.9 1.7 13 9 13 48 37 29 55 61 51 3.2 39 2.3 3.0<br />
MEMORANDUM<br />
Sudan and<br />
South Sudan s – 20,660 6,472 – – 19 14 9 46 41 32 45 53 61 4.3 – – –<br />
Total<br />
fertility<br />
rate<br />
Urbanized<br />
population<br />
(%)<br />
Average annual<br />
growth rate <strong>of</strong> urban<br />
population (%)<br />
SUMMARY INDICATORS #<br />
Sub-Saharan Africa 876,497 428,333 140,617 2.5 2.3 20 16 12 47 44 37 44 50 55 4.9 37 3.8 3.4<br />
Eastern and<br />
Sou<strong>the</strong>rn Africa 418,709 196,675 63,188 2.5 2.2 19 15 12 47 43 35 47 51 56 4.5 30 3.6 3.4<br />
West and Central Africa 422,564 210,616 70,843 2.6 2.4 22 18 13 47 45 39 42 48 53 5.3 43 3.9 3.5<br />
Middle East and<br />
North Africa 415,633 157,845 48,169 2.1 1.5 16 8 5 44 34 24 52 63 71 2.8 60 2.7 1.9<br />
South Asia 1,653,679 614,255 176,150 1.8 1.1 17 11 8 40 33 23 49 59 66 2.7 31 2.8 2.4<br />
East Asia and Pacific 2,032,532 533,810 141,248 1.0 0.4 10 7 7 36 23 14 61 68 73 1.8 50 3.4 1.8<br />
Latin America<br />
and Caribbean 591,212 195,081 52,898 1.4 0.9 10 7 6 36 27 18 60 68 74 2.2 79 2.0 1.1<br />
CEE/CIS 405,743 95,460 28,590 0.2 0.1 10 11 11 20 18 14 66 68 70 1.8 65 0.3 0.6<br />
Least developed countries 851,103 395,405 124,162 2.4 2.1 22 15 10 47 43 33 43 51 59 4.2 29 3.9 3.6<br />
World 6,934,761 2,207,145 638,681 1.3 0.9 12 9 8 33 26 19 59 65 69 2.4 52 2.2 1.7<br />
s Due to <strong>the</strong> cession in July 2011 <strong>of</strong> <strong>the</strong> Republic <strong>of</strong> South Sudan by <strong>the</strong> Republic <strong>of</strong> <strong>the</strong> Sudan, and its subsequent admission to <strong>the</strong> United Nations on 14 July 2011, disaggregated data for <strong>the</strong> Sudan<br />
and South Sudan as separate <strong>State</strong>s are not yet available for all indicators. Aggregated data presented are for <strong>the</strong> Sudan pre-cession (see Memorandum item).<br />
# For a complete list <strong>of</strong> countries and areas in <strong>the</strong> regions, subregions and country categories, see page 98.<br />
DEFINITIONS OF THE INDICATORS<br />
Crude death rate – Annual number <strong>of</strong> deaths per 1,000 population.<br />
Crude birth rate – Annual number <strong>of</strong> births per 1,000 population.<br />
Life expectancy – Number <strong>of</strong> years newborn children would live if subject to <strong>the</strong><br />
mortality risks prevailing for <strong>the</strong> cross section <strong>of</strong> population at <strong>the</strong> time <strong>of</strong> <strong>the</strong>ir birth.<br />
Total fertility rate – Number <strong>of</strong> children who would be born per woman if she lived<br />
to <strong>the</strong> end <strong>of</strong> her childbearing years and bore children at each age in accordance<br />
with prevailing age-specific fertility rates.<br />
Urbanized population – Percentage <strong>of</strong> population living in urban areas as defined<br />
according to <strong>the</strong> national definition used in <strong>the</strong> most recent population census.<br />
MAIN DATA SOURCES<br />
Population – United Nations Population Division. Growth rates calculated by UNICEF based on<br />
data from United Nations Population Division.<br />
Crude death and birth rates – United Nations Population Division.<br />
Life expectancy – United Nations Population Division.<br />
Total fertility rate – United Nations Population Division.<br />
NOTES<br />
− Data not available.<br />
a<br />
Based on medium-fertility variant projections.<br />
STATISTICAL TABLES 123
TABLE 7: ECONOmIC INdICATORS<br />
Countries<br />
GNI per capita<br />
2011<br />
GDP per capita<br />
average annual<br />
growth rate (%)<br />
Average<br />
annual rate<br />
<strong>of</strong> inflation<br />
(%)<br />
Population<br />
below<br />
international<br />
poverty line<br />
<strong>of</strong> US$1.25<br />
per day (%)<br />
Public spending as a % <strong>of</strong> GDP<br />
(2007–2010*)<br />
allocated to:<br />
ODA<br />
inflow in<br />
millions<br />
US$<br />
ODA inflow<br />
as a % <strong>of</strong><br />
recipient<br />
GNI<br />
Debt service<br />
as a % <strong>of</strong><br />
exports <strong>of</strong><br />
goods and<br />
services<br />
Share <strong>of</strong> household<br />
income<br />
(%, 2005–2011*)<br />
and areas<br />
US$ PPP US$ 1970–1990 1990–2011 1990–2011 2006–2011* health education military 2010 2010 2010 poorest 40% richest 20%<br />
Afghanistan 410 x 910 x, e – – – – 2 – 2 6,374 – – 23 37<br />
Albania 3,980 8,900 -0.7 x 5.3 13 1 3 – 2 338 3 9 20 43<br />
Algeria 4,470 8,370 e 1.6 1.5 12 – 5 4 3 199 0 1 – –<br />
Andorra 41,750 x – -1.4 2.5 x 3 x – 5 4 – – – – – –<br />
Angola 4,060 5,290 – 4.1 205 54 x – 3 5 239 0 4 8 x 62 x<br />
Antigua and Barbuda 12,060 15,670 e 7.8 x 0.6 4 – 4 2 – 19 2 – – –<br />
Argentina 9,740 17,250 -0.8 2.3 8 1 6 6 1 155 0 16 14 49<br />
Armenia 3,360 6,140 – 6.1 47 1 2 4 4 340 4 31 22 40<br />
Australia 46,200 x 36,910 x 1.6 2.2 3 – 6 5 2 – – – – –<br />
Austria 48,300 41,970 2.5 1.8 1 – 8 5 1 – – – 22 x 38 x<br />
Azerbaijan 5,290 9,020 – 5.9 50 0 1 3 3 156 0 1 20 42<br />
Bahamas 21,970 x 29,850 x, e 1.9 0.7 4 – 3 – – – – – – –<br />
Bahrain 15,920 x 21,240 x -1.0 x 1.3 x 3 x – 3 3 3 – – – – –<br />
Bangladesh 770 1,940 0.6 3.6 4 43 1 2 1 1,417 1 3 21 41<br />
Barbados 12,660 x 18,850 x, e 1.7 1.1 x 3 x – 4 7 – 16 – – – –<br />
Belarus 5,830 14,560 – 4.7 113 0 4 5 1 137 0 4 23 36<br />
Belgium 46,160 39,300 2.2 1.6 2 – 7 6 1 – – – 21 x 41 x<br />
Belize 3,690 6,070 e 2.9 1.8 1 – 4 6 1 25 2 11 – –<br />
Benin 780 1,630 0.5 1.3 5 47 x 2 5 1 691 10 – 18 x 46 x<br />
Bhutan 2,070 5,480 – 5.3 7 10 5 5 – 131 9 – 17 45<br />
Bolivia (Plurinational<br />
<strong>State</strong> <strong>of</strong>) 2,040 4,920 -1.1 1.6 7 16 3 – 2 676 4 8 9 59<br />
Bosnia and Herzegovina 4,780 9,200 – 8.3 x 5 x 0 7 – 1 492 3 16 18 43<br />
Botswana 7,480 14,560 8.1 3.4 9 – 8 8 3 157 1 1 – –<br />
Brazil 10,720 11,500 2.3 1.6 49 6 4 6 2 664 0 19 10 59<br />
Brunei Darussalam 31,800 x 49,790 x -2.2 x -0.4 x 5 x – – 2 3 – – – – –<br />
Bulgaria 6,550 13,980 3.4 x 3.3 37 0 4 4 2 – – 14 22 37<br />
Burkina Faso 570 1,310 1.3 2.8 3 45 4 5 1 1,065 12 – 17 47<br />
Burundi 250 610 1.2 -1.4 14 81 5 7 3 632 40 1 21 43<br />
Cambodia 830 2,260 – 6.5 x 4 x 23 2 2 1 737 7 1 19 46<br />
Cameroon 1,210 2,360 3.4 0.8 4 10 2 4 2 538 2 4 17 46<br />
Canada 45,560 39,830 2.0 1.8 2 – 7 5 1 – – – 20 x 40 x<br />
Cape Verde 3,540 4,000 – 5.0 2 21 x 3 6 1 329 21 4 12 x 56 x<br />
Central African Republic 470 810 -1.3 -0.5 3 63 2 1 2 264 13 – 10 61<br />
Chad 690 1,370 -0.9 3.1 6 62 x 4 3 6 490 7 – 17 x 47 x<br />
Chile 12,280 16,160 1.5 3.4 6 1 4 5 3 198 0 15 12 58<br />
China 4,930 8,430 6.6 9.3 5 13 2 – 2 648 0 2 15 48<br />
Colombia 6,110 9,640 1.9 1.6 13 8 5 5 4 910 0 19 10 60<br />
Comoros 770 1,120 -0.1 x -0.8 4 46 x 2 8 – 68 13 – 8 x 68 x<br />
Congo 2,270 3,280 3.3 0.4 8 54 x – 6 1 1,314 15 – 13 53<br />
Cook Islands – – – – – – – – – 13 – – – –<br />
Costa Rica 7,660 11,950 e 0.7 2.6 12 3 7 6 – 96 0 7 12 56<br />
Côte d’Ivoire 1,100 1,730 -1.7 -0.6 5 24 1 5 2 848 4 – 16 48<br />
Croatia 13,850 19,330 – 2.8 24 0 7 4 2 149 0 – 20 42<br />
Cuba 5,460 x – 3.9 3.0 x 4 x – 11 14 3 129 – – – –<br />
Cyprus 29,450 x 30,910 x 5.9 x 2.0 3 – 2 8 2 – – – – –<br />
Czech Republic 18,520 24,190 – 2.7 5 – 6 5 1 – – – – –<br />
Democratic People’s<br />
Republic <strong>of</strong> Korea a – – – – – – – – 79 – – – –<br />
Democratic Republic<br />
<strong>of</strong> <strong>the</strong> Congo 190 350 -2.2 -2.6 211 88 – 3 1 3,413 28 – 15 51<br />
Denmark 60,390 42,330 2.0 1.4 2 – 9 9 1 – – – – –<br />
Djibouti 1,270 x 2,450 x – -1.4 x 3 x 19 x 5 8 4 133 – 7 17 x 46 x<br />
Dominica 7,090 12,460 e 5.2 x 2.2 3 – 4 4 – 32 9 7 – –<br />
Dominican Republic 5,240 9,490 e 2.1 3.9 11 2 2 2 1 177 0 7 13 53<br />
Ecuador 4,140 8,310 1.3 1.5 5 5 3 – 4 153 0 8 13 54<br />
Egypt 2,600 6,160 4.3 2.8 7 2 2 4 2 594 0 5 22 40<br />
El Salvador 3,480 6,690 e -1.9 2.4 4 9 4 4 1 284 1 12 13 53<br />
Equatorial Guinea 14,540 24,110 – 18.2 11 – 3 – – 85 1 – – –<br />
Eritrea 430 580 e – -0.8 x 13 x – 1 – – 161 8 – – –<br />
Estonia 15,200 21,270 – 5.5 x 6 x 1 x 5 6 2 – – – 18 x 43 x<br />
Ethiopia 400 1,110 – 3.3 7 39 x 2 5 1 3,529 12 4 22 39<br />
Fiji 3,680 4,590 0.6 1.3 4 6 3 4 2 76 3 1 16 50<br />
Finland 48,420 37,990 2.9 2.5 2 – 7 7 2 – – – 24 x 37 x<br />
124<br />
THE STATE OF THE WORLD’S CHILDREN <strong>2013</strong>: <strong>Children</strong> with Disabilities
TABLE 7<br />
ECONOmIC INdICATORS<br />
Countries<br />
GNI per capita<br />
2011<br />
GDP per capita<br />
average annual<br />
growth rate (%)<br />
Average<br />
annual rate<br />
<strong>of</strong> inflation<br />
(%)<br />
Population<br />
below<br />
international<br />
poverty line<br />
<strong>of</strong> US$1.25<br />
per day (%)<br />
Public spending as a % <strong>of</strong> GDP<br />
(2007–2010*)<br />
allocated to:<br />
ODA<br />
inflow in<br />
millions<br />
US$<br />
ODA inflow<br />
as a % <strong>of</strong><br />
recipient<br />
GNI<br />
Debt service<br />
as a % <strong>of</strong><br />
exports <strong>of</strong><br />
goods and<br />
services<br />
Share <strong>of</strong> household<br />
income<br />
(%, 2005–2011*)<br />
and areas<br />
US$ PPP US$ 1970–1990 1990–2011 1990–2011 2006–2011* health education military 2010 2010 2010 poorest 40% richest 20%<br />
France 42,420 35,860 2.1 1.2 2 – 9 6 3 – – – – –<br />
Gabon 7,980 13,650 0.2 -0.7 6 5 x 1 – 1 104 1 – 16 48<br />
Gambia 610 2,060 0.6 0.9 6 34 x 3 4 – 121 16 5 13 x 53 x<br />
Georgia 2,860 5,390 3.1 2.7 67 15 3 3 6 626 5 15 16 47<br />
Germany 43,980 40,170 2.3 1.3 1 – 8 5 1 – – – 22 x 37 x<br />
Ghana 1,410 1,820 -2.0 2.5 26 29 3 5 0 1,694 6 3 15 49<br />
Greece 25,030 26,040 1.3 2.2 5 – 7 – 3 – – – 19 x 41 x<br />
Grenada 7,220 10,530 e 4.2 x 2.9 4 – 4 – – 34 6 12 – –<br />
Guatemala 2,870 4,800 e 0.2 1.3 7 14 2 3 0 398 1 10 10 60<br />
Guinea 440 1,050 – 2.9 8 43 1 2 – 214 5 5 17 46<br />
Guinea-Bissau 600 1,250 0.0 -1.2 17 49 x 2 – – 141 16 – 19 x 43 x<br />
Guyana 2,900 x 3,460 x, e -1.3 2.8 x 11 x – 7 3 – 153 6 2 – –<br />
Haiti 700 1,190 e – -1.0 x 15 x 62 x 1 – – 3,076 46 6 9 x 63 x<br />
Holy See – – – – – – – – – – – – – –<br />
Honduras 1,970 3,840 e 0.8 1.6 13 18 3 – 2 576 4 5 8 60<br />
Hungary 12,730 20,380 3.0 2.5 11 0 5 5 1 – – – 21 40<br />
Iceland 35,020 31,640 3.2 2.1 5 – 7 8 0 – – – – –<br />
India 1,410 3,620 2.0 4.9 6 33 1 – 3 2,807 0 5 21 42<br />
Indonesia 2,940 4,530 4.6 2.7 14 18 1 4 1 1,393 0 16 20 43<br />
Iran (Islamic Republic <strong>of</strong>) 4,520 x 11,400 x -2.3 2.7 x 22 x 2 x 2 5 2 122 – – 17 45<br />
Iraq 2,640 3,770 – -1.9 x 13 x 3 3 – 6 2,192 3 – 21 40<br />
Ireland 38,580 33,310 – 0.6 x 1 x – 7 6 1 – – – 20 x 42 x<br />
Israel 28,930 27,290 1.9 1.8 5 – 4 6 6 – – – 16 x 45 x<br />
Italy 35,330 32,350 2.8 0.8 3 – 7 5 2 – – – 18 x 42 x<br />
Jamaica 4,980 7,770 e -1.3 0.5 15 0 x 3 6 1 141 1 19 14 x 52 x<br />
Japan 45,180 35,510 3.4 0.7 -1 – 7 3 1 – – – – –<br />
Jordan 4,380 5,970 2.5 x 2.6 4 0 6 – 6 955 3 4 19 44<br />
Kazakhstan 8,220 11,310 – 4.1 54 0 3 4 1 222 0 70 22 38<br />
Kenya 820 1,720 1.2 0.4 9 43 x – 7 2 1,631 5 4 14 53<br />
Kiribati 2,110 3,480 e -5.3 1.1 3 – 10 – – 23 11 – – –<br />
Kuwait 48,900 x 53,820 x -6.7 x 1.4 x 6 x – 3 – 4 – – – – –<br />
Kyrgyzstan 920 2,290 – 0.7 35 6 3 6 4 373 8 14 18 43<br />
Lao People’s Democratic<br />
Republic 1,130 2,600 – 4.7 21 34 1 2 0 416 6 13 19 45<br />
Latvia 12,350 17,820 3.4 4.4 17 0 4 6 1 – – 74 18 44<br />
Lebanon 9,110 14,000 – 2.5 7 – 4 2 4 449 1 14 – –<br />
Lesotho 1,220 2,070 2.4 2.3 8 43 x 5 13 2 257 10 2 10 x 56 x<br />
Liberia 240 520 -4.0 5.5 30 84 4 3 0 1,423 177 1 18 45<br />
Libya 12,320 x 16,750 x, e – – – – 2 – 1 9 – – – –<br />
Liechtenstein 137,070 x – 2.2 3.0 x 1 x – – 2 – – – – – –<br />
Lithuania 12,280 19,690 – 3.6 20 0 5 6 2 – – 32 18 44<br />
Luxembourg 78,130 63,540 2.6 2.7 3 – 5 – 1 – – – 21 x 39 x<br />
Madagascar 430 950 -2.3 -0.3 13 81 3 3 1 473 5 – 15 50<br />
Malawi 340 870 0.0 1.3 25 74 x 4 – 1 1,027 21 – 18 x 47 x<br />
Malaysia 8,420 15,190 4.0 3.1 4 0 2 6 2 2 0 5 13 51<br />
Maldives 6,530 8,540 – 5.8 x 5 x – 5 9 – 111 8 20 17 x 44 x<br />
Mali 610 1,050 0.1 2.1 5 50 3 4 2 1,093 12 – 20 41<br />
Malta 18,620 x 24,170 x 6.0 2.4 3 – 6 6 1 – – – – –<br />
Marshall Islands 3,910 – – 0.5 2 – 16 – – 91 49 – – –<br />
Mauritania 1,000 2,410 -1.1 1.3 8 23 2 4 3 373 10 – 16 47<br />
Mauritius 8,240 14,760 3.2 x 3.5 6 – 2 3 0 125 1 2 – –<br />
Mexico 9,240 15,120 1.7 1.3 12 1 3 5 1 473 0 8 13 54<br />
Micronesia<br />
(Federated <strong>State</strong>s <strong>of</strong>) 2,900 3,610 e – 0.4 2 31 x 13 – – 125 41 – 7 x 64 x<br />
Monaco 183,150 x – 1.4 2.1 x 1 x – 3 1 – – – – – –<br />
Mongolia 2,320 4,360 – 3.3 24 – 4 5 1 304 5 4 18 44<br />
Montenegro 7,060 13,720 – 3.4 x 7 x 0 7 – 1 77 2 – 22 39<br />
Morocco 2,970 4,910 1.9 2.5 3 3 2 5 3 994 1 9 17 48<br />
Mozambique 470 980 -1.0 x 4.3 17 60 4 – 1 1,959 21 3 15 51<br />
Myanmar a – 1.6 7.4 x 24 x – 0 – – 358 – 8 – –<br />
Namibia 4,700 6,600 -2.1 x 1.9 9 32 x 4 6 3 259 2 – 8 x 69 x<br />
Nauru – – – – – – – – – 28 – – – –<br />
Nepal 540 1,260 1.1 1.9 7 25 2 5 2 821 5 4 20 41<br />
Ne<strong>the</strong>rlands 49,730 43,770 1.6 1.9 2 – 8 6 2 – – – – –<br />
STATISTICAL TABLES 125
TABLE 7<br />
ECONOmIC INdICATORS<br />
Countries<br />
GNI per capita<br />
2011<br />
GDP per capita<br />
average annual<br />
growth rate (%)<br />
Average<br />
annual rate<br />
<strong>of</strong> inflation<br />
(%)<br />
Population<br />
below<br />
international<br />
poverty line<br />
<strong>of</strong> US$1.25<br />
per day (%)<br />
Public spending as a % <strong>of</strong> GDP<br />
(2007–2010*)<br />
allocated to:<br />
ODA<br />
inflow in<br />
millions<br />
US$<br />
ODA inflow<br />
as a % <strong>of</strong><br />
recipient<br />
GNI<br />
Debt service<br />
as a % <strong>of</strong><br />
exports <strong>of</strong><br />
goods and<br />
services<br />
Share <strong>of</strong> household<br />
income<br />
(%, 2005–2011*)<br />
and areas<br />
US$ PPP US$ 1970–1990 1990–2011 1990–2011 2006–2011* health education military 2010 2010 2010 poorest 40% richest 20%<br />
New Zealand 29,350 x 29,140 x 1.1 x 1.8 x 2 x – 8 6 1 – – – – –<br />
Nicaragua 1,170 2,840 e -3.7 1.9 17 12 x 5 – 1 628 10 11 16 47<br />
Niger 360 720 -2.0 -0.2 4 44 3 4 1 749 14 – 20 43<br />
Nigeria 1,200 2,300 -1.3 2.1 20 68 2 – 1 2,069 1 0 13 54<br />
Niue – – – – – – – – – 15 – – – –<br />
Norway 88,890 58,090 3.2 2.0 4 – 8 7 2 – – – 24 x 37 x<br />
Oman 19,260 x 25,770 x 3.1 2.7 5 – 2 4 10 -40 – – – –<br />
Pakistan 1,120 2,880 2.6 1.9 10 21 1 3 3 3,021 2 10 23 40<br />
Palau 7,250 12,330 e – -0.1 x 3 x – 9 – – 26 20 – – –<br />
Panama 7,910 14,740 e 0.3 3.4 2 7 5 4 – 129 1 5 11 56<br />
Papua New Guinea 1,480 2,590 e -1.0 0.1 8 – 2 – 0 513 6 13 – –<br />
Paraguay 2,970 5,310 3.1 0.3 10 7 3 4 1 105 1 4 11 56<br />
Peru 5,500 10,160 -0.6 3.2 10 5 3 3 1 -254 0 15 12 53<br />
Philippines 2,210 4,160 0.5 1.9 7 18 1 3 1 535 0 15 15 50<br />
Poland 12,480 20,450 – 4.4 10 0 5 6 2 – – – 20 42<br />
Portugal 21,250 24,530 2.5 1.5 4 – 8 6 2 – – – – –<br />
Qatar 80,440 87,030 – 0.8 x 11 x – 2 2 2 – – – – –<br />
Republic <strong>of</strong> Korea 20,870 30,290 6.2 4.1 4 – 4 5 3 – – – – –<br />
Republic <strong>of</strong> Moldova 1,980 3,670 1.8 x -0.1 38 0 6 10 0 468 7 9 20 41<br />
Romania 7,910 15,140 0.9 x 2.8 44 0 4 4 2 – – 29 21 38<br />
Russian Federation 10,400 20,050 – 2.3 52 0 3 4 4 – – 13 17 47<br />
Rwanda 570 1,240 1.2 2.3 9 63 5 4 1 1,034 19 2 13 57<br />
Saint Kitts and Nevis 12,480 14,490 e 6.3 x 1.6 5 – 4 4 – 11 2 17 – –<br />
Saint Lucia 6,680 9,080 e 5.3 x 0.7 3 – 5 4 – 41 5 6 – –<br />
Saint Vincent<br />
and <strong>the</strong> Grenadines 6,100 10,560 e 3.3 3.2 4 – 3 5 – 17 3 14 – –<br />
Samoa 3,190 4,430 e – 2.8 6 – 5 5 – 147 27 3 – –<br />
San Marino 50,400 x – 1.7 3.2 x 3 x – 6 – – – – – – –<br />
Sao Tome and Principe 1,360 2,080 – – – 28 x 3 – – – – 5 14 x 56 x<br />
Saudi Arabia 17,820 24,870 -1.4 0.2 5 – 2 6 8 – – – – –<br />
Senegal 1,070 1,960 -0.5 1.1 4 34 x 3 6 2 931 7 – 17 46<br />
Serbia 5,680 11,640 – 1.4 23 x 0 6 5 2 651 2 24 23 37<br />
Seychelles 11,130 25,320 e 2.9 2.0 6 0 3 – 1 56 7 4 9 70<br />
Sierra Leone 340 850 -0.5 1.1 16 53 x 1 4 2 475 25 2 16 x 49 x<br />
Singapore 42,930 59,790 5.9 3.5 1 – 2 4 5 – – – – –<br />
Slovakia 16,070 22,610 – 3.7 6 0 6 5 1 – – – 24 36<br />
Slovenia 23,610 27,110 – 3.2 12 0 x 6 6 2 – – – 21 x 39 x<br />
Solomon Islands 1,110 2,360 e – -0.9 7 – 5 7 – 340 61 6 – –<br />
Somalia a – -0.8 – – – – – – 499 – – – –<br />
South Africa 6,960 10,790 0.1 1.3 8 14 3 5 1 1,032 0 5 7 68<br />
South Sudan s b – – – – – – – – – – – – –<br />
Spain 30,990 31,930 1.9 1.9 4 – 7 5 1 – – – 19 x 42 x<br />
Sri Lanka 2,580 5,560 3.0 4.1 10 7 2 3 4 581 1 9 17 48<br />
<strong>State</strong> <strong>of</strong> Palestine b – – -2.4 x 4 x 0 – – – 2,519 – – 19 43<br />
Sudan s – – – – – – – – – – – – – –<br />
Suriname 7,640 x 7,710 x, e -2.2 x 1.7 x 46 x – 4 – – 104 – – – –<br />
Swaziland 3,300 5,970 3.1 1.8 9 41 4 8 3 92 3 2 11 57<br />
Sweden 53,230 42,350 1.8 2.2 2 – 8 7 1 – – – 23 x 37 x<br />
Switzerland 76,380 50,900 1.7 x 0.9 1 – 6 5 1 – – – 20 x 41 x<br />
Syrian Arab Republic 2,750 x 5,090 x 2.2 1.8 x 7 x 2 x 1 5 4 137 0 3 19 x 44 x<br />
Tajikistan 870 2,310 – 0.2 73 7 2 5 – 430 8 18 21 39<br />
Thailand 4,420 8,390 4.7 2.8 3 0 3 4 2 -11 0 5 17 47<br />
The former Yugoslav<br />
Republic <strong>of</strong> Macedonia 4,730 11,490 – 1.2 22 0 5 – 2 178 2 12 15 49<br />
Timor-Leste 2,730 x 5,210 x, e – 1.9 x 7 x 37 9 16 5 292 11 – 21 41<br />
Togo 560 1,030 -0.3 -0.1 4 39 1 3 2 421 15 – 19 42<br />
Tonga 3,580 4,690 e – 1.5 6 – 5 – – 70 19 – – –<br />
Trinidad and Tobago 15,040 24,940 e 0.5 4.8 5 – 3 – – 4 0 – – –<br />
Tunisia 4,070 9,090 2.5 3.3 4 1 x 3 6 1 551 1 9 16 48<br />
Turkey 10,410 16,730 2.0 2.4 44 0 5 – 3 1,049 0 33 17 45<br />
Turkmenistan 4,110 8,350 e – 5.8 86 – 1 – – 43 0 – – –<br />
Tuvalu 5,010 – – 2.1 3 – 10 – – 13 35 – – –<br />
Uganda 510 1,320 – 3.7 7 38 2 3 2 1,730 10 1 15 51<br />
126<br />
THE STATE OF THE WORLD’S CHILDREN <strong>2013</strong>: <strong>Children</strong> with Disabilities
TABLE 7<br />
ECONOmIC INdICATORS<br />
Countries<br />
GNI per capita<br />
2011<br />
GDP per capita<br />
average annual<br />
growth rate (%)<br />
Average<br />
annual rate<br />
<strong>of</strong> inflation<br />
(%)<br />
Population<br />
below<br />
international<br />
poverty line<br />
<strong>of</strong> US$1.25<br />
per day (%)<br />
Public spending as a % <strong>of</strong> GDP<br />
(2007–2010*)<br />
allocated to:<br />
ODA<br />
inflow in<br />
millions<br />
US$<br />
ODA inflow<br />
as a % <strong>of</strong><br />
recipient<br />
GNI<br />
Debt service<br />
as a % <strong>of</strong><br />
exports <strong>of</strong><br />
goods and<br />
services<br />
Share <strong>of</strong> household<br />
income<br />
(%, 2005–2011*)<br />
and areas<br />
US$ PPP US$ 1970–1990 1990–2011 1990–2011 2006–2011* health education military 2010 2010 2010 poorest 40% richest 20%<br />
Ukraine 3,120 7,080 – 0.6 67 0 4 5 3 624 0 39 24 36<br />
United Arab Emirates 40,760 48,220 e -4.3 x -1.9 5 – 2 1 6 – – – – –<br />
United Kingdom 37,780 36,970 2.1 2.4 2 – 8 6 3 – – – – –<br />
United Republic<br />
<strong>of</strong> Tanzania 540 1,510 – 2.5 13 68 3 7 1 2,961 13 3 18 45<br />
United <strong>State</strong>s 48,450 48,890 2.1 1.7 2 – 8 5 5 – – – 16 x 46 x<br />
Uruguay 11,860 14,740 0.9 2.1 15 0 5 – 2 49 0 12 14 51<br />
Uzbekistan 1,510 3,440 e – 2.5 78 – 2 – – 229 1 – 19 x 44 x<br />
Vanuatu 2,870 4,500 e 1.2 x 0.6 3 – 3 5 – 108 15 – – –<br />
Venezuela (Bolivarian<br />
Republic <strong>of</strong>) 11,920 12,620 -1.7 0.4 32 7 3 4 1 53 0 8 14 49<br />
Viet Nam 1,260 3,260 – 6.0 10 17 3 5 2 2,945 3 2 19 43<br />
Yemen 1,070 2,180 – 1.1 15 18 x 2 5 4 666 – 2 18 45<br />
Zambia 1,160 1,490 -2.3 0.8 28 69 4 1 2 913 6 1 10 59<br />
Zimbabwe 640 – -0.4 -3.0 1 – – 2 1 738 11 – – –<br />
MEMORANDUM<br />
Sudan and South Sudan s 1,300 x 2,020 x 0.1 3.4 26 20 2 – – 2,055 4 4 18 42<br />
SUMMARY INDICATORS #<br />
Sub-Saharan Africa 1,269 2,269 0.0 2.0 29 53 3 5 1 40,604 4 3 15 50<br />
Eastern and<br />
Sou<strong>the</strong>rn Africa 1,621 2,868 0.3 1.9 34 51 3 5 1 19,572 3 4 16 50<br />
West and Central Africa 937 1,721 -0.5 2.0 21 59 – – – 18,844 5 1 15 50<br />
Middle East and<br />
North Africa 6,234 9,655 -0.1 0.8 7 – 2 4 5 11,535 1 5 19 43<br />
South Asia 1,319 3,366 2.0 4.5 6 32 – – – 15,263 1 5 21 42<br />
East Asia and Pacific 4,853 8,185 5.6 7.5 5 14 2 ** 4 ** 2 ** 9,289 0 4 16 47<br />
Latin America<br />
and Caribbean 8,595 11,759 1.4 1.7 28 5 4 5 1 9,272 0 13 12 56<br />
CEE/CIS 7,678 14,216 – 2.5 51 0 3 4 3 6,582 0 23 19 43<br />
Least developed countries 695 1,484 -0.1 3.1 45 51 2 4 2 44,538 8 4 19 45<br />
World 9,513 11,580 2.4 2.6 8 22 6 ** 5 ** 3 ** 90,358 0 9 17 46<br />
s Due to <strong>the</strong> cession in July 2011 <strong>of</strong> <strong>the</strong> Republic <strong>of</strong> South Sudan by <strong>the</strong> Republic <strong>of</strong> <strong>the</strong> Sudan, and its subsequent admission to <strong>the</strong> United Nations on 14 July 2011, disaggregated data for <strong>the</strong> Sudan<br />
and South Sudan as separate <strong>State</strong>s are not yet available for all indicators. Aggregated data presented are for <strong>the</strong> Sudan pre-cession (see Memorandum item).<br />
# For a complete list <strong>of</strong> countries and areas in <strong>the</strong> regions, subregions and country categories, see page 98.<br />
DEFINITIONS OF THE INDICATORS<br />
GNI per capita – Gross national income (GNI) is <strong>the</strong> sum <strong>of</strong> value added by all resident producers,<br />
plus any product taxes (less subsidies) not included in <strong>the</strong> valuation <strong>of</strong> output, plus net receipts <strong>of</strong><br />
primary income (compensation <strong>of</strong> employees and property income) from abroad. GNI per capita is<br />
GNI divided by midyear population. GNI per capita in US dollars is converted using <strong>the</strong> World Bank<br />
Atlas method.<br />
GNI per capita (PPP US$) – GNI per capita converted to international dollars, taking into<br />
account differences in price levels (purchasing power) between countries. Based on data from <strong>the</strong><br />
International Comparison Programme (ICP).<br />
GDP per capita – Gross domestic product (GDP) is <strong>the</strong> sum <strong>of</strong> value added by all resident<br />
producers; plus any product taxes (less subsidies) not included in <strong>the</strong> valuation <strong>of</strong> output. GDP per<br />
capita is GDP divided by midyear population. Growth is calculated from constant price GDP data in<br />
local currency.<br />
Population below international poverty line <strong>of</strong> US$1.25 per day – Percentage <strong>of</strong> <strong>the</strong><br />
population living on less than US$1.25 per day at 2005 prices, adjusted for purchasing power parity<br />
(PPP). The new poverty threshold reflects revisions to PPP exchange rates based on <strong>the</strong> results <strong>of</strong><br />
<strong>the</strong> 2005 ICP. The revisions reveal that <strong>the</strong> cost <strong>of</strong> living is higher across <strong>the</strong> developing world than<br />
previously estimated. As a result <strong>of</strong> <strong>the</strong>se revisions, poverty rates for individual countries cannot<br />
be compared with poverty rates reported in previous editions. More detailed information on <strong>the</strong><br />
definition, methodology and sources <strong>of</strong> <strong>the</strong> data presented is available at .<br />
ODA – Net <strong>of</strong>ficial development assistance.<br />
Debt service – Sum <strong>of</strong> interest payments and repayments <strong>of</strong> principal on external public and<br />
publicly guaranteed long-term debts.<br />
Share <strong>of</strong> household income – Percentage <strong>of</strong> income received by <strong>the</strong> 20 per cent <strong>of</strong> households<br />
with <strong>the</strong> highest income and by <strong>the</strong> 40 per cent <strong>of</strong> households with <strong>the</strong> lowest income.<br />
MAIN DATA SOURCES<br />
GNI per capita – The World Bank.<br />
GDP per capita – The World Bank.<br />
Rate <strong>of</strong> inflation – The World Bank.<br />
Population below international poverty line <strong>of</strong> US$1.25 per day – The World Bank.<br />
Spending on health, education and military – The World Bank.<br />
ODA – Organisation for Economic Co-operation and Development.<br />
Debt service – The World Bank.<br />
Share <strong>of</strong> household income – The World Bank.<br />
NOTES<br />
a low-income country (GNI per capita is $1,025 or less).<br />
b lower-middle-income country (GNI per capita is $1,026 to $4,035).<br />
c upper-middle-income country (GNI per capita is $4,036 to $12,475).<br />
d high-income country (GNI per capita is $12,476 or more).<br />
– Data not available.<br />
x Data refer to years or periods o<strong>the</strong>r than those specified in <strong>the</strong> column heading. Such data<br />
are not included in <strong>the</strong> calculation <strong>of</strong> regional and global averages.<br />
e Estimate is based on regression; o<strong>the</strong>r PPP figures are extrapolated from <strong>the</strong> 2005 ICP<br />
benchmark estimates.<br />
* Data refer to <strong>the</strong> most recent year available during <strong>the</strong> period specified in <strong>the</strong> column<br />
heading.<br />
** Excludes China.<br />
STATISTICAL TABLES 127
TABLE 8: WOmEN<br />
Countries<br />
and areas<br />
Life Adult literacy<br />
expectancy: rate: females<br />
females as a as a % <strong>of</strong><br />
% <strong>of</strong> males males<br />
2011 2007–2011*<br />
Enrolment ratios: females Survival rate<br />
as a % <strong>of</strong> males 2008–2011* to last grade<br />
<strong>of</strong> primary:<br />
Primary<br />
GER<br />
Secondary<br />
GER<br />
females as a<br />
% <strong>of</strong> males<br />
2008–2011*<br />
Contraceptive<br />
prevalence<br />
(%)<br />
2007–2012*<br />
Antenatal care (%)<br />
2007–2012*<br />
Delivery care (%)<br />
2007–2012* Maternal mortality ratio †<br />
2007–2011* 2010<br />
Afghanistan 101 – 69 51 – 21 48 15 39 33 4 330 460 32<br />
Albania 108 97 99 98 100 69 97 67 99 97 19 21 27 2,200<br />
Algeria 104 79 x 94 102 104 61 x 89 x – 95 x 95 x – – 97 430<br />
Andorra – – 101 105 – – – – – – – – – –<br />
Angola 106 70 81 69 73 6 x 80 – 47 46 – – 450 39<br />
Antigua and Barbuda – 101 92 101 – – 100 – 100 – – 0 – –<br />
Argentina 110 100 99 112 101 78 x 99 x 89 x 95 99 – 44 77 560<br />
Armenia 109 100 102 102 – 55 99 93 100 99 13 9 30 1,700<br />
Australia 106 – 99 95 – 71 x 98 92 – 99 31 – 7 8,100<br />
Austria 107 – 99 96 103 – – – – – 24 – 4 18,200<br />
Azerbaijan 109 100 99 98 102 51 x 77 x 45 x 88 x 78 x 5 x 24 43 1,000<br />
Bahamas 109 – 102 105 96 45 x 98 – 99 – – 0 47 1,100<br />
Bahrain 102 97 – – – – 100 – 97 – – – 20 1,800<br />
Bangladesh 102 85 – 113 114 61 55 26 32 29 17 220 240 170<br />
Barbados 109 – 102 109 – – 100 – 100 – – 0 x 51 1,300<br />
Belarus 118 100 100 – – 73 x 99 x – 100 100 x 22 1 4 16,300<br />
Belgium 107 – 100 97 103 75 x – – – – 18 – 8 7,500<br />
Belize 104 – 91 – 103 34 x 94 x – 94 89 – 55 53 610<br />
Benin 107 55 87 – – 13 86 61 x 84 87 4 x 400 x 350 53<br />
Bhutan 106 59 x 102 101 105 66 97 77 65 63 12 260 x 180 210<br />
Bolivia (Plurinational<br />
<strong>State</strong> <strong>of</strong>) 107 91 99 99 – 61 86 72 71 68 19 310 190 140<br />
Bosnia and Herzegovina 107 97 102 103 99 36 x 99 x – 100 x 100 x – 3 8 11,400<br />
Botswana 96 101 96 106 104 53 94 73 95 99 – 160 160 220<br />
Brazil 110 100 – – – 81 x 98 91 97 x 98 50 75 56 910<br />
Brunei Darussalam 106 97 101 103 100 – 99 – 100 100 – – 24 1,900<br />
Bulgaria 110 99 100 95 99 – – – 100 93 31 8 11 5,900<br />
Burkina Faso 104 59 91 76 109 16 94 34 66 66 2 340 300 55<br />
Burundi 106 85 99 72 118 22 99 33 60 60 4 500 800 31<br />
Cambodia 105 80 95 90 – 51 89 59 71 54 3 210 250 150<br />
Cameroon 104 80 86 83 98 23 85 – 64 61 2 x 670 x 690 31<br />
Canada 106 – 100 98 – 74 x 100 99 100 99 26 – 12 5,200<br />
Cape Verde 111 89 92 120 – 61 x 98 x 72 x 78 x 76 11 x 54 79 480<br />
Central African Republic 107 62 71 58 90 15 68 38 54 53 5 540 x 890 26<br />
Chad 106 54 73 42 96 5 53 23 23 16 2 1,100 x 1,100 15<br />
Chile 108 100 95 103 – 58 x – – 100 100 – 20 25 2,200<br />
China 105 94 103 104 – 85 x 94 – 100 98 27 30 37 1,700<br />
Colombia 110 100 98 110 101 79 97 89 99 99 43 63 92 430<br />
Comoros 105 87 92 – – 26 x 75 x – 62 x – – 380 x 280 67<br />
Congo 105 – 95 – – 45 93 – 94 92 3 x 780 x 560 39<br />
Cook Islands – – 102 110 – 29 100 – 100 100 – 0 – –<br />
Costa Rica 106 100 99 106 103 82 90 86 99 99 21 y 23 40 1,300<br />
Côte d’Ivoire 104 72 83 – 96 18 91 – 59 57 6 x 540 x 400 53<br />
Croatia 110 99 100 107 101 – – – 100 – 19 9 17 4,100<br />
Cuba 105 100 98 99 102 74 100 100 100 100 – 41 73 1,000<br />
Cyprus 106 98 99 100 – – 99 – – 100 – – 10 6,300<br />
Czech Republic 108 – 99 101 100 – – – 100 – 20 2 5 12,100<br />
Democratic People’s<br />
Republic <strong>of</strong> Korea 110 100 – – – 69 x 100 94 100 95 13 77 81 670<br />
Democratic Republic<br />
<strong>of</strong> <strong>the</strong> Congo 107 74 87 58 88 17 89 45 80 75 7 550 540 30<br />
Denmark 106 – 100 102 100 – – – – – 21 – 12 4,500<br />
Djibouti 105 – 90 80 101 23 92 x – 93 x 87 x 12 550 x 200 140<br />
Dominica – – 98 109 105 – 100 – 100 – – 0 – –<br />
Dominican Republic 108 100 88 112 – 73 99 95 98 98 42 160 150 240<br />
Ecuador 108 97 101 103 – 73 x 84 x 58 x, y 98 x 85 x 26 x 61 110 350<br />
Egypt 105 79 96 96 – 60 74 66 79 72 28 55 66 490<br />
El Salvador 114 94 95 101 101 73 94 78 y 96 85 25 56 81 490<br />
Equatorial Guinea 105 93 97 – 108 10 x 86 x – 65 x – – – 240 88<br />
Eritrea 108 73 84 76 94 8 x 70 x 41 x 28 x 26 x 3 x – 240 86<br />
Estonia 115 100 99 102 100 – – – 100 x – – 7 x 2 25,100<br />
Ethiopia 106 59 91 82 100 29 43 19 10 10 2 680 350 67<br />
Fiji 108 – 98 109 95 32 100 – 100 – – 23 26 1,400<br />
Finland 108 – 99 105 100 – 100 x – – 100 16 – 5 12,200<br />
At least<br />
one visit<br />
At least<br />
four visits<br />
Skilled<br />
attendant<br />
at birth<br />
Institutional<br />
delivery<br />
C-section<br />
Reported<br />
Adjusted<br />
Lifetime risk <strong>of</strong><br />
maternal death<br />
(1 in:)<br />
128<br />
THE STATE OF THE WORLD’S CHILDREN <strong>2013</strong>: <strong>Children</strong> with Disabilities
TABLE 8<br />
WOmEN<br />
Countries<br />
and areas<br />
Life Adult literacy<br />
expectancy: rate: females<br />
females as a as a % <strong>of</strong><br />
% <strong>of</strong> males males<br />
2011 2007–2011*<br />
Enrolment ratios: females Survival rate<br />
as a % <strong>of</strong> males 2008–2011* to last grade<br />
<strong>of</strong> primary:<br />
Primary<br />
GER<br />
Secondary<br />
GER<br />
females as a<br />
% <strong>of</strong> males<br />
2008–2011*<br />
Contraceptive<br />
prevalence<br />
(%)<br />
2007–2012*<br />
Antenatal care (%)<br />
2007–2012*<br />
Delivery care (%)<br />
2007–2012* Maternal mortality ratio †<br />
2007–2011* 2010<br />
France 108 – 99 101 – 71 x 100 x – – – 21 – 8 6,200<br />
Gabon 103 92 97 – – 33 x 94 x 63 x 86 x 85 x 6 x 520 x 230 130<br />
Gambia 104 67 102 95 94 13 98 72 57 56 3 730 x 360 56<br />
Georgia 110 100 103 – 105 53 98 90 100 98 24 19 67 960<br />
Germany 106 – 100 95 101 – 100 x – – – 29 – 7 10,600<br />
Ghana 103 84 100 91 91 34 96 87 68 67 11 450 350 68<br />
Greece 106 98 – – – 76 x – – – – – – 3 25,500<br />
Grenada 104 – 100 103 – 54 x 100 – 99 – – 0 24 1,700<br />
Guatemala 111 87 96 93 – 54 93 – 52 51 16 140 120 190<br />
Guinea 106 58 84 59 76 9 x 88 50 46 39 2 980 x 610 30<br />
Guinea-Bissau 107 60 94 – – 14 93 70 44 42 – 410 x 790 25<br />
Guyana 109 – 104 111 96 43 92 79 92 89 13 86 280 150<br />
Haiti 104 84 x – – – 32 x 85 x 54 x 26 x 25 x 3 x 630 x 350 83<br />
Holy See – – – – – – – – – – – – – –<br />
Honduras 107 100 100 123 – 65 x 92 x 81 x 67 x 67 x 13 x – 100 270<br />
Hungary 111 100 99 99 100 – – – 100 – 31 19 21 3,300<br />
Iceland 104 – 100 103 – – – – – – 17 – 5 8,900<br />
India 105 68 x 100 92 – 55 74 x 37 x 52 47 9 x 210 200 170<br />
Indonesia 105 94 102 100 – 61 93 82 79 55 15 230 220 210<br />
Iran (Islamic Republic <strong>of</strong>) 105 90 101 86 100 79 x 98 x 94 x 97 x 96 x 40 x 25 x 21 2,400<br />
Iraq 110 82 – – – 50 x 84 x – 80 65 21 x 84 x 63 310<br />
Ireland 106 – 100 105 – 65 x 100 x – 100 x 100 25 – 6 8,100<br />
Israel 106 – 101 102 98 – – – – – – – 7 5,100<br />
Italy 107 99 99 99 100 – 99 x 68 x – 99 x 40 – 4 20,300<br />
Jamaica 107 112 95 103 102 72 99 87 98 97 15 95 x 110 370<br />
Japan 109 – 100 100 100 54 x – – – 100 x – – 5 13,100<br />
Jordan 104 93 100 106 – 59 99 94 99 99 19 19 63 470<br />
Kazakhstan 118 100 100 97 100 51 x 100 x – 100 100 x – 17 51 770<br />
Kenya 104 93 98 90 – 46 92 47 44 43 6 490 360 55<br />
Kiribati – – 104 111 – 22 88 71 80 66 10 0 – –<br />
Kuwait 102 97 103 107 100 – 100 – 100 – – – 14 2,900<br />
Kyrgyzstan 113 99 99 99 99 48 x 97 x – 99 97 x – 64 71 480<br />
Lao People’s<br />
Democratic Republic 104 77 x 93 83 – 38 x 35 x – 20 x 17 x 2 410 x 470 74<br />
Latvia 115 100 99 98 100 – 92 x – 100 x – – 32 34 2,000<br />
Lebanon 106 92 97 112 103 54 96 x – 98 x – – – 25 2,100<br />
Lesotho 97 115 98 138 124 47 92 70 62 59 7 1,200 620 53<br />
Liberia 104 88 91 – – 11 79 66 46 37 4 990 770 24<br />
Libya 107 86 – – – – 93 – 100 – – – 58 620<br />
Liechtenstein – – 94 103 96 – – – – – – – – –<br />
Lithuania 117 100 99 98 100 – 100 x – 100 x – – 9 8 9,400<br />
Luxembourg 107 – 101 102 – – – – 100 x 100 x 29 – 20 3,200<br />
Madagascar 105 91 98 94 105 40 86 49 44 35 2 500 240 81<br />
Malawi 100 84 104 91 103 46 95 46 71 73 5 680 460 36<br />
Malaysia 106 95 – 107 100 – 91 – 99 99 – 30 29 1,300<br />
Maldives 103 100 x 96 – – 35 99 85 95 95 32 140 x 60 870<br />
Mali 104 47 87 70 95 8 x 70 x 35 x 49 x 45 x 2 x 460 x 540 28<br />
Malta 106 103 x 101 89 91 – 100 x – – 100 – – 8 8,900<br />
Marshall Islands – – 99 103 91 45 81 77 99 85 9 140 – –<br />
Mauritania 106 79 105 85 99 9 75 16 x 61 48 3 x 690 510 44<br />
Mauritius 109 95 101 100 99 76 x – – 98 x 98 x – 22 x 60 1,000<br />
Mexico 106 97 99 107 102 73 96 86 95 80 43 52 50 790<br />
Micronesia<br />
(Federated <strong>State</strong>s <strong>of</strong>) 103 – – – – 55 80 – 100 – – 0 100 290<br />
Monaco – – – – – – – – – – – – – –<br />
Mongolia 112 101 98 107 102 55 99 – 99 99 21 47 63 600<br />
Montenegro 107 98 98 101 – 39 x 97 x – 100 100 – 13 8 7,400<br />
Morocco 107 64 94 – 100 67 77 – 74 73 16 130 100 400<br />
Mozambique 104 61 90 82 94 12 92 – 55 58 2 x 500 490 43<br />
Myanmar 105 95 100 106 107 46 83 – 71 36 – 320 x 200 250<br />
Namibia 102 99 99 – 107 55 95 70 81 81 13 450 200 160<br />
Nauru – – 106 120 – 36 95 40 97 99 8 300 x – –<br />
Nepal 103 66 – – – 50 58 50 36 35 5 280 x 170 190<br />
Ne<strong>the</strong>rlands 105 – 99 99 – 69 – – – 100 14 – 6 10,500<br />
At least<br />
one visit<br />
At least<br />
four visits<br />
Skilled<br />
attendant<br />
at birth<br />
Institutional<br />
delivery<br />
C-section<br />
Reported<br />
Adjusted<br />
Lifetime risk <strong>of</strong><br />
maternal death<br />
(1 in:)<br />
STATISTICAL TABLES 129
TABLE 8<br />
WOmEN<br />
Countries<br />
and areas<br />
Life Adult literacy<br />
expectancy: rate: females<br />
females as a as a % <strong>of</strong><br />
% <strong>of</strong> males males<br />
2011 2007–2011*<br />
Enrolment ratios: females Survival rate<br />
as a % <strong>of</strong> males 2008–2011* to last grade<br />
<strong>of</strong> primary:<br />
Primary<br />
GER<br />
Secondary<br />
GER<br />
females as a<br />
% <strong>of</strong> males<br />
2008–2011*<br />
Contraceptive<br />
prevalence<br />
(%)<br />
2007–2012*<br />
Antenatal care (%)<br />
2007–2012*<br />
Delivery care (%)<br />
2007–2012* Maternal mortality ratio †<br />
2007–2011* 2010<br />
New Zealand 105 – 100 105 – – – – – – 23 – 15 3,300<br />
Nicaragua 109 100 x 98 110 – 72 90 78 74 74 20 63 95 350<br />
Niger 102 35 x 82 66 94 18 46 x 15 x 18 x 17 x 1 x 650 x 590 23<br />
Nigeria 103 70 91 88 107 15 58 45 39 35 2 550 630 29<br />
Niue – – – – – 23 x 100 – 100 – – 0 x – –<br />
Norway 106 – 100 98 100 88 x – – – – 16 – 7 7,900<br />
Oman 107 90 97 99 – 24 99 96 99 99 14 26 32 1,200<br />
Pakistan 103 59 82 76 92 27 61 28 43 41 7 280 260 110<br />
Palau – – – – – 22 90 81 100 100 – 0 – –<br />
Panama 107 99 97 107 100 52 96 – 89 88 – 60 92 410<br />
Papua New Guinea 107 90 89 – – 32 x 79 x 55 x 53 x 52 x – 730 x 230 110<br />
Paraguay 106 98 97 105 106 79 96 91 82 – 33 100 99 310<br />
Peru 107 89 100 98 101 75 95 94 85 85 23 93 67 570<br />
Philippines 110 101 98 108 111 51 91 78 62 44 10 160 x 99 300<br />
Poland 112 100 99 99 100 – – – 100 x – 21 2 5 14,400<br />
Portugal 108 97 97 104 – 67 x 100 x – 100 x – 31 – 8 9,200<br />
Qatar 99 99 100 121 – – 100 – 100 – – – 7 5,400<br />
Republic <strong>of</strong> Korea 109 – 99 99 100 80 – – – – 32 – 16 4,800<br />
Republic <strong>of</strong> Moldova 111 99 100 102 104 68 x 98 x 89 x 100 99 9 x 15 41 1,500<br />
Romania 110 99 99 99 100 70 x 94 x 76 x 99 98 x 19 x 21 27 2,600<br />
Russian Federation 119 100 100 98 – 80 – – 100 – – 17 34 2,000<br />
Rwanda 105 90 102 102 – 52 98 35 69 69 7 480 340 54<br />
Saint Kitts and Nevis – – 100 99 90 54 100 – 100 – – 0 – –<br />
Saint Lucia 108 – 96 99 97 – 99 – 100 – – 0 x 35 1,400<br />
Saint Vincent<br />
and <strong>the</strong> Grenadines 106 – 93 102 – 48 x 100 – 99 – – 0 x 48 940<br />
Samoa 109 100 102 114 – 29 93 58 81 81 13 29 x 100 260<br />
San Marino – – 113 102 – – – – – – – – – –<br />
Sao Tome and Principe 105 90 100 103 121 38 98 72 82 79 5 160 70 330<br />
Saudi Arabia 103 90 99 95 – 24 97 – 97 – – – 24 1,400<br />
Senegal 104 63 106 88 105 13 93 50 65 73 6 390 370 54<br />
Serbia 106 97 99 102 100 61 99 94 100 100 25 9 12 4,900<br />
Seychelles – 101 100 109 – – – – – – – 57 x – –<br />
Sierra Leone 103 59 93 – – 11 93 75 63 50 5 860 890 23<br />
Singapore 106 96 – – 100 – – – – 100 x – – 3 25,300<br />
Slovakia 111 – 99 101 100 – 97 x – 100 – 24 10 6 12,200<br />
Slovenia 109 100 99 100 100 – 100 x – 100 – – 10 12 5,900<br />
Solomon Islands 104 – – – – 35 74 65 86 85 6 150 93 240<br />
Somalia 106 – – – – 15 x 26 x 6 x 33 x 9 x – 1,000 x 1,000 16<br />
South Africa 102 96 96 105 – 60 x 97 87 91 x 89 x 21 x 400 x 300 140<br />
South Sudan s – – – – – 4 40 17 19 12 1 2,100 x – –<br />
Spain 108 98 99 102 101 66 x – – – – 26 – 6 12,000<br />
Sri Lanka 109 97 100 – – 68 99 93 99 98 24 39 x 35 1,200<br />
<strong>State</strong> <strong>of</strong> Palestine 105 94 98 108 – 50 x 99 x – 99 x 97 x 15 x – 64 330<br />
Sudan s – – – – – 9 56 47 23 21 7 94 x – –<br />
Suriname 110 99 95 123 122 46 x 90 x – 90 x 88 x – 180 130 320<br />
Swaziland 98 99 92 100 107 65 97 77 82 80 12 590 x 320 95<br />
Sweden 105 – 99 99 100 – 100 x – – – – – 4 14,100<br />
Switzerland 106 – 100 97 – – – – – – 30 – 8 9,500<br />
Syrian Arab Republic 104 86 98 100 101 54 88 64 96 78 26 65 x 70 460<br />
Tajikistan 110 100 96 87 101 37 89 49 88 88 – 45 65 430<br />
Thailand 109 96 x 99 108 – 80 99 80 100 99 24 12 x 48 1,400<br />
The former Yugoslav<br />
Republic <strong>of</strong> Macedonia 106 97 101 99 – 40 99 94 98 98 25 4 10 6,300<br />
Timor-Leste 103 83 96 101 111 22 84 55 29 22 2 560 300 55<br />
Togo 106 61 90 – 123 15 72 55 59 67 9 – 300 80<br />
Tonga 108 100 x – – – 32 98 – 98 98 – 36 110 230<br />
Trinidad and Tobago 110 99 97 107 106 43 x 96 x – 98 x 97 x – – 46 1,300<br />
Tunisia 106 82 96 106 102 60 x 96 x 68 x 95 x 89 x 21 x – 56 860<br />
Turkey 106 89 98 91 103 73 92 74 91 90 37 29 x 20 2,200<br />
Turkmenistan 114 100 – – – 48 x 99 x 83 x 100 x 98 x 3 x 12 67 590<br />
Tuvalu – – – – – 31 97 67 98 93 7 0 x – –<br />
Uganda 103 78 101 85 101 30 93 48 57 57 5 440 310 49<br />
Ukraine 118 100 101 98 101 67 99 75 99 99 10 16 32 2,200<br />
At least<br />
one visit<br />
At least<br />
four visits<br />
Skilled<br />
attendant<br />
at birth<br />
Institutional<br />
delivery<br />
C-section<br />
Reported<br />
Adjusted<br />
Lifetime risk <strong>of</strong><br />
maternal death<br />
(1 in:)<br />
130<br />
THE STATE OF THE WORLD’S CHILDREN <strong>2013</strong>: <strong>Children</strong> with Disabilities
TABLE 8<br />
WOmEN<br />
Countries<br />
and areas<br />
Life Adult literacy<br />
expectancy: rate: females<br />
females as a as a % <strong>of</strong><br />
% <strong>of</strong> males males<br />
2011 2007–2011*<br />
Enrolment ratios: females Survival rate<br />
as a % <strong>of</strong> males 2008–2011* to last grade<br />
<strong>of</strong> primary:<br />
Primary<br />
GER<br />
Secondary<br />
GER<br />
females as a<br />
% <strong>of</strong> males<br />
2008–2011*<br />
Contraceptive<br />
prevalence<br />
(%)<br />
2007–2012*<br />
Antenatal care (%)<br />
2007–2012*<br />
United Arab Emirates 103 102 x – – – – 100 – 100 100 – 0 12 4,000<br />
United Kingdom 105 – 100 102 – 84 – – – – 26 – 12 4,600<br />
United Republic<br />
<strong>of</strong> Tanzania 103 85 102 – 113 34 88 43 49 50 5 450 460 38<br />
United <strong>State</strong>s 107 – 99 101 89 79 – – – – 31 13 21 2,400<br />
Uruguay 110 101 97 – 104 78 x 96 90 100 – 34 34 29 1,600<br />
Uzbekistan 110 100 97 99 101 65 x 99 x – 100 x 97 x – 21 28 1,400<br />
Vanuatu 106 96 95 102 94 38 84 – 74 80 – 86 110 230<br />
Venezuela<br />
(Bolivarian Republic <strong>of</strong>) 108 100 97 110 105 – 94 x – 95 x 95 x – 63 92 410<br />
Viet Nam 105 96 94 109 – 78 94 60 93 92 20 69 59 870<br />
Yemen 105 58 82 62 – 28 x 47 x 14 x 36 x 24 x 9 x 370 x 200 90<br />
Zambia 102 77 101 – 95 41 94 60 47 48 3 590 440 37<br />
Zimbabwe 97 – – – – 59 90 65 66 65 5 960 570 52<br />
MEMORANDUM<br />
Sudan and South Sudan s 106 – – – – – – – – – – – 730 31<br />
At least<br />
one visit<br />
At least<br />
four visits<br />
Skilled<br />
attendant<br />
at birth<br />
Delivery care (%)<br />
2007–2012* Maternal mortality ratio †<br />
2007–2011* 2010<br />
Institutional<br />
delivery<br />
C-section<br />
Reported<br />
Adjusted<br />
Lifetime risk <strong>of</strong><br />
maternal death<br />
(1 in:)<br />
SUMMARY INDICATORS #<br />
Sub-Saharan Africa 104 76 93 82 101 24 77 46 49 47 4 – 500 39<br />
Eastern and<br />
Sou<strong>the</strong>rn Africa 104 82 96 89 103 34 81 44 44 43 4 – 410 52<br />
West and Central Africa 104 70 89 76 100 17 74 47 55 52 4 – 570 32<br />
Middle East and<br />
North Africa 105 82 94 92 – 48 77 – 73 62 – – 170 190<br />
South Asia 104 69 98 91 – 52 70 35 49 44 9 – 220 150<br />
East Asia and Pacific 105 94 102 104 – 64 ** 93 77 ** 92 84 23 – 82 680<br />
Latin America<br />
and Caribbean 109 98 97 108 102 – 96 89 90 89 40 – 81 520<br />
CEE/CIS 113 98 99 97 101 73 – – 97 – – – 32 1,700<br />
Least developed countries 104 76 94 84 102 35 74 38 48 44 6 – 430 52<br />
World 106 90 97 97 100 ** 55 ** 81 50 ** 66 61 16 – 210 180<br />
s Due to <strong>the</strong> cession in July 2011 <strong>of</strong> <strong>the</strong> Republic <strong>of</strong> South Sudan by <strong>the</strong> Republic <strong>of</strong> <strong>the</strong> Sudan, and its subsequent admission to <strong>the</strong> United Nations on 14 July 2011, disaggregated data for <strong>the</strong> Sudan and South Sudan as separate<br />
<strong>State</strong>s are not yet available for all indicators. Aggregated data presented are for <strong>the</strong> Sudan pre-cession (see Memorandum item).<br />
# For a complete list <strong>of</strong> countries and areas in <strong>the</strong> regions, subregions and country categories, see page 98.<br />
DEFINITIONS OF THE INDICATORS<br />
Life expectancy – Number <strong>of</strong> years newborn children would live if subject to <strong>the</strong> mortality<br />
risks prevailing for <strong>the</strong> cross section <strong>of</strong> population at <strong>the</strong> time <strong>of</strong> <strong>the</strong>ir birth.<br />
Adult literacy rate – The number <strong>of</strong> persons aged 15 years and over who can both read<br />
and write with understanding a short, simple statement about everyday life, expressed<br />
as a percentage <strong>of</strong> <strong>the</strong> total population in that age group.<br />
Primary gross enrolment ratio (GER) – Total enrolment in primary school, regardless<br />
<strong>of</strong> age, expressed as a percentage <strong>of</strong> <strong>the</strong> <strong>of</strong>ficial primary-school-aged population.<br />
Secondary gross enrolment ratio (GER) – Total enrolment in secondary school,<br />
regardless <strong>of</strong> age, expressed as a percentage <strong>of</strong> <strong>the</strong> <strong>of</strong>ficial secondary-school-aged<br />
population.<br />
Survival rate to last grade <strong>of</strong> primary – Percentage <strong>of</strong> children entering <strong>the</strong> first<br />
grade <strong>of</strong> primary school who eventually reach <strong>the</strong> last grade (administrative data).<br />
Contraceptive prevalence – Percentage <strong>of</strong> women (aged 15–49) in union currently<br />
using any contraceptive method.<br />
Antenatal care – Percentage <strong>of</strong> women (aged 15–49) attended at least once during<br />
pregnancy by skilled health personnel (doctor, nurse or midwife) and <strong>the</strong> percentage<br />
attended by any provider at least four times.<br />
Skilled attendant at birth – Percentage <strong>of</strong> births attended by skilled heath personnel<br />
(doctor, nurse or midwife).<br />
Institutional delivery – Percentage <strong>of</strong> women (aged 15–49) who gave birth in a<br />
health facility.<br />
C-section – Percentage <strong>of</strong> births delivered by Caesarian section. (C-section rates<br />
between 5 and 15 per cent are expected given adequate levels <strong>of</strong> emergency<br />
obstetric care.)<br />
Maternal mortality ratio – Number <strong>of</strong> deaths <strong>of</strong> women from pregnancy-related<br />
causes per 100,000 live births during <strong>the</strong> same time period. The ‘reported’ column shows<br />
country-reported figures that are not adjusted for under-reporting or misclassification.<br />
For <strong>the</strong> ‘adjusted’ column, see note at right (†). Maternal mortality ratio values have been<br />
rounded according to <strong>the</strong> following scheme: 1,000, rounded to nearest 100.<br />
Lifetime risk <strong>of</strong> maternal death – Lifetime risk <strong>of</strong> maternal death takes into account<br />
both <strong>the</strong> probability <strong>of</strong> becoming pregnant and <strong>the</strong> probability <strong>of</strong> dying as a result <strong>of</strong><br />
pregnancy, accumulated across a woman’s reproductive years.<br />
MAIN DATA SOURCES<br />
Life expectancy – United Nations Population Division.<br />
Adult literacy – UNESCO Institute for Statistics (UIS).<br />
Primary and secondary school enrolment – UIS.<br />
Survival rate to last primary grade – UIS. Regional and global averages calculated by UNICEF.<br />
Contraceptive prevalence rate – Demographic and Health Surveys (DHS), Multiple Indicator Cluster Surveys (MICS) and o<strong>the</strong>r<br />
nationally representative sources; United Nations Population Division.<br />
Antenatal care – DHS, MICS and o<strong>the</strong>r nationally representative sources.<br />
Skilled attendant at birth – DHS, MICS and o<strong>the</strong>r nationally representative sources.<br />
Institutional delivery – DHS, MICS and o<strong>the</strong>r nationally representative sources.<br />
C-section – DHS, MICS and o<strong>the</strong>r nationally representative sources.<br />
Maternal mortality ratio (reported) – Nationally representative sources, including household surveys and vital registration.<br />
Maternal mortality ratio (adjusted) – United Nations Maternal Mortality Estimation Inter-agency Group (WHO, UNICEF, UNFPA and <strong>the</strong><br />
World Bank).<br />
Lifetime risk <strong>of</strong> maternal death – United Nations Maternal Mortality Estimation Inter-agency Group (WHO, UNICEF, UNFPA and <strong>the</strong><br />
World Bank).<br />
NOTES<br />
− Data not available.<br />
x Data refer to years or periods o<strong>the</strong>r than those specified in <strong>the</strong> column heading. Such data are not included in <strong>the</strong> calculation <strong>of</strong> regional<br />
and global averages, with <strong>the</strong> exception <strong>of</strong> 2005–2006 data from India. Estimates from data years prior to 2000 are not<br />
displayed.<br />
* Data refer to <strong>the</strong> most recent year available during <strong>the</strong> period specified in <strong>the</strong> column heading.<br />
** Excludes China.<br />
† The maternal mortality data in <strong>the</strong> column headed ‘reported’ refer to data reported by national authorities. The data in <strong>the</strong> column<br />
headed ‘adjusted’ refer to <strong>the</strong> 2010 United Nations inter-agency maternal mortality estimates that were released in May 2012. Periodically,<br />
<strong>the</strong> United Nations Maternal Mortality Estimation Inter-agency Group (WHO, UNICEF, UNFPA and <strong>the</strong> World Bank) produces<br />
internationally comparable sets <strong>of</strong> maternal mortality data that account for <strong>the</strong> well-documented problems <strong>of</strong> under-reporting and<br />
misclassification <strong>of</strong> maternal deaths, and that also include estimates for countries with no data. Please note that <strong>the</strong>se values are not<br />
comparable with previously reported maternal mortality ratio ‘adjusted’ values, mainly due to an increase in <strong>the</strong> number <strong>of</strong> countries<br />
and data sources included in <strong>the</strong> latest round <strong>of</strong> estimation. Comparable time series on maternal mortality ratios for <strong>the</strong> years 1990,<br />
1995, 2000, 2005 and 2010 are available at .<br />
STATISTICAL TABLES 131
TABLE 9: CHILd pROTECTION<br />
Countries<br />
and areas<br />
Child labour (%) +<br />
2002–2011*<br />
total male female<br />
Child marriage (%)<br />
2002–2011*<br />
married<br />
by 15<br />
Birth<br />
registration<br />
(%) 2005–2011*<br />
Female genital mutilation/cutting (%)<br />
2002–2011*<br />
prevalence<br />
attitudes<br />
Justification <strong>of</strong><br />
wife beating (%)<br />
2002–2011*<br />
Violent discipline (%) +<br />
2005–2011*<br />
married<br />
support for<br />
by 18 total women a daughters b <strong>the</strong> practice c male female total male female<br />
Afghanistan 10 11 10 15 40 37 – – – – 90 74 75 74<br />
Albania 12 14 9 0 10 99 – – – 36 30 75 78 71<br />
Algeria 5 y 6 y 4 y 0 2 99 – – – – 68 88 89 87<br />
Andorra – – – – – – – – – – – – – –<br />
Angola 24 x 22 x 25 x – – 29 x – – – – – – – –<br />
Antigua and Barbuda – – – – – – – – – – – – – –<br />
Argentina 7 y 8 y 5 y – – 91 x, y – – – – – – – –<br />
Armenia 4 y 5 y 3 y 0 7 100 – – – 20 9 70 72 67<br />
Australia – – – – – – – – – – – – – –<br />
Austria – – – – – – – – – – – – – –<br />
Azerbaijan 7 y 8 y 5 y 1 12 94 – – – 58 49 75 79 71<br />
Bahamas – – – – – – – – – – – – – –<br />
Bahrain 5 x 6 x 3 x – – – – – – – – – – –<br />
Bangladesh 13 18 8 32 66 10 – – – 36 36 – – –<br />
Barbados – – – – – – – – – – – – – –<br />
Belarus 5 6 4 0 7 – – – – – – 84 87 80<br />
Belgium – – – – – – – – – – – – – –<br />
Belize 6 7 5 3 26 95 – – – – 9 71 71 70<br />
Benin 46 47 45 8 34 60 13 2 1 14 47 – – –<br />
Bhutan 3 3 3 6 26 100 – – – – 68 – – –<br />
Bolivia (Plurinational<br />
<strong>State</strong> <strong>of</strong>) 26 y 28 y 24 y 3 22 76 y – – – – 16 – – –<br />
Bosnia and Herzegovina 5 7 4 0 6 100 – – – – 5 38 40 36<br />
Botswana 9 y 11 y 7 y – – 72 – – – – – – – –<br />
Brazil 3 y 4 y 2 y 11 36 93 y – – – – – – – –<br />
Brunei Darussalam – – – – – – – – – – – – – –<br />
Bulgaria – – – – – – – – – – – – – –<br />
Burkina Faso 39 42 36 10 52 77 76 13 y 9 34 44 83 84 82<br />
Burundi 26 26 27 3 20 75 – – – 44 73 – – –<br />
Cambodia 37 y – – 2 18 62 – – – 22 y 46 y – – –<br />
Cameroon 31 31 30 11 36 70 1 1 7 – 56 93 93 93<br />
Canada – – – – – – – – – – – – – –<br />
Cape Verde 3 x, y 4 x, y 3 x, y 3 18 91 – – – 16 y 17 – – –<br />
Central African Republic 29 27 30 29 68 61 24 1 y 11 80 y 80 92 92 92<br />
Chad 26 25 28 29 68 16 44 18 38 – 62 84 85 84<br />
Chile 3 3 2 – – 100 y – – – – – – – –<br />
China – – – – – – – – – – – – – –<br />
Colombia 9 y 12 y 6 y 6 23 97 – – – – – – – –<br />
Comoros 27 x 26 x 28 x – – 83 x – – – – – – – –<br />
Congo 25 24 25 7 33 81 y – – – – 76 – – –<br />
Cook Islands – – – – – – – – – – – – – –<br />
Costa Rica 5 6 3 – – – – – – – – – – –<br />
Côte d’Ivoire 35 36 34 8 35 55 36 9 20 – 65 91 91 91<br />
Croatia – – – – – – – – – – – – – –<br />
Cuba – – – 9 40 100 y – – – – – – – –<br />
Cyprus – – – – – – – – – – – – – –<br />
Czech Republic – – – – – – – – – – – – – –<br />
Democratic People’s<br />
Republic <strong>of</strong> Korea – – – – – 100 – – – – – – – –<br />
Democratic Republic<br />
<strong>of</strong> <strong>the</strong> Congo 15 13 17 9 39 28 – – – – 76 92 92 91<br />
Denmark – – – – – – – – – – – – – –<br />
Djibouti 8 8 8 2 5 89 93 49 37 – – 72 73 71<br />
Dominica – – – – – – – – – – – – – –<br />
Dominican Republic 13 18 8 12 41 79 – – – – 4 67 69 65<br />
Ecuador 8 7 8 4 22 90 – – – – – – – –<br />
Egypt 7 8 5 2 17 99 91 24 y 54 – 39 y 92 y – –<br />
El Salvador 5 y 7 y 3 y 5 25 99 – – – – – – – –<br />
Equatorial Guinea 28 x 28 x 28 x – – 32 x – – – – – – – –<br />
Eritrea – – – 20 47 – 89 63 49 – 71 – – –<br />
Estonia – – – – – – – – – – – – – –<br />
Ethiopia 27 y 31 y 24 y 16 41 7 74 38 – 45 68 – – –<br />
Fiji – – – – – – – – – – – 72 y – –<br />
Finland – – – – – – – – – – – – – –<br />
France – – – – – – – – – – – – – –<br />
Gabon – – – 11 x 34 x 89 x – – – – – – – –<br />
132<br />
THE STATE OF THE WORLD’S CHILDREN <strong>2013</strong>: <strong>Children</strong> with Disabilities
TABLE 9<br />
CHILd pROTECTION<br />
Countries<br />
and areas<br />
Child labour (%) +<br />
2002–2011*<br />
total male female<br />
Child marriage (%)<br />
2002–2011*<br />
married<br />
by 15<br />
Birth<br />
registration<br />
(%) 2005–2011*<br />
Female genital mutilation/cutting (%)<br />
2002–2011*<br />
prevalence<br />
attitudes<br />
Justification <strong>of</strong><br />
wife beating (%)<br />
2002–2011*<br />
Violent discipline (%) +<br />
2005–2011*<br />
married<br />
support for<br />
by 18 total women a daughters b <strong>the</strong> practice c male female total male female<br />
Gambia 19 21 18 7 36 53 76 42 y 64 – 75 90 90 91<br />
Georgia 18 20 17 1 14 99 – – – – 7 67 70 63<br />
Germany – – – – – – – – – – – – – –<br />
Ghana 34 34 34 5 21 63 4 0 y 2 26 y 44 94 94 94<br />
Greece – – – – – – – – – – – – – –<br />
Grenada – – – – – – – – – – – – – –<br />
Guatemala 21 y – – 7 30 97 – – – – – – – –<br />
Guinea 25 26 24 20 63 43 96 57 69 – 86 – – –<br />
Guinea-Bissau 38 40 36 7 22 24 50 39 34 – 40 y 82 82 81<br />
Guyana 16 17 16 6 23 88 – – – 19 16 76 79 74<br />
Haiti 21 22 19 6 30 81 – – – – 29 – – –<br />
Holy See – – – – – – – – – – – – – –<br />
Honduras 16 16 15 11 39 94 – – – – 16 – – –<br />
Hungary – – – – – – – – – – – – – –<br />
Iceland – – – – – – – – – – – – – –<br />
India 12 12 12 18 47 41 – – – 51 54 – – –<br />
Indonesia 7 y 8 y 6 y 4 22 53 – – – 16 y 31 y – – –<br />
Iran (Islamic Republic <strong>of</strong>) – – – – – – – – – – – – – –<br />
Iraq 11 12 9 3 17 95 – – – – 59 86 87 84<br />
Ireland – – – – – – – – – – – – – –<br />
Israel – – – – – – – – – – – – – –<br />
Italy – – – – – – – – – – – – – –<br />
Jamaica 6 7 5 1 9 98 – – – 22 y 3 y 89 90 87<br />
Japan – – – – – – – – – – – – – –<br />
Jordan 2 y 3 y 0 y 1 10 – – – – – 90 y – – –<br />
Kazakhstan 2 2 2 0 6 100 – – – 17 12 49 54 45<br />
Kenya 26 x 27 x 25 x 6 26 60 27 – 9 44 53 – – –<br />
Kiribati – – – 3 20 94 – – – 60 76 81 y – –<br />
Kuwait – – – – – – – – – – – – – –<br />
Kyrgyzstan 4 4 3 1 10 94 – – – – 38 54 y 58 y 49 y<br />
Lao People’s<br />
Democratic Republic 11 10 13 – – 72 – – – – 81 74 75 72<br />
Latvia – – – – – – – – – – – – – –<br />
Lebanon 2 3 1 1 6 100 – – – – 10 y 82 82 82<br />
Lesotho 23 x 25 x 21 x 2 19 45 – – – 48 37 – – –<br />
Liberia 21 21 21 11 38 4 y 58 – – 30 59 94 94 94<br />
Libya – – – – – – – – – – – – – –<br />
Liechtenstein – – – – – – – – – – – – – –<br />
Lithuania – – – – – – – – – – – – – –<br />
Luxembourg – – – – – – – – – – – – – –<br />
Madagascar 28 y 29 y 27 y 14 48 80 – – – 30 32 – – –<br />
Malawi 26 25 26 12 50 – – – – 13 13 – – –<br />
Malaysia – – – – – – – – – – – – – –<br />
Maldives – – – 0 4 93 – – – 14 y 31 y – – –<br />
Mali 21 22 21 15 55 81 89 75 73 – 87 – – –<br />
Malta – – – – – – – – – – – – – –<br />
Marshall Islands – – – 6 26 96 – – – 58 56 – – –<br />
Mauritania 16 18 15 15 35 56 72 66 53 – – – – –<br />
Mauritius – – – – – – – – – – – – – –<br />
Mexico 5 6 5 5 23 – – – – – – – – –<br />
Micronesia<br />
(Federated <strong>State</strong>s <strong>of</strong>) – – – – – – – – – – – – – –<br />
Monaco – – – – – – – – – – – – – –<br />
Mongolia 10 10 11 0 5 99 – – – 9 y 10 46 48 43<br />
Montenegro 10 12 8 0 5 98 – – – – 11 63 64 61<br />
Morocco 8 9 8 3 16 85 x, y – – – – 64 91 92 90<br />
Mozambique 22 21 24 21 56 31 – – – – 36 – – –<br />
Myanmar – – – – – 72 – – – – – – – –<br />
Namibia – – – 2 9 67 – – – 41 35 – – –<br />
Nauru – – – 2 27 83 – – – – – – – –<br />
Nepal 34 y 30 y 38 y 10 41 42 – – – 22 23 – – –<br />
Ne<strong>the</strong>rlands – – – – – – – – – – – – – –<br />
New Zealand – – – – – – – – – – – – – –<br />
Nicaragua 15 x 18 x 11 x 10 41 81 y – – – – 14 – – –<br />
Niger 43 43 43 36 75 32 y 2 1 3 – 70 – – –<br />
STATISTICAL TABLES 133
TABLE 9<br />
CHILd pROTECTION<br />
Countries<br />
and areas<br />
Child labour (%) +<br />
2002–2011*<br />
total male female<br />
Child marriage (%)<br />
2002–2011*<br />
married<br />
by 15<br />
Birth<br />
registration<br />
(%) 2005–2011*<br />
Female genital mutilation/cutting (%)<br />
2002–2011*<br />
prevalence<br />
attitudes<br />
Justification <strong>of</strong><br />
wife beating (%)<br />
2002–2011*<br />
Violent discipline (%) +<br />
2005–2011*<br />
married<br />
support for<br />
by 18 total women a daughters b <strong>the</strong> practice c male female total male female<br />
Nigeria 29 29 29 16 39 30 30 y 30 y 22 30 43 – – –<br />
Niue – – – – – – – – – – – – – –<br />
Norway – – – – – – – – – – – – – –<br />
Oman – – – – – – – – – – – – – –<br />
Pakistan – – – 7 24 27 – – – – – – – –<br />
Palau – – – – – – – – – – – – – –<br />
Panama 7 y 10 y 4 y – – – – – – – – – – –<br />
Papua New Guinea – – – 2 21 – – – – – – – – –<br />
Paraguay 15 17 12 – 18 – – – – – – – – –<br />
Peru 34 y 31 y 36 y 3 19 93 – – – – – – – –<br />
Philippines – – – 2 14 83 x – – – – 14 – – –<br />
Poland – – – – – – – – – – – – – –<br />
Portugal 3 x, y 4 x, y 3 x, y – – – – – – – – – – –<br />
Qatar – – – – – – – – – – – – – –<br />
Republic <strong>of</strong> Korea – – – – – – – – – – – – – –<br />
Republic <strong>of</strong> Moldova 16 20 12 1 19 98 x – – – 22 y 21 – – –<br />
Romania 1 x 1 x 1 x – – – – – – – – – – –<br />
Russian Federation – – – – – – – – – – – – – –<br />
Rwanda 29 27 30 1 8 63 – – – 25 56 – – –<br />
Saint Kitts and Nevis – – – – – – – – – – – – – –<br />
Saint Lucia – – – – – – – – – – – – – –<br />
Saint Vincent<br />
and <strong>the</strong> Grenadines – – – – – – – – – – – – – –<br />
Samoa – – – – – 48 – – – 46 61 – – –<br />
San Marino – – – – – – – – – – – – – –<br />
Sao Tome and Principe 8 8 7 5 34 75 – – – 22 20 – – –<br />
Saudi Arabia – – – – – – – – – – – – – –<br />
Senegal 17 y 18 y 16 y 12 33 75 26 13 y 17 25 60 – – –<br />
Serbia 4 5 4 1 5 99 – – – 7 y 3 67 70 64<br />
Seychelles – – – – – – – – – – – – – –<br />
Sierra Leone 26 27 25 18 44 78 88 10 y 72 – 73 82 81 82<br />
Singapore – – – – – – – – – – – – – –<br />
Slovakia – – – – – – – – – – – – – –<br />
Slovenia – – – – – – – – – – – – – –<br />
Solomon Islands – – – 3 22 – – – – 65 69 72 y – –<br />
Somalia 49 45 54 8 45 3 98 46 65 – 76 y – – –<br />
South Africa – – – 1 6 92 y – – – – – – – –<br />
South Sudan s – – – 9 52 35 – – – – 79 – – –<br />
Spain – – – – – – – – – – – – – –<br />
Sri Lanka – – – 2 12 97 – – – – 53 y – – –<br />
<strong>State</strong> <strong>of</strong> Palestine – – – 7 19 96 y – – – – – 95 – –<br />
Sudan s – – – 7 33 59 88 37 y 42 – 47 – – –<br />
Suriname 6 7 5 3 19 97 – – – – 13 86 87 85<br />
Swaziland 7 8 7 1 7 50 – – – 23 y 28 89 90 88<br />
Sweden – – – – – – – – – – – – – –<br />
Switzerland – – – – – – – – – – – – – –<br />
Syrian Arab Republic 4 5 3 3 13 95 – – – – – 89 90 88<br />
Tajikistan 10 9 11 1 13 88 – – – – 74 y 78 80 75<br />
Thailand 8 8 8 3 20 99 – – – – – – – –<br />
The former Yugoslav<br />
Republic <strong>of</strong> Macedonia 13 12 13 1 7 100 – – – – 15 69 71 67<br />
Timor-Leste 4 4 4 3 19 55 – – – 81 86 – – –<br />
Togo 28 28 29 6 25 78 4 0 y 2 – 43 93 94 93<br />
Tonga – – – – – – – – – – – – – –<br />
Trinidad and Tobago 1 1 1 2 8 96 – – – – 8 77 78 77<br />
Tunisia – – – – – – – – – – – – – –<br />
Turkey 3 y 3 y 2 y 3 14 94 – – – – 25 – – –<br />
Turkmenistan – – – 1 7 96 – – – – 38 y – – –<br />
Tuvalu – – – 0 10 50 – – – 73 70 – – –<br />
Uganda 25 y 27 y 24 y 10 40 30 1 1 y 9 44 58 – – –<br />
Ukraine 7 8 7 0 10 100 – – – 11 4 70 76 65<br />
United Arab Emirates – – – – – – – – – – – – – –<br />
United Kingdom – – – – – – – – – – – – – –<br />
United Republic<br />
<strong>of</strong> Tanzania 21 y 23 y 19 y 7 37 16 15 3 6 38 54 – – –<br />
United <strong>State</strong>s – – – – – – – – – – – – – –<br />
134<br />
THE STATE OF THE WORLD’S CHILDREN <strong>2013</strong>: <strong>Children</strong> with Disabilities
TABLE 9<br />
CHILd pROTECTION<br />
Countries<br />
and areas<br />
Child labour (%) +<br />
2002–2011*<br />
total male female<br />
Child marriage (%)<br />
2002–2011*<br />
married<br />
by 15<br />
Birth<br />
registration<br />
(%) 2005–2011*<br />
Female genital mutilation/cutting (%)<br />
2002–2011*<br />
prevalence<br />
attitudes<br />
Justification <strong>of</strong><br />
wife beating (%)<br />
2002–2011*<br />
Violent discipline (%) +<br />
2005–2011*<br />
married<br />
support for<br />
by 18 total women a daughters b <strong>the</strong> practice c male female total male female<br />
Uruguay 8 y 8 y 8 y – – – – – – – – – – –<br />
Uzbekistan – – – 0 7 100 – – – 59 y 70 – – –<br />
Vanuatu – – – 9 27 26 – – – – – 78 y – –<br />
Venezuela<br />
(Bolivarian Republic <strong>of</strong>) 8 x 9 x 6 x – – 92 x – – – – – – – –<br />
Viet Nam 7 7 7 1 9 95 – – – – 36 74 76 71<br />
Yemen 23 21 24 11 32 22 23 x, y 20 x, y 41 x, y – – 95 95 95<br />
Zambia 41 y 42 y 40 y 9 42 14 1 – – 49 62 – – –<br />
Zimbabwe – – – 4 31 49 – – – 34 40 – – –<br />
MEMORANDUM<br />
Sudan and South Sudan s 13 x 14 x 12 x – – – – – – – – – – –<br />
SUMMARY INDICATORS #<br />
Sub-Saharan Africa 27 28 26 12 37 41 40 24 21 35 55 – – –<br />
Eastern and<br />
Sou<strong>the</strong>rn Africa 27 28 25 9 34 37 42 – – 40 55 – – –<br />
West and Central Africa 27 28 27 14 41 42 34 23 22 30 56 – – –<br />
Middle East and<br />
North Africa 9 10 8 3 17 81 – – – – 52 90 – –<br />
South Asia 12 13 12 18 46 37 – – – 49 52 – – –<br />
East Asia and Pacific 8 ** 8 ** 7 ** 3 ** 18 ** 70 ** – – – – 30 ** – – –<br />
Latin America<br />
and Caribbean 9 9 7 7 29 93 – – – – – – – –<br />
CEE/CIS 5 6 4 1 10 96 – – – – 27 – – –<br />
Least developed countries 23 24 22 16 46 35 – – – 36 54 – – –<br />
World 15 ** 15 ** 14 ** 11 ** 34 ** 51 ** – – – – 47 ** – – –<br />
s Due to <strong>the</strong> cession in July 2011 <strong>of</strong> <strong>the</strong> Republic <strong>of</strong> South Sudan by <strong>the</strong> Republic <strong>of</strong> <strong>the</strong> Sudan, and its subsequent admission to <strong>the</strong> United Nations on 14 July 2011, disaggregated data for <strong>the</strong> Sudan<br />
and South Sudan as separate <strong>State</strong>s are not yet available for all indicators. Aggregated data presented are for <strong>the</strong> Sudan pre-cession (see Memorandum item).<br />
# For a complete list <strong>of</strong> countries and areas in <strong>the</strong> regions, subregions and country categories, see page 98.<br />
DEFINITIONS OF THE INDICATORS<br />
Child labour – Percentage <strong>of</strong> children 5–14 years old involved in child labour at <strong>the</strong> moment <strong>of</strong> <strong>the</strong><br />
survey. A child is considered to be involved in child labour under <strong>the</strong> following conditions: children<br />
5–11 years old who, during <strong>the</strong> reference week, did at least one hour <strong>of</strong> economic activity or at least<br />
28 hours <strong>of</strong> household chores, or children 12–14 years old who, during <strong>the</strong> reference week, did at<br />
least 14 hours <strong>of</strong> economic activity or at least 28 hours <strong>of</strong> household chores.<br />
Child marriage – Percentage <strong>of</strong> women 20–24 years old who were first married or in union<br />
before <strong>the</strong>y were 15 years old and percentage <strong>of</strong> women 20–24 years old who were first married<br />
or in union before <strong>the</strong>y were 18 years old.<br />
Birth registration – Percentage <strong>of</strong> children less than 5 years old who were registered at <strong>the</strong><br />
moment <strong>of</strong> <strong>the</strong> survey. The numerator <strong>of</strong> this indicator includes children whose birth certificate<br />
was seen by <strong>the</strong> interviewer or whose mo<strong>the</strong>r or caretaker says <strong>the</strong> birth has been registered.<br />
Female genital mutilation/cutting – (a) Women: percentage <strong>of</strong> women 15–49 years old who<br />
have been mutilated/cut; (b) daughters: percentage <strong>of</strong> women 15–49 years old with at least one<br />
mutilated/cut daughter; (c) support for <strong>the</strong> practice: percentage <strong>of</strong> women 15–49 years old<br />
who believe that <strong>the</strong> practice <strong>of</strong> female genital mutilation/cutting should continue.<br />
Justification <strong>of</strong> wife beating – Percentage <strong>of</strong> women and men 15–49 years old who consider<br />
a husband to be justified in hitting or beating his wife for at least one <strong>of</strong> <strong>the</strong> specified reasons,<br />
i.e., if his wife burns <strong>the</strong> food, argues with him, goes out without telling him, neglects <strong>the</strong><br />
children or refuses sexual relations.<br />
Violent discipline – Percentage <strong>of</strong> children 2–14 years old who experience any violent<br />
discipline (psychological aggression and/or physical punishment).<br />
MAIN DATA SOURCES<br />
Child labour – Multiple Indicator Cluster Surveys (MICS), Demographic and Health Surveys<br />
(DHS) and o<strong>the</strong>r national surveys.<br />
Child marriage – MICS, DHS and o<strong>the</strong>r national surveys.<br />
Birth registration – MICS, DHS, o<strong>the</strong>r national surveys and vital registration systems.<br />
Female genital mutilation/cutting – MICS, DHS and o<strong>the</strong>r national surveys.<br />
Justification <strong>of</strong> wife beating – MICS, DHS and o<strong>the</strong>r national surveys.<br />
Violent discipline – MICS, DHS and o<strong>the</strong>r national surveys.<br />
NOTES<br />
– Data not available.<br />
x Data refer to years or periods o<strong>the</strong>r than those specified in <strong>the</strong> column heading. Such data are<br />
not included in <strong>the</strong> calculation <strong>of</strong> regional and global averages.<br />
y Data differ from <strong>the</strong> standard definition or refer to only part <strong>of</strong> a country. If <strong>the</strong>y fall within<br />
<strong>the</strong> noted reference period, such data are included in <strong>the</strong> calculation <strong>of</strong> regional and global<br />
averages.<br />
+ A more detailed explanation <strong>of</strong> <strong>the</strong> methodology and <strong>the</strong> changes in calculating <strong>the</strong>se<br />
estimates can be found in <strong>the</strong> General Note on <strong>the</strong> Data, page 94.<br />
* Data refer to <strong>the</strong> most recent year available during <strong>the</strong> period specified in <strong>the</strong> column heading.<br />
** Excludes China.<br />
STATISTICAL TABLES 135
TABLE 10: THE RATE OF pROGRESS<br />
Countries<br />
and areas<br />
Under-5<br />
mortality<br />
rank<br />
Under-5 mortality rate<br />
Annual rate <strong>of</strong> reduction (%)u<br />
Under-5 mortality rate<br />
Reduction<br />
since 1990<br />
Reduction<br />
since 2000<br />
GDP per capita<br />
average annual<br />
growth rate (%) Total fertility rate<br />
Average annual rate<br />
<strong>of</strong> reduction (%)<br />
Total fertility rate<br />
1970 1990 2000 2011 1970–1990 1990–2000 2000–2011 1990–2011 (%)u (%)u 1970–1990 1990–2011 1970 1990 2011 1970–1990 1990–2011<br />
Afghanistan 23 309 192 136 101 2.4 3.4 2.7 3.1 47 26 – – 7.7 8.0 6.2 -0.2 1.2<br />
Albania 122 – 41 26 14 – 4.5 5.5 5.0 65 46 -0.7 x 5.3 4.9 3.2 1.5 2.1 3.6<br />
Algeria 74 199 66 46 30 5.5 3.6 3.9 3.8 55 35 1.6 1.5 7.4 4.7 2.2 2.3 3.6<br />
Andorra 184 – 8 5 3 – 5.1 3.8 4.4 60 34 -1.4 2.5 x – – – – –<br />
Angola 8 – 243 199 158 – 2.0 2.1 2.1 35 21 – 4.1 7.3 7.2 5.3 0.1 1.4<br />
Antigua and Barbuda 145 – 27 15 8 – 5.9 6.1 6.0 72 49 7.8 x 0.6 – – – – –<br />
Argentina 122 58 28 20 14 3.7 3.1 3.3 3.2 49 31 -0.8 2.3 3.1 3.0 2.2 0.1 1.5<br />
Armenia 102 – 47 30 18 – 4.6 4.8 4.7 63 41 – 6.1 3.2 2.5 1.7 1.2 1.8<br />
Australia 165 21 9 6 5 4.2 3.8 2.9 3.4 51 27 1.6 2.2 2.7 1.9 2.0 1.9 -0.2<br />
Austria 169 29 9 6 4 5.6 5.2 2.6 3.8 55 25 2.5 1.8 2.3 1.5 1.4 2.4 0.3<br />
Azerbaijan 61 – 95 69 45 – 3.2 3.9 3.6 53 35 – 5.9 4.6 3.0 2.2 2.2 1.5<br />
Bahamas 107 31 22 17 16 1.8 2.6 0.4 1.4 26 4 1.9 0.7 3.5 2.6 1.9 1.5 1.6<br />
Bahrain 135 81 21 12 10 6.9 5.0 2.0 3.4 51 19 -1.0 x 1.3 x 6.5 3.7 2.5 2.8 1.9<br />
Bangladesh 60 226 139 84 46 2.4 5.0 5.5 5.3 67 45 0.6 3.6 6.9 4.5 2.2 2.1 3.4<br />
Barbados 98 47 18 17 20 4.8 0.4 -1.2 -0.5 -10 -15 1.7 1.1 x 3.1 1.7 1.6 2.9 0.5<br />
Belarus 157 – 17 14 6 – 2.3 8.1 5.3 67 59 – 4.7 2.3 1.9 1.5 1.0 1.2<br />
Belgium 169 24 10 6 4 4.3 5.4 2.7 4.0 57 26 2.2 1.6 2.2 1.6 1.8 1.7 -0.7<br />
Belize 106 – 44 26 17 – 5.1 4.0 4.5 62 36 2.9 1.8 6.3 4.5 2.7 1.7 2.4<br />
Benin 20 261 177 140 106 1.9 2.4 2.5 2.4 40 24 0.5 1.3 6.7 6.7 5.2 0.0 1.2<br />
Bhutan 51 286 138 89 54 3.6 4.4 4.6 4.5 61 40 – 5.3 6.7 5.8 2.3 0.7 4.3<br />
Bolivia (Plurinational<br />
<strong>State</strong> <strong>of</strong>) 55 226 120 81 51 3.2 3.9 4.3 4.1 58 37 -1.1 1.6 6.6 4.9 3.3 1.5 1.9<br />
Bosnia and Herzegovina 145 – 19 10 8 – 6.7 2.0 4.3 59 20 – 8.3 x 2.9 1.7 1.1 2.6 1.9<br />
Botswana 80 131 53 81 26 4.5 -4.3 10.4 3.4 51 68 8.1 3.4 6.6 4.7 2.7 1.7 2.6<br />
Brazil 107 129 58 36 16 4.0 4.9 7.5 6.3 73 56 2.3 1.6 5.0 2.8 1.8 2.9 2.1<br />
Brunei Darussalam 151 – 12 10 7 – 2.5 2.6 2.6 41 25 -2.2 x -0.4 x 5.8 3.5 2.0 2.4 2.7<br />
Bulgaria 128 39 22 21 12 2.9 0.7 4.9 2.9 45 42 3.4 x 3.3 2.2 1.7 1.5 1.1 0.6<br />
Burkina Faso 9 291 208 182 146 1.7 1.4 2.0 1.7 30 19 1.3 2.8 6.6 6.8 5.8 -0.2 0.8<br />
Burundi 10 229 183 165 139 1.1 1.0 1.5 1.3 24 15 1.2 -1.4 6.8 6.5 4.2 0.2 2.1<br />
Cambodia 62 – 117 102 43 – 1.4 7.9 4.8 64 58 – 6.5 x 5.9 5.7 2.5 0.2 3.9<br />
Cameroon 11 206 145 140 127 1.8 0.4 0.8 0.6 12 9 3.4 0.8 6.2 5.9 4.4 0.2 1.4<br />
Canada 157 22 8 6 6 4.9 2.9 0.9 1.9 33 10 2.0 1.8 2.2 1.7 1.7 1.5 -0.1<br />
Cape Verde 91 160 58 39 21 5.1 4.0 5.5 4.8 63 45 – 5.0 6.9 5.3 2.3 1.3 3.9<br />
Central African Republic 6 226 169 172 164 1.5 -0.2 0.5 0.2 3 5 -1.3 -0.5 6.0 5.8 4.5 0.1 1.1<br />
Chad 4 257 208 189 169 1.1 1.0 1.0 1.0 19 10 -0.9 3.1 6.5 6.7 5.9 -0.1 0.6<br />
Chile 141 82 19 11 9 7.4 5.5 2.0 3.6 53 19 1.5 3.4 4.0 2.6 1.8 2.1 1.7<br />
China 115 117 49 35 15 4.3 3.3 7.9 5.8 70 58 6.6 9.3 5.5 2.3 1.6 4.3 1.9<br />
Colombia 102 105 34 25 18 5.6 3.2 3.1 3.2 48 29 1.9 1.6 5.6 3.1 2.3 2.9 1.3<br />
Comoros 33 219 122 100 79 2.9 2.0 2.1 2.0 35 20 -0.1 x -0.8 7.1 5.6 4.9 1.2 0.7<br />
Congo 25 152 119 109 99 1.2 0.9 0.9 0.9 17 9 3.3 0.4 6.3 5.4 4.5 0.8 0.8<br />
Cook Islands 135 61 19 17 10 5.8 1.1 5.3 3.3 50 44 – – – – – – –<br />
Costa Rica 135 71 17 13 10 7.1 2.9 2.2 2.5 41 22 0.7 2.6 5.0 3.2 1.8 2.3 2.6<br />
Côte d’Ivoire 17 233 151 139 115 2.2 0.9 1.7 1.3 24 17 -1.7 -0.6 7.9 6.3 4.3 1.2 1.7<br />
Croatia 165 – 13 8 5 – 4.3 4.5 4.4 60 39 – 2.8 2.0 1.7 1.5 0.9 0.6<br />
Cuba 157 41 13 9 6 5.6 4.5 3.5 4.0 56 32 3.9 3.0 x 4.0 1.8 1.5 4.2 0.9<br />
Cyprus 184 – 11 7 3 – 5.3 6.7 6.0 72 52 5.9 x 2.0 2.6 2.4 1.5 0.4 2.4<br />
Czech Republic 169 – 14 7 4 – 7.6 4.9 6.2 73 42 – 2.7 2.0 1.8 1.5 0.6 1.0<br />
Democratic People’s<br />
Republic <strong>of</strong> Korea 69 – 45 58 33 – -2.5 5.0 1.4 26 42 – – 4.0 2.4 2.0 2.6 0.9<br />
Democratic Republic<br />
<strong>of</strong> <strong>the</strong> Congo 5 244 181 181 168 1.5 0.0 0.7 0.4 8 8 -2.2 -2.6 6.2 7.1 5.7 -0.7 1.1<br />
Denmark 169 16 9 6 4 3.2 4.4 3.8 4.1 57 34 2.0 1.4 2.1 1.7 1.9 1.2 -0.6<br />
Djibouti 26 – 122 106 90 – 1.4 1.5 1.5 26 15 – -1.4 x 7.4 6.2 3.7 0.9 2.5<br />
Dominica 128 54 17 15 12 5.7 1.6 2.1 1.8 32 21 5.2 x 2.2 – – – – –<br />
Dominican Republic 83 122 58 39 25 3.7 4.1 4.0 4.1 58 36 2.1 3.9 6.2 3.5 2.5 2.9 1.5<br />
Ecuador 86 138 52 34 23 4.8 4.3 3.7 4.0 56 33 1.3 1.5 6.3 3.7 2.4 2.7 1.9<br />
Egypt 91 237 86 44 21 5.1 6.6 6.8 6.7 75 52 4.3 2.8 5.9 4.4 2.7 1.6 2.3<br />
El Salvador 115 158 60 34 15 4.8 5.7 7.3 6.6 75 55 -1.9 2.4 6.2 4.0 2.2 2.3 2.8<br />
Equatorial Guinea 16 – 190 152 118 – 2.2 2.3 2.3 38 22 – 18.2 5.7 5.9 5.1 -0.2 0.7<br />
Eritrea 41 247 138 98 68 2.9 3.4 3.4 3.4 51 31 – -0.8 x 6.6 6.2 4.4 0.3 1.7<br />
Estonia 169 – 20 11 4 – 6.2 9.7 8.1 82 66 – 5.5 x 2.1 1.9 1.7 0.4 0.6<br />
Ethiopia 36 230 198 139 77 0.7 3.6 5.3 4.5 61 44 – 3.3 6.8 7.1 4.0 -0.2 2.7<br />
Fiji 107 53 30 22 16 2.9 2.8 2.8 2.8 45 26 0.6 1.3 4.5 3.4 2.6 1.5 1.2<br />
Finland 184 16 7 4 3 4.4 4.4 3.6 4.0 57 33 2.9 2.5 1.9 1.7 1.9 0.3 -0.3<br />
France 169 18 9 5 4 3.6 4.9 2.5 3.6 53 24 2.1 1.2 2.5 1.8 2.0 1.8 -0.6<br />
Gabon 44 – 94 82 66 – 1.4 2.1 1.7 31 20 0.2 -0.7 4.7 5.2 3.2 -0.5 2.3<br />
136<br />
THE STATE OF THE WORLD’S CHILDREN <strong>2013</strong>: <strong>Children</strong> with Disabilities
TABLE 10<br />
THE RATE OF pROGRESS<br />
Countries<br />
and areas<br />
Under-5<br />
mortality<br />
rank<br />
Under-5 mortality rate<br />
Annual rate <strong>of</strong> reduction (%)u<br />
Under-5 mortality rate<br />
Reduction<br />
since 1990<br />
Reduction<br />
since 2000<br />
GDP per capita<br />
average annual<br />
growth rate (%) Total fertility rate<br />
Average annual rate<br />
<strong>of</strong> reduction (%)<br />
Total fertility rate<br />
1970 1990 2000 2011 1970–1990 1990–2000 2000–2011 1990–2011 (%)u (%)u 1970–1990 1990–2011 1970 1990 2011 1970–1990 1990–2011<br />
Gambia 23 286 165 130 101 2.8 2.3 2.4 2.3 39 23 0.6 0.9 6.1 6.1 4.8 0.0 1.1<br />
Georgia 91 – 47 33 21 – 3.6 4.2 3.9 56 37 3.1 2.7 2.6 2.2 1.5 0.9 1.6<br />
Germany 169 26 9 5 4 5.6 4.5 2.7 3.6 53 26 2.3 1.3 2.0 1.4 1.4 1.9 -0.2<br />
Ghana 34 183 121 99 78 2.1 2.0 2.2 2.1 36 21 -2.0 2.5 7.0 5.6 4.1 1.1 1.5<br />
Greece 169 38 13 8 4 5.5 5.0 5.1 5.0 65 43 1.3 2.2 2.4 1.4 1.5 2.5 -0.3<br />
Grenada 125 – 21 16 13 – 2.9 1.9 2.4 39 18 4.2 x 2.9 4.6 3.8 2.2 0.9 2.6<br />
Guatemala 74 172 78 48 30 4.0 4.8 4.2 4.5 61 37 0.2 1.3 6.2 5.6 3.9 0.6 1.7<br />
Guinea 12 316 228 175 126 1.6 2.7 3.0 2.8 45 28 – 2.9 6.8 6.7 5.2 0.1 1.3<br />
Guinea-Bissau 7 242 210 186 161 0.7 1.2 1.3 1.3 24 14 0.0 -1.2 6.1 6.6 5.0 -0.5 1.4<br />
Guyana 68 78 63 49 36 1.0 2.5 2.8 2.7 43 27 -1.3 2.8 x 5.6 2.6 2.2 3.8 0.7<br />
Haiti 40 229 143 102 70 2.3 3.4 3.4 3.4 51 31 – -1.0 x 5.8 5.4 3.3 0.3 2.4<br />
Holy See – – – – – – – – – – – – – – – – – –<br />
Honduras 91 156 55 35 21 5.2 4.5 4.5 4.5 61 39 0.8 1.6 7.3 5.1 3.1 1.7 2.4<br />
Hungary 157 43 19 11 6 4.2 5.3 5.1 5.2 66 43 3.0 2.5 2.0 1.8 1.4 0.6 1.2<br />
Iceland 184 16 6 4 3 4.6 4.8 4.0 4.4 60 36 3.2 2.1 3.0 2.2 2.1 1.6 0.1<br />
India 49 189 114 88 61 2.5 2.6 3.3 3.0 46 30 2.0 4.9 5.5 3.9 2.6 1.7 2.0<br />
Indonesia 71 164 82 53 32 3.5 4.4 4.6 4.5 61 39 4.6 2.7 5.5 3.1 2.1 2.8 1.9<br />
Iran (Islamic Republic <strong>of</strong>) 83 203 61 44 25 6.0 3.3 5.1 4.3 59 43 -2.3 2.7 x 6.5 4.8 1.6 1.5 5.1<br />
Iraq 67 115 46 43 38 4.6 0.7 1.1 0.9 18 11 – -1.9 x 7.4 6.0 4.6 1.0 1.2<br />
Ireland 169 23 9 7 4 4.6 2.5 5.1 3.9 56 43 – 0.6 x 3.8 2.0 2.1 3.2 -0.3<br />
Israel 169 – 12 7 4 – 5.1 4.3 4.7 63 38 1.9 1.8 3.8 3.0 2.9 1.2 0.1<br />
Italy 169 33 10 6 4 6.1 5.5 3.8 4.6 62 34 2.8 0.8 2.5 1.3 1.4 3.2 -0.5<br />
Jamaica 102 63 35 26 18 3.0 3.0 3.0 3.0 47 28 -1.3 0.5 5.5 2.9 2.3 3.1 1.2<br />
Japan 184 18 6 5 3 5.1 3.5 2.5 3.0 47 24 3.4 0.7 2.1 1.6 1.4 1.5 0.6<br />
Jordan 91 97 37 28 21 4.8 2.7 2.7 2.7 44 26 2.5 x 2.6 7.9 5.8 3.0 1.6 3.1<br />
Kazakhstan 78 79 57 42 28 1.7 3.0 3.7 3.3 50 33 – 4.1 3.5 2.8 2.5 1.1 0.5<br />
Kenya 38 153 98 113 73 2.2 -1.5 4.0 1.4 26 36 1.2 0.4 8.1 6.0 4.7 1.5 1.2<br />
Kiribati 58 154 88 65 47 2.8 2.9 2.9 2.9 46 27 -5.3 1.1 – – – – –<br />
Kuwait 133 60 17 13 11 6.4 2.9 1.4 2.1 36 14 -6.7 x 1.4 x 7.2 2.6 2.3 5.1 0.6<br />
Kyrgyzstan 72 143 70 47 31 3.6 3.9 4.0 4.0 56 35 – 0.7 4.9 3.9 2.7 1.2 1.8<br />
Lao People’s<br />
Democratic Republic 63 – 148 81 42 – 6.0 6.0 6.0 72 48 – 4.7 6.0 6.2 2.7 -0.1 4.0<br />
Latvia 145 – 21 17 8 – 1.7 6.7 4.3 60 52 3.4 4.4 1.9 1.9 1.5 0.0 1.2<br />
Lebanon 141 57 33 19 9 2.7 5.6 6.5 6.0 72 51 – 2.5 5.1 3.1 1.8 2.4 2.7<br />
Lesotho 29 177 88 117 86 3.5 -2.9 2.8 0.1 2 27 2.4 2.3 5.8 4.9 3.1 0.8 2.1<br />
Liberia 34 280 241 164 78 0.7 3.9 6.7 5.4 68 52 -4.0 5.5 6.7 6.5 5.2 0.1 1.1<br />
Libya 107 139 44 27 16 5.7 4.9 4.7 4.8 63 40 – – 7.6 4.8 2.5 2.3 3.1<br />
Liechtenstein – – – – – – – – – – – 2.2 3.0 x – – – – –<br />
Lithuania 157 26 17 12 6 2.0 3.9 6.6 5.3 67 52 – 3.6 2.3 2.0 1.5 0.7 1.4<br />
Luxembourg 184 22 8 5 3 4.7 5.4 3.9 4.6 62 35 2.6 2.7 2.0 1.6 1.7 1.1 -0.3<br />
Madagascar 47 176 161 104 62 0.4 4.4 4.8 4.6 62 41 -2.3 -0.3 7.3 6.3 4.6 0.8 1.5<br />
Malawi 31 334 227 164 83 1.9 3.2 6.2 4.8 64 50 0.0 1.3 7.3 6.8 6.0 0.4 0.6<br />
Malaysia 151 54 17 11 7 5.8 4.8 4.4 4.6 62 39 4.0 3.1 4.9 3.5 2.6 1.6 1.4<br />
Maldives 133 266 105 53 11 4.6 6.9 14.5 10.9 90 80 – 5.8 x 7.2 6.1 1.7 0.8 6.1<br />
Mali 3 373 257 214 176 1.9 1.8 1.8 1.8 32 18 0.1 2.1 6.9 7.1 6.2 -0.1 0.6<br />
Malta 157 27 11 8 6 4.4 3.7 2.5 3.1 48 24 6.0 2.4 2.0 2.1 1.3 -0.2 2.2<br />
Marshall Islands 80 98 52 38 26 3.2 3.2 3.3 3.3 50 30 – 0.5 – – – – –<br />
Mauritania 18 197 125 118 112 2.3 0.6 0.5 0.5 10 5 -1.1 1.3 6.8 5.9 4.5 0.7 1.4<br />
Mauritius 115 85 24 19 15 6.3 2.5 1.9 2.2 37 19 3.2 x 3.5 4.0 2.3 1.6 2.7 1.7<br />
Mexico 107 108 49 29 16 4.0 5.2 5.6 5.4 68 46 1.7 1.3 6.7 3.4 2.3 3.4 1.9<br />
Micronesia<br />
(Federated <strong>State</strong>s <strong>of</strong>) 63 – 56 49 42 – 1.5 1.4 1.5 26 15 – 0.4 6.9 5.0 3.4 1.7 1.8<br />
Monaco 169 – 8 5 4 – 4.2 2.4 3.3 50 24 1.4 2.1 x – – – – –<br />
Mongolia 72 – 107 63 31 – 5.2 6.6 5.9 71 52 – 3.3 7.6 4.1 2.5 3.1 2.4<br />
Montenegro 151 – 18 13 7 – 3.3 5.1 4.3 59 43 – 3.4 x 2.4 1.9 1.6 1.2 0.6<br />
Morocco 69 177 81 53 33 3.9 4.3 4.3 4.3 60 38 1.9 2.5 7.1 4.0 2.2 2.8 2.8<br />
Mozambique 22 275 226 172 103 1.0 2.7 4.7 3.7 54 40 -1.0 x 4.3 6.6 6.2 4.8 0.3 1.2<br />
Myanmar 47 172 107 84 62 2.4 2.5 2.6 2.6 42 25 1.6 7.4 x 6.1 3.4 2.0 2.8 2.6<br />
Namibia 63 113 73 74 42 2.2 -0.1 5.2 2.7 43 44 -2.1 x 1.9 6.5 5.2 3.2 1.1 2.4<br />
Nauru 66 – 40 40 40 – 0.0 0.0 0.0 0 0 – – – – – – –<br />
Nepal 57 249 135 83 48 3.1 4.8 5.0 4.9 64 42 1.1 1.9 6.1 5.2 2.7 0.8 3.2<br />
Ne<strong>the</strong>rlands 169 16 8 6 4 3.2 2.9 4.0 3.5 52 35 1.6 1.9 2.4 1.6 1.8 2.2 -0.6<br />
New Zealand 157 21 11 7 6 3.1 4.1 2.1 3.0 47 20 1.1 x 1.8 x 3.1 2.1 2.2 2.0 -0.2<br />
Nicaragua 80 161 66 42 26 4.5 4.5 4.6 4.5 61 39 -3.7 1.9 6.9 4.8 2.6 1.9 2.9<br />
Niger 13 324 314 216 125 0.2 3.8 5.0 4.4 60 42 -2.0 -0.2 7.4 7.8 7.0 -0.3 0.5<br />
Nigeria 14 259 214 188 124 1.0 1.3 3.8 2.6 42 34 -1.3 2.1 6.5 6.4 5.5 0.1 0.7<br />
STATISTICAL TABLES 137
TABLE 10<br />
THE RATE OF pROGRESS<br />
Countries<br />
and areas<br />
Under-5<br />
mortality<br />
rank<br />
Under-5 mortality rate<br />
Annual rate <strong>of</strong> reduction (%)u<br />
Under-5 mortality rate<br />
Reduction<br />
since 1990<br />
Reduction<br />
since 2000<br />
GDP per capita<br />
average annual<br />
growth rate (%) Total fertility rate<br />
Average annual rate<br />
<strong>of</strong> reduction (%)<br />
Total fertility rate<br />
1970 1990 2000 2011 1970–1990 1990–2000 2000–2011 1990–2011 (%)u (%)u 1970–1990 1990–2011 1970 1990 2011 1970–1990 1990–2011<br />
Niue 91 – 14 29 21 – -7.3 3.0 -1.9 -49 28 – – – – – – –<br />
Norway 184 16 8 5 3 3.3 5.4 4.2 4.7 63 37 3.2 2.0 2.5 1.9 1.9 1.5 -0.2<br />
Oman 141 195 48 22 9 7.1 7.8 8.3 8.1 82 60 3.1 2.7 7.3 7.2 2.2 0.1 5.5<br />
Pakistan 39 182 122 95 72 2.0 2.5 2.5 2.5 41 24 2.6 1.9 6.6 6.0 3.3 0.5 2.8<br />
Palau 100 – 32 25 19 – 2.6 2.6 2.6 42 25 – -0.1 x – – – – –<br />
Panama 98 62 33 26 20 3.1 2.6 2.5 2.5 41 24 0.3 3.4 5.3 3.0 2.5 2.8 1.0<br />
Papua New Guinea 50 151 88 72 58 2.7 2.0 2.0 2.0 34 19 -1.0 0.1 6.2 4.8 3.9 1.2 1.0<br />
Paraguay 87 75 53 35 22 1.7 4.0 4.1 4.1 57 37 3.1 0.3 5.7 4.5 2.9 1.2 2.1<br />
Peru 102 158 75 39 18 3.7 6.6 7.0 6.8 76 53 -0.6 3.2 6.3 3.8 2.5 2.5 2.1<br />
Philippines 83 88 57 39 25 2.2 3.8 3.9 3.8 55 35 0.5 1.9 6.3 4.3 3.1 1.9 1.6<br />
Poland 157 36 17 10 6 3.6 5.9 4.6 5.2 66 40 – 4.4 2.2 2.0 1.4 0.4 1.8<br />
Portugal 184 66 15 7 3 7.5 7.1 6.8 6.9 77 53 2.5 1.5 3.0 1.5 1.3 3.3 0.7<br />
Qatar 145 57 20 13 8 5.2 4.7 4.5 4.6 62 39 – 0.8 x 6.9 4.2 2.2 2.5 3.0<br />
Republic <strong>of</strong> Korea 165 49 8 6 5 9.4 2.7 1.6 2.1 36 16 6.2 4.1 4.5 1.6 1.4 5.2 0.8<br />
Republic <strong>of</strong> Moldova 107 70 35 24 16 3.5 3.8 3.6 3.7 54 33 1.8 x -0.1 2.6 2.4 1.5 0.3 2.4<br />
Romania 125 64 37 27 13 2.7 3.3 6.9 5.2 67 53 0.9 x 2.8 2.9 1.9 1.4 2.1 1.5<br />
Russian Federation 128 40 27 21 12 2.0 2.5 5.3 4.0 56 44 – 2.3 2.0 1.9 1.5 0.3 1.0<br />
Rwanda 51 223 156 183 54 1.8 -1.6 11.1 5.1 65 70 1.2 2.3 8.1 7.0 5.3 0.7 1.3<br />
Saint Kitts and Nevis 151 71 28 16 7 4.6 5.5 7.2 6.4 74 55 6.3 x 1.6 – – – – –<br />
Saint Lucia 107 63 23 18 16 5.2 2.2 1.4 1.7 31 14 5.3 x 0.7 6.1 3.4 2.0 2.9 2.6<br />
Saint Vincent<br />
and <strong>the</strong> Grenadines 91 96 27 22 21 6.5 1.9 0.4 1.1 21 5 3.3 3.2 6.0 3.0 2.0 3.6 1.8<br />
Samoa 100 – 30 23 19 – 2.6 1.8 2.2 37 18 – 2.8 6.1 4.8 3.8 1.2 1.1<br />
San Marino 195 – 12 5 2 – 8.1 9.8 9.0 85 66 1.7 3.2 x – – – – –<br />
Sao Tome and Principe 28 96 96 93 89 -0.0 0.4 0.4 0.4 8 4 – – 6.5 5.4 3.6 0.9 1.9<br />
Saudi Arabia 141 – 43 21 9 – 7.3 7.3 7.3 78 55 -1.4 0.2 7.3 5.8 2.7 1.1 3.6<br />
Senegal 45 295 136 130 65 3.9 0.4 6.4 3.5 52 50 -0.5 1.1 7.4 6.6 4.7 0.5 1.6<br />
Serbia 151 – 29 13 7 – 8.1 5.3 6.6 75 44 – 1.4 2.4 2.1 1.6 0.6 1.4<br />
Seychelles 122 66 17 14 14 6.9 1.8 0.0 0.9 17 0 2.9 2.0 – – – – –<br />
Sierra Leone 1 342 267 241 185 1.2 1.0 2.4 1.7 31 23 -0.5 1.1 5.9 5.7 4.9 0.1 0.7<br />
Singapore 184 27 8 4 3 6.4 6.5 3.7 5.0 65 33 5.9 3.5 3.2 1.8 1.3 2.9 1.5<br />
Slovakia 145 – 18 12 8 – 4.2 3.7 3.9 56 34 – 3.7 2.5 2.0 1.3 1.0 2.0<br />
Slovenia 184 – 10 5 3 – 6.6 6.0 6.2 73 48 – 3.2 2.3 1.5 1.5 2.0 0.1<br />
Solomon Islands 87 102 42 31 22 4.5 3.2 3.1 3.1 48 29 – -0.9 6.9 5.9 4.2 0.8 1.6<br />
Somalia 2 – 180 180 180 – 0.0 0.0 0.0 0 0 -0.8 – 7.2 6.6 6.3 0.4 0.2<br />
South Africa 58 – 62 74 47 – -1.7 4.2 1.4 25 37 0.1 1.3 5.6 3.7 2.4 2.1 2.0<br />
South Sudan s 15 302 217 165 121 1.6 2.8 2.8 2.8 45 27 – – – – – – –<br />
Spain 169 29 11 7 4 4.9 5.0 4.1 4.5 61 36 1.9 1.9 2.9 1.3 1.5 3.8 -0.5<br />
Sri Lanka 128 76 29 19 12 4.8 4.1 4.1 4.1 58 36 3.0 4.1 4.3 2.5 2.3 2.8 0.4<br />
<strong>State</strong> <strong>of</strong> Palestine 87 – 43 30 22 – 3.6 2.8 3.2 49 27 – -2.4 x 7.9 6.5 4.4 0.9 1.9<br />
Sudan s 29 148 123 104 86 0.9 1.7 1.7 1.7 30 17 – – – – – – –<br />
Suriname 74 – 52 40 30 – 2.6 2.7 2.7 43 26 -2.2 x 1.7 x 5.7 2.7 2.3 3.6 0.8<br />
Swaziland 21 181 83 114 104 3.9 -3.2 0.9 -1.0 -24 9 3.1 1.8 6.9 5.7 3.3 0.9 2.7<br />
Sweden 184 13 7 4 3 3.4 4.9 3.5 4.2 58 32 1.8 2.2 2.0 2.0 1.9 0.1 0.2<br />
Switzerland 169 18 8 6 4 4.1 3.5 2.4 2.9 46 23 1.7 x 0.9 2.1 1.5 1.5 1.6 0.1<br />
Syrian Arab Republic 115 113 36 23 15 5.7 4.6 3.6 4.1 58 33 2.2 1.8 x 7.6 5.3 2.9 1.8 3.0<br />
Tajikistan 46 – 114 95 63 – 1.9 3.7 2.8 45 33 – 0.2 6.9 5.2 3.2 1.4 2.2<br />
Thailand 128 102 35 19 12 5.3 6.4 3.7 5.0 65 34 4.7 2.8 5.6 2.1 1.6 4.9 1.4<br />
The former Yugoslav<br />
Republic <strong>of</strong> Macedonia 135 – 38 16 10 – 8.4 4.8 6.5 74 41 – 1.2 3.1 2.1 1.4 1.9 1.9<br />
Timor-Leste 51 – 180 109 54 – 5.0 6.4 5.7 70 51 – 1.9 x 5.9 5.3 6.1 0.5 -0.6<br />
Togo 19 220 147 128 110 2.0 1.4 1.4 1.4 25 14 -0.3 -0.1 7.1 6.3 4.0 0.6 2.2<br />
Tonga 115 43 25 20 15 2.9 2.2 2.2 2.2 37 21 – 1.5 5.9 4.6 3.9 1.2 0.9<br />
Trinidad and Tobago 78 52 37 32 28 1.7 1.4 1.3 1.4 25 14 0.5 4.8 3.5 2.4 1.6 1.8 1.9<br />
Tunisia 107 181 51 30 16 6.3 5.5 5.5 5.5 68 45 2.5 3.3 6.6 3.6 2.0 3.0 2.9<br />
Turkey 115 194 72 35 15 5.0 7.1 7.7 7.4 79 57 2.0 2.4 5.5 3.0 2.1 3.0 1.9<br />
Turkmenistan 54 – 94 71 53 – 2.8 2.8 2.8 44 26 – 5.8 6.3 4.3 2.4 1.9 2.9<br />
Tuvalu 74 – 58 43 30 – 2.9 3.3 3.1 48 30 – 2.1 – – – – –<br />
Uganda 26 190 178 141 90 0.3 2.4 4.1 3.3 49 36 – 3.7 7.1 7.1 6.1 0.0 0.8<br />
Ukraine 135 34 19 19 10 2.8 0.4 5.6 3.1 48 46 – 0.6 2.1 1.9 1.5 0.6 1.2<br />
United Arab Emirates 151 92 22 12 7 7.1 5.9 5.7 5.8 70 46 -4.3 x -1.9 6.6 4.4 1.7 2.0 4.5<br />
United Kingdom 165 21 9 7 5 4.1 3.3 2.3 2.8 45 23 2.1 2.4 2.3 1.8 1.9 1.2 -0.1<br />
United Republic<br />
<strong>of</strong> Tanzania 41 208 158 126 68 1.4 2.2 5.7 4.0 57 47 – 2.5 6.8 6.2 5.5 0.4 0.6<br />
United <strong>State</strong>s 145 23 11 9 8 3.6 2.8 1.1 2.0 34 12 2.1 1.7 2.2 1.9 2.1 0.7 -0.3<br />
138<br />
THE STATE OF THE WORLD’S CHILDREN <strong>2013</strong>: <strong>Children</strong> with Disabilities
TABLE 10<br />
THE RATE OF pROGRESS<br />
Countries<br />
and areas<br />
Under-5<br />
mortality<br />
rank<br />
Under-5 mortality rate<br />
Annual rate <strong>of</strong> reduction (%)u<br />
Under-5 mortality rate<br />
Reduction<br />
since 1990<br />
Reduction<br />
since 2000<br />
GDP per capita<br />
average annual<br />
growth rate (%) Total fertility rate<br />
Average annual rate<br />
<strong>of</strong> reduction (%)<br />
Total fertility rate<br />
1970 1990 2000 2011 1970–1990 1990–2000 2000–2011 1990–2011 (%)u (%)u 1970–1990 1990–2011 1970 1990 2011 1970–1990 1990–2011<br />
Uruguay 135 55 23 17 10 4.3 3.0 4.6 3.8 55 40 0.9 2.1 2.9 2.5 2.1 0.7 0.9<br />
Uzbekistan 56 – 75 61 49 – 2.1 2.1 2.1 35 20 – 2.5 6.5 4.2 2.3 2.2 2.8<br />
Vanuatu 125 102 39 23 13 4.9 5.2 5.0 5.1 66 43 1.2 x 0.6 6.3 4.9 3.8 1.2 1.2<br />
Venezuela<br />
(Bolivarian Republic <strong>of</strong>) 115 61 31 22 15 3.4 3.3 3.6 3.4 51 33 -1.7 0.4 5.4 3.4 2.4 2.2 1.7<br />
Viet Nam 87 – 50 34 22 – 3.9 4.1 4.0 57 36 – 6.0 7.4 3.6 1.8 3.6 3.3<br />
Yemen 36 293 126 99 77 4.2 2.4 2.4 2.4 39 23 – 1.1 7.5 8.7 5.1 -0.7 2.5<br />
Zambia 31 179 193 154 83 -0.4 2.3 5.6 4.0 57 46 -2.3 0.8 7.4 6.5 6.3 0.7 0.1<br />
Zimbabwe 43 119 79 106 67 2.0 -2.9 4.1 0.8 15 37 -0.4 -3.0 7.4 5.2 3.2 1.8 2.3<br />
MEMORANDUM<br />
Sudan and South Sudan s – – – – – – – – – – – 0.1 3.4 6.6 6.0 4.3 0.5 1.5<br />
SUMMARY INDICATORS#<br />
Sub-Saharan Africa 236 178 154 109 1.4 1.5 3.1 2.3 39 29 0.0 2.0 6.7 6.2 4.9 0.3 1.2<br />
Eastern and<br />
Sou<strong>the</strong>rn Africa 214 162 135 84 1.4 1.8 4.3 3.1 48 38 0.3 1.9 6.8 6.0 4.5 0.6 1.4<br />
West and Central Africa 259 197 175 132 1.4 1.2 2.6 1.9 33 24 -0.5 2.0 6.6 6.5 5.3 0.1 1.0<br />
Middle East and<br />
North Africa 190 72 52 36 4.8 3.4 3.3 3.3 50 30 -0.1 0.8 6.7 5.0 2.8 1.5 2.8<br />
South Asia 195 119 89 62 2.5 2.9 3.3 3.1 48 30 2.0 4.5 5.7 4.2 2.7 1.6 2.1<br />
East Asia and Pacific 120 55 39 20 3.9 3.4 5.9 4.7 63 48 5.6 7.5 5.6 2.6 1.8 3.8 1.8<br />
Latin America<br />
and Caribbean 117 53 34 19 4.0 4.4 5.2 4.8 64 44 1.4 1.7 5.3 3.2 2.2 2.5 1.8<br />
CEE/CIS 88 48 35 21 3.1 3.2 4.6 3.9 56 40 – 2.5 2.8 2.3 1.8 0.9 1.3<br />
Least developed countries 238 171 136 98 1.7 2.3 3.0 2.7 43 28 -0.1 3.1 6.7 5.9 4.2 0.6 1.7<br />
World 141 87 73 51 2.4 1.8 3.2 2.5 41 29 2.4 2.6 4.7 3.2 2.4 1.9 1.3<br />
s Due to <strong>the</strong> cession in July 2011 <strong>of</strong> <strong>the</strong> Republic <strong>of</strong> South Sudan by <strong>the</strong> Republic <strong>of</strong> <strong>the</strong> Sudan, and its subsequent admission to <strong>the</strong> United Nations on 14 July 2011, disaggregated data for <strong>the</strong> Sudan<br />
and South Sudan as separate <strong>State</strong>s are not yet available for all indicators. Aggregated data presented are for <strong>the</strong> Sudan pre-cession (see Memorandum item).<br />
# For a complete list <strong>of</strong> countries and areas in <strong>the</strong> regions, subregions and country categories, see page 98.<br />
DEFINITIONS OF THE INDICATORS<br />
Under-5 mortality rate – Probability <strong>of</strong> dying between birth and exactly 5 years <strong>of</strong> age,<br />
expressed per 1,000 live births.<br />
Reduction since 1990 – Percentage reduction in <strong>the</strong> under-five mortality rate (U5MR) from<br />
1990 to 2011. The United Nations Millennium Declaration in 2000 established a goal <strong>of</strong> a<br />
two-thirds (67 per cent) reduction in U5MR from 1990 to 2015. This indicator provides a<br />
current assessment <strong>of</strong> progress towards this goal.<br />
GDP per capita – Gross domestic product (GDP) is <strong>the</strong> sum <strong>of</strong> value added by all resident<br />
producers plus any product taxes (less subsidies) not included in <strong>the</strong> valuation <strong>of</strong> output. GDP per<br />
capita is GDP divided by midyear population. Growth is calculated from constant price GDP data<br />
in local currency.<br />
Total fertility rate – Number <strong>of</strong> children who would be born per woman if she lived to <strong>the</strong><br />
end <strong>of</strong> her childbearing years and bore children at each age in accordance with prevailing agespecific<br />
fertility rates.<br />
MAIN DATA SOURCES<br />
Under-5 mortality rate – United Nations Inter-agency Group for Child Mortality Estimation<br />
(UNICEF, World Health Organization, United Nations Population Division and <strong>the</strong> World Bank).<br />
GDP per capita – The World Bank.<br />
Total fertility rate – United Nations Population Division.<br />
NOTES<br />
− Data not available.<br />
u A negative value indicates an increase in <strong>the</strong> under-five mortality rate.<br />
x Data refer to years or periods o<strong>the</strong>r than those specified in <strong>the</strong> column heading. Such data<br />
are not included in <strong>the</strong> calculation <strong>of</strong> regional and global averages.<br />
STATISTICAL TABLES 139
TABLE 11: AdOLESCENTS<br />
Countries<br />
and areas<br />
Population aged 10–19<br />
Total<br />
(thousands)<br />
2011<br />
Justification <strong>of</strong> wife Use <strong>of</strong> mass<br />
Lower<br />
secondary<br />
Upper<br />
secondary<br />
Comprehensive<br />
knowledge <strong>of</strong><br />
Proportion <strong>of</strong> Adolescents currently<br />
beating among media among school gross school gross HIV among<br />
total population<br />
(%)<br />
married/in union (%)<br />
2002–2011*<br />
Births by<br />
age 18 (%)<br />
Adolescent<br />
birth rate<br />
adolescents (%)<br />
2002–2011*<br />
adolescents (%)<br />
2002–2011*<br />
enrolment<br />
ratio<br />
enrolment<br />
ratio<br />
adolescents (%)<br />
2007–2011*<br />
2011 male female 2007–2011* 2006–2010* male female male female 2008–2011* 2008–2011* male female<br />
Afghanistan 8,015 25 – 20 26 90 – 84 – – 62 27 – –<br />
Albania 551 17 1 8 3 11 37 24 97 99 95 81 21 36<br />
Algeria 6,425 18 – 2 – 4 – 66 – – 133 50 – 12 x<br />
Andorra – – – – – 5 – – – – 88 84 – –<br />
Angola 4,720 24 – – – 165 x – – – – 39 22 – –<br />
Antigua and Barbuda – – – – – 67 x – – – – 122 80 55 40<br />
Argentina 6,769 17 – – – 68 – – – – 109 68 – –<br />
Armenia 435 14 1 8 2 28 21 8 94 92 96 85 4 10<br />
Australia 2,917 13 – – – 16 – – – – 113 167 – –<br />
Austria 929 11 – – – 10 – – – – 102 96 – –<br />
Azerbaijan 1,378 15 0 10 4 x 41 63 39 97 95 92 75 2 x 3 x<br />
Bahamas 58 17 – – – 41 – – – – 101 90 – –<br />
Bahrain 153 11 – – – 12 – – – – – – – –<br />
Bangladesh 31,601 21 – 46 40 133 x – 41 – 63 y 66 40 – 7<br />
Barbados 38 14 – – – 50 – – – – 99 103 – –<br />
Belarus 1,025 11 – 4 3 x 21 – – – – – – – –<br />
Belgium 1,207 11 – – – 11 – – – – 114 109 – –<br />
Belize 73 23 – 15 19 x 90 x – 11 – – – – – 39 x<br />
Benin 2,094 23 2 22 23 x 114 x 12 41 83 64 – – 31 x 17 x<br />
Bhutan 148 20 – 15 15 59 – 70 – – 78 42 – 22<br />
Bolivia (Plurinational <strong>State</strong> <strong>of</strong>) 2,232 22 4 13 20 89 x – 17 100 97 94 73 24 22<br />
Bosnia and Herzegovina 434 12 – 7 – 17 – 4 – – 99 84 – 45 x<br />
Botswana 434 21 – – – 51 – – – – 91 68 – –<br />
Brazil 33,906 17 – 25 – 71 – – – – – – – –<br />
Brunei Darussalam 65 16 – – – 18 – – – – – – – –<br />
Bulgaria 696 9 – – – 48 – – – – 83 94 – –<br />
Burkina Faso 3,978 23 2 32 28 130 40 39 61 55 28 9 31 29<br />
Burundi 1,946 23 1 9 11 65 56 74 83 69 34 13 45 43<br />
Cambodia 3,222 23 2 10 7 48 25 y 42 y 73 76 60 – 41 43<br />
Cameroon 4,481 22 – 22 33 x 127 – 58 77 61 – – – 32 x<br />
Canada 4,137 12 – – – 14 – – – – 99 102 – –<br />
Cape Verde 113 23 2 8 22 x 92 x 24 23 88 88 109 67 – –<br />
Central African Republic 1,030 23 11 55 45 133 x 87 y 79 – – – – 26 x 16 x<br />
Chad 2,690 23 – 48 47 193 x – 59 55 24 29 18 – 10<br />
Chile 2,769 16 – – – 54 – – – – 100 82 – –<br />
China 195,432 15 – – – 6 – – – – 92 71 – –<br />
Colombia 8,759 19 – 14 20 85 – – – – 105 80 – 21<br />
Comoros 161 21 – – – 95 x – – – – – – – –<br />
Congo 909 22 2 19 29 x 132 x – 76 75 63 – – 18 8<br />
Cook Islands – – – – – 47 x – – – – 97 67 – –<br />
Costa Rica 832 18 3 11 9 67 – – – – 116 75 – –<br />
Côte d’Ivoire 4,653 23 2 20 29 x 111 – 63 86 75 – – – –<br />
Croatia 490 11 – – – 13 – – – – 105 87 – –<br />
Cuba 1,454 13 – 20 9 51 – – – – 94 85 – 54<br />
Cyprus 153 14 – – – 4 – – – – 102 96 – –<br />
Czech Republic 1,069 10 – – – 11 – – – – 93 88 – –<br />
Democratic People’s<br />
Republic <strong>of</strong> Korea 4,103 17 – – – 1 – – – – – – – 7<br />
Democratic Republic<br />
<strong>of</strong> <strong>the</strong> Congo 16,323 24 – 25 25 135 – 72 55 43 48 32 – 13<br />
Denmark 701 13 – – – 6 – – – – 116 119 – –<br />
Djibouti 202 22 – 4 – 27 x – – – – 44 25 – 16 x<br />
Dominica – – – – – 48 – – – – 108 84 – –<br />
Dominican Republic 1,967 20 – 17 25 98 x – 7 98 98 90 70 33 39<br />
Ecuador 2,843 19 – 16 – 100 x – – – – 85 65 – –<br />
Egypt 15,964 19 – 13 7 50 x – 50 y – 97 y 94 51 16 3<br />
El Salvador 1,440 23 – 21 – 65 – – – – 86 44 – –<br />
Equatorial Guinea 154 21 – – – 128 x – – – – – – – –<br />
Eritrea 1,171 22 – 29 25 x – – 70 – 85 44 22 – –<br />
Estonia 133 10 – – – 21 – – – – 105 103 – –<br />
Ethiopia 20,948 25 2 19 22 79 51 64 42 38 45 16 32 24<br />
Fiji 159 18 – – – 31 x – – – – 100 69 – –<br />
Finland 627 12 – – – 8 – – – – 99 115 – –<br />
France 7,482 12 – – – 12 – – – – 110 117 – –<br />
140<br />
THE STATE OF THE WORLD’S CHILDREN <strong>2013</strong>: <strong>Children</strong> with Disabilities
TABLE 11<br />
AdOLESCENTS<br />
Countries<br />
and areas<br />
Justification <strong>of</strong> wife Use <strong>of</strong> mass<br />
Lower<br />
secondary<br />
Upper<br />
secondary<br />
Comprehensive<br />
knowledge <strong>of</strong><br />
Proportion <strong>of</strong> Adolescents currently<br />
beating among media among school gross school gross HIV among<br />
total population<br />
(%)<br />
married/in union (%)<br />
2002–2011*<br />
Births by<br />
age 18 (%)<br />
Adolescent<br />
birth rate<br />
adolescents (%)<br />
2002–2011*<br />
adolescents (%)<br />
2002–2011*<br />
enrolment<br />
ratio<br />
enrolment<br />
ratio<br />
adolescents (%)<br />
2007–2011*<br />
2011 male female 2007–2011* 2006–2010* male female male female 2008–2011* 2008–2011* male female<br />
Population aged 10–19<br />
Total<br />
(thousands)<br />
2011<br />
Gabon 346 23 2 x 18 x 35 x – – – 89 x 83 x – – – –<br />
Gambia 421 24 – 24 23 104 x – 74 – – 63 45 – 33<br />
Georgia 541 13 – 11 6 44 – 5 – – 93 81 – –<br />
Germany 8,059 10 – – – 9 – – – – 101 107 – –<br />
Ghana 5,412 22 1 7 16 70 37 53 90 85 83 39 30 28<br />
Greece 1,087 10 – – – 12 – – – – – – – –<br />
Grenada 20 20 – – – 53 x – – – – 121 89 – –<br />
Guatemala 3,467 23 – 20 22 92 – – – – 65 48 24 20<br />
Guinea 2,334 23 3 36 44 x 153 x – 79 66 55 46 26 – –<br />
Guinea–Bissau 349 23 – 19 31 x 137 – 39 y – – – – – 12<br />
Guyana 181 24 1 16 16 97 25 18 94 94 99 78 45 53<br />
Haiti 2,270 22 2 17 15 x 69 x – 29 88 83 – – 34 x 31 x<br />
Holy See – – – – – – – – – – – – – –<br />
Honduras 1,777 23 – 20 26 x 108 x – 18 – 98 75 71 – 28 x<br />
Hungary 1,072 11 – – – 19 – – – – 99 98 – –<br />
Iceland 45 14 – – – 15 – – – – 97 115 – –<br />
India 243,492 20 5 30 22 x 39 57 53 88 72 81 50 35 x 19 x<br />
Indonesia 42,771 18 – 14 10 52 x – 41 y – 79 y 92 63 2 y 6<br />
Iran (Islamic Republic <strong>of</strong>) 12,015 16 – 16 – 31 – – – – 98 87 – –<br />
Iraq 7,490 23 – 19 – 68 – 57 – – – – – 3 x<br />
Ireland 567 13 – – – 16 – – – – 110 138 – –<br />
Israel 1,206 16 – – – 14 – – – – 94 110 – –<br />
Italy 5,742 9 – – – 7 – – – – 107 97 – –<br />
Jamaica 562 21 – 5 16 72 28 y 4 y – – 91 95 52 y 61 y<br />
Japan 11,799 9 – – – 5 – – – – 103 102 – –<br />
Jordan 1,418 23 – 7 4 32 – 91 y – 97 y 94 73 – 12<br />
Kazakhstan 2,402 15 1 5 3 x 31 14 9 99 99 105 80 – 22 x<br />
Kenya 9,322 22 0 12 26 106 54 57 91 81 91 44 52 42<br />
Kiribati – – 5 16 9 39 x 65 77 58 57 99 72 46 41<br />
Kuwait 394 14 – – – 14 – – – – 110 89 – –<br />
Kyrgyzstan 1,082 20 – 8 2 x 31 – 28 – – 94 62 – 19 x<br />
Lao People’s<br />
Democratic Republic 1,509 24 – – 55 x 110 x – 79 – – 55 32 – –<br />
Latvia 216 10 – – – 15 – – – – 95 96 – –<br />
Lebanon 772 18 – 3 – 18 x – 22 y – – 90 73 – –<br />
Lesotho 531 24 1 16 13 92 54 48 64 69 58 29 28 35<br />
Liberia 921 22 3 19 38 177 37 48 73 63 – – 21 18<br />
Libya 1,117 17 – – – 4 x – – – – – – – –<br />
Liechtenstein – – – – – 4 – – – – 103 23 – –<br />
Lithuania 391 12 – – – 17 – – – – 96 105 – –<br />
Luxembourg 63 12 – – – 7 – – – – 110 88 – –<br />
Madagascar 5,060 24 11 34 36 147 33 35 61 60 42 15 26 23<br />
Malawi 3,673 24 2 23 35 157 21 16 82 65 40 15 45 40<br />
Malaysia 5,537 19 5 6 – 14 – – – – 91 50 – –<br />
Maldives 66 21 – 5 1 19 – 41 y – 100 – – – 22 y<br />
Mali 3,723 24 – 40 46 x 190 x – 83 81 79 48 26 – 14<br />
Malta 50 12 – – – 20 – – – – 103 97 – –<br />
Marshall Islands – – 5 21 21 105 71 47 86 85 110 92 35 27<br />
Mauritania 791 22 – 25 19 88 x – – 55 x 44 x 26 22 10 4<br />
Mauritius 211 16 – – – 31 – – – – 96 85 – –<br />
Mexico 21,658 19 – 15 39 87 – – – – 117 61 – –<br />
Micronesia<br />
(Federated <strong>State</strong>s <strong>of</strong>) 27 24 – – – 52 x – – – – – – – –<br />
Monaco – – – – – – – – – – – – – –<br />
Mongolia 500 18 1 5 2 20 9 14 – – 89 90 24 28<br />
Montenegro 83 13 – 2 – 24 – 6 – – 114 94 – –<br />
Morocco 6,094 19 – 11 8 x 18 x – 64 – 90 – – – –<br />
Mozambique 5,577 23 5 43 42 x 193 – 37 95 88 34 11 31 37<br />
Myanmar 8,665 18 – 7 – 17 x – – – – 62 38 – 31<br />
Namibia 530 23 0 5 17 74 x 44 38 86 88 – – 59 62<br />
Nauru – – 9 18 22 84 x – – 89 86 – – 8 8<br />
Nepal 7,043 23 7 29 19 81 27 24 86 76 – – 33 25<br />
Ne<strong>the</strong>rlands 2,019 12 – – – 5 – – – – 127 116 – –<br />
New Zealand 612 14 – – – 29 – – – – 104 137 – –<br />
STATISTICAL TABLES 141
TABLE 11<br />
AdOLESCENTS<br />
Countries<br />
and areas<br />
Justification <strong>of</strong> wife Use <strong>of</strong> mass<br />
Lower<br />
secondary<br />
Upper<br />
secondary<br />
Comprehensive<br />
knowledge <strong>of</strong><br />
Proportion <strong>of</strong> Adolescents currently<br />
beating among media among school gross school gross HIV among<br />
total population<br />
(%)<br />
married/in union (%)<br />
2002–2011*<br />
Births by<br />
age 18 (%)<br />
Adolescent<br />
birth rate<br />
adolescents (%)<br />
2002–2011*<br />
adolescents (%)<br />
2002–2011*<br />
enrolment<br />
ratio<br />
enrolment<br />
ratio<br />
adolescents (%)<br />
2007–2011*<br />
2011 male female 2007–2011* 2006–2010* male female male female 2008–2011* 2008–2011* male female<br />
Population aged 10–19<br />
Total<br />
(thousands)<br />
2011<br />
Nicaragua 1,319 22 – 24 28 x 109 x – 19 – 95 x 80 54 – –<br />
Niger 3,776 24 3 59 51 x 199 x – 68 66 48 19 4 14 x 12 x<br />
Nigeria 36,205 22 1 29 28 123 35 40 82 64 47 41 28 20<br />
Niue – – – – – 16 – – – – – – – –<br />
Norway 646 13 – – – 10 – – – – 98 124 – –<br />
Oman 462 16 – – – 12 – – – – 108 93 – –<br />
Pakistan 39,894 23 – 16 10 16 – – – – 44 26 – 2<br />
Palau – – – – – 27 x – – – – – – – –<br />
Panama 646 18 – – – 88 – – – – 93 54 – –<br />
Papua New Guinea 1,561 22 3 15 14 x 70 x – – – – – – – –<br />
Paraguay 1,385 21 – 11 – 63 – – – – 78 56 – –<br />
Peru 5,769 20 – 11 13 72 – – – 91 101 77 – 17<br />
Philippines 20,508 22 – 10 7 53 – 15 – 94 88 76 – 19<br />
Poland 4,300 11 – – – 16 – – – – 97 97 – –<br />
Portugal 1,100 10 – – – 16 – – – – 116 98 – –<br />
Qatar 151 8 – – – 15 – – – – 101 86 – –<br />
Republic <strong>of</strong> Korea 6,458 13 – – – 2 – – – – 100 94 – –<br />
Republic <strong>of</strong> Moldova 459 13 1 10 5 x 26 25 24 99 98 89 86 – –<br />
Romania 2,252 11 – – – 41 – – – – 96 98 – –<br />
Russian Federation 14,023 10 – – – 30 – – – – 90 86 – –<br />
Rwanda 2,356 22 0 3 5 41 35 56 88 73 43 20 44 49<br />
Saint Kitts and Nevis – – – – – 67 x – – – – 100 93 – –<br />
Saint Lucia 32 18 – – – 49 x – – – – 98 93 – –<br />
Saint Vincent<br />
and <strong>the</strong> Grenadines 21 19 – – – 70 – – – – 119 91 – –<br />
Samoa 44 24 1 7 5 29 50 58 97 97 105 76 5 2<br />
San Marino – – – – – 1 x – – – – 99 96 – –<br />
Sao Tome and Principe 40 24 1 20 25 110 25 23 96 95 71 19 39 39<br />
Saudi Arabia 4,926 18 – – – 7 – – – – 106 95 – –<br />
Senegal 3,004 24 1 24 22 93 31 61 86 81 – – 28 26<br />
Serbia 1,207 12 1 5 3 22 6 2 99 100 99 85 43 53<br />
Seychelles – – – – – 62 – – – – 131 104 – –<br />
Sierra Leone 1,366 23 – 23 38 98 x – 63 66 51 – – 26 16<br />
Singapore 747 14 – – – 6 – – – – – – – –<br />
Slovakia 635 12 – – – 21 – – – – 91 88 – –<br />
Slovenia 193 9 – – – 5 – – – – 96 98 – –<br />
Solomon Islands 121 22 0 13 15 70 x 73 72 71 54 – – 26 29<br />
Somalia 2,140 22 – 25 – 123 x – 75 y – – – – – 3 x<br />
South Africa 9,940 20 2 4 15 x 54 – – – – 96 92 – –<br />
South Sudan s – – – 40 28 – – 72 – – – – – 8<br />
Spain 4,299 9 – – – 13 – – – – 120 133 – –<br />
Sri Lanka 3,165 15 – 9 4 24 – 54 y – 88 y – – – –<br />
<strong>State</strong> <strong>of</strong> Palestine 1,040 25 1 13 – 60 – – – – 88 78 – –<br />
Sudan s – – – 24 14 – – 52 – – – – – 4<br />
Suriname 96 18 – 11 – 66 – 19 – – 89 56 – 41 x<br />
Swaziland 301 25 0 4 22 111 x 34 42 94 89 67 45 52 56<br />
Sweden 1,097 12 – – – 6 – – – – 97 101 – –<br />
Switzerland 867 11 – – – 4 – – – – 108 86 – –<br />
Syrian Arab Republic 4,786 23 – 10 9 x 75 x – – – – 92 37 – 6 x<br />
Tajikistan 1,670 24 – 6 4 x 27 x – 85 y – – 98 61 9 11<br />
Thailand 10,192 15 – 15 8 x 47 – – – – 91 64 – 46 x<br />
The former Yugoslav<br />
Republic <strong>of</strong> Macedonia 280 14 – 4 2 20 – 14 – – 90 78 – 23 x<br />
Timor-Leste 301 26 0 8 9 54 72 81 61 62 63 49 15 11<br />
Togo 1,416 23 0 12 17 – – 41 – – – – – 33<br />
Tonga 23 22 – – – 16 – – – – – – – –<br />
Trinidad and Tobago 189 14 – 6 – 33 – 10 – – 92 87 – 49 x<br />
Tunisia 1,709 16 – – – 6 – – – – 116 73 – –<br />
Turkey 13,004 18 – 10 8 x 38 – 30 – – 96 64 – –<br />
Turkmenistan 1,013 20 – 5 2 x 21 – 37 y – 96 x – – – 4 x<br />
Tuvalu – – 2 8 3 28 x 83 69 89 95 – – 57 31<br />
Uganda 8,326 24 2 20 33 159 x 52 62 88 82 35 13 36 36<br />
Ukraine 4,638 10 3 6 3 30 8 3 99 99 104 78 33 39<br />
United Arab Emirates 898 12 – – – 34 – – – – – – – –<br />
142<br />
THE STATE OF THE WORLD’S CHILDREN <strong>2013</strong>: <strong>Children</strong> with Disabilities
TABLE 11<br />
AdOLESCENTS<br />
Countries<br />
and areas<br />
Justification <strong>of</strong> wife Use <strong>of</strong> mass<br />
Lower<br />
secondary<br />
Upper<br />
secondary<br />
Comprehensive<br />
knowledge <strong>of</strong><br />
Proportion <strong>of</strong> Adolescents currently<br />
beating among media among school gross school gross HIV among<br />
total population<br />
(%)<br />
married/in union (%)<br />
2002–2011*<br />
Births by<br />
age 18 (%)<br />
Adolescent<br />
birth rate<br />
adolescents (%)<br />
2002–2011*<br />
adolescents (%)<br />
2002–2011*<br />
enrolment<br />
ratio<br />
enrolment<br />
ratio<br />
adolescents (%)<br />
2007–2011*<br />
2011 male female 2007–2011* 2006–2010* male female male female 2008–2011* 2008–2011* male female<br />
Population aged 10–19<br />
Total<br />
(thousands)<br />
2011<br />
United Kingdom 7,442 12 – – – 25 – – – – 109 96 – –<br />
United Republic <strong>of</strong> Tanzania 10,475 23 4 18 28 128 39 52 79 70 – – 41 46<br />
United <strong>State</strong>s 41,478 13 – – – 39 – – – – 103 90 – –<br />
Uruguay 524 15 – – – 60 – – – – 113 68 – –<br />
Uzbekistan 5,798 21 – 5 2 x 26 63 63 – – 96 124 – 27 x<br />
Vanuatu 54 22 – 13 – – – – – – 65 41 – 14<br />
Venezuela<br />
(Bolivarian Republic <strong>of</strong>) 5,499 19 – 16 x – 101 – – – – 90 71 – –<br />
Viet Nam 15,251 17 – 8 3 35 – 35 97 94 88 65 – 51<br />
Yemen 6,073 25 – 19 – 80 x – – – – 54 34 – 2 x, y<br />
Zambia 3,176 24 1 18 34 151 x 55 61 80 71 – – 38 36<br />
Zimbabwe 3,196 25 1 23 21 115 48 48 59 53 – – 42 46<br />
MEMORANDUM<br />
Sudan and South Sudan s 10,044 23 – – – 70 – – – – – – – –<br />
SUMMARY INDICATORS #<br />
Sub–Saharan Africa 200,971 23 2 23 26 109 42 55 73 62 47 30 34 26<br />
Eastern and Sou<strong>the</strong>rn Africa 94,195 22 3 19 26 102 46 55 71 64 49 30 38 35<br />
West and Central Africa 96,530 23 1 28 27 121 35 55 75 60 46 31 28 19<br />
Middle East and North Africa 82,134 20 – 14 – 37 – 57 – – 89 57 – –<br />
South Asia 333,425 20 5 29 22 38 56 52 88 71 75 45 34 15<br />
East Asia and Pacific 317,250 16 – 11 ** 8 ** 14 – 34 ** – 85 ** 89 68 – 20 **<br />
Latin America and Caribbean 108,552 18 – 18 – 77 – – – – 102 75 – –<br />
CEE/CIS 53,462 13 – 7 – 31 – 31 – – 95 80 – –<br />
Least developed countries 193,984 23 – 27 28 106 – 55 68 61 50 26 – 22<br />
World 1,199,890 17 – 22 ** 20 ** 43 – 49 ** – 73 ** 82 59 – 19 **<br />
s Due to <strong>the</strong> cession in July 2011 <strong>of</strong> <strong>the</strong> Republic <strong>of</strong> South Sudan by <strong>the</strong> Republic <strong>of</strong> <strong>the</strong> Sudan, and its subsequent admission to <strong>the</strong> United Nations on 14 July 2011, disaggregated data for <strong>the</strong> Sudan<br />
and South Sudan as separate <strong>State</strong>s are not yet available for all indicators. Aggregated data presented are for <strong>the</strong> Sudan pre-cession (see Memorandum item).<br />
# For a complete list <strong>of</strong> countries and areas in <strong>the</strong> regions, subregions and country categories, see page 98.<br />
DEFINITIONS OF THE INDICATORS<br />
Adolescents currently married/in union – Percentage <strong>of</strong> boys and girls aged 15–19 who are<br />
currently married or in union. This indicator is meant to provide a snapshot <strong>of</strong> <strong>the</strong> current marital<br />
status <strong>of</strong> boys and girls in this age group. However, it is worth noting that those not married at <strong>the</strong><br />
time <strong>of</strong> <strong>the</strong> survey are still exposed to <strong>the</strong> risk <strong>of</strong> marrying before <strong>the</strong>y exit adolescence.<br />
Births by age 18 – Percentage <strong>of</strong> women aged 20–24 who gave birth before age 18. This<br />
standardized indicator from population-based surveys captures levels <strong>of</strong> fertility among adolescents<br />
up to <strong>the</strong> age <strong>of</strong> 18. Note that <strong>the</strong> data are based on <strong>the</strong> answers from women aged 20–24, whose<br />
risk <strong>of</strong> giving birth before <strong>the</strong> age <strong>of</strong> 18 is behind <strong>the</strong>m.<br />
Adolescent birth rate – Number <strong>of</strong> births per 1,000 adolescent girls aged 15–19.<br />
Justification <strong>of</strong> wife beating among adolescents – The percentage <strong>of</strong> boys and girls aged<br />
15–19 who consider a husband to be justified in hitting or beating his wife for at least one <strong>of</strong> <strong>the</strong><br />
specified reasons: if his wife burns <strong>the</strong> food, argues with him, goes out without telling him, neglects<br />
<strong>the</strong> children or refuses sexual relations.<br />
Use <strong>of</strong> mass media among adolescents – The percentage <strong>of</strong> boys and girls aged 15–19 who<br />
use at least one <strong>of</strong> <strong>the</strong> following types <strong>of</strong> information media, at least once a week: newspaper,<br />
magazine, television or radio.<br />
Lower secondary school gross enrolment ratio – Number <strong>of</strong> children enrolled in lower<br />
secondary school, regardless <strong>of</strong> age, expressed as a percentage <strong>of</strong> <strong>the</strong> total number <strong>of</strong> children <strong>of</strong><br />
<strong>of</strong>ficial lower secondary school age.<br />
Upper secondary school gross enrolment ratio – Number <strong>of</strong> children enrolled in upper<br />
secondary school, regardless <strong>of</strong> age, expressed as a percentage <strong>of</strong> <strong>the</strong> total number <strong>of</strong> children <strong>of</strong><br />
<strong>of</strong>ficial upper secondary school age.<br />
Comprehensive knowledge <strong>of</strong> HIV among adolescents – Percentage <strong>of</strong> young men and<br />
women aged 15–19 who correctly identify <strong>the</strong> two major ways <strong>of</strong> preventing <strong>the</strong> sexual transmission<br />
<strong>of</strong> HIV (using condoms and limiting sex to one faithful, uninfected partner), who reject <strong>the</strong> two most<br />
common local misconceptions about HIV transmission and who know that a healthy-looking person<br />
can be HIV-positive.<br />
MAIN DATA SOURCES<br />
Adolescent population – United Nations Population Division.<br />
Adolescents currently married/in union – Demographic and Health Surveys (DHS),<br />
Multiple Indicator Cluster Surveys (MICS) and o<strong>the</strong>r national surveys.<br />
Births by age 18 – DHS and MICS.<br />
Adolescent birth rate – United Nations Population Division.<br />
Justification <strong>of</strong> wife beating among adolescents – DHS, MICS and o<strong>the</strong>r national<br />
surveys.<br />
Use <strong>of</strong> mass media among adolescents – AIDS Indicator Surveys (AIS), DHS, MICS and<br />
o<strong>the</strong>r national surveys.<br />
Gross enrolment ratio – UNESCO Institute for Statistics (UIS).<br />
Comprehensive knowledge <strong>of</strong> HIV among adolescents – AIDS Indicator Surveys (AIS),<br />
DHS, MICS, Reproductive Health Surveys (RHS) and o<strong>the</strong>r national household surveys; HIV/<br />
AIDS Survey Indicators Database, .<br />
NOTES<br />
– Data not available.<br />
x Data refer to years or periods o<strong>the</strong>r than those specified in <strong>the</strong> column heading. Such data<br />
are not included in <strong>the</strong> calculation <strong>of</strong> regional and global averages, with <strong>the</strong> exception <strong>of</strong><br />
2005–2006 data from India. Estimates from data years prior to 2000 are not displayed.<br />
y Data differ from <strong>the</strong> standard definition or refer to only part <strong>of</strong> a country. If <strong>the</strong>y fall within<br />
<strong>the</strong> noted reference period, such data are included in <strong>the</strong> calculation <strong>of</strong> regional and<br />
global averages.<br />
* Data refer to <strong>the</strong> most recent year available during <strong>the</strong> period specified in <strong>the</strong> column<br />
heading.<br />
** Excludes China.<br />
STATISTICAL TABLES 143
TABLE 12: dISpARITIES By RESIdENCE<br />
Countries<br />
Birth registration (%)<br />
2005–2011*<br />
Skilled attendant at<br />
birth (%)<br />
2007–2012*<br />
ratio <strong>of</strong><br />
urban to<br />
rural urban rural<br />
Underweight prevalence<br />
in children under 5 (%)<br />
2007–2011*<br />
ratio <strong>of</strong><br />
urban to<br />
rural urban rural<br />
Diarrhoea treatment<br />
with oral rehydration<br />
salts (ORS) (%)<br />
2007−2012*<br />
ratio <strong>of</strong><br />
rural to<br />
urban urban rural<br />
Primary school net<br />
attendance ratio<br />
2007−2011*<br />
ratio <strong>of</strong><br />
urban to<br />
rural urban rural<br />
Comprehensive<br />
knowledge <strong>of</strong> HIV (%)<br />
Females 15−24<br />
2007−2011*<br />
ratio <strong>of</strong><br />
urban to<br />
rural urban rural<br />
Use <strong>of</strong> improved<br />
sanitation facilities (%)<br />
2010<br />
ratio <strong>of</strong><br />
urban to<br />
rural urban rural<br />
and areas<br />
urban rural<br />
Afghanistan 60 33 1.8 74 31 2.4 – – – 48 54 0.9 73 x 47 x 1.6 x – – – 60 30 2.0<br />
Albania 99 98 1.0 100 99 1.0 5 6 1.2 33 x 36 x 0.9 x 90 91 1.0 51 26 2.0 95 93 1.0<br />
Algeria 99 99 1.0 98 x 92 x 1.1 x 3 x 4 x 1.4 x 18 x 19 x 1.0 x 98 x 95 x 1.0 x 16 x 10 x 1.7 x 98 88 1.1<br />
Andorra – – – – – – – – – – – – – – – – – – 100 100 1.0<br />
Angola 34 x 19 x 1.7 x 71 26 2.8 – – – – – – 85 67 1.3 – – – 85 19 4.5<br />
Antigua and Barbuda – – – – – – – – – – – – – – – – – – 98 – –<br />
Argentina – – – – – – – – – – – – – – – – – – – – –<br />
Armenia 99 100 1.0 100 99 1.0 3 7 2.6 22 x 28 x 0.8 x – – – 16 16 1.0 95 80 1.2<br />
Australia – – – – – – – – – – – – – – – – – – 100 100 1.0<br />
Austria – – – – – – – – – – – – – – – – – – 100 100 1.0<br />
Azerbaijan 96 92 1.0 97 x 80 x 1.2 x 4 x 12 x 3.1 x 19 x 5 x 3.6 x 74 x 72 x 1.0 x 7 x 2 x 3.3 x 86 78 1.1<br />
Bahamas – – – – – – – – – – – – – – – – – – 100 100 1.0<br />
Bahrain – – – – – – – – – – – – – – – – – – 100 – –<br />
Bangladesh 13 9 1.5 54 25 2.1 28 39 1.4 84 76 1.1 86 y 86 y 1.0 y – – – 57 55 1.0<br />
Barbados – – – – – – – – – – – – – – – – – – 100 100 1.0<br />
Belarus – – – 100 x 100 x 1.0 x 1 x 2 x 1.7 x 38 x 33 x 1.1 x 92 x 95 x 1.0 x – – – 91 97 0.9<br />
Belgium – – – – – – – – – – – – – – – – – – 100 100 1.0<br />
Belize 95 96 1.0 99 x 93 x 1.1 x 2 x 6 x 2.9 x – – – 97 x 94 x 1.0 x 49 x 29 x 1.7 x 93 87 1.1<br />
Benin 68 56 1.2 92 79 1.2 15 x 21 x 1.4 x 58 47 1.2 74 x 55 x 1.3 x 22 x 11 x 1.9 x 25 5 5.0<br />
Bhutan 100 100 1.0 90 54 1.6 11 14 1.3 64 60 1.1 96 90 1.1 32 15 2.1 73 29 2.5<br />
Bolivia (Plurinational<br />
<strong>State</strong> <strong>of</strong>) 79 y 72 y 1.1 y 88 51 1.7 3 6 2.3 38 32 1.2 98 96 1.0 32 9 3.5 35 10 3.5<br />
Bosnia and Herzegovina 99 100 1.0 100 x 100 x 1.0 x 2 x 1 x 0.7 x 34 x 35 x 1.0 x 98 x 98 x 1.0 x 46 x 42 x 1.1 x 99 92 1.1<br />
Botswana 78 67 1.2 99 90 1.1 – – – 47 x 51 x 0.9 x 89 85 1.0 – – – 75 41 1.8<br />
Brazil – – – 98 x 94 x 1.0 x 2 x 2 x 0.8 x – – – – – – – – – 85 44 1.9<br />
Brunei Darussalam – – – – – – – – – – – – – – – – – – – – –<br />
Bulgaria – – – – – – – – – – – – – – – – – – 100 100 1.0<br />
Burkina Faso 93 74 1.3 93 61 1.5 – – – 31 19 1.6 79 x 38 x 2.1 x 46 24 1.9 50 6 8.3<br />
Burundi 87 74 1.2 88 58 1.5 18 30 1.7 33 38 0.9 87 73 1.2 59 43 1.4 49 46 1.1<br />
Cambodia 74 60 1.2 95 67 1.4 19 30 1.6 33 34 1.0 85 y 85 y 1.0 y 55 41 1.3 73 20 3.7<br />
Cameroon 86 58 1.5 87 47 1.9 7 20 2.8 27 12 2.2 90 x 71 x 1.3 x 42 x 18 x 2.4 x 58 36 1.6<br />
Canada – – – – – – – – – – – – – – – – – – 100 99 1.0<br />
Cape Verde – – – 91 x 64 x 1.4 x – – – – – – – – – – – – 73 43 1.7<br />
Central African Republic 78 52 1.5 83 38 2.2 23 24 1.0 23 12 2.0 66 x 42 x 1.6 x 21 x 13 x 1.6 x 43 28 1.5<br />
Chad 42 9 4.9 60 12 5.1 22 33 1.5 27 10 2.8 – – – 18 7 2.6 30 6 5.0<br />
Chile – – – 100 x 99 x 1.0 x – – – – – – – – – – – – 98 83 1.2<br />
China – – – 100 99 1.0 1 4 3.3 – – – – – – – – – 74 56 1.3<br />
Colombia 97 95 1.0 98 86 1.1 3 5 1.6 57 49 1.2 91 91 1.0 30 21 1.4 82 63 1.3<br />
Comoros 87 x 83 x 1.1 x 79 x 57 x 1.4 x – – – 25 x 17 x 1.5 x 41 x 29 x 1.4 x – – – 50 30 1.7<br />
Congo 88 y 75 y 1.2 y 98 86 1.1 8 x 15 x 2.0 x 38 27 1.4 – – – 9 6 1.5 20 15 1.3<br />
Cook Islands – – – – – – – – – – – – – – – – – – 100 100 1.0<br />
Costa Rica – – – 100 99 1.0 – – – – – – 96 96 1.0 – – – 95 96 1.0<br />
Côte d’Ivoire 79 41 2.0 84 45 1.9 9 x,y 20 x,y 2.2 x,y 22 14 1.5 67 x 48 x 1.4 x – – – 36 11 3.3<br />
Croatia – – – – – – – – – – – – – – – – – – 99 98 1.0<br />
Cuba 100 y 100 y 1.0 y – – – – – – 54 37 1.4 – – – 55 49 1.1 94 81 1.2<br />
Cyprus – – – – – – – – – – – – – – – – – – 100 100 1.0<br />
Czech Republic – – – – – – – – – – – – – – – – – – 99 97 1.0<br />
Democratic People’s<br />
Republic <strong>of</strong> Korea 100 100 1.0 100 100 1.0 13 27 2.0 75 73 1.0 100 99 1.0 11 4 2.8 86 71 1.2<br />
Democratic Republic<br />
<strong>of</strong> <strong>the</strong> Congo 24 29 0.8 96 75 1.3 17 27 1.6 26 27 1.0 86 70 1.2 21 12 1.7 24 24 1.0<br />
Denmark – – – – – – – – – – – – – – – – – – 100 100 1.0<br />
Djibouti 90 82 1.1 95 x 40 x 2.3 x 18 y 27 y 1.5 y – – – 67 x 49 x 1.4 x 18 x 9 x 2.0 x 63 10 6.3<br />
Dominica – – – – – – – – – – – – – – – – – – – – –<br />
Dominican Republic 83 73 1.1 98 97 1.0 3 4 1.2 42 39 1.1 95 95 1.0 42 37 1.2 87 75 1.2<br />
Ecuador 89 92 1.0 98 x 99 x 1.0 x – – – – – – – – – – – – 96 84 1.1<br />
Egypt 99 99 1.0 90 72 1.2 6 6 1.0 28 29 1.0 91 87 1.0 7 3 2.3 97 93 1.0<br />
El Salvador 99 99 1.0 97 94 1.0 4 y 7 y 2.0 y 60 56 1.1 – – – – – – 89 83 1.1<br />
Equatorial Guinea 43 x 24 x 1.8 x 87 x 49 x 1.8 x – – – 43 x 19 x 2.2 x – – – – – – – – –<br />
Eritrea – – – 65 x 10 x 6.2 x 23 x 40 x 1.7 x 59 x 39 x 1.5 x – – – – – – – 4 –<br />
Estonia – – – – – – – – – – – – – – – – – – 96 94 1.0<br />
Ethiopia 29 5 5.9 51 4 12.7 16 30 1.9 45 24 1.9 86 61 1.4 38 19 2.0 29 19 1.5<br />
Fiji – – – – – – – – – – – – – – – – – – 94 71 1.3<br />
Finland – – – – – – – – – – – – – – – – – – 100 100 1.0<br />
ratio <strong>of</strong><br />
urban to<br />
rural<br />
144<br />
THE STATE OF THE WORLD’S CHILDREN <strong>2013</strong>: <strong>Children</strong> with Disabilities
TABLE 12<br />
disparities by residence<br />
Countries<br />
Birth registration (%)<br />
2005–2011*<br />
Skilled attendant at<br />
birth (%)<br />
2007–2012*<br />
ratio <strong>of</strong><br />
urban to<br />
rural urban rural<br />
Underweight prevalence<br />
in children under 5 (%)<br />
2007–2011*<br />
ratio <strong>of</strong><br />
urban to<br />
rural urban rural<br />
Diarrhoea treatment<br />
with oral rehydration<br />
salts (ORS) (%)<br />
2007−2012*<br />
ratio <strong>of</strong><br />
rural to<br />
urban urban rural<br />
Primary school net<br />
attendance ratio<br />
2007−2011*<br />
ratio <strong>of</strong><br />
urban to<br />
rural urban rural<br />
Comprehensive<br />
knowledge <strong>of</strong> HIV (%)<br />
Females 15−24<br />
2007−2011*<br />
ratio <strong>of</strong><br />
urban to<br />
rural urban rural<br />
Use <strong>of</strong> improved<br />
sanitation facilities (%)<br />
2010<br />
ratio <strong>of</strong><br />
urban to<br />
rural urban rural<br />
and areas<br />
urban rural<br />
France – – – – – – – – – – – – – – – – – – 100 100 1.0<br />
Gabon 90 x 87 x 1.0 x 92 x 67 x 1.4 x – – – 23 x 29 x 0.8 x – – – – – – 33 30 1.1<br />
Gambia 54 52 1.0 77 41 1.9 12 22 1.9 39 39 1.0 53 35 1.5 41 24 1.7 70 65 1.1<br />
Georgia 99 98 1.0 99 x 98 x 1.0 x 1 1 1.6 44 x 36 x 1.2 x 97 95 1.0 – – – 96 93 1.0<br />
Germany – – – – – – – – – – – – – – – – – – 100 100 1.0<br />
Ghana 72 55 1.3 88 54 1.6 11 16 1.5 37 34 1.1 80 68 1.2 34 22 1.5 19 8 2.4<br />
Greece – – – – – – – – – – – – – – – – – – 99 97 1.0<br />
Grenada – – – – – – – – – – – – – – – – – – 96 97 1.0<br />
Guatemala 96 97 1.0 77 37 2.1 8 y 16 y 1.9 y 38 37 1.0 – – – 32 14 2.2 87 70 1.2<br />
Guinea 78 33 2.4 84 31 2.7 15 23 1.5 52 x 28 x 1.9 x – – – – – – 32 11 2.9<br />
Guinea-Bissau 30 21 1.4 69 x 27 x 2.6 x 13 21 1.6 28 13 2.1 84 57 1.5 22 8 2.8 44 9 4.9<br />
Guyana 91 87 1.0 98 90 1.1 7 12 1.7 42 x 38 x 1.1 x 96 94 1.0 72 47 1.5 88 82 1.1<br />
Haiti 87 78 1.1 47 x 15 x 3.0 x 12 x 20 x 1.7 x 51 x 35 x 1.4 x – – – 38 x 26 x 1.4 x 24 10 2.4<br />
Holy See – – – – – – – – – – – – – – – – – – – – –<br />
Honduras 95 93 1.0 90 x 50 x 1.8 x 4 x 11 x 2.4 x 55 x 56 x 1.0 x 92 x 86 x 1.1 x 37 x 21 x 1.8 x 85 69 1.2<br />
Hungary – – – – – – – – – – – – – – – – – – 100 100 1.0<br />
Iceland – – – – – – – – – – – – – – – – – – 100 100 1.0<br />
India 59 35 1.7 76 43 1.7 33 x 46 x 1.4 x 33 x 24 x 1.4 x – – – 33 x 14 x 2.4 x 58 23 2.5<br />
Indonesia 71 41 1.7 84 76 1.1 15 21 1.4 33 35 0.9 99 97 1.0 16 y 6 y 2.5 y 73 39 1.9<br />
Iran (Islamic Republic <strong>of</strong>) – – – – – – – – – – – – – – – – – – 100 100 1.0<br />
Iraq 95 96 1.0 86 71 1.2 6 x 7 x 1.1 x 30 x 32 x 0.9 x 92 x 78 x 1.2 x 4 x 1 x 4.4 x 76 67 1.1<br />
Ireland – – – – – – – – – – – – – – – – – – 100 98 1.0<br />
Israel – – – – – – – – – – – – – – – – – – 100 100 1.0<br />
Italy – – – – – – – – – – – – – – – – – – – – –<br />
Jamaica – – – 99 98 1.0 – – – – – – 97 x 98 x 1.0 x 66 60 1.1 78 82 1.0<br />
Japan – – – – – – – – – – – – – – – – – – 100 100 1.0<br />
Jordan – – – 99 99 1.0 2 2 1.3 20 20 1.0 – – – – – – 98 98 1.0<br />
Kazakhstan 100 100 1.0 100 x 100 x 1.0 x 3 x 5 x 1.7 x – – – 98 x 98 x 1.0 x 24 x 21 x 1.1 x 97 98 1.0<br />
Kenya 76 57 1.3 75 37 2.0 10 17 1.7 40 39 1.0 81 72 1.1 57 45 1.3 32 32 1.0<br />
Kiribati 95 93 1.0 84 77 1.1 – – – – – – – – – 45 43 1.1 – – –<br />
Kuwait – – – – – – – – – – – – – – – – – – 100 100 1.0<br />
Kyrgyzstan 96 93 1.0 100 x 96 x 1.0 x 2 x 2 x 0.9 x – – – 93 x 92 x 1.0 x 23 x 18 x 1.3 x 94 93 1.0<br />
Lao People’s Democratic<br />
Republic 84 68 1.2 68 x 11 x 6.2 x 20 x 34 x 1.7 x 79 x 43 x 1.9 x 93 x 75 x 1.2 x – – – 89 50 1.8<br />
Latvia – – – – – – – – – – – – – – – – – – – – –<br />
Lebanon – – – – – – – – – – – – – – – – – – 100 – –<br />
Lesotho 43 46 1.0 88 54 1.6 12 13 1.1 57 50 1.1 93 88 1.0 44 36 1.2 32 24 1.3<br />
Liberia 5 y 3 y 1.9 y 79 32 2.4 17 y 20 y 1.2 y 57 52 1.1 46 21 2.2 26 15 1.8 29 7 4.1<br />
Libya – – – – – – – – – – – – – – – – – – 97 96 1.0<br />
Liechtenstein – – – – – – – – – – – – – – – – – – – – –<br />
Lithuania – – – – – – – – – – – – – – – – – – 95 – –<br />
Luxembourg – – – – – – – – – – – – – – – – – – 100 100 1.0<br />
Madagascar 92 78 1.2 82 39 2.1 31 x 37 x 1.2 x 32 14 2.2 93 77 1.2 40 19 2.1 21 12 1.8<br />
Malawi – – – 84 69 1.2 10 13 1.3 72 69 1.0 88 x 88 x 1.0 x 56 38 1.5 49 51 1.0<br />
Malaysia – – – – – – – – – – – – – – – – – – 96 95 1.0<br />
Maldives 93 92 1.0 99 93 1.1 11 20 1.8 – – – 83 83 1.0 43 32 1.4 98 97 1.0<br />
Mali 92 77 1.2 80 x 38 x 2.1 x 20 x 29 x 1.5 x 26 x 11 x 2.3 x 79 52 1.5 19 12 1.5 35 14 2.5<br />
Malta – – – – – – – – – – – – – – – – – – 100 100 1.0<br />
Marshall Islands 96 96 1.0 97 68 1.4 – – – – – – – – – 33 12 2.7 83 53 1.6<br />
Mauritania 75 42 1.8 90 39 2.3 – – – 16 y 11 y 1.5 y 72 49 1.5 8 2 4.7 51 9 5.7<br />
Mauritius – – – – – – – – – – – – – – – – – – 91 88 1.0<br />
Mexico – – – 98 87 1.1 – – – – – – – – – – – – 87 79 1.1<br />
Micronesia<br />
(Federated <strong>State</strong>s <strong>of</strong>) – – – – – – – – – – – – – – – – – – – – –<br />
Monaco – – – – – – – – – – – – – – – – – – 100 – –<br />
Mongolia 99 99 1.0 99 98 1.0 4 5 1.2 41 x 36 x 1.1 x 97 94 1.0 36 21 1.7 64 29 2.2<br />
Montenegro 98 99 1.0 100 x 98 x 1.0 x 2 x 1 x 0.7 x – – – 97 x 98 x 1.0 x – – – 92 87 1.1<br />
Morocco 92 x,y 80 x,y 1.1 x,y 92 55 1.7 2 4 2.5 28 x 18 x 1.5 x 96 x 83 x 1.2 x – – – 83 52 1.6<br />
Mozambique 39 28 1.4 78 46 1.7 10 17 1.7 65 50 1.3 89 78 1.1 43 32 1.4 38 5 7.6<br />
Myanmar 94 64 1.5 90 63 1.4 19 24 1.3 72 56 1.3 93 89 1.0 – – – 83 73 1.1<br />
Namibia 83 59 1.4 94 73 1.3 12 19 1.7 67 60 1.1 94 91 1.0 65 65 1.0 57 17 3.4<br />
Nauru – – – – – – – – – – – – – – – – – – 65 – –<br />
Nepal 44 42 1.0 73 32 2.3 17 30 1.8 44 39 1.1 70 y 69 y 1.0 y 40 24 1.7 48 27 1.8<br />
Ne<strong>the</strong>rlands – – – – – – – – – – – – – – – – – – 100 100 1.0<br />
ratio <strong>of</strong><br />
urban to<br />
rural<br />
STATISTICAL TABLES 145
TABLE 12<br />
disparities by residence<br />
Countries<br />
and areas<br />
Birth registration (%)<br />
2005–2011*<br />
urban<br />
rural<br />
Skilled attendant at<br />
birth (%)<br />
2007–2012*<br />
ratio <strong>of</strong><br />
urban to<br />
rural urban rural<br />
Underweight prevalence<br />
in children under 5 (%)<br />
2007–2011*<br />
ratio <strong>of</strong><br />
urban to<br />
rural urban rural<br />
Diarrhoea treatment<br />
with oral rehydration<br />
salts (ORS) (%)<br />
2007−2012*<br />
ratio <strong>of</strong><br />
rural to<br />
urban urban rural<br />
Primary school net<br />
attendance ratio<br />
2007−2011*<br />
ratio <strong>of</strong><br />
urban to<br />
rural urban rural<br />
Comprehensive<br />
knowledge <strong>of</strong> HIV (%)<br />
Females 15−24<br />
2007−2011*<br />
ratio <strong>of</strong><br />
urban to<br />
rural urban rural<br />
Use <strong>of</strong> improved<br />
sanitation facilities (%)<br />
2010<br />
ratio <strong>of</strong><br />
urban to<br />
rural urban rural<br />
New Zealand – – – – – – – – – – – – – – – – – – – – –<br />
Nicaragua 87 y 77 y 1.1 y 92 56 1.7 4 7 1.7 64 55 1.2 76 y 64 y 1.2 y – – – 63 37 1.7<br />
Niger 71 y 25 y 2.9 y 71 x 8 x 8.5 x 44 y 39 y 0.9 y 31 x 16 x 2.0 x 71 x 32 x 2.2 x 31 x 8 x 3.8 x 34 4 8.5<br />
Nigeria 49 22 2.2 65 28 2.4 16 27 1.7 41 21 1.9 78 56 1.4 30 18 1.7 35 27 1.3<br />
Niue – – – – – – – – – – – – – – – – – – 100 100 1.0<br />
Norway – – – – – – – – – – – – – – – – – – 100 100 1.0<br />
Oman – – – – – – – – – – – – – – – – – – 100 95 1.1<br />
Pakistan 32 24 1.3 66 33 2.0 27 33 1.3 44 40 1.1 78 62 1.3 – – – 72 34 2.1<br />
Palau – – – – – – – – – – – – – – – – – – 100 100 1.0<br />
Panama – – – 99 84 1.2 – – – – – – – – – – – – – – –<br />
Papua New Guinea – – – 88 x 47 x 1.9 x 12 x 20 x 1.6 x – – – – – – – – – 71 41 1.7<br />
Paraguay – – – – – – – – – – – – 89 87 1.0 – – – 90 40 2.3<br />
Peru – – – 96 64 1.5 2 8 3.8 37 24 1.6 97 94 1.0 – – – 81 37 2.2<br />
Philippines 87 x 78 x 1.1 x 78 48 1.6 – – – 58 36 1.6 – – – 23 17 1.4 79 69 1.1<br />
Poland – – – – – – – – – – – – – – – – – – 96 – –<br />
Portugal – – – – – – – – – – – – – – – – – – 100 100 1.0<br />
Qatar – – – – – – – – – – – – – – – – – – 100 100 1.0<br />
Republic <strong>of</strong> Korea – – – – – – – – – – – – – – – – – – 100 100 1.0<br />
Republic <strong>of</strong> Moldova 98 x 98 x 1.0 x 100 x 99 x 1.0 x 2 x 4 x 2.0 x 9 x 6 x 1.5 x – – – – – – 89 82 1.1<br />
Romania – – – 100 x 98 x 1.0 x 3 x 4 x 1.3 x – – – – – – – – – – – –<br />
Russian Federation – – – – – – – – – – – – – – – – – – 74 59 1.3<br />
Rwanda 60 64 0.9 82 67 1.2 6 12 1.9 26 30 0.9 92 87 1.1 66 50 1.3 52 56 0.9<br />
Saint Kitts and Nevis – – – – – – – – – – – – – – – – – – 96 96 1.0<br />
Saint Lucia – – – – – – – – – – – – – – – – – – 71 63 1.1<br />
Saint Vincent<br />
and <strong>the</strong> Grenadines – – – – – – – – – – – – – – – – – – – 96 –<br />
Samoa 62 44 1.4 94 78 1.2 – – – – – – 89 y 88 y 1.0 y 5 2 2.4 98 98 1.0<br />
San Marino – – – – – – – – – – – – – – – – – – – – –<br />
Sao Tome and Principe 76 74 1.0 89 75 1.2 12 14 1.1 45 52 0.9 86 85 1.0 47 38 1.3 30 19 1.6<br />
Saudi Arabia – – – – – – – – – – – – – – – – – – 100 – –<br />
Senegal 89 66 1.4 91 49 1.8 12 21 1.8 24 21 1.2 81 50 1.6 41 18 2.2 70 39 1.8<br />
Serbia 99 99 1.0 100 100 1.0 2 1 0.7 50 22 2.3 99 98 1.0 63 41 1.5 96 88 1.1<br />
Seychelles – – – – – – – – – – – – – – – – – – 98 – –<br />
Sierra Leone 78 78 1.0 72 59 1.2 20 22 1.1 66 75 0.9 80 72 1.1 30 19 1.6 23 6 3.8<br />
Singapore – – – – – – – – – – – – – – – – – – 100 – –<br />
Slovakia – – – – – – – – – – – – – – – – – – 100 99 1.0<br />
Slovenia – – – – – – – – – – – – – – – – – – 100 100 1.0<br />
Solomon Islands – – – 95 84 1.1 8 12 1.5 – – – 72 y 65 y 1.1 y 34 28 1.2 98 – –<br />
Somalia 6 2 3.7 65 x 15 x 4.5 x 20 x 38 x 1.9 x 25 x 9 x 2.9 x 30 x 9 x 3.3 x 7 x 2 x 4.1 x 52 6 8.7<br />
South Africa – – – 94 x 85 x 1.1 x 10 x 9 x 0.9 x 41 x 32 x 1.3 x – – – – – – 86 67 1.3<br />
South Sudan s 45 32 1.4 31 15 2.0 23 29 1.3 44 37 1.2 47 23 2.0 16 7 2.3 – – –<br />
Spain – – – – – – – – – – – – – – – – – – 100 100 1.0<br />
Sri Lanka 97 98 1.0 99 99 1.0 – – – 57 50 1.1 – – – – – – 88 93 0.9<br />
<strong>State</strong> <strong>of</strong> Palestine 97 y 96 y 1.0 y 99 x 98 x 1.0 x – – – – – – – – – – – – 92 92 1.0<br />
Sudan s 85 50 1.7 41 16 2.5 24 35 1.5 23 22 1.1 89 69 1.3 10 3 3.4 – – –<br />
Suriname 98 95 1.0 95 x 82 x 1.2 x 7 x 8 x 1.1 x 24 x 60 x 0.4 x 96 x 91 x 1.1 x 45 x 32 x 1.4 x 90 66 1.4<br />
Swaziland 62 47 1.3 89 80 1.1 4 6 1.5 65 55 1.2 97 96 1.0 70 55 1.3 64 55 1.2<br />
Sweden – – – – – – – – – – – – – – – – – – 100 100 1.0<br />
Switzerland – – – – – – – – – – – – – – – – – – 100 100 1.0<br />
Syrian Arab Republic 96 95 1.0 99 93 1.1 9 x 9 x 1.0 x 56 x 44 x 1.3 x 89 x 85 x 1.0 x 7 x 7 x 1.0 x 96 93 1.0<br />
Tajikistan 85 90 0.9 95 86 1.1 12 16 1.3 70 78 0.9 97 y 97 y 1.0 y – – – 95 94 1.0<br />
Thailand 100 99 1.0 100 100 1.0 5 x 8 x 1.7 x 50 x 59 x 0.9 x 98 x 98 x 1.0 x 43 x 47 x 0.9 x 95 96 1.0<br />
The former Yugoslav<br />
Republic <strong>of</strong> Macedonia 100 100 1.0 98 98 1.0 1 2 2.3 19 x 30 x 0.6 x 99 98 1.0 33 x 18 x 1.8 x 92 82 1.1<br />
Timor-Leste 50 57 0.9 59 20 2.9 35 47 1.4 65 74 0.9 79 70 1.1 14 12 1.2 73 37 2.0<br />
Togo 93 71 1.3 91 43 2.1 10 20 1.9 15 10 1.5 94 86 1.1 39 27 1.4 26 3 8.7<br />
Tonga – – – – – – – – – – – – – – – – – – 98 96 1.0<br />
Trinidad and Tobago – – – – – – – – – – – – – – – – – – 92 92 1.0<br />
Tunisia – – – 98 x 89 x 1.1 x – – – 58 x 50 x 1.1 x – – – – – – 96 – –<br />
Turkey 95 92 1.0 96 80 1.2 1 3 2.1 – – – 94 y 91 y 1.0 y – – – 97 75 1.3<br />
Turkmenistan 96 95 1.0 100 x 99 x 1.0 x 7 x 9 x 1.2 x 32 x 45 x 0.7 x – – – 7 x 4 x 2.0 x 99 97 1.0<br />
Tuvalu 60 38 1.6 – – – – – – – – – – – – 38 41 0.9 88 81 1.1<br />
Uganda 38 29 1.3 89 52 1.7 7 15 2.3 46 43 1.1 85 y 81 y 1.1 y 48 35 1.4 34 34 1.0<br />
Ukraine 100 100 1.0 99 98 1.0 – – – – – – 71 76 0.9 48 37 1.3 96 89 1.1<br />
ratio <strong>of</strong><br />
urban to<br />
rural<br />
146<br />
THE STATE OF THE WORLD’S CHILDREN <strong>2013</strong>: <strong>Children</strong> with Disabilities
TABLE 12<br />
dISpARITIES By RESIdENCE<br />
Countries<br />
and areas<br />
Birth registration (%)<br />
2005–2011*<br />
urban<br />
rural<br />
Skilled attendant at<br />
birth (%)<br />
2007–2012*<br />
ratio <strong>of</strong><br />
urban to<br />
rural urban rural<br />
Underweight prevalence<br />
in children under 5 (%)<br />
2007–2011*<br />
ratio <strong>of</strong><br />
urban to<br />
rural urban rural<br />
Diarrhoea treatment<br />
with oral rehydration<br />
salts (ORS) (%)<br />
2007−2012*<br />
ratio <strong>of</strong><br />
rural to<br />
urban urban rural<br />
Primary school net<br />
attendance ratio<br />
2007−2011*<br />
ratio <strong>of</strong><br />
urban to<br />
rural urban rural<br />
Comprehensive<br />
knowledge <strong>of</strong> HIV (%)<br />
Females 15−24<br />
2007−2011*<br />
ratio <strong>of</strong><br />
urban to<br />
rural urban rural<br />
Use <strong>of</strong> improved<br />
sanitation facilities (%)<br />
2010<br />
ratio <strong>of</strong><br />
urban to<br />
rural urban rural<br />
United Arab Emirates – – – – – – – – – – – – – – – – – – 98 95 1.0<br />
United Kingdom – – – – – – – – – – – – – – – – – – 100 100 1.0<br />
United Republic <strong>of</strong> Tanzania 44 10 4.6 83 40 2.0 11 17 1.5 44 44 1.0 91 77 1.2 55 45 1.2 20 7 2.9<br />
United <strong>State</strong>s – – – – – – – – – – – – – – – – – – 100 99 1.0<br />
Uruguay – – – – – – – – – – – – – – – – – – 100 99 1.0<br />
Uzbekistan 100 100 1.0 100 x 100 x 1.0 x 4 x 4 x 0.9 x 34 x 31 x 1.1 x 97 x 95 x 1.0 x 33 x 30 x 1.1 x 100 100 1.0<br />
Vanuatu 39 23 1.7 87 72 1.2 11 11 1.0 – – – 85 80 1.1 23 13 1.8 64 54 1.2<br />
Venezuela<br />
(Bolivarian Republic <strong>of</strong>) – – – – – – – – – – – – – – – – – – – – –<br />
Viet Nam 97 94 1.0 99 91 1.1 6 14 2.3 47 46 1.0 98 98 1.0 58 48 1.2 94 68 1.4<br />
Yemen 38 16 2.3 62 x 26 x 2.3 x – – – 30 x 34 x 0.9 x 83 x 64 x 1.3 x 4 x 1 x 6.7 x 93 34 2.7<br />
Zambia 28 9 3.2 83 31 2.7 13 15 1.2 59 60 1.0 91 77 1.2 42 27 1.6 57 43 1.3<br />
Zimbabwe 65 43 1.5 86 58 1.5 8 10 1.3 26 18 1.4 89 88 1.0 59 47 1.3 52 32 1.6<br />
MEMORANDUM<br />
Sudan and South Sudan s – – – – – – – – – – – – – – – – – – 44 † 14 † 3.1 †<br />
ratio <strong>of</strong><br />
urban to<br />
rural<br />
SUMMARY INDICATORS #<br />
Sub-Saharan Africa 56 33 1.7 76 40 1.9 15 24 1.6 38 31 1.2 83 67 1.2 34 25 1.4 43 23 1.9<br />
Eastern and Sou<strong>the</strong>rn<br />
Africa 49 28 1.7 75 36 2.1 12 20 1.7 46 38 1.2 87 72 1.2 48 32 1.5 54 27 2.0<br />
West and Central Africa 57 36 1.6 78 46 1.7 16 26 1.7 35 23 1.5 80 61 1.3 29 16 1.8 35 20 1.8<br />
Middle East and North<br />
Africa 91 72 1.3 84 57 1.5 – – – – – – – – – – – – 91 70 1.3<br />
South Asia 52 32 1.6 73 40 1.8 31 43 1.4 39 32 1.2 – – – 33 14 2.3 60 28 2.1<br />
East Asia and <strong>the</strong> Pacific 80 ** 65 ** 1.2 ** 95 88 1.1 5 10 2.0 46 ** 41 ** 1.1 ** 98 ** 95 ** 1.0 ** 24 ** 21 ** 1.1 ** 77 58 1.3<br />
Latin America<br />
and <strong>the</strong> Caribbean – – – – – – – – – – – – – – – – – – 84 60 1.4<br />
CEE/CIS 97 96 1.0 – – – – – – – – – – – – – – – 87 80 1.1<br />
Least developed countries 50 31 1.6 76 40 1.9 18 27 1.5 47 41 1.1 86 73 1.2 35 24 1.4 48 30 1.6<br />
World 65 ** 41 ** 1.6 ** 84 53 1.6 15 28 1.9 40 ** 33 ** 1.2 ** – – – – 18 ** – 79 47 1.7<br />
s Due to <strong>the</strong> cession in July 2011 <strong>of</strong> <strong>the</strong> Republic <strong>of</strong> South Sudan by <strong>the</strong> Republic <strong>of</strong> <strong>the</strong> Sudan, and its subsequent admission to <strong>the</strong> United Nations on 14 July 2011, disaggregated data for <strong>the</strong> Sudan<br />
and South Sudan as separate <strong>State</strong>s are not yet available for all indicators. Aggregated data presented are for <strong>the</strong> Sudan pre-cession (see Memorandum item).<br />
# For a complete list <strong>of</strong> countries and areas in <strong>the</strong> regions, subregions and country categories, see page 98.<br />
DEFINITIONS OF THE INDICATORS<br />
Birth registration – Percentage <strong>of</strong> children under age 5 who were registered<br />
at <strong>the</strong> moment <strong>of</strong> <strong>the</strong> survey. This includes children whose birth certificate was<br />
seen by <strong>the</strong> interviewer or whose mo<strong>the</strong>r or caretaker says <strong>the</strong> birth has been<br />
registered.<br />
Skilled attendant at birth – Percentage <strong>of</strong> births attended by skilled health<br />
personnel (doctor, nurse or midwife).<br />
Underweight prevalence in children under 5 – Percentage <strong>of</strong> children under<br />
age 5 who are below minus two standard deviations from median weight-forage<br />
<strong>of</strong> <strong>the</strong> World Health Organization (WHO) Child Growth Standards.<br />
Diarrhoea treatment with oral rehydration salts (ORS) – Percentage<br />
<strong>of</strong> children under age 5 who had diarrhoea in <strong>the</strong> two weeks preceding <strong>the</strong><br />
survey and who received oral rehydration salts (ORS packets or pre-packaged<br />
ORS fluids).<br />
Primary school net attendance ratio – Number <strong>of</strong> children attending<br />
primary or secondary school who are <strong>of</strong> <strong>of</strong>ficial primary school age, expressed<br />
as a percentage <strong>of</strong> <strong>the</strong> total number <strong>of</strong> children <strong>of</strong> <strong>of</strong>ficial primary school age.<br />
Because <strong>of</strong> <strong>the</strong> inclusion <strong>of</strong> primary-school-aged children attending secondary<br />
school, this indicator can also be referred to as a primary adjusted net<br />
attendance ratio.<br />
Comprehensive knowledge <strong>of</strong> HIV – Percentage <strong>of</strong> young women (aged<br />
15–24) who correctly identify <strong>the</strong> two major ways <strong>of</strong> preventing <strong>the</strong> sexual<br />
transmission <strong>of</strong> HIV (using condoms and limiting sex to one faithful, uninfected<br />
partner), who reject <strong>the</strong> two most common local misconceptions about HIV<br />
transmission and who know that a healthy-looking person can be HIV-positive.<br />
Use <strong>of</strong> improved sanitation facilities – Percentage <strong>of</strong> <strong>the</strong> population using<br />
any <strong>of</strong> <strong>the</strong> following sanitation facilities, not shared with o<strong>the</strong>r households:<br />
flush or pour-flush latrine connected to a piped sewerage system, septic tank<br />
or pit latrine; ventilated improved pit latrine; pit latrine with a slab; covered pit;<br />
composting toilet.<br />
MAIN DATA SOURCES<br />
Birth registration – Demographic and Health Surveys (DHS), Multiple Indicator Cluster Surveys (MICS), o<strong>the</strong>r<br />
national surveys and vital registration systems.<br />
Skilled attendant at birth – DHS, MICS and o<strong>the</strong>r nationally representative sources.<br />
Underweight prevalence in children under 5 – DHS, MICS, o<strong>the</strong>r national household surveys, WHO and UNICEF.<br />
Diarrhoea treatment with oral rehydration salts (ORS) – DHS, MICS and o<strong>the</strong>r national household surveys.<br />
Primary school net attendance ratio – DHS, MICS and o<strong>the</strong>r national household surveys.<br />
Comprehensive knowledge <strong>of</strong> HIV – AIDS Indicator Surveys (AIS), DHS, MICS and o<strong>the</strong>r national household<br />
surveys; HIV/AIDS Survey Indicators Database, .<br />
Use <strong>of</strong> improved sanitation facilities – UNICEF and WHO Joint Monitoring Programme.<br />
Italicized disparity data are from different sources than <strong>the</strong> data for <strong>the</strong> same indicators presented<br />
elsewhere in <strong>the</strong> report: Table 2 (Nutrition – Underweight prevalence), Table 3 (Health – Diarrhoea<br />
treatment), Table 4 (HIV/AIDS – Comprehensive knowledge <strong>of</strong> HIV) and Table 8 (Women – Skilled<br />
attendant at birth).<br />
NOTES<br />
− Data not available.<br />
x Data refer to years or periods o<strong>the</strong>r than those specified in <strong>the</strong> column heading. Such data are not included in<br />
<strong>the</strong> calculation <strong>of</strong> regional and global averages, with <strong>the</strong> exception <strong>of</strong> 2005–2006 data from India. Estimates<br />
from data years prior to 2000 are not displayed.<br />
y Data differ from <strong>the</strong> standard definition or refer to only part <strong>of</strong> a country. If <strong>the</strong>y fall within <strong>the</strong> noted<br />
reference period, such data are included in <strong>the</strong> calculation <strong>of</strong> regional and global averages.<br />
† The WHO/UNICEF Joint Monitoring Programme For Water Supply and Sanitation (JMP) closed its databases<br />
for <strong>the</strong>se estimates before <strong>the</strong> cession <strong>of</strong> <strong>the</strong> Republic <strong>of</strong> South Sudan by <strong>the</strong> Republic <strong>of</strong> <strong>the</strong> Sudan.<br />
Aggregated data presented are for <strong>the</strong> Sudan pre-cession. Disaggregated data for <strong>the</strong> Sudan and South<br />
Sudan as separate <strong>State</strong>s will be published by <strong>the</strong> JMP in <strong>2013</strong>.<br />
* Data refer to <strong>the</strong> most recent year available during <strong>the</strong> period specified in <strong>the</strong> column heading.<br />
** Excludes China.<br />
STATISTICAL TABLES 147
TABLE 13: dISpARITIES By HOuSEHOLd WEALTH<br />
Countries<br />
Birth registration (%)<br />
2005–2011*<br />
ratio <strong>of</strong><br />
richest to poorest<br />
poorest 20%<br />
Skilled attendant at<br />
birth (%)<br />
2007–2012*<br />
ratio <strong>of</strong><br />
richest to poorest<br />
poorest 20%<br />
Underweight prevalence<br />
in children under 5 (%)<br />
2007–2011*<br />
ratio <strong>of</strong><br />
poorest to poorest<br />
richest 20%<br />
Diarrhoea treatment<br />
with oral rehydration<br />
salts (ORS) (%)<br />
2007−2012*<br />
ratio <strong>of</strong><br />
richest to poorest<br />
poorest 20%<br />
Primary school net<br />
attendance ratio<br />
2007−2011*<br />
ratio <strong>of</strong><br />
richest to poorest<br />
poorest 20%<br />
Comprehensive<br />
knowledge <strong>of</strong> HIV<br />
(%) Females 15−24<br />
2007−2011*<br />
ratio <strong>of</strong><br />
richest to poorest<br />
poorest 20%<br />
Comprehensive<br />
knowledge <strong>of</strong> HIV<br />
(%) Males 15−24<br />
2007−2011*<br />
and areas<br />
poorest richest<br />
richest<br />
richest<br />
richest<br />
richest<br />
richest<br />
richest<br />
20% 20%<br />
20%<br />
20%<br />
20%<br />
20%<br />
20%<br />
20%<br />
Afghanistan 31 58 1.9 16 76 4.9 – – – 56 52 0.9 – – – – – – – – –<br />
Albania 98 99 1.0 98 100 1.0 8 4 2.2 – – – 89 91 1.0 20 60 3.0 10 38 3.8<br />
Algeria – – – 88 x 98 x 1.1 x 5 x 2 x 2.4 x 15 x 19 x 1.2 x 93 x 98 x 1.1 x 5 x 20 x 3.7 x – – –<br />
Andorra – – – – – – – – – – – – – – – – – – – – –<br />
Angola 17 x 48 x 2.8 x – – – – – – – – – 63 78 1.2 – – – – – –<br />
Antigua and Barbuda – – – – – – – – – – – – – – – – – – – – –<br />
Argentina – – – – – – – – – – – – – – – – – – – – –<br />
Armenia 100 100 1.0 99 100 1.0 8 2 5.3 – – – – – – – – – – – –<br />
Australia – – – – – – – – – – – – – – – – – – – – –<br />
Austria – – – – – – – – – – – – – – – – – – – – –<br />
Azerbaijan 92 97 1.1 76 x 100 x 1.3 x 15 x 2 x 7.0 x 3 x 36 x 13.3 x 72 x 78 x 1.1 x 1 x 12 x 10.3 x 2 x 14 x 6.3 x<br />
Bahamas – – – – – – – – – – – – – – – – – – – – –<br />
Bahrain – – – – – – – – – – – – – – – – – – – – –<br />
Bangladesh 6 19 3.0 12 64 5.5 50 21 2.4 81 82 1.0 – – – – – – – – –<br />
Barbados – – – – – – – – – – – – – – – – – – – – –<br />
Belarus – – – 100 x 100 x 1.0 x 2 x 0 x 6.7 x – – – 96 x 94 x 1.0 x – – – – – –<br />
Belgium – – – – – – – – – – – – – – – – – – – – –<br />
Belize 95 97 1.0 – – – – – – – – – – – – 28 x 55 x 2.0 x – – –<br />
Benin 46 75 1.6 52 x 96 x 1.9 x 25 x 10 x 2.4 x 15 x 32 x 2.1 x 39 x 63 x 1.6 x 9 x 26 x 3.1 x 17 x 52 x 3.0 x<br />
Bhutan 100 100 1.0 34 95 2.8 16 7 2.2 60 56 0.9 85 94 1.1 7 32 4.4 – – –<br />
Bolivia (Plurinational<br />
<strong>State</strong> <strong>of</strong>) 68 y 90 y 1.3 y 38 99 2.6 8 2 3.8 31 35 1.1 95 97 1.0 5 40 8.4 11 45 4.3<br />
Bosnia and Herzegovina 99 100 1.0 99 x 100 x 1.0 x 2 x 3 x 0.5 x – – – 99 x 98 x 1.0 x 46 x 49 x 1.1 x – – –<br />
Botswana – – – 84 x 100 x 1.2 x 16 4 4.0 – – – – – – – – – – – –<br />
Brazil – – – – – – – – – – – – – – – – – – – – –<br />
Brunei Darussalam – – – – – – – – – – – – – – – – – – – – –<br />
Bulgaria – – – – – – – – – – – – – – – – – – – – –<br />
Burkina Faso 62 95 1.5 46 92 2.0 38 x 18 x 2.1 x 13 31 2.5 33 x 39 x 1.2 x 8 x 37 x 4.4 x – – –<br />
Burundi 64 87 1.4 51 81 1.6 41 17 2.4 35 42 1.2 64 87 1.4 – – – – – –<br />
Cambodia 48 78 1.6 49 97 2.0 35 16 2.2 32 34 1.1 79 y 86 y 1.1 y 28 58 2.1 30 64 2.1<br />
Cameroon 51 91 1.8 23 x 98 x 4.4 x – – – 5 x 34 x 6.8 x 50 x 87 x 1.7 x 12 x 50 x 4.0 x – – –<br />
Canada – – – – – – – – – – – – – – – – – – – – –<br />
Cape Verde – – – – – – – – – – – – – – – – – – – – –<br />
Central African Republic 46 85 1.8 33 87 2.6 26 19 1.4 11 28 2.5 31 x 48 x 1.5 x 14 23 1.6 19 33 1.7<br />
Chad 5 46 9.2 8 61 7.6 33 21 1.6 5 29 5.3 – – – 6 18 2.9 – – –<br />
Chile – – – – – – – – – – – – – – – – – – – – –<br />
China – – – – – – – – – – – – – – – – – – – – –<br />
Colombia – – – 84 99 1.2 6 2 3.0 47 61 1.3 90 93 1.0 15 32 2.2 – – –<br />
Comoros 72 x 93 x 1.3 x 49 x 77 x 1.6 x – – – 16 x 24 x 1.5 x 25 x 39 x 1.6 x – – – – – –<br />
Congo 69 y 91 y 1.3 y 40 x 95 x 2.4 x 16 x 5 x 3.1 x 13 x 18 x 1.4 x – – – 5 12 2.4 12 27 2.3<br />
Cook Islands – – – – – – – – – – – – – – – – – – – – –<br />
Costa Rica – – – – – – – – – – – – – – – – – – – – –<br />
Côte d’Ivoire 28 89 3.2 29 x 95 x 3.3 x 21 x,y 6 x,y 3.4 x,y 6 x 12 x 2.0 x 35 x 55 x 1.6 x – – – – – –<br />
Croatia – – – – – – – – – – – – – – – – – – – – –<br />
Cuba – – – – – – – – – – – – – – – – – – – – –<br />
Cyprus – – – – – – – – – – – – – – – – – – – – –<br />
Czech Republic – – – – – – – – – – – – – – – – – – – – –<br />
Democratic People’s<br />
Republic <strong>of</strong> Korea – – – – – – – – – – – – – – – – – – – – –<br />
Democratic<br />
Republic <strong>of</strong> <strong>the</strong> Congo 25 27 1.1 69 99 1.4 29 12 2.3 28 26 0.9 65 73 1.1 8 24 2.8 14 30 2.2<br />
Denmark – – – – – – – – – – – – – – – – – – – – –<br />
Djibouti – – – – – – – – – – – – – – – – – – – – –<br />
Dominica – – – – – – – – – – – – – – – – – – – – –<br />
Dominican Republic 61 93 1.5 95 99 1.0 5 1 4.4 41 38 0.9 92 98 1.1 31 46 1.5 21 41 2.0<br />
Ecuador – – – 99 x 98 x 1.0 x – – – – – – – – – – – – – – –<br />
Egypt 99 100 1.0 55 97 1.8 8 5 1.4 34 23 0.7 81 93 1.1 2 9 4.9 9 28 3.1<br />
El Salvador 98 99 1.0 91 98 1.1 12 y 1 y 12.9 y – – – – – – – – – – – –<br />
Equatorial Guinea – – – 47 x 85 x 1.8 x – – – 24 x 37 x 1.5 x – – – – – – – – –<br />
Eritrea – – – 7 x 81 x 12.1 x – – – – – – – – – – – – – – –<br />
Estonia – – – – – – – – – – – – – – – – – – – – –<br />
Ethiopia 3 18 7.0 2 46 26.8 36 15 2.4 18 45 2.5 52 86 1.7 – – – – – –<br />
Fiji – – – – – – – – – – – – – – – – – – – – –<br />
Finland – – – – – – – – – – – – – – – – – – – – –<br />
ratio <strong>of</strong><br />
richest to<br />
poorest<br />
148<br />
THE STATE OF THE WORLD’S CHILDREN <strong>2013</strong>: <strong>Children</strong> with Disabilities
TABLE 13<br />
dISpARITIES By HOuSEHOLd WEALTH<br />
Countries<br />
Birth registration (%)<br />
2005–2011*<br />
ratio <strong>of</strong><br />
richest to poorest<br />
poorest 20%<br />
Skilled attendant at<br />
birth (%)<br />
2007–2012*<br />
ratio <strong>of</strong><br />
richest to poorest<br />
poorest 20%<br />
Underweight prevalence<br />
in children under 5 (%)<br />
2007–2011*<br />
ratio <strong>of</strong><br />
poorest to poorest<br />
richest 20%<br />
Diarrhoea treatment<br />
with oral rehydration<br />
salts (ORS) (%)<br />
2007−2012*<br />
ratio <strong>of</strong><br />
richest to poorest<br />
poorest 20%<br />
Primary school net<br />
attendance ratio<br />
2007−2011*<br />
ratio <strong>of</strong><br />
richest to poorest<br />
poorest 20%<br />
Comprehensive<br />
knowledge <strong>of</strong> HIV<br />
(%) Females 15−24<br />
2007−2011*<br />
ratio <strong>of</strong><br />
richest to poorest<br />
poorest 20%<br />
Comprehensive<br />
knowledge <strong>of</strong> HIV<br />
(%) Males 15−24<br />
2007−2011*<br />
and areas<br />
poorest richest<br />
richest<br />
richest<br />
richest<br />
richest<br />
richest<br />
richest<br />
20% 20%<br />
20%<br />
20%<br />
20%<br />
20%<br />
20%<br />
20%<br />
France – – – – – – – – – – – – – – – – – – – – –<br />
Gabon 88 x 92 x 1.0 x – – – – – – – – – – – – – – – – – –<br />
Gambia 46 61 1.3 34 58 1.7 24 9 2.6 43 32 0.7 28 42 1.5 20 48 2.4 – – –<br />
Georgia 99 98 1.0 95 x 99 x 1.0 x – – – – – – 92 96 1.0 – – – – – –<br />
Germany – – – – – – – – – – – – – – – – – – – – –<br />
Ghana 47 82 1.7 39 98 2.5 19 9 2.2 45 34 0.7 61 86 1.4 17 34 2.1 23 50 2.1<br />
Greece – – – – – – – – – – – – – – – – – – – – –<br />
Grenada – – – – – – – – – – – – – – – – – – – – –<br />
Guatemala – – – 20 95 4.7 21 y 3 y 6.5 y 39 51 1.3 – – – 5 41 7.8 – – –<br />
Guinea 21 83 4.0 26 57 2.2 24 19 1.3 18 x 59 x 3.3 x – – – – – – – – –<br />
Guinea-Bissau 17 35 2.0 19 x 79 x 4.0 x 22 11 2.1 16 37 2.3 52 87 1.7 6 25 4.3 – – –<br />
Guyana 84 92 1.1 81 96 1.2 16 4 3.8 – – – 91 97 1.1 37 72 2.0 25 65 2.6<br />
Haiti 72 92 1.3 6 x 68 x 10.5 x 22 x 6 x 3.6 x 29 x 50 x 1.7 x – – – 18 x 41 x 2.2 x 28 x 52 x 1.9 x<br />
Holy See – – – – – – – – – – – – – – – – – – – – –<br />
Honduras 92 96 1.0 33 x 99 x 2.9 x 16 x 2 x 8.1 x 56 x 47 x 0.8 x 80 x 90 x 1.1 x 13 x 44 x 3.4 x – – –<br />
Hungary – – – – – – – – – – – – – – – – – – – – –<br />
Iceland – – – – – – – – – – – – – – – – – – – – –<br />
India 24 72 3.0 24 85 3.6 57 x 20 x 2.9 x 19 x 43 x 2.3 x – – – 4 x 45 x 11.7 x 15 x 55 x 3.8 x<br />
Indonesia 23 84 3.7 65 86 1.3 23 10 2.2 32 27 0.9 – – – 3 23 7.5 2 27 12.2<br />
Iran (Islamic Republic <strong>of</strong>) – – – – – – – – – – – – – – – – – – – – –<br />
Iraq – – – – – – – – – – – – – – – – – – – – –<br />
Ireland – – – – – – – – – – – – – – – – – – – – –<br />
Israel – – – – – – – – – – – – – – – – – – – – –<br />
Italy – – – – – – – – – – – – – – – – – – – – –<br />
Jamaica 96 99 1.0 97 98 1.0 – – – – – – – – – 54 69 1.3 – – –<br />
Japan – – – – – – – – – – – – – – – – – – – – –<br />
Jordan – – – 98 100 1.0 3 0 26.0 18 30 1.6 – – – – – – – – –<br />
Kazakhstan 100 100 1.0 100 x 100 x 1.0 x 5 x 2 x 2.8 x – – – 99 x 98 x 1.0 x 18 x 28 x 1.6 x – – –<br />
Kenya 48 80 1.7 20 81 4.0 25 9 2.8 40 37 0.9 58 78 1.3 29 61 2.1 42 68 1.6<br />
Kiribati 93 94 1.0 76 93 1.2 – – – – – – – – – 42 49 1.2 38 52 1.4<br />
Kuwait – – – – – – – – – – – – – – – – – – – – –<br />
Kyrgyzstan 94 95 1.0 93 x 100 x 1.1 x 2 x 2 x 0.8 x – – – 94 x 91 x 1.0 x 17 x 29 x 1.7 x – – –<br />
Lao People’s<br />
Democratic Republic 62 85 1.4 3 x 81 x 27.1 x 38 x 14 x 2.7 x 42 x 80 x 1.9 x 59 x 84 x 1.4 x – – – – – –<br />
Latvia – – – – – – – – – – – – – – – – – – – – –<br />
Lebanon – – – – – – – – – – – – – – – – – – – – –<br />
Lesotho 42 49 1.2 35 90 2.6 18 9 1.9 – – – 83 94 1.1 26 48 1.8 14 45 3.3<br />
Liberia 1 y 7 y 6.1 y 26 81 3.2 21 y 13 y 1.6 y 41 64 1.6 15 56 3.7 14 29 2.1 17 37 2.2<br />
Libya – – – – – – – – – – – – – – – – – – – – –<br />
Liechtenstein – – – – – – – – – – – – – – – – – – – – –<br />
Lithuania – – – – – – – – – – – – – – – – – – – – –<br />
Luxembourg – – – – – – – – – – – – – – – – – – – – –<br />
Madagascar 61 93 1.5 22 90 4.1 40 x 24 x 1.7 x 12 29 2.4 59 96 1.6 10 42 4.3 8 49 6.5<br />
Malawi – – – 63 89 1.4 17 13 1.3 67 73 1.1 71 x 90 x 1.3 x 34 55 1.6 35 54 1.5<br />
Malaysia – – – – – – – – – – – – – – – 23 48 2.0 – – –<br />
Maldives 92 94 1.0 89 99 1.1 24 11 2.3 – – – 82 82 1.0 9 19 2.0 – – –<br />
Mali 65 96 1.5 35 x 86 x 2.5 x 31 x 17 x 1.8 x 8 x 29 x 3.5 x 37 56 1.5 – – – – – –<br />
Malta – – – – – – – – – – – – – – – – – – – – –<br />
Marshall Islands 92 98 1.1 68 99 1.5 – – – – – – – – – 12 39 3.3 37 58 1.6<br />
Mauritania 28 83 2.9 21 95 4.6 – – – 10 34 3.2 41 59 1.5 0 12 29.5 4 27 6.2<br />
Mauritius – – – – – – – – – – – – – – – – – – – – –<br />
Mexico – – – – – – – – – – – – – – – – – – – – –<br />
Micronesia<br />
(Federated <strong>State</strong>s <strong>of</strong>) – – – – – – – – – – – – – – – – – – – – –<br />
Monaco – – – – – – – – – – – – – – – – – – – – –<br />
Mongolia 99 99 1.0 98 99 1.0 6 2 2.7 – – – 93 98 1.1 17 42 2.5 12 48 4.1<br />
Montenegro 94 99 1.0 98 x 100 x 1.0 x 4 x 1 x 4.1 x – – – 92 x 100 x 1.1 x – – – – – –<br />
Morocco – – – 30 x 95 x 3.2 x – – – 18 x 25 x 1.4 x 77 x 95 x 1.2 x – – – – – –<br />
Mozambique 20 48 2.4 37 89 2.4 – – – 40 50 1.3 72 80 1.1 41 43 1.1 16 45 2.7<br />
Myanmar 50 96 1.9 51 96 1.9 33 14 2.5 52 75 1.4 81 94 1.2 – – – – – –<br />
Namibia 46 92 2.0 60 98 1.6 22 7 3.1 50 59 1.2 88 97 1.1 61 69 1.1 55 67 1.2<br />
Nauru 71 88 1.2 97 98 1.0 7 3 2.7 – – – – – – 13 y 10 y 0.8 y – 25 y –<br />
Nepal 36 52 1.5 11 82 7.6 40 10 4.0 39 36 0.9 66 y 76 y 1.2 y 12 x 49 x 4.3 x 30 x 59 x 2.0 x<br />
Ne<strong>the</strong>rlands – – – – – – – – – – – – – – – – – – – – –<br />
ratio <strong>of</strong><br />
richest to<br />
poorest<br />
STATISTICAL TABLES 149
TABLE 13<br />
dISpARITIES By HOuSEHOLd WEALTH<br />
Countries<br />
and areas<br />
Birth registration (%)<br />
2005–2011*<br />
poorest<br />
20%<br />
richest<br />
20%<br />
ratio <strong>of</strong><br />
richest to poorest<br />
poorest 20%<br />
Skilled attendant at<br />
birth (%)<br />
2007–2012*<br />
richest<br />
20%<br />
ratio <strong>of</strong><br />
richest to poorest<br />
poorest 20%<br />
Underweight prevalence<br />
in children under 5 (%)<br />
2007–2011*<br />
richest<br />
20%<br />
ratio <strong>of</strong><br />
poorest to poorest<br />
richest 20%<br />
Diarrhoea treatment<br />
with oral rehydration<br />
salts (ORS) (%)<br />
2007−2012*<br />
Primary school net<br />
attendance ratio<br />
2007−2011*<br />
Comprehensive<br />
knowledge <strong>of</strong> HIV<br />
(%) Females 15−24<br />
2007−2011*<br />
Comprehensive<br />
knowledge <strong>of</strong> HIV<br />
(%) Males 15−24<br />
2007−2011*<br />
New Zealand – – – – – – – – – – – – – – – – – – – – –<br />
Nicaragua 72 y 93 y 1.3 y 42 99 2.4 9 1 6.6 53 64 1.2 – – – – – – – – –<br />
Niger 20 y 67 y 3.3 y 5 x 59 x 11.8 x – – – 14 x 32 x 2.3 x 26 x 32 x 1.2 x 5 x 30 x 6.5 x 6 x 34 x 5.8 x<br />
Nigeria 9 62 7.0 8 86 10.3 35 10 3.5 15 53 3.5 31 72 2.4 9 34 3.6 18 41 2.2<br />
Niue – – – – – – – – – – – – – – – – – – – – –<br />
Norway – – – – – – – – – – – – – – – – – – – – –<br />
Oman – – – – – – – – – – – – – – – – – – – – –<br />
Pakistan 18 38 2.1 16 77 4.8 – – – 41 44 1.1 42 74 1.8 – – – – – –<br />
Palau – – – – – – – – – – – – – – – – – – – – –<br />
Panama – – – – – – – – – – – – – – – – – – – – –<br />
Papua New Guinea – – – – – – – – – – – – – – – – – – – – –<br />
Paraguay – – – – – – – – – – – – – – – – – – – – –<br />
Peru – – – 56 100 1.8 9 1 15.7 27 42 1.6 92 97 1.1 – – – – – –<br />
Philippines – – – 26 94 3.7 – – – 37 55 1.5 – – – 14 26 1.8 – – –<br />
Poland – – – – – – – – – – – – – – – – – – – – –<br />
Portugal – – – – – – – – – – – – – – – – – – – – –<br />
Qatar – – – – – – – – – – – – – – – – – – – – –<br />
Republic <strong>of</strong> Korea – – – – – – – – – – – – – – – – – – – – –<br />
Republic <strong>of</strong> Moldova 97 x 98 x 1.0 x 99 x 100 x 1.0 x 5 x 1 x 8.2 x – – – – – – – – – – – –<br />
Romania – – – – – – – – – – – – – – – – – – – – –<br />
Russian Federation – – – – – – – – – – – – – – – – – – – – –<br />
Rwanda 58 64 1.1 61 86 1.4 16 5 3.0 22 37 1.7 80 94 1.2 – – – – – –<br />
Saint Kitts and Nevis – – – – – – – – – – – – – – – – – – – – –<br />
Saint Lucia – – – – – – – – – – – – – – – – – – – – –<br />
Saint Vincent<br />
and <strong>the</strong> Grenadines – – – – – – – – – – – – – – – – – – – – –<br />
Samoa 31 63 2.1 66 95 1.4 – – – – – – 85 y 91 y 1.1 y 3 3 1.0 3 9 2.7<br />
San Marino – – – – – – – – – – – – – – – – – – – – –<br />
Sao Tome and Principe 74 86 1.1 74 93 1.3 18 7 2.6 – – – 75 95 1.3 27 56 2.0 39 55 1.4<br />
Saudi Arabia – – – – – – – – – – – – – – – – – – – – –<br />
Senegal 50 94 1.9 30 96 3.2 24 10 2.4 21 31 1.5 47 78 1.7 – – – – – –<br />
Serbia 97 100 1.0 99 100 1.0 3 2 1.4 – – – 96 98 1.0 28 69 2.4 28 66 2.4<br />
Seychelles – – – – – – – – – – – – – – – – – – – – –<br />
Sierra Leone 74 88 1.2 44 85 1.9 22 15 1.4 75 70 0.9 59 88 1.5 14 36 2.6 – – –<br />
Singapore – – – – – – – – – – – – – – – – – – – – –<br />
Slovakia – – – – – – – – – – – – – – – – – – – – –<br />
Slovenia – – – – – – – – – – – – – – – – – – – – –<br />
Solomon Islands – – – 74 95 1.3 14 10 1.4 – – – 58 y 61 y 1.1 y 17 37 2.1 35 50 1.5<br />
Somalia 1 7 6.6 11 x 77 x 7.2 x 42 x 14 x 3.0 x 7 x 31 x 4.8 x 3 x 40 x 12.5 x 1 x 8 x 13.5 x – – –<br />
South Africa – – – – – – – – – – – – – – – – – – – – –<br />
South Sudan s 21 57 2.7 8 41 5.1 32 21 1.6 27 52 1.9 12 58 4.7 3 18 6.1 – – –<br />
Spain – – – – – – – – – – – – – – – – – – – – –<br />
Sri Lanka 97 98 1.0 97 99 1.0 29 11 2.6 – – – – – – – – – – – –<br />
<strong>State</strong> <strong>of</strong> Palestine – – – 98 x 100 x 1.0 x – – – – – – – – – – – – – – –<br />
Sudan s 26 98 3.8 6 59 10.5 40 17 2.4 21 16 0.7 55 97 1.8 1 11 13.6 – – –<br />
Suriname 94 98 1.0 81 x 96 x 1.2 x 9 x 5 x 1.8 x – – – 88 x 97 x 1.1 x 23 x 54 x 2.4 x – – –<br />
Swaziland 39 73 1.9 65 94 1.4 8 4 2.3 58 60 1.0 95 99 1.0 49 72 1.5 44 64 1.5<br />
Sweden – – – – – – – – – – – – – – – – – – – – –<br />
Switzerland – – – – – – – – – – – – – – – – – – – – –<br />
Syrian Arab Republic 92 99 1.1 78 x 99 x 1.3 x 10 x 7 x 1.5 x 45 x 59 x 1.3 x – – – 4 x 10 x 2.9 x – – –<br />
Tajikistan 89 86 1.0 90 90 1.0 17 13 1.3 52 x 50 x 1.0 x 96 y 96 y 1.0 y – – – – – –<br />
Thailand 99 100 1.0 93 x 100 x 1.1 x 11 x 3 x 3.3 x 56 x 54 x 1.0 x 97 x 98 x 1.0 x 47 x 43 x 0.9 x – – –<br />
The former Yugoslav<br />
Republic <strong>of</strong> Macedonia 99 100 1.0 98 98 1.0 2 0 – – – – 97 99 1.0 9 x 45 x 5.0 x – – –<br />
Timor-Leste 50 56 1.1 10 69 6.9 49 35 1.4 70 71 1.0 60 83 1.4 9 16 1.8 11 35 3.0<br />
Togo 59 97 1.7 28 94 3.4 21 9 2.5 8 19 2.5 80 92 1.2 18 42 2.3 20 55 2.7<br />
Tonga – – – – – – – – – – – – – – – – – – – – –<br />
Trinidad and Tobago 94 98 1.0 98 100 1.0 – – – – – – 95 x 99 x 1.0 x 48 x 62 x 1.3 x – – –<br />
Tunisia – – – – – – – – – – – – – – – – – – – – –<br />
Turkey 89 99 1.1 73 100 1.4 4 1 8.4 – – – 87 y 95 y 1.1 y – – – – – –<br />
Turkmenistan 94 97 1.0 99 x 100 x 1.0 x 8 x 2 x 3.2 x 45 x 30 x 0.7 x – – – 3 x 8 x 2.8 x – – –<br />
Tuvalu 39 71 1.8 99 98 1.0 1 0 – – – – – – – 34 y 39 1.2 y – 67 y –<br />
Uganda 27 44 1.6 43 88 2.0 – – – 43 45 1.1 – – – 20 x 47 x 2.3 x 28 x 47 x 1.6 x<br />
Ukraine 100 100 1.0 97 99 1.0 – – – – – – 78 75 1.0 33 45 1.4 28 42 1.5<br />
richest<br />
20%<br />
ratio <strong>of</strong><br />
richest to poorest<br />
poorest 20%<br />
richest<br />
20%<br />
ratio <strong>of</strong><br />
richest to poorest<br />
poorest 20%<br />
richest<br />
20%<br />
ratio <strong>of</strong><br />
richest to poorest<br />
poorest 20%<br />
richest<br />
20%<br />
ratio <strong>of</strong><br />
richest to<br />
poorest<br />
150<br />
THE STATE OF THE WORLD’S CHILDREN <strong>2013</strong>: <strong>Children</strong> with Disabilities
TABLE 13<br />
dISpARITIES By HOuSEHOLd WEALTH<br />
Countries<br />
and areas<br />
Birth registration (%)<br />
2005–2011*<br />
poorest<br />
20%<br />
richest<br />
20%<br />
ratio <strong>of</strong><br />
richest to poorest<br />
poorest 20%<br />
Skilled attendant at<br />
birth (%)<br />
2007–2012*<br />
richest<br />
20%<br />
ratio <strong>of</strong><br />
richest to poorest<br />
poorest 20%<br />
Underweight prevalence<br />
in children under 5 (%)<br />
2007–2011*<br />
richest<br />
20%<br />
ratio <strong>of</strong><br />
poorest to poorest<br />
richest 20%<br />
Diarrhoea treatment<br />
with oral rehydration<br />
salts (ORS) (%)<br />
2007−2012*<br />
Primary school net<br />
attendance ratio<br />
2007−2011*<br />
Comprehensive<br />
knowledge <strong>of</strong> HIV<br />
(%) Females 15−24<br />
2007−2011*<br />
Comprehensive<br />
knowledge <strong>of</strong> HIV<br />
(%) Males 15−24<br />
2007−2011*<br />
United Arab Emirates – – – – – – – – – – – – – – – – – – – – –<br />
United Kingdom – – – – – – – – – – – – – – – – – – – – –<br />
United Republic <strong>of</strong> Tanzania 4 56 12.7 31 90 2.9 22 9 2.3 41 38 0.9 68 93 1.4 39 55 1.4 34 56 1.7<br />
United <strong>State</strong>s – – – – – – – – – – – – – – – – – – – – –<br />
Uruguay – – – – – – – – – – – – – – – – – – – – –<br />
Uzbekistan 100 100 1.0 100 x 100 x 1.0 x 5 x 3 x 1.5 x – – – 94 x 96 x 1.0 x 25 x 33 x 1.3 x – – –<br />
Vanuatu 13 41 3.1 55 90 1.6 12 10 1.2 – – – 74 76 1.0 9 23 2.7 – – –<br />
Venezuela<br />
(Bolivarian Republic <strong>of</strong>) 87 x 95 x 1.1 x 95 x 92 x 1.0 x – – – 39 x 55 x 1.4 x 86 x 99 x 1.2 x – – – – – –<br />
Viet Nam 87 98 1.1 72 99 1.4 21 3 6.6 – – – 95 99 1.0 38 68 1.8 – – –<br />
Yemen 5 50 9.3 17 x 74 x 4.3 x – – – 31 x 37 x 1.2 x 44 x 73 x 1.6 x 0 x 4 x – – – –<br />
Zambia 5 31 5.8 27 91 3.4 16 11 1.5 61 61 1.0 73 96 1.3 24 48 2.0 24 51 2.1<br />
Zimbabwe 35 75 2.1 48 91 1.9 – – – 18 28 1.6 84 91 1.1 31 x 52 x 1.7 x 37 x 51 x 1.4 x<br />
MEMORANDUM<br />
Sudan and South Sudan s – – – – – – – – – – – – – – – – – – – – –<br />
richest<br />
20%<br />
ratio <strong>of</strong><br />
richest to poorest<br />
poorest 20%<br />
richest<br />
20%<br />
ratio <strong>of</strong><br />
richest to poorest<br />
poorest 20%<br />
richest<br />
20%<br />
ratio <strong>of</strong><br />
richest to poorest<br />
poorest 20%<br />
richest<br />
20%<br />
ratio <strong>of</strong><br />
richest to<br />
poorest<br />
SUMMARY INDICATORS #<br />
Sub-Saharan Africa 25 60 2.4 27 82 3.0 30 12 2.5 27 42 1.5 53 80 1.5 16 36 2.2 22 45 2.0<br />
Eastern and<br />
Sou<strong>the</strong>rn Africa 23 50 2.2 28 77 2.7 26 12 2.2 34 44 1.3 62 86 1.4 – – – – – –<br />
West and Central Africa 26 65 2.5 28 88 3.1 31 11 2.7 21 42 2.0 43 73 1.7 10 30 3.0 17 38 2.2<br />
Middle East and<br />
North Africa – – – – – – – – – – – – – – – – – – – – –<br />
South Asia 23 63 2.7 22 82 3.7 55 19 2.8 29 46 1.6 – – – 4 44 11.7 15 55 3.8<br />
East Asia and <strong>the</strong> Pacific 48 ** 89 ** 1.9 ** 54 ** 92 ** 1.7 ** 24 ** 10 ** 2.5 ** 36 ** 41 ** 1.1 ** – – – 14 ** 35 ** 2.4 ** – – –<br />
Latin America<br />
and Caribbean – – – – – – – – – – – – – – – – – – – – –<br />
CEE/CIS 94 98 1.0 – – – – – – – – – – – – – – – – – –<br />
Least developed countries 25 52 2.1 30 78 2.6 33 15 2.3 40 47 1.2 61 83 1.4 – – – – – –<br />
World 32 ** 68 ** 2.1 ** 31 ** 85 ** 2.7 ** 39 ** 14 ** 2.7 ** 29 ** 44 ** 1.5 ** – – – – – – – – –<br />
s Due to <strong>the</strong> cession in July 2011 <strong>of</strong> <strong>the</strong> Republic <strong>of</strong> South Sudan by <strong>the</strong> Republic <strong>of</strong> <strong>the</strong> Sudan, and its subsequent admission to <strong>the</strong> United Nations on 14 July 2011, disaggregated data for <strong>the</strong> Sudan<br />
and South Sudan as separate <strong>State</strong>s are not yet available for all indicators. Aggregated data presented are for <strong>the</strong> Sudan pre-cession (see Memorandum item).<br />
# For a complete list <strong>of</strong> countries and areas in <strong>the</strong> regions, subregions and country categories, see page 98.<br />
DEFINITIONS OF THE INDICATORS<br />
Birth registration – Percentage <strong>of</strong> children under age 5 who were registered<br />
at <strong>the</strong> moment <strong>of</strong> <strong>the</strong> survey. This includes children whose birth certificate was<br />
seen by <strong>the</strong> interviewer or whose mo<strong>the</strong>r or caretaker says <strong>the</strong> birth has been<br />
registered.<br />
Skilled attendant at birth – Percentage <strong>of</strong> births attended by skilled health<br />
personnel (doctor, nurse or midwife).<br />
Underweight prevalence in children under 5 – Percentage <strong>of</strong> children<br />
under age 5 who are below minus two standard deviations from median weightfor-age<br />
<strong>of</strong> <strong>the</strong> World Health Organization (WHO) Child Growth Standards.<br />
Diarrhoea treatment with oral rehydration salts (ORS) – Percentage<br />
<strong>of</strong> children under age 5 who had diarrhoea in <strong>the</strong> two weeks preceding <strong>the</strong><br />
survey and who received oral rehydration salts (ORS packets or pre-packaged<br />
ORS fluids).<br />
Primary school net attendance ratio – Number <strong>of</strong> children attending<br />
primary or secondary school who are <strong>of</strong> <strong>of</strong>ficial primary school age, expressed<br />
as a percentage <strong>of</strong> <strong>the</strong> total number <strong>of</strong> children <strong>of</strong> <strong>of</strong>ficial primary school age.<br />
Because <strong>of</strong> <strong>the</strong> inclusion <strong>of</strong> primary-school-aged children attending secondary<br />
school, this indicator can also be referred to as a primary adjusted net<br />
attendance ratio.<br />
Comprehensive knowledge <strong>of</strong> HIV – Percentage <strong>of</strong> young men and women<br />
(aged 15–24) who correctly identify <strong>the</strong> two major ways <strong>of</strong> preventing <strong>the</strong><br />
sexual transmission <strong>of</strong> HIV (using condoms and limiting sex to one faithful,<br />
uninfected partner), who reject <strong>the</strong> two most common local misconceptions<br />
about HIV transmission and who know that a healthy-looking person can be<br />
HIV-positive.<br />
MAIN DATA SOURCES<br />
Birth registration – Demographic and Health Surveys (DHS), Multiple Indicator Cluster Surveys (MICS), o<strong>the</strong>r<br />
national surveys and vital registration systems.<br />
Skilled attendant at birth – DHS, MICS and o<strong>the</strong>r nationally representative sources.<br />
Underweight prevalence in children under 5 – DHS, MICS, o<strong>the</strong>r national household surveys, WHO<br />
and UNICEF.<br />
Diarrhoea treatment with oral rehydration salts (ORS) – DHS, MICS and o<strong>the</strong>r national household surveys.<br />
Primary school attendance – DHS, MICS and o<strong>the</strong>r national household surveys.<br />
Comprehensive knowledge <strong>of</strong> HIV – AIDS Indicator Surveys (AIS), DHS, MICS and o<strong>the</strong>r national household<br />
surveys; HIV/AIDS Survey Indicators Database, .<br />
Italicized disparity data are from different sources than <strong>the</strong> data for <strong>the</strong> same indicators presented<br />
elsewhere in <strong>the</strong> report: Table 2 (Nutrition – Underweight prevalence), Table 3 (Health – Diarrhoea<br />
treatment), Table 4 (HIV/AIDS – Comprehensive knowledge <strong>of</strong> HIV) and Table 8 (Women – Skilled<br />
attendant at birth).<br />
NOTES<br />
− Data not available.<br />
x Data refer to years or periods o<strong>the</strong>r than those specified in <strong>the</strong> column heading. Such data are not included in<br />
<strong>the</strong> calculation <strong>of</strong> regional and global averages, with <strong>the</strong> exception <strong>of</strong> 2005–2006 data from India. Estimates<br />
from data years prior to 2000 are not displayed.<br />
y Data differ from <strong>the</strong> standard definition or refer to only part <strong>of</strong> a country. If <strong>the</strong>y fall within <strong>the</strong> noted<br />
reference period, such data are included in <strong>the</strong> calculation <strong>of</strong> regional and global averages.<br />
* Data refer to <strong>the</strong> most recent year available during <strong>the</strong> period specified in <strong>the</strong> column heading.<br />
** Excludes China.<br />
STATISTICAL TABLES 151
TABLE 14: EARLy CHILdHOOd dEVELOpmENT<br />
Countries<br />
and areas<br />
Attendance in early childhood education<br />
2005–2011*<br />
total male female<br />
poorest<br />
20%<br />
Adult support for learning ++<br />
2005–2011*<br />
richest<br />
poorest richest<br />
20% total male female 20%<br />
Fa<strong>the</strong>r’s<br />
support for<br />
learning ++<br />
20% 2005–2011* total<br />
Learning materials at home<br />
2005−2011* <strong>Children</strong> left in inadequate care<br />
<strong>Children</strong>’s books Playthings++<br />
2005−2011*<br />
Afghanistan 1 1 1 0 4 73 74 73 72 80 62 2 1 5 53 52 57 40 42 39 43 27<br />
Albania 40 39 42 26 60 86 85 87 68 96 53 32 16 52 53 57 48 13 14 11 9 16<br />
Bangladesh 15 14 15 11 16 61 61 60 42 85 53 – – – – – – – – – – –<br />
Belarus 86 87 85 – – 97 97 96 95 98 72 – – – – – – – – – – –<br />
Belize 32 30 34 16 59 86 88 83 73 94 50 40 17 73 57 55 58 2 3 2 4 1<br />
Bhutan 10 10 10 3 27 54 52 57 40 73 51 6 1 24 52 36 60 14 13 15 17 7<br />
Bosnia and Herzegovina 6 5 8 1 15 83 83 83 74 90 74 70 52 88 43 49 43 7 7 6 6 10<br />
Botswana 18 – – – – – – – – – – – – – – – – – – – – –<br />
Burkina Faso 2 3 1 0 9 14 14 14 12 26 24 – – – – – – – – – – –<br />
Burundi 5 5 5 4 10 34 35 34 32 38 20 – – – – – – – – – – –<br />
Cameroon 22 22 22 3 56 58 57 59 57 69 39 8 3 22 57 62 46 36 36 36 45 25<br />
Central African Republic 5 5 6 2 17 74 74 74 70 78 42 1 0 3 49 41 51 61 60 62 58 60<br />
Chad 5 5 4 1 16 70 69 70 64 71 29 1 0 2 43 38 50 56 57 56 58 56<br />
Côte d’Ivoire 6 5 6 1 24 50 50 51 55 57 40 5 3 13 39 44 35 59 60 58 62 51<br />
Democratic People’s<br />
Republic <strong>of</strong> Korea 98 98 97 – – 91 88 93 – – 75 79 – – 47 – – 17 17 16 – –<br />
Democratic Republic<br />
<strong>of</strong> <strong>the</strong> Congo 5 5 5 2 18 61 61 62 62 76 36 1 0 2 29 21 40 60 60 60 69 39<br />
Djibouti 14 12 16 – – 36 36 35 – – 23 15 – – 24 – – 12 11 13 – –<br />
Gambia 18 17 19 13 33 48 49 47 50 56 21 1 0 5 42 29 49 21 22 19 25 18<br />
Georgia 43 44 42 17 70 93 93 93 85 99 61 72 48 91 38 41 41 8 8 8 7 8<br />
Ghana 68 65 72 42 97 40 38 42 23 78 30 6 1 23 41 31 51 21 21 21 27 15<br />
Guinea-Bissau 10 10 10 4 26 – – – – – – – – – – – – – – – – –<br />
Guyana 49 48 50 33 78 89 88 89 77 99 52 54 28 86 65 67 60 11 13 10 19 6<br />
Iraq 3 2 3 – – 58 59 57 – – 60 – – – – – – – – – – –<br />
Jamaica 86 84 88 – – 94 95 93 – – 41 57 – – 71 – – 4 4 3 – –<br />
Kazakhstan 37 36 38 19 61 92 92 91 84 96 49 48 24 76 45 40 49 4 4 4 5 4<br />
Kyrgyzstan 19 21 17 7 47 88 90 85 86 99 54 76 76 85 57 59 54 11 12 9 11 6<br />
Lao People’s Democratic<br />
Republic 7 8 7 1 44 33 33 34 20 59 24 3 1 11 57 54 40 26 26 25 33 17<br />
Lebanon 62 63 60 – – 56 y 58 y 54 y – – 74 y 29 – – 16 y – – 9 8 10 – –<br />
Mali 10 10 10 1 40 29 27 30 28 44 14 0 0 2 40 33 49 33 33 33 33 36<br />
Mauritania 5 5 5 2 11 48 48 47 39 64 30 – – – – – – – – – – –<br />
Mongolia 60 58 61 26 83 59 56 62 44 73 41 23 6 48 68 74 62 9 9 8 10 6<br />
Montenegro 29 28 30 6 62 97 96 98 88 100 79 77 50 92 39 49 33 6 8 5 11 3<br />
Morocco 39 36 41 6 78 48 y 47 y 49 y 35 y 68 y 56 y 21 y 9 y 52 y 14 y 19 y 7 y 9 9 9 11 6<br />
Mozambique – – – – – 47 45 48 48 50 20 3 2 10 – – – 33 33 32 – –<br />
Myanmar 23 23 23 8 46 58 y 58 y 58 y 42 y 76 y 44 y – – – – – – – – – – –<br />
Nepal 30 y 29 y 31 y 14 y 61 y – – – – – – – – – – – – – – – – –<br />
Nigeria 32 32 32 5 70 78 78 78 68 91 38 14 2 35 35 25 42 38 38 37 41 32<br />
Sao Tome and Principe 27 29 26 18 51 – – – – – – – – – – – – – – – – –<br />
Senegal 22 y 23 y 21 y 7 y 43 y – – – – – – – – – – – – – – – – –<br />
Serbia 44 41 47 22 75 95 96 95 84 98 78 76 49 86 63 65 60 1 1 1 2 1<br />
Sierra Leone 14 13 15 5 42 54 53 55 45 79 42 2 0 10 35 24 50 32 33 32 29 28<br />
Somalia 2 2 2 1 6 79 80 79 76 85 48 – – – – – – – – – – –<br />
South Sudan 6 6 6 2 13 – – – – – – – – – – – – – – – – –<br />
Sudan 20 20 21 10 48 – – – – – – – – – – – – – – – – –<br />
Suriname 39 37 40 17 63 75 75 76 61 92 31 45 20 75 64 67 63 7 6 8 13 1<br />
Swaziland 33 32 34 36 50 50 50 50 35 71 10 4 1 12 69 64 74 15 15 15 20 9<br />
Syrian Arab Republic 8 8 7 4 18 70 70 69 52 84 62 30 12 53 52 52 51 17 17 17 22 15<br />
Tajikistan 10 11 10 1 29 74 73 74 56 86 23 17 4 33 46 43 44 13 13 12 15 11<br />
Thailand 61 60 61 55 78 89 90 89 86 98 57 43 25 71 55 58 49 13 14 13 18 7<br />
The former Yugoslav<br />
Republic <strong>of</strong> Macedonia 22 25 19 0 59 92 92 91 81 97 71 52 19 83 71 70 79 5 5 5 10 1<br />
poorest<br />
20%<br />
richest<br />
20% total<br />
poorest<br />
20%<br />
richest<br />
poorest richest<br />
20% total male female 20% 20%<br />
152<br />
THE STATE OF THE WORLD’S CHILDREN <strong>2013</strong>: <strong>Children</strong> with Disabilities
TABLE 14<br />
EARLy CHILdHOOd dEVELOpmENT<br />
Countries<br />
and areas<br />
Attendance in early childhood education<br />
2005–2011*<br />
total male female<br />
poorest<br />
20%<br />
Adult support for learning ++<br />
2005–2011*<br />
richest<br />
poorest richest<br />
20% total male female 20%<br />
Fa<strong>the</strong>r’s<br />
support for<br />
learning ++<br />
20% 2005–2011* total<br />
Learning materials at home<br />
2005−2011* <strong>Children</strong> left in inadequate care<br />
<strong>Children</strong>’s books Playthings++<br />
2005−2011*<br />
Togo 29 27 31 10 52 62 61 63 55 68 38 2 0 7 31 26 41 41 42 41 45 35<br />
Trinidad and Tobago 75 74 76 65 87 98 98 98 96 100 63 81 66 93 65 63 72 1 1 1 2 0<br />
Ukraine 63 63 63 30 74 – – – – – – 97 93 99 47 36 47 10 11 10 15 4<br />
Uzbekistan 20 20 19 5 46 91 91 90 83 95 54 43 32 59 67 74 62 5 5 5 6 7<br />
Viet Nam 72 71 73 59 91 77 74 80 63 94 61 20 3 49 49 41 54 9 10 9 17 4<br />
Yemen 3 3 3 0 8 33 34 32 16 56 37 10 4 31 49 45 49 34 36 33 46 22<br />
poorest<br />
20%<br />
richest<br />
20% total<br />
poorest<br />
20%<br />
richest<br />
poorest richest<br />
20% total male female 20% 20%<br />
SUMMARY INDICATORS #<br />
Sub-Saharan Africa 21 21 21 6 47 – – – – – – – – – – – – – – – – –<br />
Eastern and<br />
Sou<strong>the</strong>rn Africa – – – – – – – – – – – – – – – – – – – – – –<br />
West and Central Africa 22 22 23 6 49 63 63 63 57 77 35 8 1 21 36 29 43 43 43 43 47 34<br />
Middle East<br />
and North Africa – – – – – – – – – – – – – – – – – – – – – –<br />
South Asia – – – – – – – – – – – – – – – – – – – – – –<br />
East Asia and Pacific – – – – – – – – – – – – – – – – – – – – – –<br />
Latin America<br />
and Caribbean – – – – – – – – – – – – – – – – – – – – – –<br />
CEE/CIS – – – – – – – – – – – – – – – – – – – – – –<br />
Least developed countries 11 11 12 6 24 – – – – – – – – – – – – – – – – –<br />
World – – – – – – – – – – – – – – – – – – – – – –<br />
# For a complete list <strong>of</strong> countries and areas in <strong>the</strong> regions, subregions and country categories, see page 98.<br />
DEFINITIONS OF THE INDICATORS<br />
Attendance in early childhood education – Percentage <strong>of</strong> children 36–59 months old who<br />
are attending an early childhood education programme.<br />
Adult support for learning – Percentage <strong>of</strong> children 36–59 months old with whom an adult<br />
has engaged in four or more <strong>of</strong> <strong>the</strong> following activities to promote learning and school readiness<br />
in <strong>the</strong> past three days: a) reading books to <strong>the</strong> child, b) telling stories to <strong>the</strong> child, c) singing<br />
songs to <strong>the</strong> child, d) taking <strong>the</strong> child outside <strong>the</strong> home, e) playing with <strong>the</strong> child and f) naming,<br />
counting or drawing things with <strong>the</strong> child.<br />
Fa<strong>the</strong>r’s support for learning – Percentage <strong>of</strong> children 36–59 months old whose fa<strong>the</strong>r has<br />
engaged in one or more <strong>of</strong> <strong>the</strong> following activities to promote learning and school readiness<br />
in <strong>the</strong> past three days: a) reading books to <strong>the</strong> child, b) telling stories to <strong>the</strong> child, c) singing<br />
songs to <strong>the</strong> child, d) taking <strong>the</strong> child outside <strong>the</strong> home, e) playing with <strong>the</strong> child and f) naming,<br />
counting or drawing things with <strong>the</strong> child.<br />
Learning materials at home: children’s books – Percentage <strong>of</strong> children 0–59 months old<br />
who have three or more children’s books at home.<br />
Learning materials at home: playthings – Percentage <strong>of</strong> children 0–59 months old with two<br />
or more <strong>of</strong> <strong>the</strong> following playthings at home: household objects or objects found outside (sticks,<br />
rocks, animals, shells, leaves, etc.), homemade toys or toys that came from a store.<br />
<strong>Children</strong> left in inadequate care – Percentage <strong>of</strong> children 0–59 months old left alone or in<br />
<strong>the</strong> care <strong>of</strong> ano<strong>the</strong>r child younger than 10 years <strong>of</strong> age for more than one hour at least once in<br />
<strong>the</strong> past week.<br />
MAIN DATA SOURCES<br />
Attendance in early childhood education – Multiple Indicator Cluster Surveys (MICS),<br />
Demographic and Health Surveys (DHS) and o<strong>the</strong>r national surveys.<br />
Adult support for learning – MICS and o<strong>the</strong>r national surveys.<br />
Fa<strong>the</strong>r’s support for learning – MICS and o<strong>the</strong>r national surveys.<br />
Learning materials at home: children’s books – MICS and o<strong>the</strong>r national surveys.<br />
Learning materials at home: playthings – MICS and o<strong>the</strong>r national surveys.<br />
<strong>Children</strong> left in inadequate care – MICS and o<strong>the</strong>r national surveys.<br />
NOTES<br />
– Data not available.<br />
y Data differ from <strong>the</strong> standard definition or refer to only part <strong>of</strong> a country. If <strong>the</strong>y fall within <strong>the</strong><br />
noted reference period, such data are included in <strong>the</strong> calculation <strong>of</strong> regional and global averages.<br />
* Data refer to <strong>the</strong> most recent year available during <strong>the</strong> period specified in <strong>the</strong> column heading.<br />
++ Changes in <strong>the</strong> definitions <strong>of</strong> several ECD indicators were made between <strong>the</strong> third and fourth<br />
rounds <strong>of</strong> MICS (MICS3 and MICS4). In order to allow for comparability with MICS4, data from<br />
MICS3 for <strong>the</strong> adult support for learning, fa<strong>the</strong>r’s support for learning and learning materials<br />
at home (playthings) indicators were recalculated according to MICS4 indicator definitions.<br />
Therefore, <strong>the</strong> recalculated data presented here will differ from estimates reported in MICS3<br />
national reports.<br />
STATISTICAL TABLES 153
Conventions, optional protocols,<br />
signatures and ratifications<br />
A note on terms used in this report<br />
A Convention is a formal agreement between <strong>State</strong>s parties. The term ‘Convention’ is used (ra<strong>the</strong>r than its<br />
synonym, ‘treaty’) to denote a multilateral instrument with a large number <strong>of</strong> <strong>State</strong>s parties, including one<br />
open to participation by <strong>the</strong> international community as a whole and negotiated under <strong>the</strong> auspices <strong>of</strong> an<br />
international organization.<br />
An Optional protocol to a Convention is a legal instrument intended to supplement <strong>the</strong> original agreement<br />
by establishing additional rights or obligations. It may be used to address in greater detail a matter<br />
mentioned in <strong>the</strong> original agreement, to speak to a new concern relevant to any <strong>of</strong> its topics, or to add<br />
procedures for operation or enforcement. Such a protocol is optional in <strong>the</strong> sense that <strong>State</strong>s parties to a<br />
Convention are not automatically bound by its provisions, but must ratify it independently. Thus, a <strong>State</strong><br />
may be party to a Convention but not to its Optional Protocols.<br />
The process by which a <strong>State</strong> becomes party to a Convention comprises, in most cases, two steps:<br />
signature and ratification.<br />
By signing a Convention, a <strong>State</strong> indicates its intention to take steps to examine <strong>the</strong> Convention and<br />
its compatibility with domestic law. A signature does not create a legal obligation to be bound by a<br />
Convention’s provisions; however, it does indicate that a <strong>State</strong> will act in good faith and will not take<br />
actions that would undermine <strong>the</strong> purpose <strong>of</strong> <strong>the</strong> Convention.<br />
Ratification is <strong>the</strong> concrete action by which a <strong>State</strong> agrees to be legally bound by <strong>the</strong> terms <strong>of</strong> a<br />
Convention. The procedure varies according to each country’s particular legislative structure. After a<br />
<strong>State</strong> has determined that a Convention is consistent with domestic laws and that steps may be taken to<br />
comply with its provisions, <strong>the</strong> appropriate national organ (e.g., a parliament) makes a formal decision<br />
to ratify. Once <strong>the</strong> instrument <strong>of</strong> ratification – a formal, sealed letter signed by <strong>the</strong> responsible authority<br />
(e.g., a president) – is deposited with <strong>the</strong> United Nations Secretary-General, <strong>the</strong> <strong>State</strong> becomes party to<br />
<strong>the</strong> Convention.<br />
In some cases, a state will accede to a Convention or Optional Protocol. Essentially, accession is like<br />
ratifying without first having to sign.<br />
For fur<strong>the</strong>r information and more detailed definitions <strong>of</strong> <strong>the</strong>se and related terms, see<br />
.<br />
The Convention on <strong>the</strong> Rights <strong>of</strong> Persons with Disabilities is available at<br />
.<br />
The Optional Protocol is available at .<br />
154<br />
THE STATE OF THE WORLD’S CHILDREN <strong>2013</strong>: <strong>Children</strong> with Disabilities
UNICEF Headquarters<br />
UNICEF House<br />
3 United Nations Plaza<br />
New York, NY 10017, USA<br />
UNICEF Regional Office for Europe<br />
Palais des Nations<br />
CH-1211 Geneva 10, Switzerland<br />
UNICEF Central and Eastern Europe/<br />
Commonwealth <strong>of</strong> Independent<br />
<strong>State</strong>s Regional Office<br />
Palais des Nations<br />
CH-1211 Geneva 10, Switzerland<br />
UNICEF Eastern and Sou<strong>the</strong>rn Africa<br />
Regional Office<br />
P.O. Box 44145<br />
Nairobi, Kenya 00100<br />
UNICEF Latin America and<br />
<strong>the</strong> Caribbean Regional Office<br />
P.O. Box 0843-03045<br />
Panama City, Panama<br />
UNICEF East Asia and Pacific<br />
Regional Office<br />
P.O. Box 2-154<br />
Bangkok 10200, Thailand<br />
UNICEF Middle East and North Africa<br />
Regional Office<br />
P.O. Box 1551<br />
Amman 11821, Jordan<br />
UNICEF South Asia Regional Office<br />
P.O. Box 5815<br />
Lekhnath Marg<br />
Kathmandu, Nepal<br />
UNICEF West and Central Africa<br />
Regional Office<br />
P.O. Box 29720, Y<strong>of</strong>f<br />
Dakar, Senegal
United Nations <strong>Children</strong>’s Fund<br />
3 United Nations Plaza<br />
New York, NY 10017, USA<br />
Email: pubdoc@unicef.org<br />
Website: www.unicef.org<br />
XX%<br />
Cert no. XXX-XXX-XXX<br />
To read this report online,<br />
scan this QR code or go to<br />
www.unicef.org/sowc<strong>2013</strong><br />
US $25.00<br />
ISBN: 978-92-806-4656-6<br />
eISBN: 978-92-806-4662-7<br />
United Nations publication sales no.: E.13.XX.1<br />
© United Nations <strong>Children</strong>’s Fund (UNICEF)<br />
May <strong>2013</strong>


