Grease Filter Efficiency Test Method - Food Service Technology ...
Grease Filter Efficiency Test Method - Food Service Technology ...
Grease Filter Efficiency Test Method - Food Service Technology ...
Create successful ePaper yourself
Turn your PDF publications into a flip-book with our unique Google optimized e-Paper software.
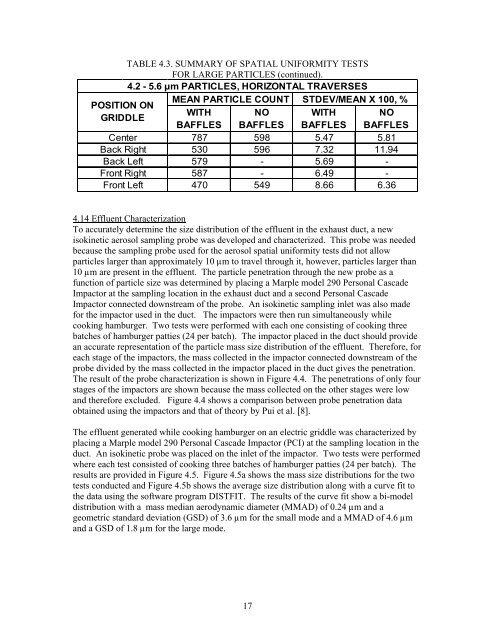
TABLE 4.3. SUMMARY OF SPATIAL UNIFORMITY TESTS<br />
FOR LARGE PARTICLES (continued).<br />
4.2 - 5.6 µm PARTICLES, HORIZONTAL TRAVERSES<br />
MEAN PARTICLE COUNT STDEV/MEAN X 100, %<br />
POSITION ON<br />
WITH NO WITH NO<br />
GRIDDLE<br />
BAFFLES BAFFLES BAFFLES BAFFLES<br />
Center<br />
787 598 5.47 5.81<br />
Back Right 530 596 7.32 11.94<br />
Back Left 579 - 5.69 -<br />
Front Right 587 - 6.49 -<br />
Front Left 470 549 8.66 6.36<br />
4.14 Effluent Characterization<br />
To accurately determine the size distribution of the effluent in the exhaust duct, a new<br />
isokinetic aerosol sampling probe was developed and characterized. This probe was needed<br />
because the sampling probe used for the aerosol spatial uniformity tests did not allow<br />
particles larger than approximately 10 µm to travel through it, however, particles larger than<br />
10 µm are present in the effluent. The particle penetration through the new probe as a<br />
function of particle size was determined by placing a Marple model 290 Personal Cascade<br />
Impactor at the sampling location in the exhaust duct and a second Personal Cascade<br />
Impactor connected downstream of the probe. An isokinetic sampling inlet was also made<br />
for the impactor used in the duct. The impactors were then run simultaneously while<br />
cooking hamburger. Two tests were performed with each one consisting of cooking three<br />
batches of hamburger patties (24 per batch). The impactor placed in the duct should provide<br />
an accurate representation of the particle mass size distribution of the effluent. Therefore, for<br />
each stage of the impactors, the mass collected in the impactor connected downstream of the<br />
probe divided by the mass collected in the impactor placed in the duct gives the penetration.<br />
The result of the probe characterization is shown in Figure 4.4. The penetrations of only four<br />
stages of the impactors are shown because the mass collected on the other stages were low<br />
and therefore excluded. Figure 4.4 shows a comparison between probe penetration data<br />
obtained using the impactors and that of theory by Pui et al. [8].<br />
The effluent generated while cooking hamburger on an electric griddle was characterized by<br />
placing a Marple model 290 Personal Cascade Impactor (PCI) at the sampling location in the<br />
duct. An isokinetic probe was placed on the inlet of the impactor. Two tests were performed<br />
where each test consisted of cooking three batches of hamburger patties (24 per batch). The<br />
results are provided in Figure 4.5. Figure 4.5a shows the mass size distributions for the two<br />
tests conducted and Figure 4.5b shows the average size distribution along with a curve fit to<br />
the data using the software program DISTFIT. The results of the curve fit show a bi-model<br />
distribution with a mass median aerodynamic diameter (MMAD) of 0.24 µm and a<br />
geometric standard deviation (GSD) of 3.6 µm for the small mode and a MMAD of 4.6 µm<br />
and a GSD of 1.8 µm for the large mode.<br />
17


