Download - Rio+20
Download - Rio+20
Download - Rio+20

You also want an ePaper? Increase the reach of your titles
YUMPU automatically turns print PDFs into web optimized ePapers that Google loves.
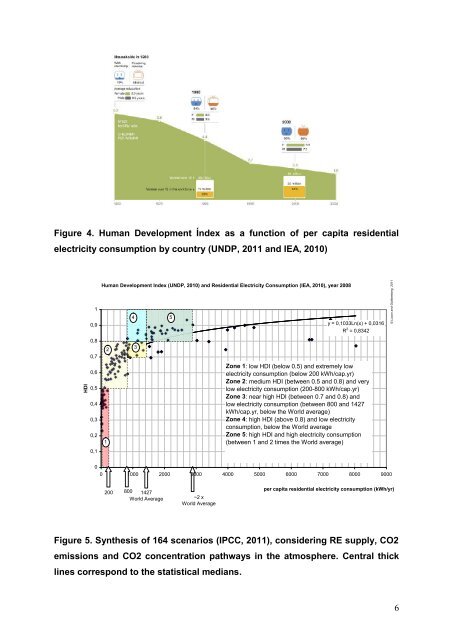
Figure 4. Human Development Índex as a function of per capita residential<br />
electricity consumption by country (UNDP, 2011 and IEA, 2010)<br />
HDI<br />
1<br />
0,9<br />
0,8<br />
0,7<br />
0,6<br />
0,5<br />
0,4<br />
0,3<br />
0,2<br />
0,1<br />
Human Development Index (UNDP, 2010) and Residential Electricity Consumption (IEA, 2010), year 2008<br />
1<br />
2<br />
4 5<br />
3<br />
y = 0,1033Ln(x) + 0,0316<br />
R 2 = 0,8342<br />
Zone 1: low HDI (below 0.5) and extremely low<br />
electricity consumption (below 200 kWh/cap.yr)<br />
Zone 2: medium HDI (between 0.5 and 0.8) and very<br />
low electricity consumption (200-800 kWh/cap.yr)<br />
Zone 3: near high HDI (between 0.7 and 0.8) and<br />
low electricity consumption (between 800 and 1427<br />
kWh/cap.yr, below the World average)<br />
Zone 4: high HDI (above 0.8) and low electricity<br />
consumption, below the World average<br />
Zone 5: high HDI and high electricity consumption<br />
(between 1 and 2 times the World average)<br />
© Lucon and Goldemberg, 2011<br />
0<br />
0 1000 2000 3000 4000 5000 6000 7000 8000 9000<br />
200 800 1427<br />
World Average<br />
~2 x<br />
World Average<br />
per capita residential electricity consumption (kWh/yr)<br />
Figure 5. Synthesis of 164 scenarios (IPCC, 2011), considering RE supply, CO2<br />
emissions and CO2 concentration pathways in the atmosphere. Central thick<br />
lines correspond to the statistical medians.<br />
6