Human Development Report 2005 : Karnataka - United Nations ...
Human Development Report 2005 : Karnataka - United Nations ...
Human Development Report 2005 : Karnataka - United Nations ...

You also want an ePaper? Increase the reach of your titles
YUMPU automatically turns print PDFs into web optimized ePapers that Google loves.
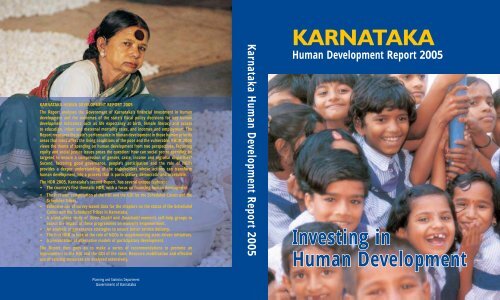
KARNATAKA HUMAN DEVELOPMENT REPORT <strong>2005</strong><br />
The <strong>Report</strong> analyses the Government of <strong>Karnataka</strong>’s financial investment in human<br />
development and the outcomes of the state’s fiscal policy decisions for key human<br />
development indicators such as life expectancy at birth, female literacy and access<br />
to education, infant and maternal mortality rates, and incomes and employment. The<br />
<strong>Report</strong> measures the state’s performance in human development in those human priority<br />
areas that most affect the living conditions of the poor and the vulnerable. KHDR <strong>2005</strong><br />
views the theme of spending on human development from two perspectives. Factoring<br />
equity and social justice issues poses the question: How can social sector spending be<br />
targeted to ensure a compression of gender, caste, income and regional disparities?<br />
Second, factoring good governance, people’s participation and the role of NGOs<br />
provides a deeper understanding of the stakeholders whose actions can transform<br />
human development into a process that is participatory, democratic and accessible.<br />
The HDR <strong>2005</strong>, <strong>Karnataka</strong>’s second <strong>Report</strong>, has several unique features:<br />
The country’s first thematic HDR, with a focus on financing human development.<br />
The first ever computation of the HDI and the GDI for the Scheduled Castes and the<br />
Scheduled Tribes.<br />
Extensive use of survey-based data for the chapters on the status of the Scheduled<br />
Castes and the Scheduled Tribes in <strong>Karnataka</strong>.<br />
A stand-alone study of Stree Shakti and Swashakti women’s self-help groups to<br />
assess the impact of these programmes on women’s empowerment.<br />
An analysis of governance strategies to ensure better service delivery.<br />
The first HDR to look at the role of NGOs in supplementing state-driven initiatives.<br />
A presentation of alternative models of participatory development.<br />
The <strong>Report</strong> then goes on to make a series of recommendations to promote an<br />
improvement in the HDI and the GDI of the state. Resource mobilisation and effective<br />
use of existing resources are analysed extensively.<br />
<strong>Karnataka</strong> <strong>Human</strong> <strong>Development</strong> <strong>Report</strong> <strong>2005</strong><br />
KARNATAKA<br />
<strong>Human</strong> <strong>Development</strong> <strong>Report</strong> <strong>2005</strong><br />
Investing in<br />
<strong>Human</strong> <strong>Development</strong><br />
Planning and Statistics Department<br />
Government of <strong>Karnataka</strong>
KARNATAKA<br />
<strong>Human</strong> <strong>Development</strong> <strong>Report</strong><br />
<strong>2005</strong><br />
Investing in <strong>Human</strong> <strong>Development</strong>
© Copyright 2006<br />
Government of <strong>Karnataka</strong><br />
Bangalore<br />
Published by<br />
Planning and Statistics Department<br />
Government of <strong>Karnataka</strong><br />
This <strong>Report</strong> does not necessarily refl ect the views of the Government of <strong>Karnataka</strong>, the Planning<br />
Commission, Government of India and the <strong>United</strong> <strong>Nations</strong> <strong>Development</strong> Programme and its Executive<br />
Board.<br />
All rights reserved. No part of this publication may be reproduced, stored or transmitted in any form or<br />
by any means without the prior permission of the Government of <strong>Karnataka</strong>.<br />
Price: Rs. 500/-<br />
Design and printing by<br />
New Concept Information Systems Pvt. Ltd., New Delhi
Message<br />
It is a matter of pride that <strong>Karnataka</strong>’s second <strong>Human</strong> <strong>Development</strong> <strong>Report</strong> <strong>2005</strong> is the only State HDR<br />
to have a thematic focus. The <strong>Report</strong> is a signifi cant analysis of fi nancing human development in the<br />
state; the outcomes of the State Government’s various initiatives in critical human development sectors<br />
such as education, nutrition, healthcare, sanitation, drinking water and employment; and their impact on<br />
the most vulnerable sections of society: people below the poverty line, women, children, the Scheduled<br />
Castes and Scheduled Tribes. The <strong>Report</strong> also examines ways in which service delivery can be improved<br />
and made more effi cient, accountable and people-friendly. Above all, this HDR provides an objective<br />
evaluation of the human development scenario in <strong>Karnataka</strong>. The chapter The Way Forward offers many<br />
recommendations to which the State Government will give serious consideration. As this <strong>Report</strong> precedes<br />
the commencement of the Eleventh Plan of the state, I am certain the recommendations contained in<br />
the <strong>Report</strong> will ensure that <strong>Karnataka</strong>’s commitment to improving the human development status of its<br />
people fi nds concrete vision in the State’s Eleventh Plan document.<br />
It is indeed signifi cant that the HDR is being published at a momentous period in the history of the<br />
state. <strong>Karnataka</strong> will celebrate 50 years of state-hood on November 1st, 2006 when a year fi lled with<br />
commemorative events, all celebrating the unifi cation and formation of the state will be fl agged off.<br />
I am sure this HDR, which is the outcome of an interactive process, will provide considerable data<br />
and analysis to various stakeholders such as local bodies, academe, NGOs, in fact everyone who is<br />
interested in learning about human development in <strong>Karnataka</strong>. I also hope it generates more discussion<br />
on fi nancing human development and enables the evolution of a strategy which would further improve<br />
<strong>Karnataka</strong>’s HDI.<br />
H. D. KUMAARASWAAMY
Message<br />
It is indeed appropriate that the <strong>Karnataka</strong> <strong>Human</strong> <strong>Development</strong> <strong>Report</strong> <strong>2005</strong> is being published at a moment<br />
when the State Government has initiated steps to formulate the Eleventh Plan. This <strong>Report</strong> will provide the<br />
information and the impetus to building into the Plan, a much-needed focus on human development.<br />
It is now recognised that development cannot be equated with economic growth per se and UNDP’s<br />
identifi cation of human development indicators to assess parameters not normally encompassed by economic<br />
criteria such as rate of growth or GSDP has signifi cantly changed the way we look at “development”. If the<br />
poor and the marginalised do not have access to education, healthcare and secure livelihoods, then economic<br />
growth will leave them behind and the gap between the haves and the have-nots will widen. It is in this<br />
context that government expenditure on social services becomes a crucial factor. <strong>Karnataka</strong>’s second <strong>Human</strong><br />
<strong>Development</strong> <strong>Report</strong> has chosen to explore diffi cult terrain and its analysis takes note of both the strengths<br />
and the constraints of various sectors.<br />
The most striking feature of this HDR is the preparation of the <strong>Human</strong> <strong>Development</strong> Index and the Gender<br />
<strong>Development</strong> Index of the Scheduled Castes and the Scheduled Tribes in <strong>Karnataka</strong>. No other state has<br />
attempted this, probably because of data constraints. We, however, took up a special socio-economic survey<br />
of the Scheduled Castes and Scheduled Tribes which enabled us to develop the HDI and GDI and which<br />
provided data for the two chapters on the SCs and STs, another fi rst for the state. Another survey on women’s<br />
self-help groups was also commissioned and it yielded valuable insights on self-help groups as vehicles of<br />
women’s empowerment.<br />
I understand that many experts within and outside Government contributed the background papers which<br />
form the basis of this <strong>Report</strong>. The concept of this HDR was taken to the regions through interactive workshops<br />
where elected representatives, local functionaries, NGOs, farmers’ groups, women’s groups and academics<br />
participated and provided meaningful inputs. The next step after publication is to disseminate the message of<br />
the HDR widely so that policy makers can receive feedback regarding the next set of policy interventions.<br />
Ramachandra Gowda<br />
Minister for Planning, <strong>Karnataka</strong>
<strong>Karnataka</strong> <strong>Human</strong> <strong>Development</strong> <strong>Report</strong> <strong>2005</strong><br />
Background Papers and Studies Commissioned for <strong>Karnataka</strong><br />
<strong>Human</strong> <strong>Development</strong> <strong>Report</strong> <strong>2005</strong><br />
Editor<br />
Dr. Malati Das<br />
Assisted by Diwakar Rao M.H.<br />
Papers<br />
Name of author/institution<br />
1. Dr. Abdul Aziz<br />
Retired Professor,<br />
Institute of Social and Economic Change,<br />
Bangalore.<br />
2. Shri Aloysius P. Fernandes<br />
Executive Director, and<br />
Vidya Ramachandran,<br />
Mysore Resettlement and <strong>Development</strong> Agency<br />
(MYRADA),<br />
Bangalore.<br />
3. Dr. Gita Sen<br />
Chairperson, Centre for Public Policy,<br />
Indian Institute of Management, and<br />
Anita Gurumurthy,<br />
Bangalore.<br />
4. Dr. Gopala K. Kadekodi<br />
Retired Director, and<br />
B.P. Vani and H.K. Amarnath,<br />
Institute of Social and Economic Change,<br />
Bangalore.<br />
5. Dr. H. Sudarshan<br />
Karuna Trust,<br />
Bangalore.<br />
6. Dr. K. P. Krishnan<br />
Joint Secretary,<br />
Department of Economic Affairs,<br />
Government of India,<br />
New Delhi.<br />
7. Smt. G. Latha Krishna Rao<br />
Secretary to Government,<br />
Revenue Department,<br />
Bangalore.<br />
8. Shri. Lukose Vallatharai<br />
Managing Director,<br />
The Mysore Paper Mills, and<br />
Smt. Katyayini Chamaraj,<br />
Bangalore.<br />
Paper<br />
Institutional Reforms for <strong>Human</strong><br />
<strong>Development</strong>: Panchayat Raj<br />
1. Voluntarism and Non-Governmental<br />
Organisations<br />
2. Self-Help Groups: Empowerment<br />
Through Participation<br />
Gender and <strong>Human</strong> <strong>Development</strong><br />
Regional Disparities<br />
Status of Scheduled Tribes in <strong>Karnataka</strong><br />
Urban Water Supply and Sanitation<br />
Good Governance<br />
Child Labour<br />
v
9. Dr. Malati Das<br />
Chief Secretary,<br />
Government of <strong>Karnataka</strong>,<br />
Bangalore.<br />
10. Dr. Manohar Yadav<br />
Professor,<br />
Institute of Social and Economic Change,<br />
Bangalore.<br />
11. Dr. M. Govinda Rao<br />
Director, and<br />
Mita Choudhury,<br />
National Institute of Public Finance and Policy,<br />
New Delhi.<br />
12. Dr. M. R. Narayana<br />
Professor,<br />
Institute of Social and Economic Change,<br />
Bangalore.<br />
13. Dr. M. H. Suryanarayana<br />
Professor,<br />
Indira Gandhi Institute of <strong>Development</strong> Research,<br />
Mumbai.<br />
14. Dr. P. J. Bhattacharjee<br />
Former Director,<br />
Population Centre, <strong>Karnataka</strong>,<br />
Bangalore.<br />
15. Dr. P. R. Panchamukhi<br />
Former Director, and<br />
Dr. Sailabala Debi<br />
Director,<br />
Centre for Multi-Disciplinary Research,<br />
Dharwad.<br />
16. Shri N. Sivasailam<br />
Managing Director,<br />
<strong>Karnataka</strong> State Beverages Corporation<br />
Bangalore.<br />
17. Dr. Solomon Benjamin and<br />
Smt. R. Bhuvaneswari,<br />
Bangalore.<br />
18 Shri V. P. Baligar<br />
Principal Secretary to Government,<br />
Infrastructure <strong>Development</strong> Department,<br />
Bangalore.<br />
1. Stree Shakti and Swashakti Women’s<br />
Self-Help Groups: A Survey<br />
2. The Way Forward<br />
Status of Scheduled Castes in <strong>Karnataka</strong><br />
Financing <strong>Human</strong> <strong>Development</strong><br />
Financing Education<br />
Poverty, Income and Employment<br />
Demography, Health and Nutrition<br />
Literacy and Education<br />
Housing<br />
Urban Poverty<br />
Rural Water Supply and Sanitation<br />
vi
<strong>Karnataka</strong> <strong>Human</strong> <strong>Development</strong> <strong>Report</strong> <strong>2005</strong><br />
19. Shri V. Shantappa<br />
Coordinator,<br />
KHDR <strong>2005</strong>,<br />
Bangalore.<br />
Studies<br />
Department of Economics and Statistics, <strong>Karnataka</strong>,<br />
Bangalore.<br />
1. <strong>Karnataka</strong>: An Overview<br />
2. <strong>Human</strong> <strong>Development</strong> in <strong>Karnataka</strong><br />
3. Technical Note – Computing Indices<br />
4. Appendix : Statistical Tables<br />
1. Sample Survey of Scheduled Caste<br />
and Scheduled Tribe households<br />
2. Survey of Stree Shakti and Swashakti<br />
Women’s Self-Help Groups<br />
Additional background material and data provided by<br />
1. Dr. Malati Das<br />
Chief Secretary,<br />
Government of <strong>Karnataka</strong>,<br />
Bangalore.<br />
2. Shri K. Shankar Rao<br />
Senior Director,<br />
<strong>Human</strong> <strong>Development</strong> Division,<br />
Planning Department,<br />
Bangalore.<br />
3. Shri V. Shantappa<br />
Coordinator<br />
KHDR <strong>2005</strong><br />
Bangalore.<br />
4. Shri S. K. Das<br />
Former Member (Finance),<br />
Space Communication and Energy Commission and<br />
Ex-Offi cio Secretary to Government of India,<br />
Bangalore.<br />
5. Shri M. A. Basith<br />
Senior Director,<br />
Plan Finance and Resource Division,<br />
Planning Department,<br />
Bangalore.<br />
6. Shri Diwakar Rao M. H.<br />
Deputy Director,<br />
<strong>Human</strong> <strong>Development</strong> Division,<br />
Planning Department,<br />
Bangalore.<br />
All chapters<br />
Chapters 4 and 6<br />
Chapter 9<br />
Chapter 12<br />
Chapter 3<br />
All chapters<br />
vii
Acknowledgements<br />
The preparation of a <strong>Human</strong> <strong>Development</strong> <strong>Report</strong> with a thematic focus took us into uncharted territory<br />
and the fi nal product is the outcome of a process that has been participatory and consultative all<br />
through. Many individuals and organisations gave generously of their time and intellectual input and we<br />
would like to thank them for their invaluable contribution to this <strong>Report</strong>.<br />
The Planning Commission, Government of India and the <strong>United</strong> <strong>Nations</strong> <strong>Development</strong> Programme are<br />
joint stakeholders, along with the Government of <strong>Karnataka</strong> in this endeavour and their participation<br />
has been wholehearted right from inception. These organisations have extended both technical and<br />
fi nancial support to the Government of <strong>Karnataka</strong>. Maxine Olson, Resident Representative of the UNDP<br />
and Brenda Gail McSweeny, her predecessor in offi ce, took a great deal of interest in this project.<br />
Dr. K. Seeta Prabhu, Head, HDRC, UNDP and Dr. Suraj Kumar, National Programme Offi cer, UNDP, who<br />
participated actively in our workshops and technical deliberations, played a critical role in the preparation<br />
of the <strong>Report</strong>. Dr. Rohini Nayyar, the then Adviser, and B. N. Nanda of the Planning Commission were<br />
always a source of encouragement. The Planning Commission and UNDP have contributed signally<br />
towards ensuring that we never lacked technical or fi nancial assistance.<br />
Two state level workshops in Bangalore and two regional level workshops at Dharwad and Mysore were<br />
organised as part of the process of writing the HDR as we felt that it would be enriched immeasurably if<br />
all stakeholders, both within and outside the government, could share their views and contribute ideas<br />
and concepts about human development in the state. The fi rst state level workshop, which discussed<br />
the concept of the <strong>Report</strong>, saw academics from reputed organisations, NGOs, activists, journalists and<br />
government functionaries, discuss threadbare, various aspects of the Concept Paper and many of the<br />
suggestions emanating from this workshop were incorporated in the HDR. At the second state level<br />
workshop, paper contributors presented their draft papers to a series of discussion groups comprising<br />
experts, NGOs in the fi eld and departmental stakeholders. The regional level workshop at Dharwad was<br />
organised by the Centre for Multi-Disciplinary Research (CMDR), Dharwad and the workshop at Mysore<br />
was organised by Abdul Nazir Sab State Institute for Rural <strong>Development</strong> (ANSSIRD), Mysore. At both<br />
workshops, local level issues were raised and background paper writers received meaningful inputs from<br />
participants. The list of participants is on pages xi-xv.<br />
The <strong>Karnataka</strong> <strong>Human</strong> <strong>Development</strong> <strong>Report</strong> <strong>2005</strong> is based on background papers contributed by<br />
experts in the Government of <strong>Karnataka</strong> as well as external resource persons who have a signifi cant<br />
academic and research background. Background papers were prepared by Aloysius P. Fernandes<br />
and Vidya Ramachandran; V. P. Baligar; P. J. Bhattacharjee; Gita Sen and Anita Gurumurthy; Gopala<br />
K. Kadekodi, B.P. Vani and H. K. Amarnath; M. Govinda Rao and Mita Choudhury; K. P. Krishnan;<br />
G. Latha Krishna Rao; Lukose Vallatharai and Kathyayini Chamaraj; Malati Das; M. R. Narayana;<br />
P. R. Panchamukhi and Sailabala Debi; V. Shantappa; N. Sivasailam; Solomon Benjamin; H. Sudarshan;<br />
M. H. Suryanarayana and Manohar Yadav.<br />
V. Shantappa, as Coordinator, KHDR <strong>2005</strong>, ensured that paper writers received accurate data and<br />
prepared the very extensive appendices that underpin the information base of this <strong>Report</strong>. The<br />
background papers were read and evaluated by peer reviewers within the government. They patiently<br />
read several draft versions of chapters and responded promptly with constructive feedback. The peer<br />
reviewers are Anita Kaul and T. M. Vijay Bhaskar (Literacy and Education, Financing Education),<br />
viii
<strong>Karnataka</strong> <strong>Human</strong> <strong>Development</strong> <strong>Report</strong> <strong>2005</strong><br />
Malati Das (Gender and <strong>Human</strong> <strong>Development</strong>), T. R. Raghunandan (Institutional Reforms), Sobha<br />
Nambisan (NGOs and Self-Help Groups), Subhash C. Khuntia (Financing <strong>Human</strong> <strong>Development</strong>), and<br />
D.Thangaraj (Health, Status of Scheduled Castes and Scheduled Tribes). The draft chapters were then<br />
shared with departmental stakeholders in a series of interactive meetings with Principal Secretaries/<br />
Secretaries, heads of departments and offi cers, who helped us to improve the material content while<br />
ensuring there were no information gaps or discrepancies. Special mention must be made of D. Thangaraj<br />
who was peer reviewer for as many as three chapters and who participated in many of our meetings and<br />
discussion groups. Computation of life expectancy at birth (LEB) with sub-state level disaggregation is<br />
required to compute district human development indices. This data, however, was not readily available, so,<br />
P. J. Bhattacharjee computed LEB values with district-wise disaggregation. K. Gurumurthy of the Azim<br />
Premji Foundation provided useful inputs on the chapter on Literacy and Education.<br />
One of the unique features of this HDR is the extensive use of survey-based data in the chapters on<br />
the status of the Scheduled Castes and Scheduled Tribes in <strong>Karnataka</strong> and the stand alone study on<br />
Stree Shakti and Swashakti self-help groups to assess the impact of these programmes on women’s<br />
empowerment, economic as well as social. These surveys were conducted by the Department of<br />
Economics and Statistics, <strong>Karnataka</strong>, under the guidance of its Director, G. Prakasam, his predecessor in<br />
offi ce, H. D. Ganesh and V. Shantappa. The staff of the Department of Economics and Statistics, at both<br />
the state and district levels, executed the work with their customary dispatch and effi ciency. Computation<br />
of the HDI and GDI for Scheduled Castes and Scheduled Tribes, a fi rst for any SHDR, is based entirely<br />
on data derived from these surveys.<br />
Dr. Malati Das, Chief Secretary and former Additional Chief Secretary and Principal Secretary, Planning<br />
and Statistics Department initiated the exercise by writing the Concept Paper in 2003 and steered the<br />
process even after she was transferred from the department, in <strong>2005</strong>. Three special surveys, two on the<br />
status of the Scheduled Castes and Scheduled Tribes in <strong>Karnataka</strong> and one on self-help groups were<br />
taken up at her instance. She has edited the HDR, and contributed additional material to the <strong>Report</strong>.<br />
The <strong>Karnataka</strong> <strong>Human</strong> <strong>Development</strong> <strong>Report</strong> <strong>2005</strong> is being published in Kannada and English.<br />
Several offi cers of the Department of Planning have worked on the translation: Diwakar Rao M. H.,<br />
A. S. Gowri, C. Lata Devi, Keshava, V. S. Kumar, M. Madalli, D. Pramila Kumari, Shankar Reddy,<br />
Sridhar Murthy, and K. Suresh. B. Shesadri and C. Chandrashekar, have edited the Kannada translation<br />
of the <strong>Report</strong>. Diwakar Rao M. H. has subsequently ensured that the fi nal version is a fi nely crafted,<br />
reader-friendly text.<br />
Nitya Mohan, Research Scholar, Cambridge University has assisted in the preparation of the Executive<br />
Summary.<br />
New Concept Information Systems Pvt. Ltd., New Delhi has done an excellent job of designing the cover<br />
page and printing the <strong>Report</strong> and bringing it out simultaneously in English and Kannada.<br />
Additional information for various chapters has been provided by M.A. Basith, S. A. Katarki and K.<br />
Suresh of the Planning Department. Srinivasaiah has done a commendable job in assisting V. Shantappa<br />
in preparing the appendices. The staff of the personnel section of the Additional Chief Secretary and<br />
Principal Secretary, Planning and Statistics Department, S. Vasantha, D. Nagesh, and Parvathi assisted<br />
her in the editing process.<br />
Last, but not least, the staff of the <strong>Human</strong> <strong>Development</strong> Division, worked diligently, 24/7, on the<br />
<strong>Report</strong>. They organised workshops, helped with the documentation and provided key logistical support.<br />
ix
Acknowledgements<br />
K. Shankar Rao, Senior Director, and Diwakar Rao M. H., Deputy Director, spearheaded the initiative<br />
with the able support of Siddalingappa, Rama Shettigar and Vishwanataiah, Assistant Directors and<br />
Shiva Shankar, Assistant Statistical Offi cer. K. Shankar Rao also contributed additional material for a few<br />
chapters. Diwakar Rao M. H. also assisted in editing the <strong>Report</strong> and his commitment to data accuracy,<br />
proof reading and all the nitty-gritty of editing meant that he went over chapters in painstaking detail to<br />
ensure consistency and cogency. The HDR owes a great deal to the efforts of these two offi cers.<br />
We would like to thank all the people associated with the preparation of the <strong>Karnataka</strong> <strong>Human</strong><br />
<strong>Development</strong> <strong>Report</strong> <strong>2005</strong>. This <strong>Report</strong> is the result of the concerted efforts of many individuals and<br />
organisations, all united by a desire to create a fi ne document that will, hopefully, provide insights into<br />
the state of human development in <strong>Karnataka</strong> and generate strategies for the future.<br />
Neerja Rajkumar<br />
Additional Chief Secretary and Principal Secretary<br />
Department of Planning and Statistics<br />
x
List of Participants<br />
First State Level Workshop, Bangalore, October 14, 2003<br />
B. N. Nanda, Planning Commission, Government of India, New Delhi, D. J. N. Anand, Director, NESIST, Shiva<br />
Subramaniam, Director, National Sample Survey Organisation, Bangalore, H. Pant, <strong>United</strong> <strong>Nations</strong> <strong>Development</strong><br />
Programme, New Delhi, Dr. K. Seeta Prabhu, Head, HDRC, <strong>United</strong> <strong>Nations</strong> <strong>Development</strong> Programme, New<br />
Delhi, Dr. Suraj Kumar, National Programme Offi cer, <strong>United</strong> <strong>Nations</strong> <strong>Development</strong> Programme, New Delhi.<br />
Anita Kaul, Director General, Administrative Training Institute, Mysore, D. Thangaraj, Principal Secretary<br />
to Government, Women and Child <strong>Development</strong> Department, G. Prakasam, Director, District Planning<br />
Division, Planning Department, H. D. Ganesh, Director, Department of Economics and Statistics,<br />
H. S. Sridharamurthy, Director, Plan Monitoring and Information Division, Planning Department,<br />
Kaushik Mukherjee, Secretary to Government, Rural <strong>Development</strong> and Panchayat Raj Department,<br />
Keshava, Deputy Director, Evaluation Division, Planning Department, K. Raghuram Reddy, Director,<br />
Project Formulation Division, Planning Department, K. Shankar Rao, Director, <strong>Human</strong> <strong>Development</strong><br />
Division, Planning Department, M. A. Basith, Director, Perspective Planning Division and Sr. Director<br />
(I/c), Plan Finance and Resource Division, Planning Department, Dr. Malati Das, Principal Secretary<br />
to Government, Planning and Statistics Department, Dr. Muthamma, Director, Collegiate Education,<br />
N. Sivasailam, Managing Director, Rajiv Gandhi Rural Housing Corporation Limited, N. Sridhar, Director,<br />
Area <strong>Development</strong> Division, Planning Department, Shamim Banu, Principal Secretary to Government, Urban<br />
<strong>Development</strong> Department, Sobha Nambisan, Principal Secretary to Government, Education Department (Higher<br />
Education), Subir Hari Singh, Principal Secretary to Government, Commerce and Industry Department.<br />
Ahalya S. Bhat and Dr. Devaki Jain of Singamma Srinivasan Foundation, Tharanga, Bangalore, Dr. Gopala<br />
K. Kadekodi, Director, Institute of Social and Economic Change, Bangalore, Dr. Indira Rajaraman, National<br />
Institute of Public Finance and Policy (NIPFP), New Delhi, Jacintha Kumaraswamy, Consultant, K. D. Vargeese,<br />
BOSCO, Bangalore, Dr. K. S. Krishnaswamy, Dr. Mari Bhatt P. N., Population Research Centre, Institute<br />
of Economic Growth, University Enclave, New Delhi, Dr. M. H. Suryanarayana, Indira Gandhi Institute of<br />
<strong>Development</strong> Research, Mumbai, Dr. M. R. Narayana, Institute for Social and Economic Change, Bangalore,<br />
Dr. P. R. Panchamukhi, Director, Centre for Multi Disciplinary <strong>Development</strong> Research, Dharwad, Samuel<br />
Paul, Public Affairs Centre, Bangalore, Sandeep Dikshit, MPHDP, Dr. Sandhya V. Iyer, Reader, Department of<br />
Economics, Tata Institute of Social Sciences, Mumbai, Dr. Sarathi Acharya, Tata Institute of Social Sciences,<br />
Mumbai, Dr. Shanthamohan, Indian Institute of Science, Bangalore, Solomon Benjamin, Consultant,<br />
Bangalore, Uma Malhotra, Consultant, Usha Abrol, Regional Director, National Institute of Child <strong>Development</strong>,<br />
Bangalore, Vedanta Sharma, Consultant, Dr. V. Prakash, Central Food Technology Research Institute, Mysore,<br />
V. Shantappa, Coordinator KHDR <strong>2005</strong>, Bangalore, V. S. Badari, Consultant, V. Vijayalaxmi, Centre for Budget<br />
and Policy Study, Bangalore, Dr. Vinod Vyasalu, Director, Centre for Budget and Policy Study, Bangalore, and<br />
Prof. Zoya Hassan, Jawaharlal Nehru University, New Delhi.<br />
Journalists: A. K. Pujar, B. K. Renuka, H. R. Sudendra of ‘Kannada Iynadu’, Kavitha of ‘Deccan Herald’,<br />
Laxman Hoogar of ‘Prajavani’, Mohan of ‘ICE TV’, N. B. Hombal of ‘Metro Today’, S. A. Hemanth Kumar of<br />
‘The Asian Age’, Shivanna of ‘Ee sanje’, Shivappa, R., Shivu of ‘Vijaya Times’, S. Radhakumari, Sreenath<br />
of ‘City Channel’, Vidya of ‘Prajavani’.<br />
xi
List of Participants<br />
Regional Workshop, CMDR, Dharwad, July 23, 2004<br />
Session Chairpersons:<br />
Dr. A. N. Kabbur: Health and nutrition; Dr. M. C. Kodli: Regional and other imbalances, Scheduled<br />
Tribes in <strong>Karnataka</strong> and Institutional arrangement; Dr. R. V. Dadibhavi: Housing and Poverty; and Dr.<br />
Shashikala Deshpande: Education.<br />
Valedictory Address: Shri Chiranjeev Singh, <strong>Development</strong> Commissioner for North <strong>Karnataka</strong>,<br />
Belgaum.<br />
Papers Presented By:<br />
Dr. Abdul Aziz: Institutional arrangement; Dr. P. J. Bhattacharjee and Dr. Ramesh Kanbargi: Health and<br />
nutrition; Dr. Gopala K. Kadekodi: Regional and other imbalances; Dr. K. R. Madi, Dr. M. R. Narayana<br />
and Dr. Sailabala Debi: Education; K. Shankar Rao (on behalf of Dr. M. H. Suryanarayana): Poverty; N.<br />
Shivsailam: Housing; Dr. Paramagouda (on behalf of Dr. H. Sudarshan): Scheduled Tribes in <strong>Karnataka</strong>;<br />
Dr. P. R. Panchamukhi: Challenges of human development in north <strong>Karnataka</strong>: An Overview.<br />
Rapporteurs:<br />
Abhilash Kumar Pradhan, A. R. Kulkarni, Dastgeersab Mygeri, Gopal Sarangi, Dr. G. S. F. L. Mendis, Mihir<br />
Kumar Mahapatra, Nayanatara S. Nayak, Sanjeev Kenchaigol, S. B. Somannanavar, Seema Rath, Dr.<br />
Shobha Neelavar, Dr. Vandana Dandekar and V. B. Annigeri.<br />
Participants:<br />
B. N. Nanda, Planning Commission, Government of India, New Delhi, Dr. Rinku Murgai, Senior Economist,<br />
World Bank, New Delhi.<br />
D. Jayaram, Chief Planning Offi cer, Gulbarga Zilla Panchayat, G. Prakasam, Director, District Planning<br />
Division, Planning Department, H. D. Ganesh, Director, Directorate of Economics and Statistics, K. V.<br />
Subramanyam, Chief Planning Offi cer, Tumkur Zilla Panchayat, Dr. Malati Das, Principal Secretary to<br />
Government, Planning and Statistics Department, M. C. Chikkamath, Chief Planning Offi cer, Haveri<br />
Zilla Panchayat, Siddamma Patil, Chief Planning Offi cer, Bidar Zilla Panchayat, Vasundhara Devi, Chief<br />
Planning Offi cer, Mandya Zilla Panchayat, Veera Shivashankar Reddy, Chief Planning Offi cer, Bellary Zilla<br />
Panchayat.<br />
Dr. Amarnath, Dr. Anant Huligol, Anita Anil Pandre, Anjali M. Greory, Arindam, Arvind Patil, A. S.<br />
Kulkarni, Dr. Bhargava, Dr. Chaya Degaonkar, Professor, Department of Economics, Gulbarga University,<br />
Chiranjeev Singh, D. M. Shanbhag, Gaurav Gupta, G. S. Shivswamy, G. V. Ajur, Dr. M. H. Chalvadi, Dr.<br />
M. S. Subhash, Panduranga Pammar, Dr. P. B. Sattur, Ravi Kumar, Dr. Sayeed Afzal Peerzade, S. B.<br />
Dyaberi, S. C. Shienoor, Dr. S. G. Purohit, Shankar Narayana, Shivanagangappa, S. H. Kulkarni, Shobha<br />
Digambara Belmagi, Dr. Somshekarappa, S. T. Bagalkote, Dr. Vani and Vijay Kulkarni.<br />
Regional Workshop, ANSSIRD, Mysore, August 7, 2004<br />
Session Chairpersons:<br />
C. Narayanswamy, Retd. President, Bangalore Rural Zilla Panchayat: Role of Panchayat Raj<br />
institutions; Prof. H. L. Keshavamurthy, Mandya: Status of Scheduled Castes and Scheduled Tribes; Dr.<br />
R. Balasubramanyam, SVYM, H. D. Kote: NGOs and Self-help groups; Dr. Rita Narhona, Professor,<br />
Community <strong>Development</strong>, Bangalore: Gender issues; T. R. Raghunanadan, Secretary to Government,<br />
xii
<strong>Karnataka</strong> <strong>Human</strong> <strong>Development</strong> <strong>Report</strong> <strong>2005</strong><br />
Rural <strong>Development</strong> and Panchayat Raj Department: Governance; Prof. V. K. Nataraj, MIDS, Chennai:<br />
Urban Water Supply and Sanitation and Urban Poverty.<br />
Papers Presented By:<br />
Dr. Abdul Aziz, retired professor, ISEC, Bangalore: Role of Panchayat Raj institutions; Anita Gurumurthy,<br />
Research Consultant, Indian Institute of Management, Bangalore: Gender Issues; G. Latha Krishna Rao,<br />
Secretary to Government, Ecology and Environment: Governance; Dr. H. Sudharshan, Director, <strong>Karnataka</strong><br />
Lokayukta Offi ce: Status of Scheduled Tribes; Dr. K. P. Krishnan, Managing Director, <strong>Karnataka</strong> Urban<br />
Infrastructure <strong>Development</strong> and Finance Corporation: Urban Water Supply and Sanitation; Dr. Manohar<br />
Yadav, Professor. ISEC, Bangalore: Status of Scheduled Castes; and Dr. Solomon Benjamin, Consultant:<br />
Urban Poverty.<br />
Rapporteurs:<br />
Dr. Anita B. K., NIAS, Bangalore, Ganesh Prasad Mill, Chennai, G. Mohan, ANSSIRD, Mysore, Dr. M. A.<br />
Balasubramanya, SVYM, H.D. Kote, Dr. Seetharam, SVYM, H.D. Kote and Varsha A. Vadhani, Mobility<br />
India, Bangalore.<br />
Participants:<br />
V. Jagannath, Indian Space Research Organisation, Bangalore, Dr. Suraj Kumar, National Programme<br />
Offi cer, <strong>United</strong> <strong>Nations</strong> <strong>Development</strong> Programme, New Delhi.<br />
B. K. Manjunath, Chief Planning Offi cer, Chitradurga Zilla Panchayat, Chandrappa, Chief Planning<br />
Offi cer, Chamarajnagar Zilla Panchayat, C. Kempaiah, Chief Planning Offi cer, Bangalore Urban Zilla<br />
Panchayat, D. E. Basavarajappa, Chief Planning Offi cer, Davangere Zilla Panchayat, G. Kumar Naik,<br />
Deputy Commissioner, Mysore, G. Prakasam, Director, District Planning Division, Planning Department,<br />
Ibrahim Adoor, Commissioner, City Municipal Council (CMC), Mysore, K. Shankar Rao, Director, <strong>Human</strong><br />
<strong>Development</strong> Division, Planning Department, K. V. Raghurama Reddy, Director, Project Formulation<br />
Division, Planning Department, K. V. Subramanyam, Chief Planning Offi cer, Tumkur Zilla Panchayat,<br />
M. A. Basith, Director, Perspective Planning and Senior Director (I/c) Plan Finance and Resource<br />
Division, Planning Department, Dr. Malati Das, Principal Secretary to Government, Planning and<br />
Statistics Department, Niranjan, Chief Executive Offi cer, Mysore Zilla Panchayat, N. Sridhar, Director,<br />
Area <strong>Development</strong> Division, Planning Department, Pankaj Kumar Pondey, Commissioner, Mysore Urban<br />
<strong>Development</strong> Authority (MUDA), Mysore, Subbarao, Chief Planning Offi cer, Mysore Zilla Panchayat, T. M.<br />
Vijayabhaskar, Commissioner, Archeology, Museum and Heritage, Mysore, T. Thimmegowda, Managing<br />
Director, Cauvery Neeravari Nigama, Bangalore and Tushar Girinath, Deputy Commissioner, Shimoga.<br />
Aruna Shetty, member, Bannalu gram panchayat, Puttur, Ashwini Ranjan, Pratham, B. A. Samshuddin,<br />
Basavaraju, Professor of Economics, Manasagangothri, Mysore University, B. C. Geetha, President,<br />
Mahila Sahakari Bank, Chikmaglur, Boralingaiah, Retired Professor, Department of Kannada, Mysore<br />
University, C. K. N. Raja, Professor and Head of the Department of Law (R), Manasagangothri, Mysore<br />
University, C. Yathiraj, Principal, Kalidasa, PU College, Tumkur, Dr. G. N. S. Reddy, BAIF, Thiptur, Himakar,<br />
Kannada Sahithya Parishat, Sullia Taluk Samiti, Sullia, H. L. Keshava Murthy, Mandya, J. A. Karumbaiah,<br />
Ex-President, Madikeri Zilla Panchayat, Joy Maliekal, RLHP, Mysore, Jayalakshmi, Grama Vikasa Samsthe,<br />
Mulabagilu, Kolar, Kishore Athavar, Director, STC, Mysore, Krishna Kothai, Director, Rural Study Centre,<br />
MAHE, Manipal, Krishna Moolya, Janashikshanapeeta, Mangalore, Dr. K. Y. Narayanaswamy, Government<br />
Boys College, Chinthamani, Mamatha, SRC, Mysore, Mamatha, Swamy Vivekananda Youth Movement,<br />
H.D. Kote, Merlyn Martis, DEED, Kadri, Mangalore, M. G. Chandrashekaraiah, Lecturer, Kongadiyappa<br />
College, Doddaballapur, Molly, ODP, Mysore, Prof. Muzaffar Assadi, Department of Political Sciences,<br />
xiii
List of Participants<br />
Manasagangothri, Mysore University, Pasha, Secretary, Zilla Saksharatha Samithi, Hassan, Pooja,<br />
CWC, Bangalore, Rameshwari Varma, Ex-Director, Centre for Women Studies, Mysore, Sheena Shetty,<br />
Janashikshanapeeta, Mangalore, Dr. Shivappa, Danida Adviser, PAG, Bangalore, S. Janardhan, former<br />
President, Maravanthe gram panchayat, Kundapur taluk, Dr. Suchitra Vedantha, Director, Mahila<br />
Samakhya, Bangalore, Sunanda Jayaram, ZP Member, Gejjalagere, Maddur taluk, Mandya, U. Vanajakshi,<br />
President, Udupi Zilla Panchayat, Viswanath P. (on behalf of Dr. H. Sudarshan), V. Shantappa, Coordinator,<br />
KHDR <strong>2005</strong>.<br />
ANSSIRD Staff: H. S. Ashokananda, Additional Director, H. L. Mohan, Faculty- Decentralised planning,<br />
M. C. Shylaja, Faculty - DWAKRA, Dr. Hiriyannaiah, Faculty- Agriculture, R. G. Nayak, Faculty – RSS,<br />
Rajashekharegowda, Faculty - Civil Engineering, K. Shashidhar, Faculty – Finance, K. S. Krishnaswamy,<br />
Faculty – SATCOM, Wilfred D’Souza, Consultant - Training and Material Management.<br />
Journalists: Krishna Vattam, Mysore.<br />
Second State Level Workshop, Bangalore, August 19 and 20,<br />
2004<br />
Session Chairpersons:<br />
Dr. A. Ravindra, Retired Chief Secretary, Government of <strong>Karnataka</strong>: Urban water supply and sanitation<br />
and urban anti-poverty programme; Chiranjeev Singh, <strong>Development</strong> Commissioner for North<br />
<strong>Karnataka</strong>, Belgaum: Regional Disparities; Dr. Chiranjeeb Sen: Governance issues; Devaki Jain: Gender<br />
and human development; D. Thangaraj: Status of Scheduled Castes and Scheduled Tribes; G. V. K. Rao,<br />
Project Director, IPP IX, Health and Family Welfare Department: Health, Demography and Nutrition;<br />
Meenakshi Sundaram: Rural water supply and sanitation, rural poverty programme and Poverty, income<br />
and livelihood; Sanjeev Kumar: Child labour; Subhash C. Khuntia: Financing human development;<br />
Dr. Suchitra Vedantha: NGOs and self-help groups; T. M. Vijaya Bhaskar, former Commissioner, Archeology,<br />
Museum and Heritage, Mysore: Financing education and Education and literacy; T. R. Raghunandan:<br />
Decentralisation, devolution of powers and service delivery; V. Balasubramaniam: Housing; Dr. Vinod<br />
Vyasalu, Centre for Budget and Policy Study: Methodology.<br />
Wrap up: Dr. Malati Das, Additional Chief Secretary and Principal Secretary to Government, Planning<br />
and Statistics Department.<br />
Papers Presented By:<br />
Dr. Abdul Aziz: Decentralisation, devolution of powers and service delivery; Gita Sen: Gender and human<br />
development; Gopala K. Kadekodi: Regional disparities; P. Vishwanath (on behalf of Dr. H. Sudarshan):<br />
Status of Scheduled Tribes; K. P. Krishnan: Urban water supply and sanitation and urban anti poverty<br />
programme; K. Shankar Rao (on behalf of Dr. M. H. Suryanarayana): Poverty, income and livelihood;<br />
Lukose Vallatharai and Katyayini Chamaraj: Child labour; Manohar Yadav: Status of Scheduled Castes<br />
in <strong>Karnataka</strong>; M. Govinda Rao: Financing human development; M. R. Narayana: Financing Education;<br />
N. Sivasailam: Housing; P. J. Bhattacharjee: Health, demography and nutrition; P. R. Panchamukhi:<br />
Education and literacy; Solomon Benjamin: Urban anti-poverty programme; Vidya Ramachandran,<br />
MYRADA, Bangalore: NGOs and self-help groups; V. P. Baligar: Secretary to Government, Rural<br />
<strong>Development</strong> and Panchayat Raj Department: Rural water supply and sanitation and rural anti-poverty<br />
programme; and V. Shantappa: Methodolgy.<br />
xiv
<strong>Karnataka</strong> <strong>Human</strong> <strong>Development</strong> <strong>Report</strong> <strong>2005</strong><br />
Participants:<br />
S. R. Raghavendra Rao, Deputy Director, Census Directorate, Dr. Suraj Kumar, National Programme<br />
Offi cer, UNDP, New Delhi.<br />
B. H. Narayana Swamy, Joint Director, B. N. Arasaraju, Joint Director, Lakshmaiah, Joint Director,<br />
K. Narayana, Joint Director, and H. D. Ganesh, Director of Department of Economics and Statistics,<br />
Diwakar Rao M. H., Deputy Director, G. Prakasam, Director, H. S. Sridharamurthy, Director, J. B. Madalli,<br />
Assistant Director, Keshava, Deputy Director, M. A. Basith, Senior Director, Moti Ram Pawar, Joint<br />
Secretary to Government, M. Shivaprakash, Joint Secretary to Government, N. Sridhar, Director, S.A.<br />
Katarki, Deputy Director and Shankara Reddy, Assistant Director of Planning Department.<br />
Amalan Aditya Biswas, Deputy Secretary to Government (B & R), Finance Department, B. Prabhakar,<br />
Director, Treasuries, D. Thangaraj, Principal Secretary to Government, Health and Family Welfare<br />
Department, Dr. J. N. Raju, Project Director, K. C. Lakshminarayana, Joint Director, Watershed <strong>Development</strong><br />
Department, K. Lakshmipathy, Joint Director, Urban <strong>Development</strong> Department, K. Sreekanteshwara,<br />
Special offi cer and ex-offi cio Deputy Secretary, Education Department, Lukose Vallatharai, Secretary<br />
to Government, Revenue Department, Dr. M .B. Rudrappa, Deputy Director (RCH), Health and Family<br />
Welfare Department, Bangalore, M. N. Premakumari, Deputy Director and S.T. Banu, Joint Director of<br />
Women and Child <strong>Development</strong> Department, M. V. Thimmaiah, Joint Director, Social Welfare Department,<br />
S.C. Khuntia, Biomass Energy Research Institute, Bangalore, S. M. Acharya, Principal Secretary to<br />
Government, Department of Personnel Affairs and Reforms, S. Rajanna, Joint Director, <strong>Karnataka</strong> Slum<br />
Clearance Board, Bangalore, Vasanthi. K. R., KSWDC, Bangalore.<br />
Aditi Iyer, Anita Gurumurthy, Anupam M., Asha Beorge and Esther Quintero of Indian Institute of<br />
Management, Bangalore, Ahalya S. Bhat and Devaki Jain of Singamma Srinivasan Foundation,<br />
Tharanga, Bangalore, Basil Lionss, STEM, Bangalore, B. P. Vani, H. K. Amaranath, Veerashekarappa, K.<br />
N. M. Raju and Madhushree Shekar of Institute for Social and Economic Change, Bangalore, Bhuvana.<br />
R., Consultant, C Adarshan, and Shameem, Action Aid, Regional Manager, F. Stephen and Malini Eden<br />
of Search, Bangalore, Gopi Menan, Consultant, Gurumurthy, Azim Premji Foundation, Indira, <strong>Karnataka</strong><br />
Mahila Yuva Abhi Sangha, Indhu S., HHS Director, Bangalore, I. S. N. Prasad, CPO, KSHIP, Jasanthaswamy,<br />
President SAKT, K. Chandrashekar, Budda Education Society, Bangalore, Niva Nayak, KSCCW, CWC, P.<br />
F. Shapthi, APSA, Bangalore, Dr. Sailabala Debi of Centre for Multi Disciplinary Research, Dharwad,<br />
Ramachandra Rao, SRIJAN, Team Leader, Rinku Murgai, Senior Economist, World Bank, New Delhi, R.<br />
Shobha, President, S. Girija and Sarvamangala of KRMSAS, Krishik Bhavan, Bangalore, Satish Chandra,<br />
Institute for Agricultural Technologies, Shahateij, Coordinator and Sheela of Womens Voice, S. Savitha,<br />
Rati Sanga, Dr. Usha Abrol, Regional Director, National Institute of Child <strong>Development</strong>, Bangalore,<br />
Usha Gopinath, Consultant, Venkatesh (Joy Maliekal), RLHP, Mysore, Viswanath of Vivekananda Girijana<br />
Kalyana Kendra, H. D. Kote, V. R. Kulkarni, VHRDS, V. S. Desai, JSYS Representative, EDISN,<br />
Journalists: Ammu Joseph and Uathapyani.<br />
xv
Contents<br />
Abbreviations<br />
Introduction<br />
CHAPTER 1<br />
<strong>Karnataka</strong> : An Overview 1<br />
CHAPTER 2<br />
<strong>Human</strong> <strong>Development</strong> in <strong>Karnataka</strong> 9<br />
CHAPTER 3<br />
Financing <strong>Human</strong> <strong>Development</strong> 31<br />
CHAPTER 4<br />
Income, Employment and Poverty 73<br />
CHAPTER 5<br />
Literacy and Education 95<br />
CHAPTER 6<br />
Demography, Health and Nutrition 127<br />
CHAPTER 7<br />
Housing, Water Supply and Sanitation 153<br />
CHAPTER 8<br />
Gender and <strong>Human</strong> <strong>Development</strong> 169<br />
CHAPTER 9<br />
Status of Scheduled Castes in <strong>Karnataka</strong> 209<br />
CHAPTER 10<br />
Status of Scheduled Tribes in <strong>Karnataka</strong> 233<br />
CHAPTER 11<br />
Institutional Reforms for <strong>Human</strong> <strong>Development</strong>: Panchayat Raj 253<br />
CHAPTER 12<br />
Good Governance 267<br />
CHAPTER 13<br />
Voluntarism and Non-Governmental Organisations 277<br />
CHAPTER 14<br />
Self-Help Groups: Empowerment Through Participation 287<br />
CHAPTER 15<br />
The Way Forward 305<br />
Appendix: Statistical Tables 321<br />
Technical Note – Computing Indices 513<br />
Glossary (Statistical Terms) 520<br />
Glossary (Regional Terms) 523<br />
References 526<br />
xxiv<br />
xxix<br />
xvi
List of Figures<br />
Figure 3.1.1 Fiscal imbalance in <strong>Karnataka</strong>: 1990-91 to 2002-03 37<br />
Figure 3.1.2 Trends in revenues and expenditures in <strong>Karnataka</strong>: 1990-91 to 2002-03 37<br />
Figure 3.1.3 Revenue defi cit as percentage of fi scal defi cit: 1990-91 to 2002-03 38<br />
Figure 3.1.4 Trends in human development expenditure 42<br />
Figure 3.1.5 Composition of expenditure in the social sector: 1990-91 and 2002-03 44<br />
Figure 3.1.6 Rural development expenditure including Central transfers in <strong>Karnataka</strong> 45<br />
Figure 5.1 Inter-district disparities in the rural female literacy rate 101<br />
Figure 5.2 Gender disparity index of the literacy rate 102<br />
Figure 5.3 Percentage of girls’ enrolment to total enrolment 108<br />
Figure 5.4 Gross enrolment ratio for classes I to VIII 108<br />
Figure 5.5 Dropout rate in primary education in <strong>Karnataka</strong> 108<br />
Figure 5.6 Dropout rate (percentage) in various classes 111<br />
Figure 5.7 District-wise infrastructure index for primary schools: 2003-04 111<br />
Figure 5.8 High schools by management 115<br />
Figure 5.9 Dropout rate in classes I-X 116<br />
Figure 5.10 District-wise infrastructure index for secondary schools 117<br />
Figure 5.11 Growth of PU colleges and enrolment 119<br />
Figure 5.12 Pass percentages of PUC results by social groups 119<br />
Figure 6.1 Components of medical and public health expenditure in <strong>Karnataka</strong>:<br />
1990-91 and 2002-03 145<br />
Figure 7.1 Number of houses by type: <strong>Karnataka</strong> and India 2001 155<br />
Figure 8.5.1 Distribution of SHG members by social groups 199<br />
Figure 8.5.2 Category-wise distribution of SHG members by economic status 200<br />
Figure 8.5.3 Educational status among offi ce bearers of SHGs 200<br />
Figure 8.5.4 Women reporting changes in status after becoming SHG members 204<br />
Figure 8.5.5 Women’s perceptions of programme objectives 205<br />
Figure 9.1 Percentage share of SC/ST and Others to total population in <strong>Karnataka</strong> 212<br />
Figure 9.2 Decadal growth rate for SCs, STs, Others, and all population in <strong>Karnataka</strong> 212<br />
Figure 11.1 Plan expenditures of rural local governments 259<br />
List of Boxes<br />
Box 2.1 Differences between the HD approach and the non-HD approach 11<br />
Box 2.2 HDI and GDI/GEI of NHDR 13<br />
Box 2.3A Composition of HDI 2001 15<br />
Box 2.3B Composition of HDI 1991 17<br />
Box 2.4A Composition of GDI 2001 19<br />
Box 2.4B Composition of GDI 1991 21<br />
Box 2.5A Percentage increase/decrease in values of HD indicators: 2001 and 1991 23<br />
Box 2.5B Percentage increase/decrease in values of GD indicators: 2001 and 1991 25<br />
Box 3.2.1 Recommendations: Task Force on Higher Education for fi nancing higher education 65<br />
Box 3.3.1 Undertaking a gender budget initiative 68<br />
Box 3.3.2 Categorisation of departments 69<br />
Box 4.1 Major features of occupational categories 76<br />
Box 4.2 Changes in employment patterns over time: <strong>Karnataka</strong> versus all-India 89<br />
Box 5.1 UN Millennium <strong>Development</strong> Goals 97<br />
<strong>Karnataka</strong> <strong>Human</strong> <strong>Development</strong> <strong>Report</strong> <strong>2005</strong><br />
xvii
Box 5.2 Monitorable targets in the Tenth Five Year Plan of India 98<br />
Box 5.3 Selected social indicators with reference to the Tenth Plan targets and<br />
Millennium <strong>Development</strong> Goals – <strong>Karnataka</strong> 98<br />
Box 5.4 Objectives and goals of the Department of Primary and Secondary Education 104<br />
Box 5.5 Learning via satellite 105<br />
Box 5.6 Involving parents and the community 106<br />
Box 5.7 Mahiti Sindhu: IT at the grassroots 107<br />
Box 5.8 Initiatives for north <strong>Karnataka</strong> 109<br />
Box 5.9 How to guarantee learning 110<br />
Box 6.1 UN Millennium <strong>Development</strong> Goals to be achieved by 2015 130<br />
Box 6.2 <strong>Karnataka</strong> State Integrated Health Policy 2004 130<br />
Box 6.3 Yashaswini health insurance for farmers 145<br />
Box 6.4 Universal Health Insurance Scheme 146<br />
Box 6.5 Round-the-clock nursing services 147<br />
Box 6.6 Public-private partnership 148<br />
Box 6.7 Tele-medicine project 149<br />
Box 7.1 <strong>Karnataka</strong>’s Habitat Policy 156<br />
Box 7.2 Some innovative strategies 158<br />
Box 8.1 What is gender analysis? 171<br />
Box 8.2 What is empowerment? 174<br />
Box 8.3 The <strong>Karnataka</strong> Women’s Information and Resource Centre Project 193<br />
Box 8.4 Some recommendations of the <strong>Karnataka</strong> Task Force on Women’s Empowerment 195<br />
Box 8.5 Stree Shakti and Swashakti women’s self-help groups: A Survey 197<br />
Box 10.1 NGO experiences in tribal health 247<br />
Box 11.1 Imparting transparency and accountability in PRI functioning 257<br />
Box 11.2 Evaluation of Panchayat Raj system 264<br />
Box 12.1 Components of good governance 270<br />
Box 12.2 Government-citizen interaction for e-governance 272<br />
Box 13.1 Characteristics of NGOs’ activities 283<br />
Box 14.1 What is an SHG? 290<br />
Box 14.2 Promoting good quality SHGs through SPIN 294<br />
Box 14.3 Perspectives of poverty 294<br />
Box 14.4 Savings 296<br />
Box 14.5 Loan cycles 299<br />
Box 14.6 Profi les in empowerment 300<br />
Box 14.7 Leading to social and civic action 302<br />
Box 14.8 Dealing with dowry 303<br />
Box 14.9 The SHG that evolved into a CSO 303<br />
List of Tables<br />
Table 1.1 Composite <strong>Development</strong> Index: Ranking of districts in <strong>Karnataka</strong> 7<br />
Table 1.2 Backward taluks 8<br />
Table 2.1 The performance of districts in human development: 2001 and 1991 16<br />
Table 2.2 Five top and bottom ranking districts in HDI: 2001 and 1991 18<br />
Table 2.3 Inter-district variations in HDI values in selected districts: 1991 and 2001 20<br />
Table 2.4 Performance of districts in gender related development: 2001 and 1991 22<br />
Table 2.5 Five top and bottom ranking districts in GDI: 2001 and 1991 22<br />
xviii
<strong>Karnataka</strong> <strong>Human</strong> <strong>Development</strong> Abbreviations <strong>Report</strong> <strong>2005</strong><br />
Table 2.6 A Inter-regional comparisons: 2001 - Bombay <strong>Karnataka</strong> 24<br />
Table 2.6 B Inter-regional comparisons: 2001 - Hyderabad <strong>Karnataka</strong> 24<br />
Table 2.6 C Inter-regional comparisons: 2001 - Coastal and malnad 26<br />
Table 2.6 D Inter-regional comparisons: 2001 - Southern maidan 26<br />
Table 2.7 Gender gap: Four top and bottom ranking districts 26<br />
Table 2.8 A HDI of the Scheduled Castes and Scheduled Tribes: 2004 27<br />
Table 2.8 B GDI of the Scheduled Castes and Scheduled Tribes: 2004 27<br />
Table 2.9 HDI and GDI by social groups: 2001 28<br />
Table 2.10 Comparison of HDI and GDI of 15 major states: 2001 29<br />
Table 3.1.1 Selected developmental indicators in <strong>Karnataka</strong> 34<br />
Table 3.1.2 <strong>Human</strong> development indicators in <strong>Karnataka</strong> and neighbouring states 35<br />
Table 3.1.3 Plan expenditure from 2000-01 to <strong>2005</strong>-06: Main sectors by investment 39<br />
Table 3.1.4 Indicators of expenditure on social sectors in <strong>Karnataka</strong> 41<br />
Table 3.1.5 <strong>Human</strong> development expenditure in major Indian states: 1990-91 and 2001-02 43<br />
Table 3.1.6 Per capita real expenditure on human development in <strong>Karnataka</strong> 43<br />
Table 3.1.7 Real per capita public expenditure, social sector expenditure and human priority<br />
expenditure – 14 major states: 1990-91 and 2001-02 44<br />
Table 3.1.8 Expenditure under different heads of social sectors as a proportion of GSDP: <strong>Karnataka</strong> 45<br />
Table 3.2.1 Public expenditure ratio and social allocation ratio by type of education:<br />
1990-91 to 2002-03 50<br />
Table 3.2.2 Social allocation ratio by level of education and pattern of expenditure:<br />
1990-91 to 2002-03 51<br />
Table 3.2.3 Public expenditure ratio, social allocation ratio and patterns of expenditure in<br />
<strong>Karnataka</strong> and southern states: 2000-01 to 2002-03 53<br />
Table 3.2.4 Pattern of allocation and annual growth of expenditure on general education:<br />
1990-91 to 2002-03 54<br />
Table 3.2.5 Intra-sectoral allocation in general education: 1990-91 to 2002-03 54<br />
Table 3.2.6 Annual growth of intra-sectoral allocation on general education: 1990-91 to 2002-03 55<br />
Table 3.2.7 Intra-sectoral allocation by level of education in <strong>Karnataka</strong> and southern states:<br />
2000-01 to 2002-03 55<br />
Table 3.2.8 Pattern of expenditure in DMTFP for primary education: 2000-01 and 2001-02 57<br />
Table 3.2.9 Pattern of expenditure in DMTFP for secondary education: 2000-01 and 2001-02 58<br />
Table 3.2.10 District-wise block assistance per child and schooling achievements in<br />
<strong>Karnataka</strong>: 2000-01 59<br />
Table 3.2.11 Correlation matrix of outcomes and expenditure on elementary education across districts 60<br />
Table 3.2.12 Financial requirements for primary and secondary education 61<br />
Table 3.2.13 Projected resource requirement for universalising elementary education 62<br />
Table 3.2.14 Revenue receipts from primary and secondary education 63<br />
Table 3.2.15 Budgetary subsidy to higher education in <strong>Karnataka</strong>: 1990-91 to 2002-03 64<br />
Table 3.3.1 Women’s welfare (plan and non-plan expenditure) 67<br />
Table 3.3.2 <strong>Karnataka</strong> Mahila Abhivrudhi Yojane - Targets and achievements: 1999-2004 69<br />
Table 3.3.3 <strong>Karnataka</strong> Mahila Abhivrudhi Yojane - Targets and achievements<br />
(Department-wise): 1999-2004 70<br />
Table 4.1 Sectoral shares of Net State Domestic Product (at 1993-94 prices) 75<br />
Table 4.2 Changes in Gini Coeffi cient of operational holdings in 15 major states 76<br />
Table 4.3 Levels of living, inequality and poverty by occupational groups:<br />
<strong>Karnataka</strong> and all-India (1999-2000) 77<br />
Table 4.4 Net Domestic Product at factor cost by industry of origin (at 1993-94 prices) 78<br />
xix
Table 4.5 Estimates of Net District Domestic Product at current prices: 2001-02 79<br />
Table 4.6 Estimates of Gross Domestic Product per worker (at 1993-94 prices) 80<br />
Table 4.7 Agricultural wages for men and women: <strong>Karnataka</strong> 81<br />
Table 4.8 Incidence of poverty: <strong>Karnataka</strong> vs. all-India 82<br />
Table 4.9 District-wise per capita domestic product and incidence of poverty 83<br />
Table 4.10 Levels of living, inequality and poverty by social groups: <strong>Karnataka</strong> and all-India (1999-2000) 84<br />
Table 4.11 Percentage of child population living in poor households: 1999-2000 84<br />
Table 4.12 Enrolment in class I and dropouts: 1996-97 to 2002-03 85<br />
Table 4.13 Classifi cation of child labourers according to economic activity: <strong>Karnataka</strong> 85<br />
Table 4.14 Targets for poverty reduction: Tenth Five Year Plan 2007 86<br />
Table 4.15 Work participation rate: 1981, 1991 and 2001 86<br />
Table 4.16 Category of workers by social groups: 2001 87<br />
Table 4.17 Distribution of workforce by employment status (usual status adjusted) 88<br />
Table 4.18 Main and marginal workers 1991 and 2001: Southern states and all-India 88<br />
Table 4.19 Sectoral distribution of usual (principal + subsidiary) status of workers: 1983,<br />
1993-94 and 1999-2000 90<br />
Table 4.20 Unemployment rates: <strong>Karnataka</strong> and all-India 90<br />
Table 4.21 No. of unemployed person days per thousand person days (current daily status):<br />
<strong>Karnataka</strong> vs. all-India 91<br />
Table 4.22 Progress of SGRY (Stream I): 1998-99 to 2002-03 91<br />
Table 4.23 Progress of SGRY (Stream II): 1998-99 to 2002-03 91<br />
Table 4.24 Wage employment generated under various government programmes 92<br />
Table 4.25 Swarnajayanti Gram Swarozgar Yojana (SGSY): 1999-2000 to 2002-03 92<br />
Table 5.1 District-wise rural female literacy rate and percentage of rural families below<br />
poverty line: 2001 99<br />
Table 5.2 Literacy rate of <strong>Karnataka</strong> and all-India 100<br />
Table 5.3 Region-wise literacy-gender disparity index in <strong>Karnataka</strong>: 1991 and 2001 100<br />
Table 5.4 Coeffi cient of variation (percentage) in literacy rates by social groups 103<br />
Table 5.5 Decennial growth in literacy: Bijapur and Dakshina Kannada districts -1991 and 2001 103<br />
Table 5.6 Ratio of schools to students in primary education: A profi le - 2003-04 105<br />
Table 5.7 Distribution of primary schools by management and area: 2002-03 106<br />
Table 5.8 Net enrolment ratio 107<br />
Table 5.9 Region-wise dropout rate at the primary level (I-VII) 109<br />
Table 5.10 Percentage of children who are out of school in the age group 7-14 109<br />
Table 5.11 Percentage of children benefi ted through various programmes: <strong>Karnataka</strong> 110<br />
Table 5.12 Basic infrastructure in primary schools: India and selected states 111<br />
Table 5.13 Teacher absence and teaching activity in schools: <strong>Karnataka</strong> and selected states 112<br />
Table 5.14 7th standard examination pass percentages: <strong>Karnataka</strong> 113<br />
Table 5.15 Secondary schools in <strong>Karnataka</strong>: 2003-04 114<br />
Table 5.16 Percentage of girls enrolled in secondary schools 115<br />
Table 5.17 GER for secondary education for classes I-X and XI-XII 115<br />
Table 5.18 Percentage of female teachers in secondary schools by rural and urban<br />
areas in <strong>Karnataka</strong>: 2002 116<br />
Table 5.19 SSLC results: Percentage of students who passed the class X examination 117<br />
Table 5.20 District-wise education index: 1991 and 2001 120<br />
Table 6.1 Some demographic indicators 129<br />
Table 6.2 CBR and CDR: Regions of <strong>Karnataka</strong>, India and selected states 131<br />
Table 6.3 Expectation of life at birth of males and females in <strong>Karnataka</strong> and India 131<br />
Table 6.4 Persons reporting any ailment in the last 15 days prior to survey, by sex and residence 132<br />
xx
<strong>Karnataka</strong> <strong>Human</strong> <strong>Development</strong> <strong>Report</strong> <strong>2005</strong><br />
Table 6.5 HIV cases in <strong>Karnataka</strong> 133<br />
Table 6.6 IMR for <strong>Karnataka</strong> and India 133<br />
Table 6.7 Infant and child mortality in NFHS-1 and NFHS-2: <strong>Karnataka</strong> 133<br />
Table 6.8 IMR in the regions of <strong>Karnataka</strong>, all-India and selected states 134<br />
Table 6.9 Infant and child mortality for a ten-year period preceding NFHS-2: <strong>Karnataka</strong> 1999 135<br />
Table 6.10 Percentage of children who received vaccination, Vitamin A, iron and folic acid tablets/liquid 136<br />
Table 6.11 Causes of maternal mortality in selected states: 1998 137<br />
Table 6.12 Percentage of pregnant women who received antenatal services by<br />
background characteristics 138<br />
Table 6.13 Percentage of women who received ANC services: 1998-99 and 2002 138<br />
Table 6.14 Distribution of deliveries by place of delivery 139<br />
Table 6.15 Nutritional status of children under 3 years 140<br />
Table 6.16 Percentage of undernourished children below 3 years 140<br />
Table 6.17 Anthropometric indicators of nutritional status of children 140<br />
Table 6.18 Average intake of foodstuffs (gm/day) of children: <strong>Karnataka</strong> 2004 141<br />
Table 6.19 Percentage of children aged 6-35 months classifi ed as having anaemia by<br />
background characteristics: <strong>Karnataka</strong> 141<br />
Table 6.20 Percentage of children aged 6-35 months classifi ed as having anaemia:<br />
<strong>Karnataka</strong> and selected states 141<br />
Table 6.21 Women’s food consumption by background characteristics (at least once a week) 142<br />
Table 6.22 Nutritional status among ever married women in <strong>Karnataka</strong>: 1999 143<br />
Table 6.23 Body Mass Index: <strong>Karnataka</strong>, southern and other selected states 143<br />
Table 6.24 Percentage of ever married women (15-49 years) with iron defi ciency: <strong>Karnataka</strong> - 1999 144<br />
Table 6.25 Anaemia among women in states: 1991 144<br />
Table 6.26 Revenue expenditure in health and family welfare expenditure (excluding medical<br />
education, training and research): 2001-02 146<br />
Table 6.27 <strong>Karnataka</strong> and selected states: Per capita health expenditure 146<br />
Table 6.28 Regions and select ratios 147<br />
Table 6.29 Vacancy position of medical offi cers and other paramedical staff 147<br />
Table 6.30 Proportion of persons receiving treatment for ailments and per capita public<br />
expenditure on health 148<br />
Table 6.31 <strong>Karnataka</strong> Health Vision 2020: Targets 150<br />
Table 7.1 Distribution of households by tenure and type: <strong>Karnataka</strong> and selected states: 2001 157<br />
Table 7.2 Houses constructed under State and Central schemes: 1999-2004 159<br />
Table 7.3 Distribution of households by location of drinking water: <strong>Karnataka</strong> 2001 160<br />
Table 7.4 Distribution of households by source of drinking water: <strong>Karnataka</strong> 2001 161<br />
Table 7.5 Number of households with bathroom, latrine and drainage facility: <strong>Karnataka</strong> 2001 161<br />
Table 7.6 Distribution of households by location of drinking water: <strong>Karnataka</strong> and selected states 162<br />
Table 7.7 Distribution of households by source of drinking water: <strong>Karnataka</strong> and selected states 163<br />
Table 7.8 Distribution of households by bathroom, latrine and drainage: <strong>Karnataka</strong> and<br />
selected states 165<br />
Table 7.9 Distribution of main source of drinking water in urban slums 167<br />
Table 7.10 Plan and non-plan allocation of funds for water sector 167<br />
Table 8.1 District-wise selected key indicators of <strong>Karnataka</strong> 173<br />
Table 8.2 Work participation rates: Southern states and India 175<br />
Table 8.3 Working population: Districts 176<br />
Table 8.4 Distribution of main and marginal workers by region for <strong>Karnataka</strong> 177<br />
Table 8.5 Workers by category in southern states 177<br />
Table 8.6 Category-wise workers in districts: 2001 178<br />
xxi
Table 8.7 Agricultural wages of rural labourers in <strong>Karnataka</strong> by districts 179<br />
Table 8.8 Sex ratios for southern states: 1901-2001 181<br />
Table 8.9 Sex ratio by districts in <strong>Karnataka</strong> with rates of change over the century 181<br />
Table 8.10 Sex ratio and child sex ratio: A comparison with southern states 182<br />
Table 8.11 Sex ratio and child sex ratio by districts in <strong>Karnataka</strong> 183<br />
Table 8.12 District-wise child sex ratio 2001: Rural and urban 184<br />
Table 8.13 Percentage of ever married women involved in household decision-making, freedom of<br />
movement and access to money: Southern states 185<br />
Table 8.14 Percentage of ever married women who have been physically abused: Southern states 185<br />
Table 8.15 Crimes against women: <strong>Karnataka</strong> 186<br />
Table 8.16 Total crimes committed against women in <strong>Karnataka</strong>: 1999-2003 187<br />
Table 8.17 Elected women members in Panchayat Raj institutions: Selected states 191<br />
Table 8.18 Women in decision-making positions in PRIs 192<br />
Table 8.19 Percentage of women GP members by issues they took up in the panchayat:<br />
Selected districts 194<br />
Table 8.20 Percentage of women GP members by their performance across caste groups 194<br />
Table 8.5.1 Distribution of SHG members by social groups 198<br />
Table 8.5.2 SHG members reporting an improvement in monthly income after joining the group 202<br />
Table 8.5.3 Autonomy levels of SHG members 203<br />
Table 8.5.4 Improvement in members’ levels of awareness and knowledge 205<br />
Table 9.1 Distribution of SC/ST population in <strong>Karnataka</strong>: Rural and urban 212<br />
Table 9.2 District-wise percentage of SC sub-caste population to total SC population in<br />
<strong>Karnataka</strong>: 1991 213<br />
Table 9.3 Key demographic indicators 214<br />
Table 9.4 Distribution of operational holdings and operated areas by major size<br />
class for different social groups in <strong>Karnataka</strong>: 2001 215<br />
Table 9.5 Ownership of agricultural land 215<br />
Table 9.6 Occupational distribution 215<br />
Table 9.7 Area-wise distribution of households by source of income and social groups:<br />
<strong>Karnataka</strong> and India 1999-2000 218<br />
Table 9.8 Source-wise distribution of household income in rural areas for different social and<br />
religious groups 219<br />
Table 9.9 Income and expenditure 219<br />
Table 9.10 Literacy rate among SCs and general population in <strong>Karnataka</strong> 220<br />
Table 9.11 Mean years of schooling 221<br />
Table 9.12 Percentage of children who are out of school in the age group 7-14 221<br />
Table 9.13 Percentage of students who passed the SSLC examination: 2001-05 222<br />
Table 9.14 Percentage distribution of SC population aged 7+ years by level of education 222<br />
Table 9.15 Percentage of households with safe drinking water 223<br />
Table 9.16 Distribution of households by availability of electricity, latrine and bathroom<br />
facilities in southern states: 2001 225<br />
Table 9.17 Infant and child mortality by social groups 226<br />
Table 9.18 Percentage of tetanus toxoid vaccinations: 1998-99 226<br />
Table 9.19 Percentage distribution of deliveries by SC women by age group 227<br />
Table 9.20 Percentage distribution of type of assistance at delivery 227<br />
Table 9.21 Nutritional status of women by social groups: 1998-99 227<br />
Table 9.22 Scheduled Castes in <strong>Karnataka</strong>: Key indicators 228<br />
Table 9.23 Funds pooled under the Special Component Plan 229<br />
Table 9.24 Disposal of cases under P.C.R. and P.A. Acts: 2003 230<br />
xxii
Table 10.1 Scheduled Tribes’ literacy rates by sex and region: 1991 and 2001 237<br />
Table 10.2 Percentage of out-of-school children in the age group 7-14 238<br />
Table 10.3 Percentage of students who passed the SSLC examinations: 2001-05 239<br />
Table 10.4 Percentage distribution of ST population aged 7+ years by levels of education 239<br />
Table 10.5 Category-wise working population of Scheduled Tribes in <strong>Karnataka</strong>: 2001 240<br />
Table 10.6 Ownership of agricultural land 240<br />
Table 10.7 Ownership of land holdings by size 240<br />
Table 10.8 MPCE: <strong>Karnataka</strong> and selected states 241<br />
Table 10.9 Income and expenditure: 2004 241<br />
Table 10.10 Total fertility rate and child mortality: Some indicators 241<br />
Table 10.11 Antenatal care during pregnancy 242<br />
Table 10.12 Tetanus toxoid vaccinations and iron/folic acid tablets during pregnancy 242<br />
Table 10.13 Nutrition status of children 243<br />
Table 10.14 Availability of drinking water facility 244<br />
Table 10.15 Funds pooled under the Tribal Sub-Plan 245<br />
Table 10.16 Scheduled Tribes in <strong>Karnataka</strong>: Key indicators 248<br />
Table 10.17 Major Scheduled Tribes in <strong>Karnataka</strong> 250<br />
Table 11.1 Revenue and expenditure pattern of PRIs (all tiers): Selected states, 1997-98 261<br />
Table 11.2 Own revenue and expenditure pattern of village panchayats: Some selected states,<br />
1997-98 262<br />
Table 11.3 Distribution of elected panchayat members by category: 1994 and 2000 263<br />
Table 12.1 Profi le of bribes paid by in-patients on various counts 273<br />
Table 13.1 Category index of NGOs 284<br />
Table 14.1 Some SHG-promoting institutions 292<br />
Table 14.2 Savings by SHG members in selected major programmes 295<br />
Table 14.3 Savings of SHGs 296<br />
Table 14.4 Loans given by selected SHGs to their members 296<br />
Table 14.5 Pattern of lending 297<br />
Table 14.6 Percentage of households above the poverty line 299<br />
Table 14.7 Financial status of SHG members 299<br />
Table 14.8 Loans by banks to SHGs under the SHG-Bank Linkage Programme 300<br />
Table 14.9 Credit disbursements to SHGs under SGSY and Bank Linkage Programmes 301<br />
Table 14.10 Increased decision-making power of women SHG members in their households 301<br />
Table 14.11 Increased infl uence of SHGs over community/village issues 301<br />
Table 14.12 Increased knowledge and awareness of SHG members 302<br />
Table 14.13 Stree Shakti SHGs: Involvement in social activities 303<br />
xxiii
Abbreviations<br />
ABER : Annual Blood Examination Rate<br />
ADB : Asian <strong>Development</strong> Bank<br />
AIDS : Acquired Immune Defi ciency Syndrome<br />
ANC : Antenatal Care<br />
ANMs : Auxiliary Nurse and Midwives<br />
ANSSIRD : Abdul Nasir Sab State Institute for Rural <strong>Development</strong><br />
API : Annual Parasite Incidence<br />
APL : Above Poverty Line<br />
AWPS : All Women Police Stations<br />
BCG : Bacillus Calmette-Guerin<br />
BESCOM : Bangalore Electricity Supply Company<br />
BK : Bombay <strong>Karnataka</strong><br />
BMI : Body Mass Index<br />
BPL : Below Poverty Line<br />
BWSSB : Bangalore Water Supply and Sanitation Board<br />
CALCs : Computer Aided Learning Centres<br />
CATAD : Centre for Advanced Training in Agricultural and Rural <strong>Development</strong><br />
CBOs : Community Based Organisations<br />
CBR : Crude Birth Rate<br />
CCDI : Composite Comprehensive <strong>Development</strong> Index<br />
CDR : Crude Death Rate<br />
CECs : Continuing Education Centres<br />
CHCs : Community Health Centres<br />
CMC : City Municipal Corporation<br />
CMDR : Centre for Multi-Disciplinary Research<br />
CMR : Child Mortality Rate<br />
CPIAL : Consumer Price Index of Agricultural Labourers<br />
CRE : Civil Rights Enforcement<br />
CSO : Central Statistical Organisation<br />
CSOs : Civil Society Organisations<br />
CSR : Child Sex Ratio<br />
DAG : District At A Glance<br />
DCC : District Credit Cooperatives<br />
DDP : Desert <strong>Development</strong> Programme<br />
DES : Directorate of Economics and Statistics<br />
DHFWS : Directorate of Health and Family Welfare Services<br />
DMTFP : Departmental Medium Term Fiscal Plan<br />
DPAP : Drought Prone Area <strong>Development</strong> Programme<br />
DPEP : District Primary Education Programme<br />
DPCs : District Planning Committees<br />
DPT : Diphtheria, Polio and Tuberculosis<br />
DRDAs : District Rural <strong>Development</strong> Agencies<br />
xxiv
<strong>Karnataka</strong> <strong>Human</strong> <strong>Development</strong> <strong>Report</strong> <strong>2005</strong><br />
DSERT : Department of Secondary Education Research and Training<br />
DTE : Directorate of Technical Education<br />
DWCD : Department of Women and Child <strong>Development</strong><br />
DWACRA : <strong>Development</strong> of Women and Children in Rural Areas<br />
EAS : Employment Assurance Scheme<br />
EDC : Education <strong>Development</strong> Committees<br />
EDUSAT : Education through Satellite<br />
EI : Education Index<br />
EMIS : Education Management Information System<br />
ESCOMs : Electricity Supply Companies<br />
EWRs : Elected Women Representatives<br />
EWS : Economically Weaker Sections<br />
FIR : First Information <strong>Report</strong><br />
FPAI : Family Planning Association of India<br />
FORCES : Forum for Creche and Childcare Services<br />
GDI : Gender <strong>Development</strong> Index<br />
GDP : Gross Domestic Product<br />
GDDP : Gross District Domestic Product<br />
GEI : Gender Empowerment Index<br />
GEM : Gender Empowerment Measure<br />
GER : Gross Enrolment Ratio<br />
GIA : Grant-in-aid<br />
GIS : Geographical Information System<br />
GoI : Government of India<br />
GoK : Government of <strong>Karnataka</strong><br />
GP : Gram Panchayat<br />
GSDP : Gross State Domestic Product<br />
HDI : <strong>Human</strong> <strong>Development</strong> Index<br />
HDR : <strong>Human</strong> <strong>Development</strong> <strong>Report</strong><br />
HDRC : <strong>Human</strong> <strong>Development</strong> Resource Centre<br />
HER : <strong>Human</strong> Expenditure Ratio<br />
HHS : Hengasara Hakkina Sangha<br />
HIV : <strong>Human</strong> Immunodefi ciency Virus<br />
HK : Hyderabad <strong>Karnataka</strong><br />
HPCFRRI : High Power Committee for Redressal of Regional Imbalances<br />
HRD : <strong>Human</strong> Resource <strong>Development</strong><br />
HUDCO : Housing and Urban <strong>Development</strong> Corporation<br />
IAY : Indira Awas Yojana<br />
ICDS : Integrated Child <strong>Development</strong> Services<br />
ICHAP : India Canada Collaboration HIV/AIDS Project<br />
IDA : International <strong>Development</strong> Agency<br />
IFAD : International Fund for Agricultural <strong>Development</strong><br />
IGD : Index of Gender Disparity<br />
IIM : Indian Institute of Management<br />
IIPS : International Institute of Population Sciences<br />
IMR : Infant Mortality Rate<br />
IMK : Indira Mahila Kendra<br />
IMY : Indira Mahila Yojana<br />
xxv
Abbreviations<br />
INS : Indian Naval Services<br />
INSAT : Indian National Satellite<br />
IPC : Indian Penal Code<br />
IRDP : Integrated Rural <strong>Development</strong> Programme<br />
ISEC : Institute of Social and Economic Change<br />
ISRO : Indian Space Research Organisation<br />
IT : Information Technology<br />
ITDP : Integrated Tribal <strong>Development</strong> Project<br />
ITI : Industrial Training Institute<br />
IUD : Intra Uterine Device<br />
IWDP : Integrated Wasteland <strong>Development</strong> Programme<br />
JGSY : Jawahar Grama Swarozgar Yojana<br />
KAWAD : <strong>Karnataka</strong> Watershed <strong>Development</strong> Society<br />
KDP : <strong>Karnataka</strong> <strong>Development</strong> Project<br />
KHDR : <strong>Karnataka</strong> <strong>Human</strong> <strong>Development</strong> <strong>Report</strong><br />
KHSDP : <strong>Karnataka</strong> Health Services <strong>Development</strong> Project<br />
KLAC : <strong>Karnataka</strong> Land Army Corporation<br />
KMAY : <strong>Karnataka</strong> Mahila Abhivrudhi Yojane<br />
KPTCL : <strong>Karnataka</strong> Power Transmission Corporation Limited<br />
KSCB : <strong>Karnataka</strong> Slum Clearance Board<br />
KSWDC : <strong>Karnataka</strong> State Women’s <strong>Development</strong> Corporation<br />
KUDCEMP : <strong>Karnataka</strong> Urban <strong>Development</strong> and Coastal Environment Management Project<br />
KUIDFC : <strong>Karnataka</strong> Urban Infrastructure <strong>Development</strong> and Finance Corporation<br />
KUWSDB : <strong>Karnataka</strong> Urban Water Supply and Drainage Board<br />
LAMPS : Large Scale Adivasi Multipurpose Societies<br />
LEB : Life Expectancy at Birth<br />
LPCD : Litres Per Capita Consumption Per Day<br />
MCH : Maternal and Child Health<br />
MDG : Millennium <strong>Development</strong> Goals<br />
MFP : Minor Forest Produce<br />
MIS : Monitoring Information System<br />
MMR : Monthly Monitoring Review<br />
MMR : Maternal Mortality Rate<br />
MPCE : Monthly Per Capita Expenditure<br />
MYRADA : Mysore Resettlement and <strong>Development</strong> Agency<br />
NABARD : National Bank for Agriculture and Rural <strong>Development</strong><br />
NAEP : National Adult Education Programme<br />
NCAER : National Council for Applied Economic Research<br />
NCEC : Nodal Continuing Education Centres<br />
NDDP : Net District Domestic Product<br />
NDP : Net Domestic Product<br />
NER : Net Enrolment Ratio<br />
NFHS : National Family Health Survey<br />
NGOs : Non-Governmental Organisations<br />
NHDR : National <strong>Human</strong> <strong>Development</strong> <strong>Report</strong><br />
NHP : National Health Policy<br />
NIMHANS : National Institute of Mental Health and Neuro Sciences<br />
xxvi
<strong>Karnataka</strong> <strong>Human</strong> <strong>Development</strong> <strong>Report</strong> <strong>2005</strong><br />
NIPFP : National Institute of Public Finance and Policy<br />
NIRD : National Institute for Rural <strong>Development</strong><br />
NK : North <strong>Karnataka</strong><br />
NLM : National Literacy Mission<br />
NNM : Neonatal Mortality<br />
NNMB : National Nutrition Monitoring Bureau<br />
NSDP : Net State Domestic Product<br />
NSFDC : National Scheduled Castes Finance and <strong>Development</strong> Corporation<br />
NSS : National Sample Survey<br />
NSSO : National Sample Survey Organisation<br />
NTFP : Non Timber Forest Products<br />
NURM : National Urban Renewal Mission<br />
NWDP : National Wastelands <strong>Development</strong> Programme<br />
NWDPRA : National Watershed <strong>Development</strong> Programme and Rainfed Agriculture<br />
OBCs : Other Backward Classes<br />
ORG-MARG : Operations Research Group-Marketing and Research Group<br />
PAC : Public Affairs Centre<br />
PCA : Primary Census Abstract<br />
PCDP : Per Capita Domestic Product<br />
PCDDP : Per Capita District Domestic Product<br />
PCI : Per Capita Income<br />
PCR : Protection of Civil Rights<br />
PDS : Public Distribution System<br />
PFs : Public Fountains<br />
PHCs : Primary Health Centres<br />
PHUs : Primary Health Units<br />
PLC : Post Literacy Campaign<br />
PMGY : Pradhan Mantri Gramodaya Yojana<br />
PNC : Post-natal Care<br />
PPP$ : Purchasing Power Parity in terms of Dollars<br />
PRIs : Panchayat Raj Institutions<br />
PSUs : Public Sector Undertakings<br />
PTR : Pupil Teacher Ratio<br />
RCC : Reinforced Cement Concrete<br />
RCH : Reproductive and Child Health<br />
RDPR : Rural <strong>Development</strong> and Panchayat Raj<br />
RGI : Registrar General of India<br />
RGRHCL : Rajiv Gandhi Rural Housing Corporation Limited<br />
ROT : Receive Only Terminals<br />
RRBs : Regional Rural Banks<br />
RTC : Record of Rights, Tenancy and Crop Enumeration<br />
RTI : Reproductive Tract Infection<br />
RTI Act : Right To Information Act<br />
SAR : Social Allocation Ratio<br />
SCs : Scheduled Castes<br />
SCP : Special Component Plan<br />
SDMCs : School <strong>Development</strong> and Monitoring Committees<br />
xxvii
Abbreviations<br />
SDP : State Domestic Product<br />
SFC : State Finance Commission<br />
SGRY : Sampoorna Grameena Rozgar Yojana<br />
SHDR : State <strong>Human</strong> <strong>Development</strong> <strong>Report</strong><br />
SHGs : Self-Help Groups<br />
SGSY : Swarnajayanti Gram Swarozgar Yojana<br />
SJRY : Swarna Jayanti Rozgar Yojana<br />
SJSRY : Swarna Jayanti Shahari Rozgar Yojana<br />
SK : South <strong>Karnataka</strong><br />
SNDT : Srimati Nathibai Damodardas Thackersey University<br />
SPIN : Self-Help Promoting Institution<br />
SPR : Social Priority Ratio<br />
SPVs : Special Purpose Vehicles<br />
SRS : Sample Registration System<br />
SSA : Sarva Shikshana Abhiyan<br />
SSF : Singamma Sreenivasan Foundation<br />
STs : Scheduled Tribes<br />
STD : Sexually Transmitted Diseases<br />
STI : Sexually Transmitted Infections<br />
TB : Tuberculosis Bacilli<br />
TFR : Total Fertility Rate<br />
TLC : Total Literacy Campaign<br />
TLM : Teaching Learning Material<br />
TMCs : Town Municipal Councils<br />
TPs : Taluk Panchayats<br />
TSP : Tribal Sub Plan<br />
TT : Tetanus Toxoid<br />
UDR : Unnatural Death Register<br />
UEE : Universal Elementary Education<br />
UFW : Unaccounted For Water<br />
UGD : Under Ground Drainage<br />
ULBs : Urban Local Bodies<br />
UNDP : <strong>United</strong> <strong>Nations</strong> <strong>Development</strong> Programme<br />
VCTCs : Voluntary Counselling and Testing Centres<br />
VECs : Village Education Committees<br />
VFCs : Village Forest Committees<br />
VTU : Vishveswaraiah Technological University<br />
WB : World Bank<br />
WGDP : Western Ghat <strong>Development</strong> Programme<br />
WPR : Work Participation Rate<br />
WSHG : Women’s Self-Help Group<br />
ZPs : Zilla Panchayats<br />
xxviii
Introduction<br />
In 1999 <strong>Karnataka</strong> became the second Indian<br />
state to publish a <strong>Human</strong> <strong>Development</strong> <strong>Report</strong><br />
(HDR) – a balanced, analytical deconstruction<br />
of the human development scenario in the<br />
state. The HDR noted that while <strong>Karnataka</strong> had<br />
performed well, on both human development<br />
and gender development indices of the nation,<br />
the state lagged behind Kerala, Maharashtra and<br />
Gujarat, which occupied the top three places in<br />
the nationwide HDI. The <strong>Report</strong>’s ranking of the<br />
districts of <strong>Karnataka</strong> on the global HDI and GDI<br />
revealed the existence of sharp socio-economic<br />
disparities between districts.<br />
Since the publication of the fi rst HDR in 1999,<br />
there have been signifi cant pro-active state<br />
interventions in sectors such as primary education,<br />
social welfare, women’s economic development,<br />
and poverty alleviation. Along with policies to<br />
address regional disparities, there is now a greater<br />
emphasis on public-private initiatives in the social<br />
sector, reinforced by institutional reforms directed<br />
at strengthening and empowering Panchayat Raj<br />
institutions in order to enable the emergence<br />
of a sustainable, participatory development<br />
environment.<br />
Financing human development<br />
It is, therefore, time to take stock of the human<br />
development scenario in <strong>Karnataka</strong> along with<br />
certain key issues that impact the development<br />
process, namely, the Government of <strong>Karnataka</strong>’s<br />
investments in human development and the<br />
outcomes of these policy decisions for human<br />
development indicators such as life expectancy,<br />
female literacy, access to education, reductions in<br />
the IMR and MMR, quality of life, and diminution<br />
in gender, caste and economic disparities. This<br />
means we need to look at public spending over<br />
a signifi cant period. Hence, this <strong>Report</strong> will<br />
examine and analyse the relation between public<br />
investment patterns and human development<br />
outcomes. The state is, after all, the principal<br />
investor in basic needs and special interest group<br />
programmes.<br />
<strong>Karnataka</strong> has defi nitely invested in poverty<br />
reduction, health and nutrition, education, and<br />
social welfare. Given this, the question is, what<br />
are the implications of this investment for human<br />
development in the state with reference to<br />
all-India norms and, more importantly, to other<br />
states that have performed well on HD indicators?<br />
There is little doubt that, in a developing country,<br />
public spending on services and infrastructure<br />
affords the best opportunity for the poor and<br />
the marginalised to improve their life condition.<br />
They provide increased access to services that go<br />
beyond the provisioning of basic necessities and<br />
signifi cantly improve the quality of life of the poor,<br />
viz. education, basic healthcare, nutrition, safe<br />
drinking water, sanitation, housing, etc. However,<br />
most states have other imperatives as well, such<br />
as economic growth, which is also a prerequisite<br />
for human development. A state like <strong>Karnataka</strong><br />
invests heavily in irrigation and power. Striking the<br />
right fi scal balance between human development<br />
and other thrust areas is, therefore, critical for a<br />
state seeking to energise its human developmentoriented<br />
activities.<br />
It is crucial to resist the temptation to simplistically<br />
equate heavy spending with an automatic<br />
improvement in human development indicators.<br />
To achieve palpable improvements in this area,<br />
budgetary expenditures need to strategically target<br />
key human development sectors, and investments,<br />
in turn, need to be supported by effi cient service<br />
delivery systems. Moreover, non-governmental<br />
investment, in a state like <strong>Karnataka</strong>, forms a<br />
signifi cant part of investment in services and<br />
infrastructure and looking at non-government<br />
investment in the HDR offers the twin advantages<br />
of (a) presenting a more inclusive picture while<br />
(b) acknowledging the role of non-government<br />
spending on human development. The constraints<br />
are (i) the diffi culty in data collection and (ii)<br />
the fact that in the end analysis, governments<br />
can do little to infl uence private investments in<br />
these sectors, thus limiting the usefulness of<br />
such information. Therefore, the <strong>Report</strong> focuses<br />
xxix
Introduction<br />
primarily on public spending, while at the same time<br />
including a segment on the new and innovative<br />
private-public partnerships emerging in the social<br />
services sector.<br />
The HDR attempts to measure the state’s<br />
performance in human development in those<br />
human priority areas that most affect the living<br />
conditions of the poor and the vulnerable:<br />
education and literacy, nutrition and healthcare,<br />
protected water supply and sanitation, housing,<br />
incomes and livelihoods.<br />
The HDR views the theme of spending on human<br />
development from two perspectives.<br />
(i) Factoring equity and social justice<br />
issues: <strong>Human</strong> development for the<br />
vulnerable sections of society<br />
When public investment produces equitable<br />
outcomes, it favourably impacts the living<br />
conditions of the most marginal, and therefore,<br />
vulnerable, sub-populations in society. While<br />
these sub-populations, whose human<br />
development indices are markedly below that<br />
of the general population, are often the focus of<br />
special state policies/programmes, the <strong>Report</strong><br />
also examines whether equity and social justice<br />
objectives have been achieved and whether<br />
these programmes and policies empower the<br />
marginalised sections of society. The focus<br />
groups are women, children, Scheduled Castes<br />
and Scheduled Tribes and people below the<br />
poverty line. Regional disparity being the fourth<br />
dimension of deprivation, the <strong>Report</strong> consciously<br />
attempts to portray the interconnection of<br />
multiple forms of deprivation and their outcomes<br />
for people’s human development.<br />
A unique feature of this HDR is the highly detailed<br />
analysis of the status of Scheduled Castes<br />
and Tribes in the state. A sample survey was<br />
commissioned and entrusted to the Department<br />
of Economics and Statistics to collect and collate<br />
data for preparation of the HDI and GDI of the<br />
Scheduled Castes and Tribes in the state. No other<br />
State HDR has attempted this exercise. Chapters 9<br />
and 10 make use of these HDI and GDI to uncover<br />
a hitherto unlit landscape of deprivation. A second<br />
study, especially commissioned for the <strong>Report</strong> is<br />
an analysis of women’s self-help groups.<br />
(ii) Factoring good governance,<br />
efficient service delivery, people’s<br />
participation: Making human<br />
development participatory, democratic<br />
and accessible<br />
While mobilisation and optimal allocation of<br />
resources for human development is signifi cant,<br />
the <strong>Report</strong> also highlights the factors that<br />
underpin effective service delivery, i.e. good<br />
governance, responsive local level institutions and<br />
people’s participation in their own socio-economic<br />
development. ‘How’ resources are deployed is as<br />
important as ‘how much’ is invested. Pumping in<br />
money without ensuring effi cient and effective<br />
delivery mechanisms could mean that resources<br />
are not being optimally utilised. Ensuring<br />
human development is people-centred means<br />
that institutions at various levels must function<br />
effi ciently and be accountable to the people. The<br />
key stakeholders in the process of making the<br />
system more effi cient, democratic, transparent<br />
and participatory are the state government,<br />
Panchayat Raj institutions, NGOs, and community<br />
based organisations. An analysis of the roles of<br />
these agencies in improving governance for better<br />
human development is a signifi cant theme of this<br />
HDR.<br />
Objectives<br />
The main objectives of the <strong>Report</strong> are:<br />
• To develop baseline data on the status of human<br />
development in relation to public investment in<br />
the state and the districts;<br />
• To provide a comprehensive analysis of<br />
human development goals and outcomes,<br />
especially for the most vulnerable<br />
sub-populations;<br />
• To examine the effi ciency of service delivery<br />
and the role, in improving governance, of<br />
Panchayat Raj institutions and the impact of<br />
collective action mobilised by NGOs/the state,<br />
either through self-help groups or through<br />
other community based organisations that<br />
manage community resources;<br />
• To suggest how the state can mobilise resources<br />
for human development and how resources<br />
xxx
<strong>Karnataka</strong> <strong>Human</strong> <strong>Development</strong> <strong>Report</strong> <strong>2005</strong><br />
can be re-ordered more effectively, both intersectorally<br />
and intra-sectorally;<br />
• To suggest ways in which existing resources can<br />
be utilised more effi ciently;<br />
• To suggest how the HDI and GDI can be<br />
improved;<br />
• To ensure that people are always the centre of<br />
the development process in the state.<br />
Methodology<br />
To analyse public investments in human<br />
development, the <strong>Report</strong> uses the methodology<br />
of the UNDP in its 1991 HDR, Financing <strong>Human</strong><br />
<strong>Development</strong>. The UNDP HDR speaks of four<br />
ratios: (i) the public expenditure ratio (PER)<br />
i.e. the percentage of national income that<br />
goes into public expenditure (in <strong>Karnataka</strong>’s<br />
fi rst HDR this had been modifi ed to revenue<br />
expenditure as a percentage of SDP); (ii) social<br />
allocation ratio (SAR) or the percentage of<br />
public expenditure earmarked for social services;<br />
(iii) social priority ratio (SPR), i.e. the percentage<br />
of social expenditure devoted to human priority;<br />
and (iv) human expenditure ratio (HER) which<br />
is the percentage of national income devoted to<br />
human priority concerns. We propose to modify it<br />
to ‘percentage of SDP devoted to human priority<br />
concerns’. No. 4 is the product of the fi rst 3 ratios<br />
and is a tool that enables planners to spot gaps<br />
and options.<br />
Preparation of the HDR <strong>2005</strong><br />
The concepts and draft papers comprising the<br />
<strong>Report</strong> were shared at various stages with<br />
stakeholders, viz. academics, NGOs, people’s<br />
representatives, community based organisations,<br />
women’s groups and bureaucrats from the sectors<br />
concerned. The writing of the <strong>Report</strong> was a<br />
dynamic and interactive process. It was fl agged<br />
off at a state level workshop in Bangalore in<br />
October 2003, followed by two regional level<br />
workshops in Dharwad and Mysore where chapter<br />
concepts were presented by the paper writers. In<br />
August 2004, draft papers were presented to an<br />
appreciative, if critical group, yielding invaluable<br />
inputs. The fi nal <strong>Report</strong> owes a great deal to all<br />
the participants who unstintingly spared their<br />
time to share their views with us.<br />
Finally, it is heartening to know that this HDR is<br />
being eagerly awaited by the many stakeholders<br />
in the state. The end objective of any such <strong>Report</strong><br />
is to function as a useful policy tool that furthers<br />
the process of human development in the state.<br />
xxxi
<strong>Karnataka</strong>: An Overview
North<br />
Bangalore Urban<br />
Note: Uttara Kannada - part of Bombay <strong>Karnataka</strong>
CHAPTER 1<br />
<strong>Karnataka</strong> <strong>Human</strong> <strong>Development</strong> <strong>Report</strong> <strong>2005</strong><br />
<strong>Karnataka</strong>: An Overview<br />
Introduction<br />
<strong>Karnataka</strong> is a state of diverse cultures, languages<br />
and faiths and the economic and social scenario<br />
within the state, in many ways, mirrors the<br />
scenario prevalent in the country itself. Located in<br />
the southern part of India, between the latitudes<br />
11.31 ° and 18.45 ° North and the longitudes<br />
74.12 ° and 78.40 ° East, <strong>Karnataka</strong> is, in terms of<br />
population, the ninth largest state among India’s<br />
28 major states and 7 Union Territories. Along its<br />
northern borders lie the states of Maharashtra and<br />
Goa; Andhra Pradesh is to the east; Tamil Nadu<br />
and Kerala to the south, while the Arabian Sea<br />
forms the western boundary. This chapter presents<br />
a brief overview of the state’s geographical and<br />
economic features to set the context for the <strong>Human</strong><br />
<strong>Development</strong> <strong>Report</strong>. It will also present a brief<br />
overview of regional disparities – an analytical<br />
thread that runs through the <strong>Report</strong> – lending<br />
multiple dimensions to discussions of human<br />
development and deprivation in the context of<br />
equity and social justice.<br />
<strong>Karnataka</strong> came into being as a state of the Union<br />
of India on November 1, 1956 as a result of the<br />
merger of fi ve territories where Kannada was the<br />
language of the people. These were: four districts<br />
of the erstwhile Bombay state; three districts of<br />
the erstwhile princely state of Hyderabad; two<br />
districts and one taluk of the former Madras state;<br />
the former Part C state of Coorg (now known as<br />
Kodagu); and nine districts of the former princely<br />
state of Mysore. The new state was initially known<br />
as Mysore, but subsequently, in 1973, it was<br />
renamed ‘<strong>Karnataka</strong>’, thereby fulfi lling a long<br />
standing demand of the people of the state. For<br />
administrative purposes, the state is divided into<br />
27 revenue districts. There were initially, at the<br />
time of reorganisation, 19 districts, but over time<br />
more districts were created. Bangalore Urban<br />
district was created in 1986 and, subsequently, in<br />
1997-98, another restructuring led to the creation<br />
of Udupi (from Dakshina Kannada), Chamarajnagar<br />
(from Mysore), Koppal (from Raichur), Bagalkot<br />
(from Bijapur), Gadag and Haveri (from Dharwad)<br />
and Davangere (from Chitradurga, Shimoga<br />
and Bellary). There were four revenue divisions<br />
— Bangalore, Mysore, Belgaum and Gulbarga<br />
— which were abolished in 2003 as part of an<br />
ongoing process of administrative reforms.<br />
Geographical traits<br />
The state has an area of 1,91,791 sq km, which<br />
constitutes 5.83 per cent of the total geographical<br />
area of India. <strong>Karnataka</strong> has four natural regions<br />
– the west coast, the Western Ghats or malnad, the<br />
northern maidan and the southern maidan. These<br />
four natural regions have distinct characteristics:<br />
The coastal region, a narrow belt that lies<br />
between the Western Ghats and the Arabian<br />
Sea, encompasses the districts of Dakshina<br />
Kannada, Udupi and Uttara Kannada. The<br />
coastal belt has an average width of 50 to<br />
80 km, and a length of about 267 km. This<br />
region receives heavy rainfall, in the range<br />
of 2,500 mm to 3,000 mm. Coconut groves<br />
and paddy fi elds typically dominate the<br />
landscape.<br />
The Western Ghats or malnad includes the<br />
districts of Chikmaglur, Hassan, Kodagu,<br />
Shimoga and the uplands of Dakshina<br />
Kannada, Uttara Kannada, Udupi, Belgaum<br />
and Dharwad districts. It receives rainfall in<br />
the range of 1,000 mm to 2,500 mm. Much<br />
of the dense rain forest area of the state lies<br />
in this region, which is rich in teak, rosewood<br />
and bamboo. Commercial crops include coffee,<br />
areca nut, pepper, cardamom and rubber.<br />
The southern maidan or plateau is the basin<br />
of the river Cauvery, which has its origins in<br />
Kodagu, and lies adjacent to the Western<br />
Ghats in the west and the south. The Cauvery<br />
and its tributaries – the Hemavathy, the<br />
Harangi, the Tunga and the Bhadra nurture<br />
this region. Its elevation is between 600<br />
metres and 900 metres above sea level.<br />
Rice, sugarcane, ragi, coconut and mulberry<br />
are the principal crops.<br />
The northern maidan or plateau, elevated at<br />
300 metres to 600 metres, primarily includes<br />
3
<strong>Karnataka</strong>: An Overview<br />
4<br />
The economy of the state,<br />
which was predominantly<br />
agrarian in character<br />
in 1956, has changed<br />
significantly since<br />
1980-81. While the trend<br />
towards diversification<br />
is a characteristic of a<br />
modern economy, there is<br />
cause for concern in the<br />
fact that the size of the<br />
workforce dependant on<br />
the primary sector is not<br />
commensurate with its<br />
share in the GDP.<br />
the Deccan plateau, with its rich black cotton<br />
soil. The Krishna and its tributaries – the<br />
Malaprabha, Ghataprabha, Tungabhadra,<br />
Bheema and Karanja – sustain agriculture<br />
here. It is a low rainfall area where jowar,<br />
cotton, oilseeds and pulses are cultivated.<br />
Sugarcane is grown in irrigated areas.<br />
The forest cover in the state comprises about<br />
19.3 per cent of its total area. The state has<br />
substantial mineral resources such as high-grade<br />
iron ore, copper, manganese, chromites, bauxite,<br />
china clay, granite and limestone. Furthermore,<br />
<strong>Karnataka</strong> has the distinction of being the only<br />
state in the country with gold deposits.<br />
The state has a well-knit infrastructure of roads,<br />
air and waterways. The total length of motorable<br />
roads comes to about 1,67,378 km. In addition,<br />
the state has a rail network of 3,172 km, which<br />
includes broad gauge, meter gauge and narrow<br />
gauge. The four important airports of the state<br />
are located at Bangalore, Belgaum, Mangalore<br />
and Hubli. There is also an all-weather sea-port at<br />
Mangalore, which mainly handles cargo vessels.<br />
One of Asia’s biggest naval bases (INS Kadamba)<br />
is located at Karwar in Uttara Kannada district.<br />
Population trends<br />
<strong>Karnataka</strong> has a population of 53 million (2001)<br />
accounting for 5.13 per cent of India’s population.<br />
The population of the state has increased<br />
four-fold, from 13.05 million in 1901 to 52.73<br />
million in 2001. The highest decadal growth rate of<br />
26.75 per cent, since the beginning of the century,<br />
occurred in 1971-81. The growth rate thereafter<br />
slowed down to 21.12 per cent during 1981-91<br />
and further declined to 17.51 per cent during<br />
1991-2001, which is indeed a welcome trend.<br />
The sex ratio of 965 in the state stands above<br />
the all-India average of 933, with an increase<br />
of 5 percentage points in the sex ratio of 2001<br />
over 1991. However, the sex ratio for children<br />
(0-6 years) has declined from 960 in 1991 to 946<br />
in 2001, which is a matter of grave concern.<br />
The population density in the state is 275 as<br />
compared to 324 at the all-India level in 2001.<br />
About 66 per cent of the population in the state<br />
lives in rural areas. The Scheduled Caste population<br />
constitutes about 16.2 per cent of the total<br />
population in <strong>Karnataka</strong>, which is almost equal to<br />
the share of the Scheduled Caste population in the<br />
country. The Scheduled Tribe population, however,<br />
which constitutes about 6.6 per cent of the total<br />
population, is below the share of the Scheduled<br />
Tribe population (about 8 per cent) for the nation<br />
as a whole.<br />
The economy<br />
The state income or Net State Domestic Product<br />
(at 1993-94 prices) increased from Rs.30,087.57<br />
crore in 1990-91 to Rs.61,386.40 crore in<br />
2001-02 registering an increase of 9.5<br />
per cent per annum. The per capita income (NSDP)<br />
at constant prices increased from Rs.6,739<br />
to Rs.11,516 showing an annual increase of<br />
7.1 per cent during the same period.<br />
The economy of the state, which was predominantly<br />
agrarian in character in 1956, has changed<br />
signifi cantly since 1980-81. The primary sector,<br />
which contributed about 60 per cent of the state<br />
GDP in 1960-61 (at 1980-81 prices), regressed to<br />
about 43 per cent in 1981, subsequently declining<br />
to 26 per cent in 2001-02 (at 1993-94 prices).<br />
Meanwhile, the share of the secondary sector<br />
increased from 15.2 per cent to 23 per cent, and<br />
then to 26 per cent, in the corresponding period.<br />
The increase in the share of the tertiary sector,<br />
however, was spectacular – from 24.8 per cent in<br />
1960-61 to 34 per cent in 1981, to 48 per cent<br />
in 2001-02. While the trend towards diversifi cation<br />
is a characteristic of a modern economy, there is<br />
cause for concern in the fact that the size of the<br />
workforce dependant on the primary sector is not<br />
commensurate with its share in the GDP.<br />
Agriculture<br />
Agriculture is the mainstay of the people in the<br />
state. Cultivators and agricultural labourers form<br />
about 56 per cent of the workforce (2001 census).<br />
Agriculture in the state is characterised by wide<br />
crop diversifi cation. The extent of arid land in<br />
<strong>Karnataka</strong> being second only to Rajasthan in<br />
the country, agriculture is highly dependant on<br />
the vagaries of the southwest monsoon. Out of<br />
the net area sown, only 25 per cent is irrigated.
<strong>Karnataka</strong> <strong>Human</strong> <strong>Development</strong> <strong>Report</strong> <strong>2005</strong><br />
Agricultural production and productivity in the<br />
state have received a tremendous setback in<br />
recent years (2001-02 to 2003-04) due to the<br />
continuous prevalence of drought conditions.<br />
Thereafter, agricultural production, particularly<br />
cereals, has improved due to relatively good<br />
monsoons in the year 2004-05. Food grain<br />
production is expected to reach about 97 lakh<br />
tonnes against the target of 108.17 lakh tonnes in<br />
2004-05. The vast extent of dry, unirrigated land,<br />
located primarily in northern <strong>Karnataka</strong>, casts its<br />
long shadow on the socio-economic development<br />
of the local people in many signifi cant ways, as<br />
the <strong>Report</strong> shows.<br />
Irrigation<br />
The net irrigated area in the state has increased<br />
three-fold, from 7.6 lakh hectares in 1957-58<br />
to 26.4 lakh hectares in 2000-01. By 2000,<br />
the state had invested about Rs.14,267 crore,<br />
of which Rs.13,399 crore was spent on major<br />
and medium irrigation and Rs.868 crore on<br />
minor irrigation. At the end of March 2001, the<br />
irrigation potential created by major, medium<br />
and minor (surface water) irrigation was about<br />
18.11 lakh hectares out of a projected 29.73<br />
lakh hectares potential. The irrigation potential<br />
from all sources is estimated at 55 lakh hectares<br />
and the potential created up to 2003-04 is<br />
30.61 lakh hectares. 1 The total potential of<br />
exploitable water resources in the state is about<br />
36.22 lakh hectares (including ground water,<br />
which irrigates 9.08 lakh hectares). The present<br />
proportion of net area irrigated to net area sown<br />
is about 25 per cent.<br />
Power<br />
By 2001, the progress in the power sector (in<br />
production and consumption of electricity) in<br />
the state, while remarkable, did not keep pace<br />
with the rising demand from agriculture and<br />
industry. The per capita electricity consumption<br />
in the state was 481 units in 2004-05 as<br />
compared with 35 units for the newly created<br />
state of Mysore in 1956. Installed capacity<br />
in the public sector is expected to reach<br />
4,884.83 MW, consisting of 3,282.35 MW<br />
1<br />
Annual plan of <strong>Karnataka</strong>, <strong>2005</strong>-06.<br />
of hydel power, 1,597.92 MW of thermal and<br />
diesel power and 4.56 MW of wind power by<br />
the end of 2004-05. For the private sector the<br />
fi gure is expected to be around 852.76 MW.<br />
Total energy generation in the state is projected<br />
at 20,462 MU in the public sector and 5,995<br />
MU in the private sector. However, even this step<br />
up in generation does not meet all the state’s<br />
power needs.<br />
Industry<br />
<strong>Karnataka</strong>, a pioneer in industrial development,<br />
now stands sixth among the states in terms of<br />
output. It has a strong and vibrant industrial<br />
base built up over the years with a wide network<br />
of large and medium industries in the public<br />
and private sectors and a large small-scale<br />
industrial sector. The annual average growth<br />
of industrial production was 6.63 per cent<br />
(base year 1993-94) between 1994-95 and<br />
2003-04. The Economic Census 1998 reveals<br />
that there were 19.12 lakh enterprises in the<br />
state, engaged in various economic activities<br />
other than crop production and plantations. The<br />
number of enterprises increased by 12.9 per cent,<br />
from 16.94 lakh in 1990 to 19.12 lakh in 1998,<br />
while the number of persons usually working in<br />
the enterprises increased by 3.3 per cent, from<br />
50.83 lakh to 52.53 lakh. <strong>Karnataka</strong> accounted<br />
for 8 per cent of all-India enterprises and 8.15<br />
per cent of total ‘usually working’ employment.<br />
Over the last decade, <strong>Karnataka</strong>’s biggest<br />
success story is the growth of the information<br />
technology-led sector, which today accounts for<br />
about 40 per cent of India’s software exports.<br />
This growth has primarily occurred in Bangalore<br />
city and its environs though the industry has now<br />
begun moving towards other centres such as<br />
Mysore, Mangalore and Hubli-Dharwad. Another<br />
growth area that the government is promoting<br />
aggressively is biotechnology.<br />
The regions<br />
As we saw, at reorganisation, <strong>Karnataka</strong> emerged<br />
out of the union of regions with varying levels of<br />
socio-economic development, as well as diverse<br />
political and administrative systems and structures,<br />
each with its unique style of governance. This<br />
Over the last decade,<br />
<strong>Karnataka</strong>’s biggest<br />
success story is the<br />
growth of the information<br />
technology-led sector,<br />
which today accounts<br />
for about 40 per cent of<br />
India’s software exports.<br />
This growth has primarily<br />
occurred in Bangalore city<br />
and its environs though<br />
the industry has now<br />
begun moving towards<br />
other centres such as<br />
Mysore, Mangalore and<br />
Hubli-Dharwad.<br />
5
<strong>Karnataka</strong>: An Overview<br />
A High Power Committee<br />
for the Redressal of<br />
Regional Imbalances<br />
to address the issue of<br />
regional imbalances<br />
was constituted by the<br />
Government in 2000. It<br />
identified 35 indicators<br />
encompassing agriculture,<br />
industry, social and<br />
economic infrastructure<br />
and population<br />
characteristics to measure<br />
and prepare an index of<br />
development.<br />
6<br />
meant that there were sharp imbalances between<br />
the regions at the very inception of the state. Thus,<br />
running consistently through the analysis in the<br />
<strong>Karnataka</strong> <strong>Human</strong> <strong>Development</strong> <strong>Report</strong> <strong>2005</strong>,<br />
is the thread of regional disparity and the way<br />
it shapes, and is shaped by, economic growth<br />
and human development. The regions are briefl y<br />
described below:<br />
Hyderabad <strong>Karnataka</strong>: or northeast <strong>Karnataka</strong>,<br />
initially comprised the three districts of Bidar,<br />
Gulbarga and Raichur, which formed part of the<br />
princely state of Hyderabad. The Gazetteer of India<br />
gives a vivid account of the famines and scarcity<br />
conditions that prevailed in this region from the 17th<br />
century. Drought and great famines devastated vast<br />
areas in this region on a continual basis. Large-scale<br />
deaths by starvation occurred frequently. In recent<br />
times, the most severe occurrence of drought was in<br />
1970-71. Scarcity conditions prevailed in the<br />
1980s and again affected the region from<br />
2002-03 onwards when the entire state<br />
experienced severe drought. To compound the<br />
suffering infl icted by nature, the princely state of<br />
Hyderabad, unlike the princely state of Mysore,<br />
was interested neither in developing the region<br />
economically, nor in investing in human capital.<br />
Today, the term, ‘Hyderabad <strong>Karnataka</strong>’ is used to<br />
describe the three districts mentioned above, along<br />
with the district of Bellary (which was part of the<br />
former Madras state, and had a different political<br />
and administrative legacy but which is contiguous<br />
with the northeastern districts), and the new district<br />
of Koppal, which has been carved out of Raichur.<br />
Bombay <strong>Karnataka</strong>: or northwest <strong>Karnataka</strong>,<br />
comprising four districts from the erstwhile<br />
Bombay state, viz. Bijapur, Belgaum, Dharwad<br />
and Uttara Kannada, has better socio-economic<br />
indicators than the Hyderabad <strong>Karnataka</strong> region,<br />
although Bijapur, which is in the arid zone, was<br />
less economically developed than the other<br />
districts. Today, this region comprises, in addition<br />
to the districts mentioned above, the districts of<br />
Bagalkot, Gadag and Haveri.<br />
South <strong>Karnataka</strong>: is a large region with as<br />
many as 15 districts and is not a homogeneous<br />
entity, for, here too, one fi nds variations in<br />
levels of development between districts. The<br />
largest segment of this region falls within the<br />
classifi cation ‘Old Mysore’, which is how the<br />
former princely state is described, to this day.<br />
Southern <strong>Karnataka</strong> can be broadly sub-classifi ed<br />
into (i) coastal (Dakshina Kannada and Udupi),<br />
(ii) malnad (Kodagu, Chikmaglur, Shimoga and<br />
Hassan) and (iii) maidan (Mysore, Mandya, Kolar,<br />
Tumkur, Chamarajnagar, Davangere, Chitradurga,<br />
Bangalore Rural and Bangalore Urban districts).<br />
The unirrigated maidan areas of the south have<br />
not fared as well as the coastal and malnad<br />
region, with the exception of Bangalore Urban<br />
and Bangalore Rural districts which are, in many<br />
ways, atypical because of their proximity to the<br />
metropolis.<br />
A High Power Committee for the Redressal of<br />
Regional Imbalances (HPCFRRI) to address the<br />
issue of regional imbalances was constituted by<br />
the Government in 2000. The HPCFRRI identifi ed<br />
35 indicators encompassing agriculture, industry,<br />
social and economic infrastructure and population<br />
characteristics to measure and prepare an index<br />
of development. The Committee went beyond the<br />
district as an administrative unit, to focus on intradistrict<br />
disparities. Taluks with index values in the<br />
range 0.89 to 0.99 were classifi ed as ‘backward’,<br />
taluks with index values in the range 0.80 to 0.88<br />
were classifi ed as ‘more backward’ and taluks<br />
with index values between 0.53 to 0.79 as ‘most<br />
backward’.<br />
Referring to the incidence of drought in the state,<br />
the HPCFRRI points out that out of 175 taluks,<br />
70 taluks (30 in north <strong>Karnataka</strong> and 40 in south<br />
<strong>Karnataka</strong>) or 40 per cent, experienced drought<br />
for a period of less than 5 years; 77 taluks<br />
(40 in north <strong>Karnataka</strong> and 37 in south <strong>Karnataka</strong>)<br />
or 44 per cent, for a period between 6 and 10<br />
years; 27 taluks (11 in north <strong>Karnataka</strong> and 16<br />
in south <strong>Karnataka</strong>) or 15 per cent, experienced<br />
drought for 11 to 15 years and one taluk (in<br />
north <strong>Karnataka</strong>) or 0.6 per cent, had drought<br />
conditions for a maximum of 16 years. In fact, it<br />
has been observed that the south is more prone<br />
to severe droughts than the north, contrary to<br />
popular impression. But this is no consolation to<br />
the north, as extreme or severe drought of longer
<strong>Karnataka</strong> <strong>Human</strong> <strong>Development</strong> <strong>Report</strong> <strong>2005</strong><br />
duration is more likely to occur in the north than<br />
in the south (Rama Prasad, 1987).<br />
In June 1954, while the reorganisation of states<br />
was still under examination by the States<br />
Reorganisation Commission, the Government of<br />
Mysore appointed a Fact Finding Committee to<br />
assess the levels of development in the various<br />
areas that would be integrated with Mysore.<br />
The Committee, after a study of the state of<br />
development in education, public health, rural<br />
development, industry, irrigation and power, came<br />
to the conclusion that the districts of Bombay,<br />
Hyderabad and Madras states and Coorg had not<br />
reached the same level of development as ‘Old<br />
Mysore’ and considerable efforts would have to be<br />
made to bring them to that level. The Committee<br />
also pointed out that the districts from Hyderabad<br />
state were much more backward than all the<br />
other areas that were going to be integrated with<br />
Mysore.<br />
As <strong>Karnataka</strong>’s fi rst <strong>Human</strong> <strong>Development</strong> <strong>Report</strong><br />
(1999) noted, Old Mysore had one school for every<br />
6.48 km but after reorganisation, the new state<br />
had one school for every 7.99 km. There were 585<br />
medical institutions in Old Mysore, but the newly<br />
integrated areas had a mere 191 institutions. The<br />
disparities, which existed in 1956, are a historical<br />
legacy, which have not been eradicated and<br />
were unintentionally reinforced, at least initially.<br />
In 1956, the expenditure incurred under plan<br />
schemes was much higher in Old Mysore than in<br />
the erstwhile Bombay and Hyderabad <strong>Karnataka</strong><br />
regions. Since plan expenditure is converted into<br />
non-plan expenditure at the end of each plan<br />
period, thereby becoming committed expenditure,<br />
the Old Mysore districts had a defi nite advantage.<br />
With better infrastructure due to historical<br />
reasons, this region could justifi ably claim a larger<br />
share of non-plan outlays for maintenance. Since<br />
the plan outlay, which is earmarked for new<br />
programmes, is normally a third of the total budget<br />
(plan + non-plan), funds to districts under plan<br />
expenditure are much less than under non-plan<br />
expenditure. Thus, disparities in the fl ow of funds to<br />
districts, which had their origins in the pre-merger<br />
days, continued well after the merger, contributing<br />
to skewed development between regions.<br />
<strong>Karnataka</strong>’s Sixth Five Year Plan (1980-85)<br />
examined the issue of regional imbalances and<br />
the development of backward areas in some<br />
detail. Twenty two indicators were used to evaluate<br />
inter-district variations in the levels of development.<br />
The ranking of the northern districts among the<br />
then 19 districts of the state over a period of 30<br />
years is presented in Table 1.1.<br />
The HPCFRRI found that while the Hyderabad<br />
<strong>Karnataka</strong> districts and parts of Bombay <strong>Karnataka</strong><br />
were underdeveloped, there were pockets of<br />
economic backwardness in some southern<br />
districts as well. It identifi ed 59 backward taluks<br />
in northern <strong>Karnataka</strong>, of which 26 are classifi ed<br />
as ‘most backward’, 17 as ‘more backward’ and<br />
16 as ‘backward’. The Hyderabad <strong>Karnataka</strong> area<br />
TABLE 1.1<br />
Composite <strong>Development</strong> Index: Ranking of districts in <strong>Karnataka</strong><br />
District 1960-61 1971-72 1976-77 1998-99<br />
South <strong>Karnataka</strong><br />
Bangalore 2 1 1 1<br />
Bangalore Rural - - - 13<br />
Chikmaglur 7 12 16 15<br />
Chitradurga 11 9 7 6<br />
Dakshina Kannada 1 2 2 2<br />
Kodagu 6 7 8 17<br />
Hassan 13 13 14 9<br />
Kolar 4 4 6 10<br />
Mandya 10 6 4 5<br />
Mysore 5 5 5 4<br />
Shimoga 3 3 3 3<br />
Tumkur 5 16 13 12<br />
North <strong>Karnataka</strong><br />
Belgaum 12 11 12 14<br />
Bellary 14 15 10 11<br />
Bidar 17 14 15 19<br />
Bijapur 16 18 17 18<br />
Dharwad 8 10 11 8<br />
Gulbarga 19 19 19 20<br />
Raichur 18 17 18 16<br />
Uttara Kannada 9 8 9 7<br />
Note: The state initially had 19 districts. Bangalore Urban district was formed in 1986.<br />
Source: Table 4.10, <strong>Report</strong> of HPCFRRI, June 2002.<br />
7
<strong>Karnataka</strong>: An Overview<br />
Area<br />
Most<br />
backward<br />
TABLE 1.2<br />
Backward taluks<br />
More<br />
backward<br />
Backward<br />
Hyderabad <strong>Karnataka</strong> 21 5 2 28<br />
Total<br />
Bombay <strong>Karnataka</strong> 5 12 14 31<br />
North <strong>Karnataka</strong> 26 17 16 59<br />
South <strong>Karnataka</strong> 13 23 19 55<br />
Source: Annexure 6.4, <strong>Report</strong> of HPCFRRI, June 2002.<br />
alone has 21 ‘most backward’, 5 ‘more backward’<br />
and 2 ‘backward’ taluks.<br />
To reduce backwardness in these 114 taluks, the<br />
Committee has recommended the implementation<br />
of a Special <strong>Development</strong> Plan of Rs.16,000 crore<br />
to be spent over eight years, i.e. fi ve years of the<br />
Tenth Plan and three years of the Eleventh Plan.<br />
Of this, Rs.9,600 crore (60 per cent) is for north<br />
<strong>Karnataka</strong>, with Rs.6,400 crore to be spent on<br />
Hyderabad <strong>Karnataka</strong>.<br />
The prevalence of inter-district variations both in<br />
the level of development generally, and in human<br />
development in particular, means that people’s<br />
access to services is shaped by where they live<br />
and their choices determined, to some extent, by<br />
the existence of regional disparities.<br />
Conclusion<br />
This then, is the setting against which the <strong>Report</strong><br />
unfolds: a land blessed with wide, swift fl owing<br />
rivers, towering, forested mountains, rich, black<br />
cotton soil, a coast bustling with commercial<br />
activity but, along with this plenitude, the country’s<br />
second largest arid zone. This is a state known for<br />
its initiative, having set up a major hydro-electric<br />
generating station at Shivasamudram as early<br />
as 1902 for commercial operations, and where<br />
the country’s fi rst private engineering college<br />
was established; a state in which one district<br />
alone contributed to the establishment of fi ve<br />
commercial banks; a state, which led the country<br />
into the information age, where, ‘to be Bangalored’<br />
(or outsourced), is now an acceptable verb in the<br />
U.S. economy.<br />
During the decade 1990-2001, <strong>Karnataka</strong><br />
witnessed the highest growth rate of GSDP as<br />
well as per capita GSDP in the country, yet, it<br />
occupies seventh place among the major states<br />
in human development. This is the seeming<br />
contradiction, which will be explored in the<br />
chapters that follow.<br />
8
<strong>Human</strong> <strong>Development</strong> in <strong>Karnataka</strong>
<strong>Human</strong> <strong>Development</strong> Index 2001<br />
North<br />
<strong>Karnataka</strong><br />
0.599<br />
South<br />
<strong>Karnataka</strong><br />
0.564<br />
0.589<br />
0.648<br />
0.591<br />
0.634<br />
0.547<br />
0.642<br />
0.582<br />
0.617<br />
0.653<br />
0.603<br />
0.635<br />
0.627<br />
0.673<br />
0.714 0.647 0.630 0.625<br />
0.722<br />
0.639<br />
0.609<br />
0.653<br />
Bangalore Urban<br />
0.753<br />
0.697<br />
0.631<br />
0.576
CHAPTER 2<br />
<strong>Karnataka</strong> <strong>Human</strong> <strong>Development</strong> <strong>Report</strong> <strong>2005</strong><br />
<strong>Human</strong> <strong>Development</strong> in <strong>Karnataka</strong><br />
The basic purpose of development is to enlarge people’s choices. In principle, these choices can be infi nite<br />
and can change over time. People often value achievements that do not show up at all, or not immediately,<br />
in income or growth fi gures: greater access to knowledge, better nutrition and health services, more<br />
secure livelihoods, security against crime and physical violence, satisfying leisure hours, political and<br />
cultural freedoms and sense of participation in community activities. The objective of development is to<br />
create an enabling environment for people to enjoy long, healthy and creative lives.<br />
Mahbub ul Haq<br />
Introduction<br />
It is now widely acknowledged that conventional<br />
measures of well-being such as per capita gross<br />
domestic product or consumption expenditure or<br />
poverty ratios do not capture the broader aspects of<br />
human capability. Important as it is, high economic<br />
growth does not automatically translate into<br />
betterment of the lives of all people, especially if the<br />
benefi ts of that growth are not accessible to large<br />
sections of the population. The experiences of certain<br />
countries and states in India reveal that despite<br />
signifi cant achievements in economic development,<br />
the proportion of people below the poverty line<br />
can actually increase, instead of dwindling as<br />
envisaged, or there might only be a small modicum<br />
of improvement in their status.<br />
<strong>Human</strong> development: Concept and<br />
methodology<br />
The economic growth model of development was<br />
contested by the UNDP in its fi rst <strong>Human</strong> <strong>Development</strong><br />
<strong>Report</strong> 1990, which reiterated that people, not things,<br />
are the wealth of nations, and it is they who should<br />
be the focus of a development directed to ‘expanding<br />
their choices’. Three basic capabilities were identifi ed<br />
as prerequisites to a life that is rich with potential and<br />
the fulfi llment of one’s aspirations: the capacity to lead<br />
long and healthy lives, access to knowledge and the<br />
limitless vistas that it opens to the questing mind, and<br />
the ability to ensure for oneself a reasonably good<br />
standard of living. Without these resources, people’s<br />
BOX 2.1<br />
Differences between the HD approach and the non-HD approach<br />
Issues HD approach Non-HD approach<br />
<strong>Development</strong> for<br />
what?<br />
<strong>Development</strong> for<br />
whom?<br />
Who is the agent<br />
of development?<br />
How?<br />
Source: UNDP, April, 2004.<br />
Well-being, dignity, freedom,<br />
addressing inequalities,<br />
exclusion and poverty.<br />
For people.<br />
People.<br />
No recipes but elements of<br />
good policies such as<br />
• Economic growth, pro-poor,<br />
pro-employment;<br />
• Equity of choices: equitable<br />
distribution of assets;<br />
• Good social policies;<br />
• Interventions to serve<br />
needs of vulnerable subpopulations;<br />
• Political democracy;<br />
• Civil participation.<br />
National income, economic<br />
and social growth which<br />
trickles down.<br />
For people and things.<br />
People and things: human<br />
capital + physical capital +<br />
natural resources.<br />
Structural adjustment.<br />
“recipes”:<br />
• Do not raise industrial<br />
wages;<br />
• Hand out contraceptives;<br />
• Sow improved seeds;<br />
• Investment in housing;<br />
• Spend on basic needs;<br />
• Send the right signals.<br />
11
<strong>Human</strong> <strong>Development</strong> in <strong>Karnataka</strong><br />
Public policies should<br />
be centred around<br />
people’s choices and<br />
their capabilities and the<br />
policy thrust should be to<br />
combat illiteracy, poverty,<br />
unemployment, disease,<br />
save the lives of mothers<br />
and children, and address<br />
the inequities caused by<br />
gender and caste.<br />
choices are restricted and life’s opportunities are<br />
out of reach. <strong>Human</strong> development is the process<br />
of building these capabilities to enable people to<br />
lead fulfi lling and productive lives.<br />
While it would be erroneous to argue that<br />
economic growth is not necessary for human<br />
development, the HDRs have taken us to<br />
a conceptual level that goes beyond the<br />
growth-driven model of development to one<br />
that postulates that growth without human<br />
development is inequitable and exclusionary<br />
and, therefore, not an appropriate paradigm in<br />
a world driven by disparities of various kinds. In<br />
this context, UNDP’s contribution to the evolution<br />
of the concept of human development and its<br />
measures indeed constitutes a paradigm shift<br />
in the way we view the world of development.<br />
The UNDP strongly argued that development<br />
must be people-centric and people-driven to be<br />
truly meaningful and effective. In this context,<br />
exclusion is a critical theoretical underpinning<br />
to any analysis of human development. <strong>Human</strong><br />
development, by its very nature, must never be<br />
exclusionary, or cause, or reinforce, disparities<br />
in people’s access to the resources that build<br />
their capabilities. Hence, poverty, gender and<br />
other causes of inequity between social groups,<br />
between men and women, between children<br />
and adults, are forces that prevent people from<br />
realising their potential.<br />
The concept of human development introduced by<br />
UNDP in the 1990s is now accepted worldwide.<br />
‘Building human capabilities is fundamental to<br />
expanding choices’, ‘human development is about<br />
creating an environment in which people can<br />
develop their full potential and lead productive,<br />
creative lives in accordance with their needs and<br />
interests’ (UNDP HDR 2001).<br />
The three main components of human development<br />
as discussed above, are, longevity or the capacity to<br />
live a long and healthy life; education the ability<br />
to read, write and acquire knowledge and skills;<br />
and command over economic resources suffi cient<br />
to provide a decent standard of living. Once these<br />
capacities are assured, then other opportunities<br />
in life will follow. Other important prerequisites<br />
are political freedom and guaranteed human<br />
rights, which include promotion of economic and<br />
gender equity, as well as social and cultural rights,<br />
especially those pertaining to education, healthcare,<br />
food, water, shelter, environment, culture, etc. It is<br />
recognised that public policies should be centred<br />
around people’s choices and their capabilities and<br />
the policy thrust should be to combat illiteracy,<br />
poverty, unemployment, disease, save the lives of<br />
mothers and children, and address the inequities<br />
caused by gender and caste.<br />
Though there is a broad consensus now about the<br />
three core dimensions of human development,<br />
i.e. health, education and income, measuring<br />
achievements in these three critical areas poses<br />
certain methodological issues, which are discussed<br />
in the following paragraphs.<br />
UNDP’s methodological<br />
approach<br />
The <strong>Human</strong> <strong>Development</strong> Index (HDI),<br />
computed every year since 1990 by the UNDP,<br />
measures average achievements in basic human<br />
development and assigns ranking to countries.<br />
The HDI is a composite index, comprising<br />
longevity measured by life expectancy<br />
at birth (LEB), educational attainment<br />
computed as a combination of adult literacy<br />
(which is given two-thirds weightage) and<br />
enrolment ratios at the primary, secondary and<br />
tertiary levels, as well as command over resources<br />
measured by per capita real GDP adjusted for<br />
purchasing power parity in dollars (PPP$).<br />
The Gender Related <strong>Development</strong> Index (GDI)<br />
that was fi rst introduced in UNDP’s 1995 HDR,<br />
measures achievements in the same dimensions<br />
and using the same variables as the HDI, but as<br />
this index is gender sensitive, the methodology<br />
imposes a penalty for inequality between women<br />
and men. Thus, the GDI is the HDI discounted<br />
for gender inequality. However, it must be noted<br />
that the concept of human development is more<br />
dynamic and complex than what can be captured<br />
in a single composite index.<br />
The methodology used in the computation of<br />
the HDI has been under continuous refi nement<br />
12
<strong>Karnataka</strong> <strong>Human</strong> <strong>Development</strong> <strong>Report</strong> <strong>2005</strong><br />
by UNDP. The value of HDI for a country has no<br />
meaning by itself, unless countries are ranked<br />
on their relative HDI scores, thereby making<br />
inter-country comparisons both viable and<br />
meaningful. Since 1993, minimum and<br />
maximum values have been prescribed for the<br />
variables used in the HDI, based on extreme<br />
values observed in the last few decades (for<br />
minimum) or expected in the next few decades<br />
(for maximum). Two broad changes have been<br />
introduced in the computation of HDI. First, the<br />
indicator ‘mean years of schooling’ has been<br />
replaced by ‘combined enrolment ratios of primary,<br />
secondary and tertiary levels of education’.<br />
Second, the minimum value of per capita income<br />
has been reduced to half (PPP$100). In the case<br />
of the income index, the average world income<br />
was taken as the threshold level and the income<br />
above this level was discounted, using Atkinson’s<br />
formula for income utility. The main drawback<br />
with this formula is that in discounting income<br />
above the threshold level, it penalises heavily,<br />
countries where income exceeds the threshold<br />
level, thus rendering it irrelevant in many cases.<br />
In UNDP HDR 1999, a refi nement was made in<br />
the treatment of income (see Technical Note). This<br />
method does not discount income as severely<br />
as the formula used earlier and it discounts all<br />
income, not just income above the threshold.<br />
Thus middle income countries are not penalised<br />
unduly as income rises.<br />
National <strong>Human</strong> <strong>Development</strong><br />
<strong>Report</strong> 2001: Methodology<br />
The Planning Commission, Government of<br />
India, took the lead in the preparation of the<br />
National <strong>Human</strong> <strong>Development</strong> <strong>Report</strong> 2001<br />
(NHDR) for the fi rst time in the country. The<br />
report provides <strong>Human</strong> <strong>Development</strong> Indices<br />
and related indicators, both state-wise and for<br />
the whole nation. The methodology and the<br />
variables included in the NHDR differ from those<br />
of UNDP. It brings to the fore the issue that the<br />
methodology developed by UNDP may not be<br />
relevant in the Indian context, especially in view<br />
of data constraints. An attempt has been made<br />
in the NHDR to select relevant indicators in the<br />
same three dimensions of human development.<br />
The indicators thus chosen are supposed to refl ect<br />
BOX 2.2<br />
HDI and GDI/GEI of NHDR<br />
Attainments UNDP indicators NHDR indicators<br />
Longevity Life expectancy at birth. Life expectancy at age 1 and<br />
infant mortality rate.<br />
Educational attainment<br />
Adult literacy rate combined with<br />
enrolment ratio.<br />
not only attainments in the different aspects of<br />
well-being over time, but also the changes in<br />
well-being at more frequent intervals. As such,<br />
educational attainment was captured in terms of<br />
overall literacy and intensity of formal education<br />
(based on current school enrolment of children in<br />
the age group 6 to 18 years). In the case of health<br />
attainment, life expectancy at age 1 and infant<br />
mortality were taken as appropriate measures. In<br />
the case of command over resources, per capita<br />
consumption expenditure has been preferred<br />
over per capita income. The rationale for selecting<br />
the former was that use of consumption data in<br />
developing countries would capture the individual’s<br />
command over resources more accurately than<br />
income data.<br />
The weightage method used in UNDP HDRs<br />
found acceptance because of its explicitness and<br />
consistency. With regard to selection of scaling<br />
norms, their relevance to the country had an edge<br />
over the global level values used in UNDP HDRs.<br />
The advantage of the NHDR procedure is that it<br />
enables comparison of human development in<br />
rural and urban areas.<br />
State HDRs: Methodology<br />
Madhya Pradesh was the fi rst state in the country<br />
to bring out an HDR in 1995; the second HDR<br />
followed in 1998 and the third in 2002. <strong>Karnataka</strong><br />
was the second state to publish an HDR (1999).<br />
Subsequently, Tamil Nadu (2001), Sikkim (2001),<br />
Literacy rate 7+ and<br />
intensity of formal<br />
education.<br />
Economic attainment Real GDP per capita in PPP$. Per capita real consumption<br />
expenditure adjusted<br />
for inequality; Workerpopulation<br />
ratio in case of<br />
Gender Equality Index.<br />
Source: National <strong>Human</strong> <strong>Development</strong> <strong>Report</strong>, Planning Commission, Government of India, 2001.<br />
13
<strong>Human</strong> <strong>Development</strong> in <strong>Karnataka</strong><br />
The average of per<br />
capita GDP, per capita<br />
consumption and poverty<br />
have been used for<br />
computing the income<br />
index. As a result, the<br />
HDIs computed by the<br />
different states are not<br />
strictly comparable.<br />
Himachal Pradesh (2002), Maharashtra (2002),<br />
Rajasthan (2002), Assam (2003), West Bengal<br />
(2004), Punjab (2004), Nagaland (2004), Orissa<br />
(2004) and Gujarat (2004) also brought out State<br />
<strong>Human</strong> <strong>Development</strong> <strong>Report</strong>s.<br />
The states may have followed the UNDP<br />
methodology but there is little uniformity and<br />
a lot of experimentation in application. Some<br />
states have used literacy rates in combination<br />
with mean years of schooling or the enrolment<br />
ratio in the 6-14 years age group, while others<br />
used the combined enrolment ratios of primary<br />
and secondary schools in combination with<br />
adult literacy rates/literacy rates for computing<br />
the educational status index. For literacy rates<br />
or adult literacy rates and enrolment ratios, the<br />
minimum and maximum values used were 0<br />
and 100. However, Madhya Pradesh in its fi rst<br />
HDR used 80 as the maximum value (target) for<br />
literacy. As far as the health index is concerned,<br />
some states used (1–IMR) index and others<br />
used an index of life expectancy at birth (LEB)<br />
for health status. There is also considerable<br />
variation in the method used for computation of<br />
LEB, and thus, the same year of reference was<br />
not used in computation of the HDI for 2001<br />
by various states. There has been much diversity<br />
in the adoption of UNDP’s methodology with<br />
regard to the income index and minima and<br />
maxima values by states. Some states have<br />
used the methodology of the 1994 HDR while<br />
others have used the 1999 HDR methodology.<br />
Similarly, a few states used the highest<br />
per capita GDP and the lowest (or income<br />
poverty) per capita GDP prevailing in the states<br />
in the reference year as end points in the scale,<br />
instead of the maximum and minimum values<br />
used in UNDP HDRs. The West Bengal HDR<br />
has used completely different measures for<br />
computing the income index. The average of per<br />
capita GDP, per capita consumption and poverty<br />
have been used for computing the income index.<br />
As a result, the HDIs computed by the different<br />
states are not strictly comparable.<br />
Another important factor to be noted is that<br />
no SHDR, after 2001, has used NHDR 2001<br />
methodology due to non-availability of data for<br />
the variables used in computing the HDI and the<br />
GDI (or GEI). One of the objectives of the NHDR<br />
2001 was to help states in the preparation of<br />
their HDRs. It has been noted earlier that data<br />
constraints were one of the major reasons cited for<br />
changing the variables and end points of the scales<br />
in the computation of the HDI (or GDI/GEI) in the<br />
NHDR. However, ironically, states have found it<br />
diffi cult to obtain reliable data for computation of<br />
the HDI based on the NHDR.<br />
<strong>Karnataka</strong> <strong>Human</strong> <strong>Development</strong><br />
<strong>Report</strong> <strong>2005</strong>: Methodology<br />
While preparing this HDR, the question of the<br />
methodology most appropriate for our purposes<br />
was carefully analysed. While both the NHDR and<br />
the UNDP methodologies had certain shortcomings<br />
that highlighted our own data constraints, we<br />
found we would encounter more data problems<br />
if we used NHDR methodology. Computation of<br />
life expectancy at age 1, for instance, posed some<br />
problems because the age group data released<br />
by the 2001 census could not be used for age<br />
smoothening or graduation of age data on account<br />
of certain distortions in data and also because<br />
single year age population data was not available.<br />
Similarly, computation of per capita consumption<br />
for districts based on pooling of NSS data was<br />
not free from errors. The inadequate sample<br />
size for some districts meant that the estimates<br />
gave a distorted picture for districts, not only in<br />
<strong>Karnataka</strong>, but in other states as well. With regard<br />
to educational indicators, using literacy along with<br />
intensity of schooling raised some conceptual<br />
problems since it could result in double counting<br />
in the age group 6-18 years. It was thus diffi cult<br />
for this <strong>Report</strong> to adopt the NHDR methodology,<br />
useful as it is in so many ways.<br />
Computation of HDI for<br />
districts<br />
The HDI for districts is computed on the basis<br />
of the methodology used in UNDP HDR 1999,<br />
details of which are given in the Technical<br />
Note. Due to the non-availability of data on<br />
adult literacy rates for 2001, literacy rates for<br />
7 years plus, the combined gross enrolment<br />
ratios of primary and secondary level education<br />
(class I-XII) have been substituted. Hence, there is<br />
14
<strong>Karnataka</strong> <strong>Human</strong> <strong>Development</strong> <strong>Report</strong> <strong>2005</strong><br />
BOX 2.3A<br />
Composition of HDI 2001<br />
Indicator<br />
District<br />
Health Education Income<br />
HDI<br />
Index Rank Index Rank Index Rank Value Rank<br />
1 Bagalkot 0.597 27 0.636 22 0.539 12 0.591 22<br />
2 Bangalore Rural 0.692 6 0.662 20 0.605 4 0.653 6<br />
3 Bangalore Urban 0.705 5 0.887 1 0.666 1 0.753 1<br />
4 Belgaum 0.712 2 0.699 15 0.532 13 0.648 8<br />
5 Bellary 0.685 7 0.618 23 0.549 9 0.617 18<br />
6 Bidar 0.638 17 0.689 17 0.470 26 0.599 21<br />
7 Bijapur 0.627 24 0.642 21 0.499 23 0.589 23<br />
8 Chamarajnagar 0.642 15 0.570 26 0.518 17 0.576 25<br />
9 Chikmaglur 0.637 19 0.742 9 0.563 6 0.647 9<br />
10 Chitradurga 0.660 12 0.704 14 0.517 18 0.627 16<br />
11 Dakshina Kannada 0.707 3 0.823 4 0.636 2 0.722 2<br />
12 Davangere 0.680 8 0.711 13 0.515 19 0.635 12<br />
13 Dharwad 0.615 26 0.758 7 0.553 8 0.642 10<br />
14 Gadag 0.628 23 0.750 8 0.525 15 0.634 13<br />
15 Gulbarga 0.632 20 0.572 25 0.490 25 0.564 26<br />
16 Hassan 0.670 10 0.729 10 0.519 16 0.639 11<br />
17 Haveri 0.620 25 0.699 16 0.491 24 0.603 20<br />
18 Kodagu 0.638 18 0.833 3 0.621 3 0.697 4<br />
19 Kolar 0.653 13 0.713 12 0.508 21 0.625 17<br />
20 Koppal 0.642 16 0.576 24 0.529 14 0.582 24<br />
21 Mandya 0.632 21 0.682 18 0.513 20 0.609 19<br />
22 Mysore 0.663 11 0.669 19 0.561 7 0.631 14<br />
23 Raichur 0.648 14 0.524 27 0.469 27 0.547 27<br />
24 Shimoga 0.707 4 0.766 6 0.547 10 0.673 5<br />
25 Tumkur 0.672 9 0.714 11 0.505 22 0.630 15<br />
26 Udupi 0.713 1 0.842 2 0.588 5 0.714 3<br />
27 Uttara Kannada 0.632 22 0.781 5 0.546 11 0.653 7<br />
<strong>Karnataka</strong> 0.680 0.712 0.559 0.650<br />
an element of double counting in the age group<br />
6-18 years for educational status. It may be noted<br />
that due to changes in methodology, i.e. adopting<br />
the logarithm method in computation, there has<br />
been a sudden increase in the values of the income<br />
index. Another important factor is that changing<br />
the base year from 1980-81 to 1993-94 for<br />
estimation of GDP at constant prices for India and<br />
the states (introduced by the CSO) has contributed<br />
to higher values of income indices for 1991-92<br />
and 2001-02. In <strong>Karnataka</strong>, the estimates of life<br />
expectancy at birth for districts and the state have<br />
been made on the basis of the regression method<br />
involving the crude birth rate, the crude death rate,<br />
the rate of natural increase in population and the<br />
infant mortality rate for 2001. In order to enable<br />
15
<strong>Human</strong> <strong>Development</strong> in <strong>Karnataka</strong><br />
TABLE 2.1<br />
The performance of districts in human development: 2001 and 1991<br />
Sl. District HDI - 2001 HDI - 1991<br />
No.<br />
Value Rank Value Rank<br />
1 Bagalkot 0.591 22 0.505 20<br />
2 Bangalore Rural 0.653 6 0.539 11<br />
3 Bangalore Urban 0.753 1 0.623 4<br />
4 Belgaum 0.648 8 0.545 9<br />
5 Bellary 0.617 18 0.512 18<br />
6 Bidar 0.599 21 0.496 23<br />
7 Bijapur 0.589 23 0.504 21<br />
8 Chamarajnagar 0.576 25 0.488 24<br />
9 Chikmaglur 0.647 9 0.559 7<br />
10 Chitradurga 0.627 16 0.535 13<br />
11 Dakshina Kannada 0.722 2 0.661 1<br />
12 Davangere 0.635 12 0.548 8<br />
13 Dharwad 0.642 10 0.539 10<br />
14 Gadag 0.634 13 0.516 17<br />
15 Gulbarga 0.564 26 0.453 25<br />
16 Hassan 0.639 11 0.519 16<br />
17 Haveri 0.603 20 0.496 22<br />
18 Kodagu 0.697 4 0.623 3<br />
19 Kolar 0.625 17 0.522 15<br />
20 Koppal 0.582 24 0.446 26<br />
21 Mandya 0.609 19 0.511 19<br />
22 Mysore 0.631 14 0.524 14<br />
23 Raichur 0.547 27 0.443 27<br />
24 Shimoga 0.673 5 0.584 5<br />
25 Tumkur 0.630 15 0.539 12<br />
26 Udupi 0.714 3 0.659 2<br />
27 Uttara Kannada 0.653 7 0.567 6<br />
<strong>Karnataka</strong> 0.650 0.541<br />
a comparison of LEB estimates of 1991-92 with<br />
those of 2001-02, the estimates of LEB for 27<br />
districts of the state (as against the 20 districts<br />
existing in 1991) have been revised by adopting<br />
the above mentioned method. Per capita district<br />
income estimates (adopting the method of UNDP<br />
HDR 1999) and literacy and enrolment indicators<br />
have been estimated afresh for 27 districts in view<br />
of the availability of improved data for 1991.<br />
Thus, the HDI values for 2001 and 1991 (revised)<br />
for the districts and the state are higher than the<br />
HDI values in KHDR I. The GDI values have also<br />
been revised for 27 districts for 1991, so as to<br />
facilitate a comparison of GDI estimates for 1991<br />
with those of 2001.<br />
The status of human development in the state and<br />
districts was assessed for the fi rst time in KHDR<br />
1999 with 1991 data. This HDR presents a review<br />
of human development over the last decade. Has<br />
there been a perceptible improvement in the level<br />
of human development during the 1990s and<br />
2000s, due to policy interventions and programme<br />
implementation, especially in the social sector? Has<br />
there been a reduction in the multiple disparities<br />
that act as barriers to improving people’s choices?<br />
How have women fared in <strong>Karnataka</strong> since 1991?<br />
What is the HDI and GDI of certain vulnerable<br />
populations whose profi le has never been explored<br />
by any SHDR? This chapter will attempt to answer<br />
these questions.<br />
The level of human development is much higher<br />
in <strong>Karnataka</strong> (0.650) than at the all-India level<br />
(0.621). Among states, it ranks seventh, with<br />
Kerala occupying the fi rst place. At the international<br />
level, <strong>Karnataka</strong>’s position is at 120 while India is<br />
at 127. The attainment of human development in<br />
<strong>Karnataka</strong> is more or less on par with that of Egypt<br />
and considerably above the level of Pakistan, Nepal,<br />
Bhutan and Bangladesh. It can thus be argued that<br />
the state is well placed in the context of human<br />
development in South Asia.<br />
The HDI for the state has increased from 0.541<br />
(revised) in 1991 to 0.650 in 2001, showing a<br />
20 per cent improvement. Districts where the<br />
decadal percentage improvement in the HDI<br />
is higher than the state average are Bangalore<br />
Rural (21.15), Gadag (22.87), Gulbarga (24.50),<br />
Hassan (23.12), Haveri (21.57), Koppal (30.50),<br />
Mysore (20.42) and Raichur (23.48). What is truly<br />
signifi cant is the fact that the backward district of<br />
Koppal has performed best and that 3 out of 5<br />
districts of the Hyderabad <strong>Karnataka</strong> region have<br />
made remarkable progress. However, despite<br />
the marked improvement in the pace of human<br />
development in the most backward districts of the<br />
state, there is no corresponding change in their<br />
16
<strong>Karnataka</strong> <strong>Human</strong> <strong>Development</strong> <strong>Report</strong> <strong>2005</strong><br />
BOX 2.3B<br />
Composition of HDI 1991<br />
Indicator<br />
District<br />
Health Education Income<br />
HDI<br />
Index Rank Index Rank Index Rank Value Rank<br />
1 Bagalkot 0.567 27 0.567 18 0.380 18 0.505 20<br />
2 Bangalore Rural 0.657 5 0.582 15 0.378 19 0.539 11<br />
3 Bangalore Urban 0.663 4 0.757 3 0.449 5 0.623 4<br />
4 Belgaum 0.657 6 0.586 14 0.393 10 0.545 9<br />
5 Bellary 0.630 10 0.506 23 0.399 9 0.512 18<br />
6 Bidar 0.600 14 0.547 22 0.340 26 0.496 23<br />
7 Bijapur 0.570 25 0.561 19 0.381 17 0.504 21<br />
8 Chamarajnagar 0.625 12 0.446 24 0.392 11 0.488 24<br />
9 Chikmaglur 0.585 19 0.639 7 0.454 4 0.559 7<br />
10 Chitradurga 0.630 11 0.590 13 0.384 15 0.535 13<br />
11 Dakshina Kannada 0.683 2 0.799 2 0.500 2 0.661 1<br />
12 Davangere 0.633 7 0.623 9 0.388 13 0.548 8<br />
13 Dharwad 0.568 26 0.637 8 0.412 6 0.539 10<br />
14 Gadag 0.583 20 0.601 11 0.364 23 0.516 17<br />
15 Gulbarga 0.575 23 0.432 25 0.352 24 0.453 25<br />
16 Hassan 0.575 24 0.599 12 0.384 16 0.519 16<br />
17 Haveri 0.577 22 0.582 16 0.331 27 0.496 22<br />
18 Kodagu 0.600 15 0.739 4 0.531 1 0.623 3<br />
19 Kolar 0.617 13 0.576 17 0.372 20 0.522 15<br />
20 Koppal 0.583 21 0.403 26 0.351 25 0.446 26<br />
21 Mandya 0.598 16 0.548 21 0.386 14 0.511 19<br />
22 Mysore 0.632 9 0.550 20 0.389 12 0.524 14<br />
23 Raichur 0.590 18 0.372 27 0.367 22 0.443 27<br />
24 Shimoga 0.680 3 0.662 6 0.410 7 0.584 5<br />
25 Tumkur 0.633 8 0.612 10 0.370 21 0.539 12<br />
26 Udupi 0.685 1 0.830 1 0.463 3 0.659 2<br />
27 Uttara Kannada 0.598 17 0.692 5 0.410 8 0.567 6<br />
<strong>Karnataka</strong> 0.618 0.602 0.402 0.541<br />
rankings in the HDI, which indicates that they are<br />
still a long way from catching up with other high<br />
performing districts. Only two districts, namely,<br />
Dakshina Kannada (9.23 per cent) and Udupi<br />
(8.35 per cent) have registered an increase in the<br />
HDI that is less than 10 per cent between 1991<br />
and 2001. This, too, is cause for concern because<br />
these districts have the capacity to match the HDI<br />
status of Kerala and any setback here needs to be<br />
monitored carefully.<br />
There are wide disparities in the levels of human<br />
development among districts. The district HDI,<br />
in 2001, has been found to range from 0.753<br />
17
<strong>Human</strong> <strong>Development</strong> in <strong>Karnataka</strong><br />
After closely examining<br />
the levels of achievement<br />
across the three principal<br />
indicators of human<br />
development, it is<br />
apparent that economic<br />
growth (in terms of<br />
per capita income or<br />
the income index) is<br />
an important but not<br />
primary factor in human<br />
development.<br />
in Bangalore Urban district to 0.547 in Raichur<br />
district. In the 1999 HDR the range of variation<br />
was between 0.661 in Dakshina Kannada district<br />
and 0.443 in Raichur district. However, it is<br />
encouraging to note that the difference between<br />
the districts with the highest and the lowest HDI<br />
has narrowed from 49.21 per cent in 1991 to<br />
37.6 per cent in 2001. Only seven districts, i.e.<br />
Bangalore Rural, Bangalore Urban, Dakshina<br />
Kannada, Kodagu, Uttara Kannada, Shimoga<br />
and Udupi, have HDI values higher than the<br />
state average in 2001. In 1991, nine districts —<br />
Bangalore Urban, Dakshina Kannada, Kodagu,<br />
Shimoga, Udupi, Uttara Kannada, Chikmaglur,<br />
Davangere and Belgaum — were above the state<br />
average. It is signifi cant that the front-runners are<br />
all in southern <strong>Karnataka</strong>, and as many as three<br />
districts — Bangalore Urban, Bangalore Rural<br />
and Shimoga are from ‘Old Mysore’ (though it<br />
could be argued that Bangalore Urban almost<br />
comprises a unique category all by itself).<br />
This assumption is reinforced when a comparison<br />
is made of the top ranking and bottom ranking<br />
districts of <strong>Karnataka</strong> with other countries.<br />
Bangalore Urban district mainly comprising<br />
Bangalore city, often hailed as the ‘Silicon Valley of<br />
India’ or the IT capital of India, ranks fi rst among<br />
the districts of <strong>Karnataka</strong>. At the international<br />
level, its rank is 83 – on par with the Philippines<br />
and above China and Sri Lanka, while Raichur<br />
district, which occupies the last rank in the state,<br />
is, at number 133, on par with Papua New Guinea,<br />
and lower than Ghana, Botswana, Myanmar and<br />
Cambodia.<br />
A comparison of the fi ve top and bottom<br />
ranking districts is presented in Table 2.2. It can<br />
be inferred that there is a strong correlation<br />
between the economic development status of a<br />
district and its HDI, at least where the top and<br />
bottom ranking districts are concerned. Districts<br />
such as Shimoga, however, are an exception.<br />
After closely examining the levels of achievement<br />
across the three principal indicators of human<br />
development, it is apparent that economic growth<br />
(in terms of per capita income or the income<br />
index) is an important but not primary factor in<br />
human development. Shimoga and Davangere<br />
districts, for example, which have relatively low<br />
levels of income (to the state average), have<br />
signifi cantly higher levels of achievement in life<br />
expectancy, literacy and enrolment (to the state<br />
average). This serves to reinforce the fact that it<br />
is possible to effect perceptible improvements in<br />
literacy and health, even if per capita income is<br />
not high. However, the converse is also found to<br />
be true. In Mysore district, for instance, where<br />
per capita income is comparatively high, the<br />
level of achievement in the areas of literacy and<br />
TABLE 2.2<br />
Five top and bottom ranking districts in HDI: 2001 and 1991<br />
Education Index 2001 Health Index 2001 Income Index 2001 HDI 2001 HDI 1991<br />
Top 5 Districts<br />
1 Bangalore Urban 1 Udupi 1 Bangalore Urban 1 Bangalore Urban 1 Dakshina Kannada<br />
2 Udupi 2 Belgaum 2 Dakshina Kannada 2 Dakshina Kannada 2 Udupi<br />
3 Kodagu 3 Dakshina Kannada 3 Kodagu 3 Udupi 3 Kodagu<br />
4 Dakshina Kannada 4 Shimoga 4 Bangalore Rural 4 Kodagu 4 Bangalore Urban<br />
5 Uttara Kannada 5 Bangalore Urban 5 Udupi 5 Shimoga 5 Shimoga<br />
Bottom 5 Districts<br />
27 Raichur 27 Bagalkot 27 Raichur 27 Raichur 27 Raichur<br />
26 Chamarajnagar 26 Dharwad 26 Bidar 26 Gulbarga 26 Koppal<br />
25 Gulbarga 25 Haveri 25 Gulbarga 25 Chamarajnagar 25 Gulbarga<br />
24 Koppal 24 Bijapur 24 Haveri 24 Koppal 24 Chamarajnagar<br />
23 Bellary 23 Gadag 23 Bijapur 23 Bijapur 23 Bidar<br />
18
<strong>Karnataka</strong> <strong>Human</strong> <strong>Development</strong> <strong>Report</strong> <strong>2005</strong><br />
BOX 2.4A<br />
Composition of GDI 2001<br />
District<br />
Health<br />
Indicator<br />
Equally distributed<br />
Education Income<br />
GDI<br />
Index Rank Index Rank Index Rank Value Rank<br />
1 Bagalkot 0.595 27 0.617 22 0.500 13 0.571 23<br />
2 Bangalore Rural 0.692 6 0.659 20 0.569 4 0.640 6<br />
3 Bangalore Urban 0.705 4 0.880 1 0.608 2 0.731 1<br />
4 Belgaum 0.712 1 0.689 16 0.503 12 0.635 9<br />
5 Bellary 0.685 7 0.603 23 0.528 7 0.606 17<br />
6 Bidar 0.638 17 0.680 17 0.399 27 0.572 22<br />
7 Bijapur 0.626 24 0.627 21 0.464 23 0.573 21<br />
8 Chamarajnagar 0.641 15 0.566 24 0.462 24 0.557 25<br />
9 Chikmaglur 0.636 19 0.738 8 0.534 6 0.636 8<br />
10 Chitradurga 0.660 11 0.697 14 0.497 15 0.618 14<br />
11 Dakshina Kannada 0.703 5 0.819 4 0.620 1 0.714 2<br />
12 Davangere 0.680 8 0.701 12 0.481 19 0.621 13<br />
13 Dharwad 0.614 26 0.748 7 0.515 9 0.626 11<br />
14 Gadag 0.628 23 0.737 9 0.511 11 0.625 12<br />
15 Gulbarga 0.631 20 0.556 25 0.442 25 0.543 26<br />
16 Hassan 0.670 10 0.720 10 0.499 14 0.630 10<br />
17 Haveri 0.620 25 0.692 15 0.475 21 0.596 19<br />
18 Kodagu 0.637 18 0.831 3 0.602 3 0.690 4<br />
19 Kolar 0.653 13 0.699 13 0.486 18 0.613 16<br />
20 Koppal 0.641 16 0.554 26 0.487 17 0.561 24<br />
21 Mandya 0.631 21 0.677 18 0.469 22 0.593 20<br />
22 Mysore 0.659 12 0.663 19 0.493 16 0.605 18<br />
23 Raichur 0.648 14 0.503 27 0.440 26 0.530 27<br />
24 Shimoga 0.706 3 0.760 6 0.516 8 0.661 5<br />
25 Tumkur 0.672 9 0.705 11 0.477 20 0.618 15<br />
26 Udupi 0.712 2 0.839 2 0.559 5 0.704 3<br />
27 Uttara Kannada 0.631 22 0.774 5 0.512 10 0.639 7<br />
<strong>Karnataka</strong> 0.679 0.704 0.526 0.637<br />
19
<strong>Human</strong> <strong>Development</strong> in <strong>Karnataka</strong><br />
TABLE 2.3<br />
Inter-district variations in HDI values in selected districts:<br />
1991 and 2001<br />
District HDI District HDI<br />
1991 2001 1991 2001<br />
Raichur 0.443 0.547 Davangere 0.548 0.635<br />
Gulbarga 0.453 0.564 Uttara Kannada 0.567 0.653<br />
Koppal 0.446 0.582 Shimoga 0.584 0.673<br />
The highest increase<br />
in human development<br />
attainments in 2001 over<br />
1991 has been recorded<br />
in the districts of the<br />
Hyderabad <strong>Karnataka</strong><br />
region.<br />
health is somewhat low; Bellary, with its heavy<br />
mineral deposits, is ninth in the income index for<br />
districts, but has a very poor education index.<br />
This seems to indicate that higher income does<br />
not automatically translate into an improved<br />
literacy and health status for the people if that<br />
income is not equitably distributed.<br />
Though there has been considerable improvement<br />
in the levels of achievement in human development<br />
at the state as well as district levels in 2001 as<br />
compared to 1991, there is little change in the<br />
relative rankings of districts, especially in the<br />
case of the lowest ranking districts. The highest<br />
increase in human development attainments in<br />
2001 over 1991 has been recorded in the districts<br />
of the Hyderabad <strong>Karnataka</strong> region, namely,<br />
Koppal (30.49 per cent) followed by Gulbarga<br />
(24.50 per cent) and Raichur (23.48 per cent).<br />
Unfortunately, this has not brought them on par<br />
with even median districts such as Mysore or<br />
Tumkur, so that they remain among the bottom<br />
fi ve districts in 2001, as in 1991. Table 2.3<br />
reveals that the HDI of certain underdeveloped<br />
districts, in 2001, is on par with the HDI of<br />
relatively more advanced districts in 1991,<br />
indicating a decadal gap, which will be diffi cult<br />
to bridge without more fi nancing and effective<br />
strategies since their counterparts have moved<br />
up, substantially improving their respective HDIs<br />
in 2001. Certain districts, namely, fi ve districts<br />
of northeast <strong>Karnataka</strong>, Chamarajnagar of ‘Old<br />
Mysore’, and Bijapur, Bagalkot and Haveri of<br />
northwest <strong>Karnataka</strong> have been, more or less,<br />
static on the lower rungs of the ladder of human<br />
development both in 1991 and 2001. Overall,<br />
Kodagu and Shimoga districts in the malnad<br />
area, the coastal districts of Dakshina Kannada<br />
and Udupi and Bangalore Urban district have<br />
consistently performed well in the fi eld of human<br />
development.<br />
The increase of about 20 per cent in HDI at state<br />
level in 2001 came because of a 39 per cent<br />
increase in the income index, an increase of 18<br />
per cent in the education index and an increase<br />
of around 10 per cent in the health index. At the<br />
district level, the increase in the income index<br />
ranged from 17 per cent in Kodagu to 60 per cent<br />
in Bangalore Urban. The increase in the education<br />
index was in the range of 1.5 per cent in Udupi<br />
to 43 per cent in Koppal and the increase in the<br />
health (longevity) index was in the range of 2.7<br />
per cent in Chamarajnagar to 16.5 per cent in<br />
Hassan.<br />
A comparison with the HDI of states shows that<br />
Bangalore Urban district has a higher HDI than<br />
Kerala (0.746) which is the top ranking state<br />
in the country in terms of the HDI. Similarly,<br />
Dakshina Kannada and Udupi have HDI values<br />
higher than that of Maharashtra (0.706), and<br />
Kodagu’s HDI is higher than that of Tamil Nadu<br />
(0.687). The bottom ranked districts of Raichur<br />
and Gulbarga have better HDIs than either Bihar<br />
(0.495) or Uttar Pradesh (0.535) which are the<br />
lowest ranked states. Chamarajnagar has a higher<br />
HDI than Madhya Pradesh (0.572) and Koppal’s<br />
HDI is better than Assam’s (0.578).<br />
Gender <strong>Development</strong> Index<br />
The gender related development index or<br />
GDI measures the levels of women’s human<br />
development relative to men. A comparison of the<br />
GDI with the HDI helps to assess the extent of<br />
gender equality prevalent in society. Though the<br />
GDI in <strong>Karnataka</strong> (0.637) is much higher than<br />
the all-India fi gure (0.609) in 2001, <strong>Karnataka</strong><br />
is sixth among the 15 major states in gender<br />
development and seventh in human development.<br />
At the international level, <strong>Karnataka</strong>’s rank in<br />
terms of the GDI is 99th as against 103rd for the<br />
entire nation.<br />
The GDI at state level has improved from 0.525 in<br />
1991 to 0.637 in 2001, registering an increase of<br />
21 per cent in ten years. The pace of reduction in<br />
20
<strong>Karnataka</strong> <strong>Human</strong> <strong>Development</strong> <strong>Report</strong> <strong>2005</strong><br />
BOX 2.4B<br />
Composition of GDI 1991<br />
District<br />
Health<br />
Indicator<br />
Equally distributed<br />
Education Income<br />
GDI<br />
Index Rank Index Rank Index Rank Value Rank<br />
1 Bagalkot 0.566 27 0.538 20 0.347 16 0.483 21<br />
2 Bangalore Rural 0.657 5 0.564 14 0.351 14 0.524 12<br />
3 Bangalore Urban 0.664 4 0.754 3 0.357 12 0.592 4<br />
4 Belgaum 0.656 6 0.562 16 0.357 13 0.525 11<br />
5 Bellary 0.629 11 0.484 23 0.385 6 0.499 17<br />
6 Bidar 0.600 14 0.507 22 0.324 25 0.477 23<br />
7 Bijapur 0.569 25 0.540 19 0.351 15 0.486 20<br />
8 Chamarajnagar 0.625 12 0.433 24 0.359 10 0.472 24<br />
9 Chikmaglur 0.583 19 0.631 7 0.434 3 0.550 6<br />
10 Chitradurga 0.630 9 0.575 13 0.337 22 0.514 13<br />
11 Dakshina Kannada 0.683 2 0.795 2 0.456 2 0.645 1<br />
12 Davangere 0.633 7 0.614 9 0.344 18 0.530 9<br />
13 Dharwad 0.568 26 0.625 8 0.401 5 0.531 8<br />
14 Gadag 0.583 20 0.578 12 0.346 17 0.502 16<br />
15 Gulbarga 0.574 23 0.396 25 0.326 24 0.432 25<br />
16 Hassan 0.573 24 0.583 11 0.366 8 0.507 14<br />
17 Haveri 0.576 22 0.564 15 0.301 27 0.480 22<br />
18 Kodagu 0.599 15 0.733 4 0.519 1 0.617 3<br />
19 Kolar 0.616 13 0.556 17 0.344 19 0.505 15<br />
20 Koppal 0.583 21 0.370 26 0.331 23 0.428 26<br />
21 Mandya 0.597 16 0.531 21 0.344 20 0.491 19<br />
22 Mysore 0.630 10 0.541 18 0.317 26 0.496 18<br />
23 Raichur 0.588 18 0.341 27 0.338 21 0.422 27<br />
24 Shimoga 0.680 3 0.655 6 0.381 7 0.572 5<br />
25 Tumkur 0.633 8 0.594 10 0.358 11 0.528 10<br />
26 Udupi 0.684 1 0.815 1 0.433 4 0.644 2<br />
27 Uttara Kannada 0.597 17 0.684 5 0.365 9 0.548 7<br />
<strong>Karnataka</strong> 0.618 0.587 0.371 0.525<br />
21
<strong>Human</strong> <strong>Development</strong> in <strong>Karnataka</strong><br />
TABLE 2.4<br />
Performance of districts in gender related development:<br />
2001 and 1991<br />
Sl. No. District GDI 2001 GDI 1991<br />
Value Rank Value Rank<br />
1 Bagalkot 0.571 23 0.483 21<br />
2 Bangalore Rural 0.640 6 0.524 12<br />
3 Bangalore Urban 0.731 1 0.592 4<br />
4 Belgaum 0.635 9 0.525 11<br />
5 Bellary 0.606 17 0.499 17<br />
6 Bidar 0.572 22 0.477 23<br />
7 Bijapur 0.573 21 0.486 20<br />
8 Chamarajnagar 0.557 25 0.472 24<br />
9 Chikmaglur 0.636 8 0.550 6<br />
10 Chitradurga 0.618 14 0.514 13<br />
11 Dakshina Kannada 0.714 2 0.645 1<br />
12 Davangere 0.621 13 0.530 9<br />
13 Dharwad 0.626 11 0.531 8<br />
14 Gadag 0.625 12 0.502 16<br />
15 Gulbarga 0.543 26 0.432 25<br />
16 Hassan 0.630 10 0.507 14<br />
17 Haveri 0.596 19 0.480 22<br />
18 Kodagu 0.690 4 0.617 3<br />
19 Kolar 0.613 16 0.505 15<br />
20 Koppal 0.561 24 0.428 26<br />
21 Mandya 0.593 20 0.491 19<br />
22 Mysore 0.605 18 0.496 18<br />
23 Raichur 0.530 27 0.422 27<br />
24 Shimoga 0.661 5 0.572 5<br />
25 Tumkur 0.618 15 0.528 10<br />
26 Udupi 0.704 3 0.644 2<br />
27 Uttara Kannada 0.639 7 0.548 7<br />
<strong>Karnataka</strong> 0.637 0.525<br />
TABLE 2.5<br />
Five top and bottom ranking districts in GDI: 2001 and 1991<br />
Top 5 districts<br />
Bottom 5 districts<br />
GDI 2001 GDI 1991 GDI 2001 GDI 1991<br />
1 Bangalore Urban 1 Udupi 27 Raichur 27 Raichur<br />
2 Dakshina 2 Dakshina 26 Gulbarga 26 Koppal<br />
Kannada<br />
Kannada<br />
3 Udupi 3 Kodagu 25 Chamarajnagar 25 Gulbarga<br />
4 Kodagu 4 Bangalore Urban 24 Koppal 24 Chamarajnagar<br />
5 Shimoga 5 Shimoga 23 Bagalkot 23 Bidar<br />
gender disparities, however, has been rather slow.<br />
It is only marginally higher than the increase of<br />
20 per cent in the HDI during the same period.<br />
The values for the GDI of districts are lower than<br />
the corresponding values for the HDI. However,<br />
there are signifi cant variations in the GDI across<br />
districts. The district GDI varies from 0.731 in<br />
Bangalore Urban to 0.530 in Raichur in 2001. In<br />
1991, the range of variation was from 0.644 in<br />
Dakshina Kannada to 0.422 in Raichur. It is indeed<br />
a welcome signal that the difference between the<br />
highest and the lowest GDI values in the districts<br />
has narrowed from about 53 per cent in 1991 to<br />
about 38 per cent in 2001, showing a signifi cant<br />
one-third reduction. At the international level, the<br />
top ranking district of the state, Bangalore Urban,<br />
is at 77 whereas the bottom ranking district of<br />
Raichur is at 107.<br />
It is a matter of concern that only seven districts,<br />
namely, Bangalore Rural, Bangalore Urban,<br />
Dakshina Kannada, Kodagu, Shimoga, Udupi<br />
and Uttara Kannada have a GDI above the<br />
state average (in 2001). In 1991, ten districts<br />
were above the state average (i.e. the above<br />
districts excluding Bangalore Rural and including<br />
Chikmaglur, Davangere, Dharwad and Tumkur).<br />
A comparison of the fi ve top and bottom ranking<br />
districts in GDI for 2001 and 1991 is presented<br />
in Table 2.5.<br />
Even though the fi ve top ranking districts of<br />
1991 have maintained their performance in<br />
2001, there have been changes in the order<br />
of ranking. Bangalore Urban now ranks fi rst in<br />
the GDI although, ironically, it has very adverse<br />
female and child sex ratios. In the case of the fi ve<br />
bottom ranking districts, four districts, namely,<br />
Koppal, Chamarajnagar, Gulbarga and Raichur<br />
have, unfortunately, maintained their status<br />
in 2001, with some changes in placements.<br />
However, one district, Bidar, which was 23rd<br />
in the GDI ranking in 1991, no longer fi nds a<br />
place among the fi ve lowest performing districts<br />
in 2001. Bagalkot district, which is 23rd in<br />
the GDI ranking in 2001, is a new entrant. The<br />
GDI ranking compares favourably with the HDI<br />
ranking for a majority of districts in 1991 as<br />
well as 2001. This clearly indicates that districts<br />
22
<strong>Karnataka</strong> <strong>Human</strong> <strong>Development</strong> <strong>Report</strong> <strong>2005</strong><br />
BOX 2.5A<br />
Percentage increase/decrease in values of HD indicators: 2001 and 1991<br />
HDI<br />
District<br />
Equally distributed<br />
Health index Education index Income index<br />
HDI value<br />
1 Bagalkot 5.29 12.17 41.84 17.03<br />
2 Bangalore Rural 5.33 13.75 60.05 21.15<br />
3 Bangalore Urban 6.33 17.17 48.33 20.87<br />
4 Belgaum 8.37 19.28 35.37 18.90<br />
5 Bellary 8.73 22.13 37.59 20.51<br />
6 Bidar 6.33 25.96 38.24 20.77<br />
7 Bijapur 10.00 14.44 30.97 16.87<br />
8 Chamarajnagar 2.72 27.80 32.14 18.03<br />
9 Chikmaglur 8.89 16.12 24.01 15.74<br />
10 Chitradurga 4.76 19.32 34.64 17.20<br />
11 Dakshina Kannada 3.51 3.00 27.20 9.23<br />
12 Davangere 7.42 14.13 32.73 15.88<br />
13 Dharwad 8.27 19.00 34.22 19.11<br />
14 Gadag 7.72 24.79 44.23 22.87<br />
15 Gulbarga 9.91 32.41 39.20 24.50<br />
16 Hassan 16.52 21.70 35.16 23.12<br />
17 Haveri 7.45 20.10 48.34 21.57<br />
18 Kodagu 6.33 12.72 16.95 11.88<br />
19 Kolar 5.83 23.78 36.56 19.73<br />
20 Koppal 10.12 42.93 50.71 30.49<br />
21 Mandya 5.69 24.45 32.90 19.18<br />
22 Mysore 4.91 21.64 44.22 20.42<br />
23 Raichur 9.83 40.86 27.79 23.48<br />
24 Shimoga 3.97 15.71 33.41 15.24<br />
25 Tumkur 6.16 16.67 36.49 16.88<br />
26 Udupi 4.09 1.45 27.00 8.35<br />
27 Uttara Kannada 5.69 12.86 33.17 15.17<br />
<strong>Karnataka</strong> 10.03 18.27 39.05 20.15<br />
23
<strong>Human</strong> <strong>Development</strong> in <strong>Karnataka</strong><br />
with high human development levels will have<br />
lower gender disparities, while districts with poor<br />
human development indicators are characterised<br />
by greater gender inequality.<br />
An analysis of the trio of indices that comprise<br />
the GDI presents some surprises. Belgaum and<br />
Udupi (0.712) top the health index, followed<br />
by Shimoga, Bangalore Urban and Dakshina<br />
Kannada. Kodagu, which is one of the top 5<br />
districts in the GDI, has a low health index (18th<br />
rank). Bagalkot, Dharwad, Haveri, Bijapur and<br />
Gadag, all in the Bombay <strong>Karnataka</strong> region, have<br />
the lowest health indices. Bangalore Urban, Udupi,<br />
Kodagu, Dakshina Kannada and Uttara Kannada<br />
have the highest education indices for women,<br />
while Raichur, Koppal, Gulbarga, Chamarajnagar<br />
and Bellary have the lowest. Districts with a high<br />
income index for women are Dakshina Kannada,<br />
TABLE 2.6 A<br />
Inter-regional comparisons: 2001 - Bombay <strong>Karnataka</strong><br />
District HDI GDI<br />
Rank Value Rank Value<br />
Bagalkot 22 0.591 23 0.571<br />
Belgaum 8 0.648 9 0.635<br />
Bijapur 23 0.589 21 0.573<br />
Dharwad 10 0.642 11 0.626<br />
Gadag 13 0.634 12 0.625<br />
Haveri 20 0.603 19 0.596<br />
Uttara Kannada 7 0.653 7 0.639<br />
<strong>Karnataka</strong> 0.650 0.637<br />
Note: All districts of Bombay <strong>Karnataka</strong> region except Uttara Kannada are below the state average in HDI and GDI.<br />
TABLE 2.6 B<br />
Inter-regional comparisons: 2001 - Hyderabad <strong>Karnataka</strong><br />
District HDI GDI<br />
Rank Value Rank Value<br />
Bellary 18 0.617 17 0.606<br />
Bidar 21 0.599 22 0.572<br />
Gulbarga 26 0.564 26 0.543<br />
Koppal 24 0.582 24 0.561<br />
Raichur 27 0.547 27 0.530<br />
<strong>Karnataka</strong> 0.650 0.637<br />
Note: All districts of Hyderabad <strong>Karnataka</strong> are below the state average in HDI and GDI.<br />
Bangalore Urban, Kodagu, Bangalore Rural and<br />
Udupi. The gap between Dakshina Kannada and<br />
Bangalore Urban is relatively high. Bidar, Raichur,<br />
Gulbarga, Chamarajnagar and Bijapur have the<br />
lowest income indices for women. Bangalore<br />
Urban has the highest GDI among districts, based<br />
almost solely on its high education index. In terms<br />
of health, Belgaum and Udupi do better and in<br />
terms of income, Dakshina Kannada offers more<br />
to women. The erstwhile districts of Dharwad and<br />
Bijapur (now reorganised into fi ve districts) have<br />
low health indices and the triumvirate of Raichur,<br />
Gulbarga and Chamarajnagar have among the<br />
lowest education and income indices in the state,<br />
but the health scenario is about average.<br />
A comparison with state indices reveals that<br />
Bangalore Urban (0.731) has a higher GDI than<br />
Kerala, which tops the states’ GDI list (Table 2.10),<br />
while Dakshina Kannada (0.714) and Udupi<br />
(0.703) have a GDI higher than Maharashtra<br />
(0.693), and Kodagu’s GDI (0.690) is higher<br />
than Punjab (0.676) and Tamil Nadu (0.675).<br />
Among the bottom ranked districts, Raichur<br />
(0.530) has a higher GDI than Bihar (0.477),<br />
Gulbarga is better placed than Uttar Pradesh<br />
(0.520) and Chamarajnagar has a higher GDI<br />
than Assam (0.554) and Orissa (0.555).<br />
Inter-regional analysis<br />
An inter-regional comparison indicates that it is<br />
in the coastal and malnad belt that we fi nd, with<br />
two exceptions, districts with HDIs and GDIs above<br />
the state average. Chikmaglur, in any case, is only<br />
marginally below the state average. Bangalore<br />
Rural and Bangalore Urban districts are atypical,<br />
especially Bangalore Urban which, with an HDI of<br />
0.753, is well above Dakshina Kannada with 0.722,<br />
because it is primarily an urban centre. In fact, the<br />
GDI in Bangalore Urban (0.731) is higher than<br />
the HDI of four top ranking districts i.e. Dakshina<br />
Kannada, Udupi, Kodagu and Shimoga. Women<br />
who live in districts with high HDIs can also expect<br />
to share in the bounty, while women in districts<br />
with low HDIs will fi nd their choices are constricted.<br />
However, as Table 2.6 shows, the gap between the<br />
HDI and the GDI is fl atter in the coastal and malnad<br />
areas while Chamarajnagar could be an exception<br />
because of the high tribal population.<br />
24
<strong>Karnataka</strong> <strong>Human</strong> <strong>Development</strong> <strong>Report</strong> <strong>2005</strong><br />
BOX 2.5B<br />
Percentage increase/decrease in values of GD indicators: 2001 and 1991<br />
GDI<br />
District<br />
Equally distributed<br />
Health index Education index Income index<br />
GDI value<br />
1 Bagalkot 5.12 14.68 44.09 18.22<br />
2 Bangalore Rural 5.33 16.84 62.11 22.14<br />
3 Bangalore Urban 6.17 16.71 70.31 23.48<br />
4 Belgaum 8.54 22.60 40.90 20.95<br />
5 Bellary 8.90 24.59 37.14 21.24<br />
6 Bidar 6.33 34.12 23.15 19.92<br />
7 Bijapur 10.02 16.11 32.19 17.70<br />
8 Chamarajnagar 2.56 30.72 28.69 17.80<br />
9 Chikmaglur 9.09 16.96 23.04 15.64<br />
10 Chitradurga 4.76 21.22 47.48 20.23<br />
11 Dakshina Kannada 2.93 3.02 35.96 10.70<br />
12 Davangere 7.42 14.17 39.83 17.17<br />
13 Dharwad 8.10 19.68 28.43 17.70<br />
14 Gadag 7.72 27.51 47.69 24.50<br />
15 Gulbarga 9.93 40.40 35.58 25.69<br />
16 Hassan 16.93 23.50 36.34 24.26<br />
17 Haveri 7.64 22.70 57.81 24.17<br />
18 Kodagu 6.34 13.37 15.99 11.83<br />
19 Kolar 6.01 25.72 41.28 21.39<br />
20 Koppal 9.95 49.73 47.13 31.07<br />
21 Mandya 5.70 27.50 36.34 20.57<br />
22 Mysore 4.60 22.55 55.52 21.98<br />
23 Raichur 10.20 47.51 30.18 25.59<br />
24 Shimoga 3.82 16.03 35.43 15.56<br />
25 Tumkur 6.16 18.69 33.24 17.05<br />
26 Udupi 4.09 2.94 29.10 9.16<br />
27 Uttara Kannada 5.70 13.16 40.27 16.61<br />
<strong>Karnataka</strong> 9.87 19.93 41.78 21.33<br />
25
<strong>Human</strong> <strong>Development</strong> in <strong>Karnataka</strong><br />
TABLE 2.6 C<br />
Inter-regional comparisons: 2001 - Coastal and Malnad<br />
Districts HDI GDI<br />
Rank Value Rank Value<br />
Chikmaglur 9 0.647 8 0.636<br />
Dakshina Kannada 2 0.722 2 0.714<br />
Hassan 11 0.639 10 0.630<br />
Kodagu 4 0.697 4 0.690<br />
Shimoga 5 0.673 5 0.661<br />
Udupi 3 0.714 3 0.704<br />
Uttara Kannada 7 0.653 7 0.639<br />
<strong>Karnataka</strong> 0.650 0.637<br />
Note: Except Chikmaglur and Hassan, all districts are above the state average in HDI and GDI (Uttara Kannada is also<br />
included in the Bombay <strong>Karnataka</strong> table).<br />
TABLE 2.6 D<br />
Inter-regional comparisons: 2001 - Southern Maidan<br />
District HDI GDI<br />
Rank Value Rank Value<br />
Bangalore Rural 6 0.653 6 0.640<br />
Bangalore Urban 1 0.753 1 0.731<br />
Chamarajnagar 25 0.576 25 0.557<br />
Chitradurga 16 0.627 14 0.618<br />
Davangere 12 0.635 13 0.621<br />
Kolar 17 0.625 16 0.613<br />
Mandya 19 0.609 20 0.593<br />
Mysore 14 0.631 18 0.605<br />
Tumkur 15 0.630 15 0.618<br />
<strong>Karnataka</strong> 0.650 0.637<br />
Note: Only Bangalore Rural and Bangalore Urban districts are above the state average in HDI and GDI.<br />
For the first time in any<br />
HDR, this <strong>Report</strong> will<br />
evaluate the human<br />
development status of<br />
the Scheduled Castes and<br />
Scheduled Tribes.<br />
TABLE 2.7<br />
Gender gap: Four top and bottom<br />
ranking districts<br />
District HDI GDI Gap<br />
Top 4 districts<br />
Bangalore Urban 0.753 0.731 0.022<br />
Dakshina Kannada 0.722 0.714 0.008<br />
Udupi 0.714 0.704 0.011<br />
Kodagu 0.697 0.690 0.007<br />
Bottom 4 districts<br />
Raichur 0.547 0.530 0.017<br />
Gulbarga 0.564 0.543 0.021<br />
Chamarajnagar 0.576 0.557 0.020<br />
Koppal 0.582 0.561 0.021<br />
HDI and GDI of the Scheduled<br />
Castes and Scheduled Tribes<br />
It is not suffi cient for us to know the status<br />
of human development of a country/state/<br />
district: it is also necessary for us to assess the<br />
levels of achievements in human development<br />
of the most disadvantaged and vulnerable<br />
sub-populations in society. The GDI is the result<br />
of one such endeavour. For the fi rst time in<br />
any HDR, this <strong>Report</strong> will evaluate the human<br />
development status of the Scheduled Castes<br />
(SCs) and Tribes (STs) in the state. The process<br />
of human development will be incomplete if<br />
these disadvantaged groups are excluded from<br />
the mainstream of growth and socio-economic<br />
development. Data reveals that, as with women,<br />
the development process, to a considerable<br />
extent, has bypassed the SCs and STs. The<br />
National Council of Applied Economic Research<br />
(NCAER) made an attempt, for the fi rst time in<br />
1994, to develop various indicators to assess<br />
the human development status of different<br />
cross-sections of the population, including the<br />
SC and ST population, for all-India as well as<br />
the states. However, this approach did not<br />
capture the level of human development in one<br />
composite index. Hence, for the fi rst time in the<br />
country, this HDR will assess the levels of human<br />
development and gender related development<br />
for the SC and ST population of <strong>Karnataka</strong>. The<br />
fi rst and major constraint for anyone setting out<br />
on this task is the lack of disaggregated data.<br />
Hence, a special sample survey was conducted<br />
in 2004 by the Directorate of Economics and<br />
Statistics, <strong>Karnataka</strong> and this forms the data<br />
base for preparation of indices. The sample was<br />
too small to permit district-wise analysis. The HDI<br />
and GDI for the SCs and STs in comparison with<br />
the total population of the state are presented in<br />
Table 2.8 (A and B).<br />
The analysis brings to the fore certain very disturbing<br />
trends. The attainment in human development of<br />
the Scheduled Castes (0.575) is higher than that of<br />
the Scheduled Tribes (0.539), but much lower than<br />
that of the total population of the state (0.650). The<br />
gap is of the order of -11 per cent for SCs and -17<br />
per cent for STs. The HDI of the SCs and STs is closer<br />
to the HDI of the total population in 1991 (0.541).<br />
26
<strong>Karnataka</strong> <strong>Human</strong> <strong>Development</strong> <strong>Report</strong> <strong>2005</strong><br />
State/<br />
category of<br />
population<br />
LEB<br />
Literacy<br />
rate<br />
TABLE 2.8 A<br />
HDI of the Scheduled Castes and Scheduled Tribes: 2004<br />
Combined<br />
enrolment<br />
(class I-<br />
XII)<br />
Per capita<br />
current<br />
income (Rs.)<br />
Per<br />
capita<br />
GDP (Rs.)<br />
Per capita<br />
real<br />
GDP (PPP$)<br />
Health<br />
index<br />
Education<br />
index<br />
<strong>Karnataka</strong>: SC 2004 62.0 52.87 84.08 6951 7864 1719 0.617 0.633 0.475 0.575<br />
<strong>Karnataka</strong>: ST 2004 61.8 48.27 72.31 5719 6470 1414 0.613 0.563 0.442 0.539<br />
<strong>Karnataka</strong>: All 2001 65.8 66.64 80.28 19944 13057 2854 0.680 0.712 0.559 0.650<br />
<strong>Karnataka</strong>: All 1991 62.1 56.04 68.43 4598 7447 1115 0.618 0.602 0.402 0.541<br />
Sources:<br />
1. LEB estimates and per capita income estimates for SCs and STs for the year 2004 are based on the Sample Survey on SCs and STs conducted by the Directorate of Economics and Statistics,<br />
<strong>Karnataka</strong>.<br />
2. Literacy rates and data on children in the age group 6-18 years; Registrar General of India, Census 2001.<br />
3. Gross Enrolment Ratio – Enrolment data for class I-XII; Commissioner for Public Instruction, <strong>Karnataka</strong>.<br />
State/<br />
Category of<br />
population<br />
TABLE 2.8 B<br />
GDI of the Scheduled Castes and Scheduled Tribes: 2004<br />
LEB 2004 Literacy rate 2001 Combined gross<br />
enrolment ratio<br />
(class I-XII)<br />
% Share of<br />
economically active<br />
population<br />
Female Male Female Male Female Male Female Male<br />
Income<br />
index<br />
HDI<br />
Ratio of<br />
female<br />
agri. wage<br />
to male<br />
agri. wage<br />
1 2 3 4 5 6 7 8 9 10<br />
<strong>Karnataka</strong>: SC 2004 63.2 60.7 41.72 63.75 80.99 86.94 40.87 59.13 0.650<br />
<strong>Karnataka</strong>: ST 2004 62.0 61.5 36.57 59.66 68.24 76.10 41.68 58.32 0.650<br />
<strong>Karnataka</strong>: All 2001 67.0 64.5 56.87 76.10 77.65 82.77 35.26 64.74 0.650<br />
<strong>Karnataka</strong>: All 1991 63.2 61.0 44.34 67.26 63.11 73.56 34.27 65.73 0.748<br />
State/<br />
Per capita Per capita Per capita<br />
Equally distributed<br />
GDI<br />
Category of<br />
GDP PPP$ female GDP male GDP Health index Education Income index<br />
population<br />
PPP$ PPP$<br />
index<br />
1 11 12 13 14 15 16 17<br />
<strong>Karnataka</strong>: SC 2004 1719 1080 2341 0.615 0.622 0.454 0.564<br />
<strong>Karnataka</strong>: ST 2004 1414 910 1904 0.611 0.548 0.422 0.527<br />
<strong>Karnataka</strong>: All 2001 2854 1520 4141 0.679 0.704 0.526 0.637<br />
<strong>Karnataka</strong>: All 1991 1115 638 1572 0.618 0.587 0.371 0.525<br />
Sources:<br />
1. LEB estimates and per capita income estimates for SCs and STs for the year 2004 are based on the Sample Survey on SCs and STs conducted by the Directorate of Economics and Statistics,<br />
<strong>Karnataka</strong>.<br />
2. Literacy rates and data on children in the age group 6-18 years; Registrar General of India, Census 2001.<br />
3. Gross Enrolment Ratio – Enrolment data for class I-XII; Commissioner for Public Instruction, <strong>Karnataka</strong>.<br />
The HDI for SCs in 2004 is about 6 per cent higher<br />
than the state HDI in 1991 while the HDI for STs<br />
in 2004 has still not caught up with, and is -0.55<br />
per cent below, the HDI of the total population in<br />
1991. In effect, the human development status<br />
of the Scheduled Castes and Scheduled Tribes in<br />
<strong>Karnataka</strong> is about a decade behind the rest of the<br />
state.<br />
An analysis of each index reveals that, overall,<br />
the status of the STs is poor compared with both<br />
SCs and the total population. The health index of<br />
both SCs and STs is below the state health index<br />
for 1991, while the education index of the SCs<br />
is above, and that of the STs is below, the 1991<br />
index for the total population. The income index<br />
of both SCs (0.475) and STs (0.442) falls in<br />
27
<strong>Human</strong> <strong>Development</strong> in <strong>Karnataka</strong><br />
<strong>Karnataka</strong>’s ranking in<br />
the GDI has improved<br />
by one place, i.e. it<br />
moved from seventh<br />
rank in HDI to sixth<br />
rank in GDI, exhibiting<br />
the characteristics of<br />
improved gender equality<br />
in the state.<br />
between the state average for 1991 (0.402) and<br />
2001 (0.559). The largest gaps are in income and<br />
education, with SCs being 15 per cent and STs<br />
being 20 per cent below the state income index in<br />
2001 and 11 per cent and 21 per cent respectively<br />
below the state education index for 2001. Overall,<br />
it could be said that the human development of the<br />
SCs and STs in 2004 is comparable to the state’s<br />
human development status in 1991. That such a<br />
signifi cant segment of the population should be so<br />
far behind the socio-economic development of the<br />
rest of the state’s population is indeed disturbing<br />
news for any policy maker. Yet, the status of SCs<br />
and STs in <strong>Karnataka</strong> is usually better than the<br />
all-India norm indicating the larger dimensions of<br />
this issue at the national level.<br />
In the matter of gender equality, as measured by<br />
the GDI, SC women are better off than ST women,<br />
but this is only a matter of degree, as there is a big<br />
gap between the state GDI average and the GDI<br />
for SC and ST women. As in the case of the HDI,<br />
the GDI values for 2004 for each index is closer to<br />
the state GDI values for 1991. The income index<br />
is somewhere between the 1991 and 2001 levels<br />
for the state, but the health index (0.615 for SCs<br />
and 0.611 for STs) has not even reached the<br />
1991 state health index of 0.618. In education,<br />
the SCs are about 12 per cent and the STs about<br />
22 per cent below the state average. If it is any<br />
consolation to SC and ST women, the inequality<br />
gap ranges from 0.013 for all to 0.012 for STs<br />
and 0.011 for SCs. However, the differences<br />
between the state average HDI and GDI and the<br />
HDI and GDI of SCs and STs are much more acute<br />
(Table 2.9).<br />
TABLE 2.9<br />
HDI and GDI by social groups: 2001<br />
Index All SCs Gap STs Gap<br />
HDI 0.650 0.575 0.075 0.539 0.111<br />
GDI 0.637 0.564 0.073 0.527 0.110<br />
Difference between HDI and GDI 0.013 0.011 0.012<br />
Sources:<br />
1. LEB estimates and per capita income estimates for SCs and STs for the year 2004 are based on the Sample Survey on<br />
SCs and STs conducted by the Directorate of Economics and Statistics, <strong>Karnataka</strong>.<br />
2. Literacy rates and data on children in the age group 6-18 years; Registrar General of India, Census 2001.<br />
3. Gross Enrolment Ratio – Enrolment data for class I-XII; Commissioner for Public Instruction, <strong>Karnataka</strong>.<br />
HDI and GDI of states<br />
While many states, in their HDRs, have estimated<br />
the HDI and GDI based on UNDP methodology,<br />
so far, there has been no computation of values<br />
and ranking of states in human development<br />
and gender related development using this<br />
methodology. Though the NHDR computed the<br />
HDI of 15 major states for 2001, the methodology<br />
followed in the NHDR is somewhat different<br />
from that of UNDP. This report seeks to compare<br />
the position of <strong>Karnataka</strong> vis-à-vis other states.<br />
Hence we have computed the HDI and GDI of 15<br />
major states based on the methodology used in<br />
the UNDP HDR 1999 (Table 2.10).<br />
The states, by and large, have maintained their<br />
relative ranks on the basis of both methods of HDI<br />
computation (NHDR and UNDP): for example,<br />
Kerala is fi rst, Tamil Nadu is in 3rd place, <strong>Karnataka</strong><br />
is in the 7th place, West Bengal is in 8th place,<br />
Madhya Pradesh in 12th place and Bihar is 15th,<br />
whether we use the NHDR or UNDP methodology.<br />
However Punjab slipped from 2nd to 4th place,<br />
whereas Maharashtra’s position went up from 4th<br />
to 2nd place based on UNDP methodology. There is<br />
no change in the ranking of <strong>Karnataka</strong> either way.<br />
As far as the GDI of states is concerned, NHDR<br />
estimates are not available for 2001. The estimates<br />
of the GDI computed with UNDP methodology<br />
for 15 major states show that GDI values are<br />
invariably lower than their corresponding HDI<br />
values, indicating how entrenched gender<br />
disparities can be. <strong>Karnataka</strong>’s ranking in the<br />
GDI has improved by one place, i.e. it moved<br />
from seventh rank in HDI to sixth rank in GDI,<br />
exhibiting the characteristics of improved gender<br />
equality in the state.<br />
Punjab’s HDR for 2004 reveals a higher HDI and<br />
GDI than what we have computed for 2001. The<br />
difference is mainly because education statistics<br />
are more current in the Punjab HDR. The enrolment<br />
ratios worked out for preparing the education index<br />
in the Table 2.8 are based on enrolment fi gures of<br />
classes I to XII and children in the age group 6-
<strong>Karnataka</strong> <strong>Human</strong> <strong>Development</strong> <strong>Report</strong> <strong>2005</strong><br />
State HDI 2001<br />
(NHDR methodology)<br />
TABLE 2.10<br />
Comparison of HDI and GDI of 15 major states: 2001<br />
HDI and GDI 2001 (UNDP methodology)<br />
Value Rank Indicators HDI GDI<br />
Health index Education index Income index Value Rank Value Rank<br />
1 2 3 4 5 6 7 8 9 10 11<br />
1 Andhra Pradesh 0.416 10 0.648 0.634 0.544 0.609 9 0.595 9<br />
2 Assam 0.386 14 0.583 0.701 0.452 0.578 11 0.554 12<br />
3 Bihar 0.367 15 0.671 0.455 0.359 0.495 15 0.477 15<br />
4 Gujarat 0.479 6 0.643 0.726 0.597 0.655 5 0.642 5<br />
5 Haryana 0.509 5 0.699 0.661 0.597 0.653 6 0.636 7<br />
6 <strong>Karnataka</strong> 0.478 7 0.680 0.712 0.559 0.650 7 0.637 6<br />
7 Kerala 0.638 1 0.806 0.887 0.545 0.746 1 0.724 1<br />
8 Madhya Pradesh 0.394 12 0.560 0.660 0.494 0.572 12 0.548 13<br />
9 Maharashtra 0.523 4 0.722 0.796 0.601 0.706 2 0.693 2<br />
10 Orissa 0.404 11 0.582 0.672 0.452 0.569 13 0.555 11<br />
11 Punjab 0.537 2 0.765 0.666 0.606 0.679 4 0.676 3<br />
12 Rajasthan 0.424 9 0.625 0.651 0.513 0.596 10 0.573 10<br />
13 Tamil Nadu 0.531 3 0.723 0.764 0.574 0.687 3 0.675 4<br />
14 Uttar Pradesh 0.388 13 0.647 0.512 0.446 0.535 14 0.520 14<br />
15 West Bengal 0.472 8 0.712 0.693 0.537 0.647 8 0.631 8<br />
India 0.472 0.663 0.652 0.548 0.621 0.609<br />
Sources:<br />
1. Column 3 and 4: NHDR 2001 – Planning Commission, GoI.<br />
2. Column 5 to 11: Computed based on LEB estimates worked out by the Technical group of Registrar General of India, GoI.<br />
3. Literacy rates and data on children in the age group 6-
Financing <strong>Human</strong> <strong>Development</strong>
CHAPTER 3<br />
<strong>Karnataka</strong> <strong>Human</strong> <strong>Development</strong> <strong>Report</strong> <strong>2005</strong><br />
Financing <strong>Human</strong> <strong>Development</strong><br />
Introduction<br />
Financing human development is a very critical<br />
aspect of ensuring that public policies become<br />
concrete realities and that the poor and other<br />
vulnerable sub-populations are supported by<br />
the state, enabling them to become empowered<br />
beings capable of realising their inherent<br />
potential in a participatory and democratic<br />
context. As the UNDP <strong>Human</strong> <strong>Development</strong><br />
<strong>Report</strong> (1991) noted, the best strategy for human<br />
development is to ensure, through strong policies,<br />
generation and better distribution of primary<br />
incomes. In addition, government services in<br />
social infrastructure (schools, health clinics,<br />
nutrition and food subsidies) as well as physical<br />
infrastructure (roads, electricity and housing) can<br />
help the poor bridge the gap caused by paucity<br />
of incomes. However, despite sound intentions,<br />
governments do not always provide adequately<br />
for the social sectors. And, sometimes, when<br />
budgets are adequate, they may not target the<br />
core sectors of human development (e.g. primary<br />
healthcare, elementary education) and focus,<br />
instead, on other areas.<br />
This chapter examines the trends and patterns in<br />
public expenditure on core human development<br />
sectors in <strong>Karnataka</strong>. It comprises three separate<br />
and distinct segments. Part I presents an analysis<br />
of fi scal trends in the context of fi nancing human<br />
development. This is followed by an analysis of<br />
trends in expenditure on human development<br />
during the last decade. Finally, alternative<br />
strategies for raising additional resources<br />
needed to achieve the targets set for the Tenth<br />
Plan and the Millennium <strong>Development</strong> Goals are<br />
suggested. Part II is a case study, which analyses<br />
intra-sectoral public expenditure on education to<br />
arrive at an understanding of the state’s priorities<br />
and the quantum of funding required to achieve<br />
the desired outcomes. Part III suggests the use<br />
of gender budget and gender audit to ensure<br />
gender equity in budgeting, expenditure and<br />
outcomes.<br />
PART I<br />
Financing <strong>Human</strong> <strong>Development</strong>:<br />
An Overview<br />
<strong>Karnataka</strong> will have to ensure the provision of<br />
optimal outlays on human development and<br />
ensure effi ciency in spending in order to achieve<br />
the Millennium <strong>Development</strong> Goals (MDGs) 1 as<br />
well as the targets set for the Tenth Five Year Plan. 2<br />
Government spending on social services, which<br />
include education, healthcare, nutrition, drinking<br />
water, sanitation, housing and poverty reduction<br />
is a critical input that the poor and marginalised<br />
can leverage to bridge the gap between the<br />
insuffi ciency of their personal incomes and their<br />
basic human needs. Government resources are,<br />
however, neither infi nite nor elastic. There are many<br />
competing demands on the state’s resources, and<br />
a state like <strong>Karnataka</strong>, where agriculture is still<br />
primarily dry land cultivation and where recurring<br />
droughts dry up hydel reservoirs, leading to acute<br />
power scarcity, must, at all times, strive to achieve<br />
that fi ne balance between growth and equity,<br />
between economic development and social justice.<br />
Investments in irrigation, power and infrastructure<br />
1<br />
The eight Millennium <strong>Development</strong> Goals are: (i) eradicate<br />
extreme poverty and hunger; (ii) achieve universal primary<br />
education; (iii) promote gender equality and empowerment<br />
of women; (iv) reduce child mortality; (v) improve maternal<br />
health; (vi) combat HIV/AIDS, Malaria and other diseases;<br />
(vii) ensure environmental sustainability; and (viii) develop a<br />
global partnership for development.<br />
2<br />
The Tenth Plan Targets are: (i) reduction of poverty ratio by<br />
5 percentage points by 2007 and 15 percentage points by 2012;<br />
(ii) all children in school by 2003 and all children to complete<br />
5 years of schooling by 2007; (iii) increase in literacy rates to<br />
75 per cent within the Tenth Plan period (2002-07);<br />
(iv) reduction in gender gap in literacy by at least 50 per cent<br />
by 2007; (v) reduction of IMR to 45 per 1000 live births by<br />
2007 and to 28 by 2012; (vi) reduction of MMR to 2 per 1000<br />
live births by 2007 and 1 by 2012; (vii) access to potable<br />
drinking water in all villages in the plan period; (viii) HIV-AIDS:<br />
80 per cent coverage of high risk groups, 90 per cent coverage<br />
of schools and colleges, 80 per cent awareness among general<br />
rural population reducing transmission through blood to < 1 per<br />
cent, achieving zero level increase of HIV/AIDS revalue by 2007;<br />
(ix) annual blood examination rate (ABER) over 10 per cent,<br />
annual parasite incidence (API) to 1.3 or less, 25 per cent<br />
reduction in morbidity and mortality due to malaria by 2007<br />
and 50 per cent by 2010 (NHP 2002).<br />
<strong>Karnataka</strong> will have to<br />
ensure the provision of<br />
optimal outlays on human<br />
development and ensure<br />
efficiency in spending<br />
in order to achieve the<br />
Millennium <strong>Development</strong><br />
Goals as well as the<br />
targets set for the Tenth<br />
Five Year Plan.<br />
33
Financing <strong>Human</strong> <strong>Development</strong><br />
During 1990-2001<br />
<strong>Karnataka</strong> witnessed<br />
the highest growth rate<br />
of GSDP as well as per<br />
capita GSDP in the<br />
country. Nevertheless, the<br />
state continues to be in<br />
the league of<br />
middle-income states,<br />
with per capita GSDP<br />
slightly below the<br />
all-India average.<br />
are a necessary prerequisite to economic growth,<br />
but abundant caution is necessary to ensure<br />
that these are not unduly emphasised at the<br />
cost of social investments targeting human<br />
development.<br />
During 1990-2001 <strong>Karnataka</strong> witnessed the<br />
highest growth rate of GSDP as well as per capita<br />
GSDP in the country, growing respectively at 7.6<br />
per cent and 5.9 per cent. This was, indeed, a<br />
command performance. Nevertheless, the state<br />
continues to be in the league of middle-income<br />
states, with per capita GSDP slightly below the<br />
all-India average (Table 3.1.1). The state ranks<br />
seventh among the fourteen non-special category<br />
states (excluding the small state of Goa and<br />
the newly created states of Chhattisgarh and<br />
Jharkhand). The relative position of <strong>Karnataka</strong> in<br />
respect of other developmental indicators such as<br />
per capita consumption and various indicators of<br />
human development is also close to the median<br />
value. The head count measure of poverty in the<br />
state is estimated at 19.1 per cent in rural areas,<br />
which is below than 28.8 per cent estimated for<br />
the nation as a whole, although urban poverty in<br />
the state (27.1 per cent) is slightly higher than<br />
all-India average (25.1 per cent).<br />
The <strong>Human</strong> <strong>Development</strong> Index (HDI) in <strong>Karnataka</strong><br />
increased from 0.412 in 1991 to 0.478 in 2001<br />
(NHDR, Government of India, 2001), which<br />
approximates the all-India average value. Despite<br />
this increase over the decade, <strong>Karnataka</strong> has held<br />
on to the seventh rank among the states in India.<br />
Although <strong>Karnataka</strong>’s status with regard to HDI<br />
and its various components is broadly equivalent<br />
to the all-India average, it ranks below the<br />
neighbouring states of Kerala, Maharashtra and<br />
Tamil Nadu (Table 3.1.2). Considerable resources<br />
as well as efforts are needed to catch up with the<br />
achievements in human development in these<br />
neighbouring states.<br />
TABLE 3.1.1<br />
Selected developmental indicators in <strong>Karnataka</strong><br />
Indicators <strong>Karnataka</strong> All-India<br />
Value Rank in<br />
14 major<br />
states<br />
Value<br />
GSDP/GDP 2001-02 (Current prices) (Rs. lakh) 10565776 7 a 209095700 b<br />
Per capita GSDP/GDP 2001-02 (Current prices) (Rs.) 19821 6 a 20164<br />
Growth rate of GSDP/GDP in 1990-2001 7.56 1 6.1<br />
Growth rate of per capita GSDP/GDP in 1990-2001 5.89 1 4.08<br />
Per capita consumption expenditure 1999-2000 (Rs.) 639 7 591<br />
Head count ratio of poverty (percentage) (Rural) – 1999-2000 19.1 7 28.8<br />
Head count ratio of poverty (percentage) (Urban) – 1999-2000 27.1 8 25.1<br />
Percentage of workers to total population 2001 44.6 3 39.26<br />
Percentage of rural workers to rural population 2001 49.2 4 41.97<br />
Growth in employment 1993-94 to 1999-2000 1.6 6 1.6<br />
Unemployment rate (per cent of labour force) 1999-2000 1.4 5 2.3<br />
Notes:<br />
1. a : Ranks have been computed using GSDP data for 2000-01.<br />
2. b : Provisional estimate.<br />
Sources:<br />
1. GSDP – <strong>Karnataka</strong>: Directorate of Economics and Statistics, <strong>Karnataka</strong>.<br />
2. All-India GDP: Economic Survey, 2003-04.<br />
3. Per capita consumption expenditure: National <strong>Human</strong> <strong>Development</strong> <strong>Report</strong>, 2001.<br />
4. Poverty estimates: Sen and Himanshu (2004).<br />
5. Other data: Inter-State Economic Indicators, Planning Department, <strong>Karnataka</strong>, 2004.<br />
34
<strong>Karnataka</strong> <strong>Human</strong> <strong>Development</strong> <strong>Report</strong> <strong>2005</strong><br />
TABLE 3.1.2<br />
<strong>Human</strong> development indicators in <strong>Karnataka</strong> and neighbouring states<br />
Indicators <strong>Karnataka</strong> Tamil Nadu Kerala Maharashtra Andhra<br />
Pradesh<br />
<strong>Karnataka</strong>’s rank<br />
among 14 major states<br />
HDI (2001) 0.478 0.531 0.638 0.523 0.416 7 (0.472)**<br />
HDI (1991) 0.412 0.466 0.591 0.452 0.377 7 (0.381)<br />
Per capita consumption expenditure, 1999-2000 (Rs.) 639 681 816 697 550 7 (591)<br />
Literacy rate 2001 66.64 73.47 90.92 77.27 61.11 8 (65.49)<br />
Female literacy rate 2001 56.87 64.55 87.86 67.51 51.17 7 (54.28)<br />
Infant mortality rate (per 1000 live births) (2003)* 52 43 11 42 59 6 (57.4)<br />
Life expectancy at birth (LEB) (female) (2001-06) 66.44 69.75 75 69.76 65 7 (66.91)<br />
Birth rate (per 1000) 2003* 21.8 18.3 16.7 19.9 20.4 7 (24.05)<br />
Death rate (per 1000) 2003* 7.2 7.6 6.3 7.2 8.0 7 (7.88)<br />
Female work participation rates 2001 35.07 34.73 24.3 35.97 37.69 5 (31.56)<br />
Notes:<br />
1. Figures in parentheses indicate value of indicator for the country as a whole.<br />
2. ** indicates value of the indicator for the 15 major states of India.<br />
Sources:<br />
1. Data on HDI - National <strong>Human</strong> <strong>Development</strong> <strong>Report</strong>, 2001.<br />
2. Registrar General of India, Census, 2001.<br />
3. * Registrar General of India, Sample Registration System, SRS bulletin, volume 39 (1), April <strong>2005</strong>.<br />
4. National Family and Health Survey-2, IIPS, Mumbai, 1998-99.<br />
The prevalence of inter-district variations – in<br />
levels of development generally, as well as in<br />
human development particularly – is a matter<br />
of concern. It partly explains the seeming<br />
contradiction between the high growth in GSDP<br />
and the median rank in HDI in the state. Among<br />
all the districts of <strong>Karnataka</strong>, the HDI index was<br />
the highest in Bangalore Urban district (0.753)<br />
and the lowest in Raichur (0.547). 3 In general,<br />
the HDI of a district closely follows the level of<br />
development as indicated by the per capita district<br />
income with a correlation coeffi cient of 0.9. The<br />
HDI is high in the coastal districts, and very low in<br />
the Hyderabad <strong>Karnataka</strong> and Bombay <strong>Karnataka</strong><br />
regions of the state.<br />
Improving the human development indicators of<br />
the state requires considerable augmentation of<br />
investment, in both physical and human capital,<br />
as well as improvement in the productivity of<br />
the capital invested. 4 Any analysis of the task<br />
of fi nancing human development in <strong>Karnataka</strong><br />
and the options for enhancing the investment<br />
to desirable levels must take into account<br />
the condition of the state’s fi nances and the<br />
constraints that they impose on fi nancing human<br />
development.<br />
The issue has gained importance for a number<br />
of reasons. First, the sharply deteriorating fi scal<br />
health of the state had posed serious diffi culties<br />
in releasing resources for investment in human<br />
capital. Second, compression of expenditures<br />
as a part of the fi scal adjustment strategy, and<br />
competing claims on fi scal resources at the state<br />
level, have underlined the need for prioritising<br />
expenditures in favour of human development.<br />
Third, the Millennium <strong>Development</strong> Goals<br />
Improving the<br />
human development<br />
indicators of the state<br />
requires considerable<br />
augmentation of<br />
investment, in both<br />
physical and human<br />
capital, as well as<br />
improvement in the<br />
productivity of the capital<br />
invested.<br />
3<br />
These values are not comparable to the estimates of National<br />
<strong>Human</strong> <strong>Development</strong> <strong>Report</strong> (NHDR) due to differences in<br />
methodology as well as data used to estimate them.<br />
4<br />
There are numerous examples of countries where social sector<br />
expenditure was given a priority in their development strategy<br />
and these priorities have paid rich dividends. Sri Lanka and<br />
Cuba are two such countries.<br />
35
Financing <strong>Human</strong> <strong>Development</strong><br />
Significant inter-district<br />
variations in human<br />
development and the<br />
skewed distribution<br />
of historically given<br />
expenditures, in favour<br />
of districts with higher<br />
human development<br />
indicators, makes it<br />
necessary to introduce<br />
strategic changes in<br />
resource allocation.<br />
(MDGs), which, in some sense, are refl ected in the<br />
targets set for the Tenth Five Year Plan, cannot be<br />
achieved unless the social sector expenditures are<br />
augmented appreciably, and a signifi cant increase<br />
in the productivity of social sector spending is<br />
achieved by improving the delivery systems and<br />
by harnessing private investments to complement<br />
public spending. Finally, signifi cant inter-district<br />
variations in human development and the skewed<br />
distribution of historically given expenditures, in<br />
favour of districts with higher human development<br />
indicators, makes it necessary to introduce strategic<br />
changes in resource allocation. At the same time,<br />
poor effi ciency of expenditure in districts with a<br />
low human development index (HDI) necessitates<br />
institutional changes to improve the delivery<br />
systems to achieve the goals set for the Tenth Plan<br />
by focusing on districts with signifi cant shortfalls<br />
in HDIs.<br />
Like several other states in India, <strong>Karnataka</strong><br />
witnessed a sharp deterioration in its fi scal health,<br />
particularly after the state had to accommodate<br />
the severe burden of pay and pension revision in<br />
1998-99 while meeting the rising interest costs<br />
throughout the 1990s. Increasing debt service<br />
payments, continued deterioration in power<br />
sector fi nances, and ineffi cient cost recovery from<br />
investment in irrigation systems exacerbated the<br />
fi scal problems of the state. At the same time,<br />
the decline in revenue growth, both due to a<br />
decline in Central transfers and deceleration in its<br />
own revenues in the 1990s as compared to the<br />
previous decade, put pressure on the state’s ability<br />
to step up investments in human development.<br />
As a proportion of GSDP, the revenue from own<br />
sources has not shown much increase and the<br />
Central transfers under both plan and non-plan<br />
categories have declined.<br />
The ‘White Paper on State Finances’ tabled in the<br />
state legislature in 2000 detailed the magnitude<br />
of the fi scal problem and identifi ed the policy<br />
and institutional reforms needed to restore<br />
fi scal balance. <strong>Karnataka</strong> embarked on a fi scal<br />
adjustment programme with the World Bank’s<br />
assistance in 2000. The ‘Medium Term Fiscal<br />
Plan’ (MTFP) prepared by the state government<br />
laid down the path of fi scal rectitude. These fi scal<br />
developments had signifi cant implications for the<br />
overall outlay position of the state government on<br />
social sectors.<br />
Trends in state finances<br />
The ‘White Paper on State Finances’ presented<br />
to the state legislature in 2000 noted the sharp<br />
deterioration in state fi nances during the 1990s.<br />
It identifi ed the factors contributing to the<br />
deteriorating fi scal imbalance in <strong>Karnataka</strong> and<br />
suggested a number of policy measures aimed at<br />
redressing it. On the revenue side, the problem<br />
was attributed to deceleration in the growth<br />
rates of own revenues of the state, and even<br />
more importantly, of Central transfers during the<br />
1990s, as compared to the previous decade. On<br />
the expenditure front, the single most important<br />
issue causing signifi cant deterioration was the<br />
revision of salaries and pensions. Expenditures on<br />
debt servicing and implicit and explicit subsidies<br />
also contributed to a worsening fi scal outcome.<br />
Another fi scal concern was the defi cit in the power<br />
sector. In the past, in fact, the revenue and fi scal<br />
defi cit numbers did not fully capture the defi cits in<br />
the power sector, but after the fi scal adjustment<br />
programme was undertaken, the defi cit fi gures<br />
fully refl ect the power sector losses.<br />
Both revenue and fi scal defi cits deteriorated in the<br />
state even as the state’s revenue as a percentage<br />
of GSDP increased from 12.8 per cent in<br />
1998-99 to 14.20 per cent in 2002-03. The<br />
ratio of revenue defi cit to GSDP increased from<br />
1.4 per cent in 1998-99 to 3.1 per cent in<br />
2001-02, but declined thereafter to 2.3 per cent<br />
in 2002-03. Similarly, during the period, the fi scal<br />
defi cit in the state increased from 3.5 per cent<br />
to 5.6 per cent before improving to 4.6 per cent<br />
in 2002-03, and the ratio of capital expenditure<br />
to GSDP remained just above 2 per cent (Figure<br />
3.1.1). There are, however, indications of<br />
some improvement in the fi nances of the state<br />
government in subsequent years.<br />
While the revenue receipts between 1990-91<br />
and 2002-03 increased at the rate of 11.9<br />
per cent per annum, the growth of revenue<br />
expenditure was much faster at 13.4 per cent.<br />
The gap between the growth of expenditures<br />
36
<strong>Karnataka</strong> <strong>Human</strong> <strong>Development</strong> <strong>Report</strong> <strong>2005</strong><br />
FIGURE 3.1.1<br />
Fiscal imbalance in <strong>Karnataka</strong>: 1990-91 to 2002-03<br />
6<br />
5<br />
4<br />
Per cent of GSDP<br />
3<br />
2<br />
1<br />
0<br />
-1<br />
1990-91<br />
1991-92<br />
1992-93<br />
1993-94<br />
1994-95<br />
1995-96<br />
Years<br />
1996-97<br />
1997-98<br />
1998-99<br />
1999-2000<br />
2000-01<br />
2001-02<br />
2002-03<br />
Fiscal Defi cit Capital Expenditure Revenue Defi cit<br />
FIGURE 3.1.2<br />
Trends in revenues and expenditures in <strong>Karnataka</strong>:1990-91 to 2002-03<br />
Per cent of GSDP<br />
20<br />
19<br />
18<br />
17<br />
16<br />
15<br />
14<br />
13<br />
12<br />
11<br />
10<br />
1990-91<br />
1991-92<br />
1992-93<br />
1993-94<br />
1994-95<br />
1995-96<br />
Years<br />
1996-97<br />
1997-98<br />
1998-99<br />
1999-2000<br />
2000-01<br />
2001-02<br />
2002-03<br />
Total Expenditure<br />
Revenue Expenditure<br />
Revenue Receipts<br />
and revenues has continued, even after the<br />
programme of fi scal adjustment was put in<br />
place and the MTFP was drawn up. While the<br />
revenue receipts as a ratio of GSDP increased<br />
by 1.4 percentage points between 1998-99 and<br />
2002-03, the ratio of revenue expenditure to<br />
GSDP increased by 2.3 percentage points, thus<br />
increasing the revenue defi cit (Figure 3.1.2). As<br />
the capital expenditure to GSDP ratio remained<br />
broadly at the same level – about two per cent –<br />
the increase in fi scal defi cit was mainly the result<br />
of an increase in the revenue defi cit. Thus, the<br />
share of revenue defi cit in fi scal defi cit increased<br />
from about 39 per cent in 1998-99 to 50.1<br />
per cent in 2002-03 (Figure 3.1.3).<br />
This high growth of expenditure relative to<br />
revenues has serious implications for spending<br />
on human development. This becomes evident<br />
when a disaggregated analysis of the expenditure<br />
trends in <strong>Karnataka</strong> shows that a large proportion<br />
of the increase in revenue expenditures derives<br />
from an increase in expenditure on salaries,<br />
pensions and interest payments. Increases in<br />
37
Financing <strong>Human</strong> <strong>Development</strong><br />
FIGURE 3.1.3<br />
Revenue deficit as percentage of fiscal deficit: 1990-91 to 2002-03<br />
Per cent<br />
60<br />
50<br />
40<br />
30<br />
20<br />
10<br />
00<br />
-10<br />
-20<br />
1990-91<br />
1991-92<br />
1992-93<br />
1993-94<br />
1994-95<br />
1995-96<br />
Years<br />
1996-97<br />
1997-98<br />
1998-99<br />
1999-2000<br />
2000-01<br />
2001-02<br />
2002-03<br />
<strong>Karnataka</strong>’s plan<br />
expenditure over<br />
a six-year period<br />
(2000-01 to <strong>2005</strong>-06)<br />
yields interesting insights<br />
about the state’s priority<br />
sectors. Investments<br />
in irrigation exceeded<br />
investments in the social<br />
sector in all years except<br />
2001-02 and 2003-04<br />
over a six-year period.<br />
expenditure on salaries and pensions accounted<br />
for almost 34 per cent of the increase in<br />
revenue expenditures between 1997-98 and<br />
2001-02. The increase in interest payments<br />
accounted for about 17 per cent of the increase<br />
in revenue expenditure between 1997-98 and<br />
2001-02. Together, interest payments, salaries<br />
and pensions accounted for about 51 per cent<br />
of the rise in revenue expenditure between<br />
1997-98 and 2001-02. In comparison, less than<br />
10 per cent of the expenditure was made on physical<br />
capital outlay between the period 1997-98 and<br />
2001-02.<br />
The persistence of large revenue and fi scal defi cits<br />
has increased the debt burden of the state. The<br />
outstanding debt of the state government as a<br />
proportion of GSDP increased from about 17.6<br />
per cent in 1995-96 to about 25.7 per cent of<br />
GSDP in 2001-02. Correspondingly, interest<br />
payments increased from 12.35 per cent of total<br />
revenue expenditure in 1995-96 to 14.4 per<br />
cent in 2001-02. The <strong>Karnataka</strong> government<br />
has now embarked on debt restructuring by<br />
swapping high interest loans for low interest<br />
loans. The burden of debt servicing is, thus,<br />
likely to come down in the next few years. In the<br />
short and medium term this will provide some<br />
fi scal space for spending on more productive<br />
sectors.<br />
Sectoral priorities<br />
Plan expenditure 5 is associated with new policy<br />
initiatives and development, while non-plan<br />
expenditure relates to maintenance of schemes that<br />
were introduced in earlier Plan periods. <strong>Karnataka</strong>’s<br />
plan expenditure over a six-year period (2000-01<br />
to <strong>2005</strong>-06) yields interesting insights about the<br />
state’s priority sectors. Investments in irrigation<br />
exceeded investments in the social sector in all years<br />
except 2001-02 and 2003-04 over a six-year period<br />
(Table 3.1.3). Investments in energy exceeded<br />
those in education in all six years. Since the term<br />
‘social services’ encompasses education, health and<br />
family welfare, rural development, social welfare,<br />
and the development of women and children,<br />
to name a few sectors, the actual share of each<br />
sub-sector is quite low.<br />
Irrigation<br />
<strong>Karnataka</strong> is second only to Rajasthan in the<br />
extent of arid land in the state. According to the<br />
1997 NSSO fi gures, the percentage of irrigated<br />
land in the state is 19.33 per cent, which is<br />
considerably less than the all-India average of<br />
35.39 per cent. Even though the percentage<br />
of irrigated land in the state has increased<br />
since then, <strong>Karnataka</strong> still has less land under<br />
irrigation than the all-states’ average as well as<br />
the other southern states. Most of the arid land<br />
is concentrated in north and central <strong>Karnataka</strong>,<br />
5<br />
Annual Plans, <strong>Karnataka</strong>.<br />
38
<strong>Karnataka</strong> <strong>Human</strong> <strong>Development</strong> <strong>Report</strong> <strong>2005</strong><br />
Sl.<br />
No.<br />
TABLE 3.1.3<br />
Plan expenditure from 2000-01 to <strong>2005</strong>-06: Main sectors by investment<br />
(Rs. lakh)<br />
Year Irrigation Energy Education Other social<br />
services<br />
Others<br />
1 2000-01 251903.00 58360.00 49861.00 185348.00 189923.00 735395.00<br />
34.25 7.94 6.78 25.20 25.83 100.00<br />
2 2001-02 247659.00 105011.00 59797.00 200364.00 221924.00 834755.00<br />
29.67 12.58 7.16 24.00 26.59 100.00<br />
3 2002-03 291686.83 86580.00 34108.42 185421.26 218594.49 916391.00<br />
35.73 10.61 4.18 22.71 26.78 100.00<br />
4 2003-04 241330.60 127580.40 58107.70 207101.38 227824.92 861945.00<br />
28.00 14.80 6.74 24.03 26.43 100.00<br />
5 2004-05 328246.45 162940.30 95546.23 225285.04 362098.98 1174117.00<br />
27.96 13.88 8.14 19.19 30.84 100.00<br />
6 <strong>2005</strong>-06 394240.63 185391.70 101201.41 219410.56 455255.70 1355500.00<br />
29.08 13.68 7.47 16.19 33.59 100.00<br />
Note: Figures in italics indicate percentages.<br />
Source: Annual Plan documents for 2000-01 to <strong>2005</strong>-06, Planning Department, <strong>Karnataka</strong>.<br />
Total<br />
which, as we saw in chapters 1 and 2, have low<br />
economic and human development indicators.<br />
The irrigation potential from all sources is<br />
estimated at 55 lakh hectares and the potential<br />
created up to 2003-04 is 30.61 lakh hectares. 6<br />
Consequently, investment in irrigation has<br />
increased signifi cantly since the Sixth Plan, when<br />
it was Rs.522.72 crore, to Rs.9,889.22 crore in<br />
the Ninth Plan. Over this period the investment<br />
on irrigation as a proportion of the state’s plan<br />
expenditure has also steadily increased from 19.0<br />
per cent in the Sixth Plan to 31.0 per cent in the<br />
Ninth Plan. Heavy investments in irrigation have<br />
also been driven by the need to complete projects<br />
in the Upper Krishna basin to ensure optimal<br />
utilisation of the state’s share of water allocated<br />
to it by the Krishna Water Dispute Tribunal. Much<br />
of the investment in irrigation in recent times has<br />
been through market borrowings.<br />
Energy<br />
<strong>Karnataka</strong> pioneered hydropower development<br />
and had a comfortable surplus until the<br />
nineteen seventies, when rapid industrialisation<br />
saw the state plunging into power scarcity. In<br />
2003-04, the state had a power defi cit of 9,656<br />
MUs. Reducing its dependence on hydel power,<br />
which is notoriously undependable, and bridging<br />
the defi cit are the two imperatives that have shaped<br />
the power policy of the state as it rapidly moves<br />
towards providing infrastructure for information<br />
technology and biotechnology-based industries.<br />
Investment in energy has increased several-fold<br />
since the Sixth Plan, when it was Rs.601.40 crore,<br />
to Rs.3,740.36 crore in the Ninth Plan. 7 However,<br />
the investment on energy as a proportion of state<br />
plan expenditure has decreased from 26.50<br />
per cent in the Sixth Plan to 13.50 per cent in the<br />
Ninth Plan. The government also provides subsidy<br />
to the power utilities to ensure an adequate rate<br />
of return, as stipulated by the Central Electricity<br />
Authority. The private sector is yet to play a<br />
signifi cant role in this area. So, public investment<br />
is critical to improving the power situation. The<br />
rapid increase in irrigation pump sets places a<br />
great demand on power supply. Farmers constitute<br />
a critical set of stakeholders whose interests are<br />
6<br />
Annual Plan of <strong>Karnataka</strong>, <strong>2005</strong>-06.<br />
7<br />
The total investment from Sixth Plan to Ninth Plan on Energy is<br />
Rs.9,812.75 crore. The total Plan investment during this period<br />
is Rs.57,309.34 crore.<br />
39
Financing <strong>Human</strong> <strong>Development</strong><br />
Indian states have a<br />
dominant role in the<br />
provision of social<br />
services such as<br />
education, healthcare,<br />
housing, social<br />
welfare, water supply<br />
and sanitation. State<br />
governments incur<br />
over 85 per cent of the<br />
expenditure on these<br />
services.<br />
well represented politically. In fact, a case exists<br />
for increasing public investments in energy to<br />
meet the growing gap between its demand and<br />
supply.<br />
Overall then, the scenario is one of competing<br />
demands for fi nancing. <strong>Human</strong> development<br />
sectors must seek space for funds in the face of<br />
compelling demands from other sectors.<br />
Expenditure on human development<br />
Indian states have a dominant role in the<br />
provision of social services such as education,<br />
healthcare, housing, social welfare, water supply<br />
and sanitation. State governments incur over 85<br />
per cent of the expenditure on these services.<br />
Therefore, deterioration in states’ fi nances and<br />
undue pressure to compress their expenditures<br />
as part of a fi scal adjustment strategy reduces<br />
the fi scal space available to state governments.<br />
Unfortunately, the constituency demanding a<br />
larger allocation to social sector expenditures is<br />
not strong, although there is now a grounds-well<br />
building up at the grassroots, consequent upon<br />
the devolution of political and executive powers<br />
to local bodies, which have begun to demand<br />
improved services. Currently, however, the<br />
expenditure compression at the state level impacts<br />
adversely the resources allocated to these sectors,<br />
notwithstanding their high social value and<br />
productivity. This environment of fi scal constraint<br />
has shaped the trends in human development<br />
spending in the last decade.<br />
Trends in investment in human<br />
development<br />
The analysis of spending on human development<br />
is made in terms of four ratios suggested by<br />
UNDP’s 1991 <strong>Human</strong> <strong>Development</strong> <strong>Report</strong>.<br />
These are (i) public expenditure ratio (PER); (ii)<br />
social allocation ratio (SAR); (iii) social priority<br />
ratio (SPR); and (iv) human expenditure ratio<br />
(HER). The public expenditure ratio (PER) refers<br />
to the total budgetary expenditures of the state<br />
government as a proportion of GSDP in the state.<br />
The social allocation ratio refers to the share of<br />
budgetary expenditures on the social sector<br />
(social services and rural development) as a<br />
proportion of total budgetary expenditures of the<br />
state government. 8 The social priority ratio refers<br />
to the budgetary expenditures on human priority<br />
areas as a percentage of expenditure by the state<br />
government on the social sector. <strong>Human</strong> priority<br />
areas include elementary education, health and<br />
family welfare, 9 nutrition, water supply and<br />
sanitation and rural development. Finally, the<br />
human expenditure ratio (HER) is the product of<br />
the fi rst three ratios and measures the expenditure<br />
by the state government in human priority areas<br />
as a proportion of GSDP in the state. The different<br />
indicators of spending on human development<br />
and their trends for <strong>Karnataka</strong> for the years<br />
1990-91 and 2002-03 estimated from the fi nance<br />
accounts of the state government are presented in<br />
Table 3.1.4 and Figure 3.1.4. 10<br />
The trend in PER, the fi rst of the four indicators<br />
presented in column 2 of Table 3.1.4 denotes<br />
the level of spending on various public services in<br />
<strong>Karnataka</strong>. The PER increased from 17.8 per cent<br />
in 1990-91 to 19.2 per cent in 1992-93 before<br />
declining to 16.3 per cent in 1998-99. Thereafter,<br />
mainly due to pay and pension revision, the PER<br />
increased to constitute more than 18 per cent<br />
of GSDP in 1999-2000. In fact, the full effect<br />
of the pay revision was seen in 2000-01 as the<br />
government had to incur substantial expenditures<br />
to pay arrears. Besides, as part of the structural<br />
adjustment condition with the World Bank, the<br />
government had to show the power sector defi cit<br />
explicitly in the budget. Thus, in 2001-02, the<br />
public expenditure-GDP ratio increased to over<br />
20 per cent. However, the fi scal adjustment<br />
programme resulted in the deceleration of<br />
expenditure, to reduce the PER to 18.8 per cent<br />
in the following year, and has stabilised at that<br />
level in subsequent years.<br />
8<br />
‘Social Services’ include the following sectors: (i) Education,<br />
Sports, Art and Culture; (ii) Medical and Public Health;<br />
(iii) Family Welfare; (iv) Water Supply and Sanitation;<br />
(v) Housing; (vi) Urban <strong>Development</strong>; (vii) Welfare of SCs, STs<br />
and OBCs; (viii) Labour and Labour Welfare; (viii) Social Security<br />
and Welfare; (ix) Nutrition; (x) Relief on Account of Natural<br />
Calamities; (xi) Other Social Services; (xii) Rural <strong>Development</strong>.<br />
9<br />
Excluding Medical Education, Training and Research, Employees<br />
State Insurance Scheme and Transport and Compensation for<br />
Family Welfare.<br />
10<br />
For each of the indicators, expenditure has been calculated<br />
as the sum of revenue expenditures, capital expenditures and<br />
loans and advances (net of repayments).<br />
40
<strong>Karnataka</strong> <strong>Human</strong> <strong>Development</strong> <strong>Report</strong> <strong>2005</strong><br />
Year<br />
TABLE 3.1.4<br />
Indicators of expenditure on social sectors in <strong>Karnataka</strong><br />
Public expenditure<br />
ratio<br />
Social allocation<br />
ratio<br />
Social priority<br />
ratio<br />
(Per cent)<br />
<strong>Human</strong><br />
expenditure ratio<br />
1990-91 17.78 41.22 55.45 4.06<br />
1991-92 17.61 40.20 53.72 3.80<br />
1992-93 19.18 36.77 52.54 3.71<br />
1993-94 18.45 39.50 54.03 3.94<br />
1994-95 17.70 39.19 53.83 3.73<br />
1995-96 17.79 37.62 51.94 3.48<br />
1996-97 17.75 36.90 51.02 3.34<br />
1997-98 16.73 38.40 51.99 3.34<br />
1998-99 16.33 39.49 52.55 3.39<br />
1999-2000 18.09 37.75 54.86 3.75<br />
2000-01 18.22 37.89 52.84 3.65<br />
2001-02 20.06 34.96 52.29 3.67<br />
2002-03 18.83 34.36 50.69 3.28<br />
Note: Expenditure under different heads has been estimated as the sum of revenue expenditure and capital expenditure (including loans<br />
and advances net of repayments).<br />
Source: Estimated from Finance Accounts of <strong>Karnataka</strong>, Accountant General, GoI.<br />
Although the aggregate expenditure-GDP ratio<br />
showed a signifi cant increase over the years, social<br />
sector expenditures have actually shown a marginal<br />
decline. The share of social sector expenditures in<br />
the total or social allocation ratio (SAR) declined<br />
by seven percentage points from 41 per cent in<br />
1990-91 to 34 per cent in 2002-03. As a ratio<br />
of GSDP too, social sector expenditures declined<br />
by about 0.8 percentage point, from 7.3 per cent<br />
to 6.5 per cent. The decline in the expenditure-<br />
GDP ratio as well as the share of social sector<br />
expenditures implies that overall, the allocation to<br />
the social sector in real terms has declined, despite<br />
substantial increases in the pay and pension<br />
revision. In other words, the burden of increasing<br />
pay and pension revision, has affected social sector<br />
expenditures with serious implications for both<br />
future growth and the welfare of the population.<br />
As noted earlier, expenditure on the social sector<br />
includes expenditure on social services and rural<br />
development. Within this, expenditure on primary<br />
education, basic healthcare, and poverty alleviation<br />
are priority items and their share in social sector<br />
expenditure is termed the social priority ratio<br />
(SPR). The trend in the social priority ratio, which<br />
is a sub-set of SAR, is similar. The SPR presented<br />
in Table 3.1.4, declined from 55.5 per cent in<br />
1990-91 to 50.6 per cent in 2002-03 or as a ratio<br />
of GSDP the decline was from 4.1 per cent to 3.3<br />
per cent. Thus, as compared to 1990-91, both SAR<br />
and SPR in 2002-03 were lower. This shows that<br />
the expenditures on sectors that are considered to<br />
have high social priority were crowded out by the<br />
pressure of increasing expenditure on salaries, debt<br />
servicing and other implicit and explicit subsidies in<br />
the wake of stagnant revenues.<br />
The UN <strong>Human</strong> <strong>Development</strong> <strong>Report</strong> (HDR) 1991<br />
suggests that PER for a country should be around<br />
25 per cent, SAR should be about 40 per cent and<br />
SPR about 50 per cent. The human expenditure<br />
ratio (HER) should be about 5 per cent. However,<br />
data reveal that PER in <strong>Karnataka</strong> has been less<br />
than the suggested norm of 25 per cent over the<br />
entire decade. SAR, even with the inclusion of<br />
rural development, has seen a steady decline<br />
throughout the 1990s. At the beginning of the<br />
decade, the SAR, at 41 per cent, was just above<br />
the norm, but during the decade, it fell to almost<br />
41
Financing <strong>Human</strong> <strong>Development</strong><br />
FIGURE 3.1.4<br />
Trends in human development expenditure<br />
Public Expenditure Ratio<br />
Social Allocation Ratio<br />
22<br />
42<br />
20<br />
40<br />
18<br />
38<br />
16<br />
36<br />
14<br />
34<br />
12<br />
32<br />
10<br />
30<br />
Percentage<br />
1990-91<br />
1991-92<br />
1992-93<br />
1993-94<br />
1994-95<br />
1995-96<br />
1996-97<br />
1997-98<br />
Social Priority Ratio<br />
1998-99<br />
1999-2000<br />
2000-01<br />
2001-02<br />
2002-03<br />
1990-91<br />
1991-92<br />
1992-93<br />
1993-94<br />
1994-95<br />
1995-96<br />
1996-97<br />
1997-98<br />
1998-99<br />
<strong>Human</strong> Expenditure Ratio<br />
1999-2000<br />
2000-01<br />
2001-02<br />
2002-03<br />
60<br />
4.2<br />
4.0<br />
55<br />
3.8<br />
3.6<br />
50<br />
3.4<br />
3.2<br />
45<br />
3.0<br />
1990-91<br />
1991-92<br />
1992-93<br />
1993-94<br />
1994-95<br />
1995-96<br />
1996-97<br />
1997-98<br />
1998-99<br />
1999-2000<br />
2000-01<br />
2001-02<br />
2002-03<br />
Years<br />
1990-91<br />
1991-92<br />
1992-93<br />
1993-94<br />
1994-95<br />
1995-96<br />
1996-97<br />
1997-98<br />
1998-99<br />
1999-2000<br />
2000-01<br />
2001-02<br />
2002-03<br />
34 per cent in 2002-03, which is well below the<br />
suggested norm of 40 per cent. Similarly, in the<br />
calculation of SPR, due to the inclusion of more<br />
heads of expenditure than those used by UNDP,<br />
the ratio is somewhat infl ated. Even with this,<br />
SPR was just around the norm of 50 per cent in<br />
2002-03. Finally, the HER was not only lower<br />
than the suggested norm of 5 per cent in all the<br />
years, but has been steadily diverging from the<br />
norm with the decline in ratios.<br />
A comparison of the PER, SAR and SPR for<br />
different states shows that while the relative<br />
ranking of <strong>Karnataka</strong> in terms of PER has<br />
improved in the 1990s, there has been a fall in<br />
its rank in terms of SAR (Table 3.1.5). In terms<br />
of SPR and HER however, although the ratios are<br />
lower in 2001-02 than in 1990-91, the relative<br />
ranking of <strong>Karnataka</strong> has not changed much over<br />
the decade.<br />
Interestingly, the ranking of Bihar and Orissa in<br />
terms of PER and HER is very high relative to<br />
their human development indicators, which are<br />
low. Calculations of PER and HER by Prabhu<br />
(1999) showed that in the period 1991-94, Bihar<br />
and Orissa ranked fi rst and third respectively in<br />
both PER and HER among the 15 major states of<br />
India. The reason for the low HDI ranking of these<br />
states despite a high PER (as well as HER) is due<br />
to their low per capita GSDP levels. In terms of<br />
per capita public expenditure, their ranking is low.<br />
As shown in Table 3.1.7, in terms of the per capita<br />
public expenditure, social sector expenditure<br />
and human priority expenditure in different<br />
states, Bihar ranked 14th (last) and Orissa 11th<br />
among the 14 major states of India in 2001-02.<br />
Ultimately, it is human development spending per<br />
capita in absolute terms that is more important<br />
than the human expenditure ratio. <strong>Karnataka</strong><br />
has a higher per capita public expenditure/GSDP<br />
42
<strong>Karnataka</strong> <strong>Human</strong> <strong>Development</strong> <strong>Report</strong> <strong>2005</strong><br />
TABLE 3.1.5<br />
<strong>Human</strong> development expenditure in major Indian states: 1990-91 and 2001-02<br />
States PER SAR SPR HER<br />
1990-91 2001-02 1990-91 2001-02 1990-91 2001-02 1990-91 2001-02<br />
Andhra Pradesh 17.83 (6) 18.86 (7) 43.12 (6) 36.43 (7) 48.88 (10) 54.14 (7) 3.76 (9) 3.72 (6)<br />
Bihar 20.97 (2) 24.47 (2) 43.79 (5) 35.47 (9) 66.35 (1) 69.12 (1) 6.09 (1) 6.00 (1)<br />
Gujarat 17.52 (8) 17.69 (8) 37.01 (11) 39.80 (2) 56.36 (6) 35.46 (14) 3.66 (10) 2.50 (13)<br />
Haryana 15.63 (12) 17.17 (10) 32.75 (13) 29.55 (13) 44.73 (13) 49.38 (11) 2.29 (13) 2.51 (12)<br />
<strong>Karnataka</strong> 17.78 (7) 20.06 (3) 41.22 (8) 34.96 (10) 55.45 (7) 52.29 (8) 4.06 (7) 3.67 (7)<br />
Kerala 19.42 (3) 16.18 (12) 45.57 (3) 39.33 (4) 54.86 (8) 50.88 (10) 4.86 (5) 3.24 (8)<br />
Madhya Pradesh 15.64 (11) 17.66 (9) 43.03 (7) 39.49 (3) 59.02 (4) 55.76 (4) 3.97 (8) 3.89 (5)<br />
Maharashtra 15.51 (13) 15.43 (14) 33.27 (12) 36.46 (6) 47.19 (12) 54.42 (6) 2.43 (12) 3.06 (10)<br />
Orissa 24.46 (1) 25.45 (1) 39.12 (10) 34.96 (11) 54.28 (9) 55.59 (5) 5.19 (2) 4.94 (3)<br />
Punjab 17.49 (10) 19.63 (5) 29.07 (14) 23.25 (14) 39.52 (14) 38.27 (13) 2.01 (14) 1.75 (14)<br />
Rajasthan 17.52 (9) 19.95 (4) 44.25 (4) 42.73 (1) 63.60 (3) 61.58 (3) 4.93 (3) 5.25 (2)<br />
Tamil Nadu 17.88 (5) 15.85 (13) 46.88 (2) 38.19 (5) 58.68 (5) 52.14 (9) 4.92 (4) 3.16 (9)<br />
Uttar Pradesh 18.61 (4) 18.97 (6) 39.82 (9) 31.97 (12) 65.13 (2) 65.09 (2) 4.83 (6) 3.95 (4)<br />
West Bengal 15.30 (14) 16.83 (11) 47.94 (1) 35.72 (8) 47.86 (11) 44.24 (12) 3.51 (11) 2.66 (11)<br />
Notes:<br />
1. Figures in brackets indicate the rank of the state with respect to the indicators.<br />
2. Expenditure under different heads has been estimated as the sum of revenue expenditure and capital expenditure (including loans and advances net of repayments).<br />
(Per cent)<br />
ratio than Bihar or Orissa. Hence, any analysis<br />
of public spending on human development<br />
must go beyond the four ratios and factor in<br />
per capita public expenditure as well. Although,<br />
in <strong>Karnataka</strong>, absolute expenditure on social<br />
sector and human priority areas as a proportion<br />
of both GSDP and total public expenditure has<br />
declined, there has been an increase in per capita<br />
public expenditure at constant prices over the<br />
1990s level (Table 3.1.6). In fact, <strong>Karnataka</strong><br />
has had one of the highest growth rates of per<br />
capita public expenditures in the 1990s. Between<br />
1990-91 and 2001-02, <strong>Karnataka</strong> registered<br />
the highest percentage increase in per capita<br />
public expenditure among the 14 major states<br />
(Table 3.1.7). As a result, the state has moved<br />
up to the fourth place in 2001-02 from the ninth<br />
place in 1990-91 in terms of per capita public<br />
expenditure. Similarly, the percentage increase<br />
in per capita social sector expenditure and per<br />
capita human priority expenditure in <strong>Karnataka</strong><br />
was next only to that of Gujarat and Maharashtra<br />
in the 1990s. Thus, <strong>Karnataka</strong>’s rank improved<br />
over the decade, both in terms of per capita social<br />
Year<br />
TABLE 3.1.6<br />
Per capita real expenditure on human development in <strong>Karnataka</strong><br />
(Rupees)<br />
Per capita public<br />
expenditure<br />
Per capita social<br />
sector expenditure<br />
Per capita social<br />
priority expenditure<br />
1990-91 1313 541 300<br />
1991-92 1435 577 310<br />
1992-93 1580 581 305<br />
1993-94 1606 634 343<br />
1994-95 1598 626 337<br />
1995-96 1677 631 328<br />
1996-97 1794 662 338<br />
1997-98 1783 685 356<br />
1998-99 1935 764 402<br />
1999-2000 2229 842 462<br />
2000-01 2437 923 488<br />
2001-02 2613 914 478<br />
2002-03 2520 866 439<br />
Note: Expenditure under different heads has been estimated as the sum of revenue expenditure and capital expenditure<br />
(including loans and advances net of repayments).<br />
Source: Finance Accounts of <strong>Karnataka</strong>, Accountant General, Government of India.<br />
43
Financing <strong>Human</strong> <strong>Development</strong><br />
sector expenditure and per capita human priority<br />
expenditure (Table 3.1.7).<br />
Composition of expenditure on social<br />
sectors<br />
Between 1990-91 and 2002-03, social sector<br />
spending declined from 6.3 per cent of GSDP<br />
to six per cent of GSDP (Table 3.1.8). The<br />
disaggregated analysis of expenditure, particularly<br />
in human priority areas, shows that this was<br />
caused mainly by the decline in the spending on<br />
public health, nutrition and rural development<br />
(Table 3.1.8 and Figure 3.1.5). It is important to<br />
note that a substantial part of the expenditure on<br />
rural development is not routed through the state<br />
budget (funds devolve directly to District Rural<br />
TABLE 3.1.7<br />
Real per capita public expenditure, social sector expenditure and human priority expenditure –<br />
14 major states: 1990-91 and 2001-02<br />
(Rupees)<br />
States Per capita public expenditure Per capita social sector expenditure Per capita human priority expenditure<br />
1990-91 2001-02 % change 1990-91 2001-02 % change 1990-91 2001-02 % change<br />
Andhra Pradesh 1361 (7) 2198 (7) 61.50 587 (6) 801 (7) 36.46 287 (8) 434 (5) 51.22<br />
Bihar 1026 (13) 915 (14) -10.82 449 (13) 325 (14) -27.62 298 (6) 224 (14) -24.83<br />
Gujarat 1775 (3) 3048 (2) 71.72 657 (4) 1213 (1) 84.63 370 (3) 430 (6) 16.22<br />
Haryana 1962 (2) 2814 (3) 43.43 642 (5) 832 (6) 29.60 287 (7) 411 (7) 42.86<br />
<strong>Karnataka</strong> 1313 (9) 2574 (4) 96.04 541 (9) 900 (4) 66.36 300 (5) 471 (4) 57.00<br />
Kerala 1481 (6) 1996 (9) 34.77 675 (2) 785 (8) 16.30 370 (2) 400 (8) 8.11<br />
Madhya Pradesh 1111 (11) 1590 (12) 43.11 478 (11) 628 (11) 31.38 282 (10) 350 (9) 24.11<br />
Maharashtra 1758 (4) 2572 (5) 46.30 585 (7) 938 (2) 60.34 276 (11) 510 (2) 84.78<br />
Orissa 1206 (10) 1791 (11) 48.51 472 (12) 626 (12) 32.63 256 (13) 348 (10) 35.94<br />
Punjab 2278 (1) 3246 (1) 42.49 662 (3) 755 (9) 14.05 262 (12) 289 (12) 10.31<br />
Rajasthan 1315 (8) 1997 (8) 51.86 582 (8) 853 (5) 46.56 370 (4) 525 (1) 41.89<br />
Tamil Nadu 1561 (5) 2364 (6) 51.44 732 (1) 903 (3) 23.36 429 (1) 471 (3) 9.79<br />
Uttar Pradesh 1098 (12) 1295 (13) 17.94 437 (14) 414 (13) -5.26 285 (9) 269 (13) -5.61<br />
West Bengal 1011 (14) 1922 (10) 90.11 484 (10) 687 (10) 41.94 232 (14) 304 (11) 31.03<br />
Notes:<br />
1. Figures in brackets indicate the rank of the state with respect to that indicator.<br />
2. Differences in the fi gures on <strong>Karnataka</strong> between Table 3.1.6 and 3.1.7 for the year 2001-02 are on account of use of differences in provisional population fi gures.<br />
FIGURE 3.1.5<br />
Composition of expenditure in the social sector: 1990-91 and 2002-03<br />
70<br />
60<br />
50<br />
48 50 13 12<br />
3 2<br />
5 7<br />
40<br />
Per cent<br />
30<br />
20<br />
10<br />
0<br />
4<br />
1<br />
2<br />
5<br />
16<br />
8<br />
9<br />
15<br />
General<br />
Education<br />
Medical and<br />
Public Health<br />
Family<br />
Welfare<br />
Water Supply<br />
and Sanitation<br />
Nutrition<br />
Housing<br />
Rural<br />
<strong>Development</strong><br />
Others<br />
1990-91 2002-03<br />
44
<strong>Karnataka</strong> <strong>Human</strong> <strong>Development</strong> <strong>Report</strong> <strong>2005</strong><br />
<strong>Development</strong> Agencies [DRDAs]) by the Centre on<br />
Centrally Sponsored and Central Sector Schemes.<br />
To account for this, expenditure by the Centre on<br />
rural development schemes has been added to the<br />
actual expenditure incurred by the state on rural<br />
development. Even after making an adjustment<br />
to include Central transfers, the rural development<br />
expenditure as a ratio of GSDP has declined from<br />
almost 1.8 per cent in 1993-94 to about 1.0<br />
per cent in 2002-03 (Figure 3.1.6). Water supply<br />
and sanitation and housing are two areas in which<br />
there has been some increase in expenditure,<br />
which is a welcome trend.<br />
Options for financing human<br />
development<br />
In order to achieve the targets set for the Tenth<br />
Plan and to reach the MDGs, the state government<br />
must make signifi cantly higher investments and<br />
enhance their productivity by improving delivery<br />
systems. To achieve the Tenth Plan target, the head<br />
count measure of poverty should be reduced by fi ve<br />
percentage points. In the districts of Raichur, Kolar,<br />
Bijapur, Gulbarga and Dharwad, where almost 53<br />
per cent of the poor in the state live, the effort will<br />
TABLE 3.1.8<br />
Expenditure under different heads of social sectors as a proportion<br />
of GSDP: <strong>Karnataka</strong><br />
(Per cent)<br />
Social Sector 1990-91 1998-99 2002-03<br />
Social services 6.32 6.00 6.01<br />
General education 3.03 2.78 2.99<br />
Elementary education 1.63 1.48 1.58<br />
Secondary education 0.89 0.89 0.93<br />
University and higher education 0.45 0.35 0.42<br />
Adult education 0.04 0.01 0.005<br />
Health and family welfare 1.00 0.93 0.88<br />
Urban health services 0.31 0.38 0.32<br />
Rural health services 0.01 0.01 0.02<br />
Medical education, training and research 0.09 0.10 0.11<br />
Public health 0.07 0.05 0.04<br />
Family welfare 0.17 0.13 0.15<br />
Water supply, sanitation 0.31 0.58 0.42<br />
Nutrition 0.28 0.09 0.08<br />
Housing 0.15 0.21 0.28<br />
Rural development 1.01 0.45 0.46<br />
Sources:<br />
1. Expenditure of <strong>Karnataka</strong>: Finance Accounts of the state government, various years.<br />
2. Actual expenditure by the Central Government on Central Sector and Centrally Sponsored Schemes, Rural <strong>Development</strong><br />
and Panchayat Raj Department, <strong>Karnataka</strong>.<br />
FIGURE 3.1.6<br />
Rural development expenditure including Central transfers in <strong>Karnataka</strong><br />
2.0<br />
1.8<br />
1.6<br />
Per cent of GSDP<br />
1.4<br />
1.2<br />
1.0<br />
0.8<br />
0.6<br />
0.4<br />
0.2<br />
0<br />
1992-93<br />
1993-94<br />
1994-95<br />
1995-96<br />
1996-97<br />
Years<br />
1997-98<br />
1998-99<br />
1999-2000<br />
2000-01<br />
2001-02<br />
2002-03<br />
State Expenditure<br />
Centre Expenditure<br />
Sources:<br />
1. Expenditure of <strong>Karnataka</strong>: Finance Accounts of the state government, various years.<br />
2. Actual Expenditure by the Central Government on Central Sector and Centrally Sponsored Schemes, Rural <strong>Development</strong> and Panchayat<br />
Raj Department, <strong>Karnataka</strong>.<br />
45
Financing <strong>Human</strong> <strong>Development</strong><br />
The state government<br />
would have to incur<br />
additional expenditure to<br />
the extent of at least 2.5<br />
per cent of GSDP in order<br />
to be able to achieve the<br />
Tenth Plan targets.<br />
have to be redoubled. In the case of education,<br />
although there has been a sharp decline in the<br />
percentage of out-of-school children in recent<br />
years, according to the NSSO, almost 25 per cent<br />
of the children in the age group of 6-14 did not<br />
attend school in 1999-2000. It is also likely that<br />
<strong>Karnataka</strong> might not be able to achieve the Tenth<br />
Plan literacy rate target. This issue is particularly<br />
problematic as there is a considerable gender<br />
gap, as well as gaps in the achievements of the<br />
Scheduled Castes, Scheduled Tribes and backward<br />
classes. Similarly, the state continues to have a<br />
high infant mortality rate (IMR) compared to<br />
Kerala and Tamil Nadu, and reaching the targeted<br />
IMR of 25 per thousand will mean signifi cantly<br />
higher allocation of resources for the health and<br />
family welfare sector.<br />
It is diffi cult to form any kind of a scientifi c estimate<br />
of the additional investments required to reach<br />
the Tenth Plan targets in human development. In<br />
part, in many cases, the existing infrastructure by<br />
itself will help to improve the human development<br />
indicators. It is estimated that universalisation<br />
of elementary education itself requires that the<br />
elementary education expenditure as a proportion<br />
of GSDP be increased from the present level of<br />
1.6 per cent to 2.5 per cent. Similarly, fi nancial<br />
resources for anti-poverty interventions would<br />
have to be doubled from the present level of 0.5<br />
per cent of GSDP to reach the Tenth Plan targets.<br />
On the health and family welfare front, at present<br />
only about 0.9 per cent of GSDP is spent on<br />
this sector and this needs to be increased to 1.5<br />
per cent of GSDP at the very least. In addition to<br />
these, it may also be necessary to increase outlay<br />
on items such as water supply and sanitation,<br />
nutrition and housing by about 0.5 per cent of<br />
GSDP. Thus, the state government would have to<br />
incur additional expenditure to the extent of at<br />
least 2.5 per cent of GSDP in order to be able to<br />
achieve the Tenth Plan targets.<br />
At the same time, the prospect for additional<br />
resource mobilisation in the state is somewhat<br />
restricted. The three-year average tax-GSDP ratio<br />
for the period 1999-2002 at about 8.2 per cent<br />
of GSDP in <strong>Karnataka</strong> is quite high - next only to<br />
that of Tamil Nadu (8.6) among the states in the<br />
country (Government of India, <strong>2005</strong>). Similarly,<br />
under the Twelfth Finance Commission award, the<br />
tax devolution to the state at 4.459 per cent of the<br />
total will be lower than that under the Eleventh<br />
Finance Commission’s award (4.930 per cent).<br />
However, <strong>Karnataka</strong> is likely to get Rs.4,054 crore<br />
for the period of fi ve years or Rs.811 crore per year<br />
on an average as grants for the maintenance of<br />
roads, buildings, forests, heritage conservation, state<br />
specifi c needs, local bodies and calamity relief. Of<br />
this, excepting the last two items (about Rs.1,700<br />
crore for fi ve years), all items are additional.<br />
However, this gain from grants is only likely to offset<br />
the loss on account of lower tax devolution, and no<br />
additional resources are likely to be available.<br />
On the plan side, however, there may be some<br />
increase in the outlay on the social sectors by<br />
way of Central assistance, which will increase the<br />
outlay on human development, though it is diffi cult<br />
to quantify the extent. In any case, the increased<br />
outlay to these programmes is likely to be about 0.5<br />
per cent of GSDP on the grounds that <strong>Karnataka</strong> is<br />
an economically developed state. Such a view does<br />
not take into account the regional disparities that<br />
have resulted in the concentration of deprivation in<br />
certain regions, with adverse implications for the<br />
quantum of Central grants that <strong>Karnataka</strong> receives.<br />
Thus, the state will have to provide for an additional<br />
2 per cent of GSDP for human development, either<br />
by raising its own revenues or by compressing<br />
expenditures in other, non-productive sectors.<br />
As already mentioned earlier, the tax-GSDP ratio<br />
in the state is reasonably high and it has shown<br />
high buoyancy in recent years. However, the<br />
long-term gains in both, revenue and economic<br />
activity, can come about only when there is a<br />
reasonable and stable tax environment. The<br />
decision to replace the existing cascading type<br />
sales tax with value added tax (VAT) in the state<br />
from April 1, <strong>2005</strong> is likely to create a more stable<br />
and predictable consumption tax environment. The<br />
self-enforcing nature of the levy will hopefully bring<br />
in gains in revenue productivity in the medium<br />
and long term, making it possible to generate<br />
additional revenue. Even in the short term, the<br />
Central Government has agreed to compensate<br />
the states for any loss on revenue – 100 per cent<br />
46
<strong>Karnataka</strong> <strong>Human</strong> <strong>Development</strong> <strong>Report</strong> <strong>2005</strong><br />
of the estimated loss in the fi rst year, 75 per cent<br />
of the loss in the second year and 50 per cent<br />
of the loss in the third year. The shortfall will be<br />
determined by applying the average growth rate<br />
of sales tax revenue in the best three of the last<br />
fi ve years on the actual collections in 2004-05.<br />
Since <strong>Karnataka</strong> has experienced an impressive<br />
growth of revenue from sales tax in recent years,<br />
the revenue-GSDP ratio from tax could increase,<br />
even in the short run.<br />
Although a reasonable degree of stability in the<br />
tax system is necessary for the economic agents<br />
to take decisions, it must be noted that tax reform<br />
is a continuous process, particularly when the<br />
economy is in transition from plan to market.<br />
The reforms of the tax system in urban and rural<br />
local bodies in the area of property tax should<br />
substantially improve the revenue productivity,<br />
strengthen the decentralisation process and<br />
increase the fi scal independence of the local<br />
bodies. The continued buoyancy in stamps and<br />
registration and state excise duties can also<br />
help to increase the tax-GSDP ratio in the state.<br />
In addition to these, the swapping of the ‘high<br />
cost-small savings’ loans with newly contracted<br />
market loans and the rescheduling of the loans<br />
at a lower cost under the Finance Commission<br />
award would also provide some fi scal space to the<br />
state for allocating more funds for social sector<br />
expenditures. The improvement in revenues and<br />
the reduced interest outgo may help the state in<br />
reducing the revenue defi cit, and thus, avail the<br />
performance-based debt write-off recommended<br />
by the Finance Commission. Though the amount<br />
involved in this incentive scheme is not signifi cant,<br />
this could provide some cushion to the state<br />
government.<br />
The improvement in the resources indicated<br />
above, while extremely useful and important, may<br />
not be adequate to meet the required resources<br />
to achieve the Tenth Plan targets. Therefore, it is<br />
also necessary to undertake measures to improve<br />
non-tax revenues and identify and phase out<br />
unproductive expenditures. There is considerable<br />
scope for raising revenues from sectors such as<br />
irrigation, power and transport through reforms<br />
and improving effi ciency and productivity.<br />
The state has embarked on a series of power<br />
reforms, viz. a three-year metering programme<br />
for over 60 lakh unmetered connections;<br />
unbundling distribution from transmission by<br />
forming fi ve distribution companies on a regional<br />
basis as a fi rst step towards privatisation, passed<br />
the anti-theft law to curb theft of power and<br />
pilferage of electricity, with stringent penal<br />
provisions and strengthened the Vigilance wing<br />
of KPTCL/ESCOMS to book cases. Power reform<br />
is a signifi cant feature of the Medium Term<br />
Fiscal Plans prepared by the state government.<br />
The key to bringing down the state’s fi scal<br />
defi cit lies in reducing power subsidy, reducing<br />
T & D (transmission and distribution) losses<br />
considerably, from the present estimated level<br />
of 30.7 per cent, and billing 100 per cent<br />
installations compared to about 40 per cent at<br />
present. The gap between the cost of supplying<br />
electricity and the charges, which is currently<br />
around 70 paise, needs to be considerably<br />
bridged. The level of recovery needs to be further<br />
improved from the existing level of 80 per cent.<br />
Reduction of subsidies to the farm sector is a<br />
sensitive issue, but there is ample scope for<br />
other kinds of effi ciency reforms in the sector<br />
if additional resources are to be generated for<br />
human development.<br />
Irrigation is another area where investment is<br />
necessary to promote economic growth, but<br />
the utilisation of funds here would benefit<br />
from a more judicious and efficient deployment<br />
of limited resources. Despite substantial<br />
investments on irrigation, the return in terms<br />
of revenue from landowners by way of water<br />
rate is meagre and does not cover even the<br />
O & M (operational and maintenance) costs.<br />
Many irrigation projects are characterised by<br />
time and cost overruns. In some cases, irrigation<br />
projects exceed the estimated cost because<br />
resources are thinly spread over too many<br />
projects or because of administrative delays<br />
caused by land acquisition and rehabilitation<br />
issues, which were not anticipated in time.<br />
Removal or reduction of subsidies in irrigation<br />
and power are sensitive policy issues which would<br />
require consultation with stakeholders, who are<br />
Power reform is a<br />
significant feature of<br />
the Medium Term Fiscal<br />
Plans prepared by the<br />
state government. The<br />
key to bringing down the<br />
state’s fiscal deficit lies in<br />
reducing power<br />
subsidy, reducing<br />
T & D (transmission<br />
and distribution) losses<br />
considerably, from the<br />
present estimated level of<br />
30.7 per cent, and billing<br />
100 per cent installations<br />
compared to about<br />
40 per cent at present.<br />
47
Financing <strong>Human</strong> <strong>Development</strong><br />
Expenditure allocation to<br />
districts is determined<br />
historically, rather than<br />
on the basis of ground<br />
level requirements.<br />
likely to agree to changes in the subsidy pattern if<br />
there is a corresponding improvement in human<br />
development indicators in their villages.<br />
Conclusions<br />
Despite the recent acceleration in economic<br />
growth in <strong>Karnataka</strong>, the performance of<br />
human development in the state is just about<br />
average, and, in fact, below the achievement<br />
levels in some of the neighbouring states.<br />
The human development indicators in the<br />
northeastern districts of the state are very low.<br />
Considerable effort is required to achieve the<br />
targets set for the Tenth Plan and the MDGs.<br />
The problem is particularly challenging in<br />
respect of improving the human development<br />
indicators in the relatively backward districts of<br />
<strong>Karnataka</strong>. Improving the welfare of the people<br />
in the state requires considerable augmentation<br />
of investment, in both physical and human<br />
capital.<br />
The analysis of human development spending<br />
in <strong>Karnataka</strong> shows that over the decade of the<br />
1990s, there has been deterioration in the SAR,<br />
SPR and HER. This declining trend in these ratios<br />
presents the nature and magnitude of challenges<br />
in achieving the MDGs and the targets set for<br />
the Tenth Plan. The declining trend in the share<br />
of expenditure for rural development, nutrition<br />
and, to an extent, family welfare, in particular, is a<br />
matter of concern.<br />
The analysis of human development expenditure<br />
incurred by the rural local governments<br />
in <strong>Karnataka</strong>, in particular with respect to<br />
education and health sectors, shows that the<br />
expenditure allocation to districts is determined<br />
historically, rather than on the basis of ground<br />
level requirements. In fact, there are some<br />
design and implementation problems with<br />
the decentralisation process in the state. The<br />
scheme-wise transfer of functions, functionaries<br />
and fi nances had resulted in lack of autonomy,<br />
fl exibility and accountability of the employees<br />
to the rural local governments. This had also<br />
resulted in segmentation of expenditures. The<br />
analysis of decentralisation of expenditures<br />
shows that the local governments do not have<br />
access to adequate resources for spending; nor<br />
do they have enough fl exibility to spend on items<br />
of their choice, in the way they want to. In short,<br />
decentralisation has yet to improve the delivery<br />
systems. Recent steps to rationalise schemes<br />
and devolve more functions to Panchayat Raj<br />
Institutions (PRIs) are designed to address these<br />
issues and should impact service delivery.<br />
Where does <strong>Karnataka</strong> stand in terms of<br />
achieving the Tenth Plan and MDGs? The major<br />
challenge appears to be in the reduction of<br />
poverty in rural areas. The declining expenditure<br />
on rural development may pose a setback to the<br />
achievement of the goal of poverty reduction<br />
in the rural areas. In addition, one of the major<br />
goals in health, i.e. the reduction in the infant<br />
mortality rate, particularly in rural areas, will be<br />
achieved only if the decline continues to occur at<br />
the past rate. The declining trend in expenditure<br />
on nutrition and poverty alleviation schemes will<br />
have to be arrested to maintain the past rate<br />
of growth. In terms of school attendance, while<br />
there has been a large improvement in the recent<br />
past, further improvements will need substantial<br />
investments, more specifi cally, for improving the<br />
quality of education. The projected expenditure<br />
on elementary education by the ‘Departmental<br />
Medium Term Fiscal Plan’ is much lower<br />
than the required amount suggested by various<br />
studies.<br />
Ensuring adequate allocation to human<br />
development expenditures is seriously constrained<br />
by the fi scal health of the state. Additional<br />
allocation to social sectors in <strong>Karnataka</strong> will<br />
have to come by increasing the stagnant<br />
revenue-GSDP ratio, improving the power sector<br />
fi nances, levying appropriate user charges on<br />
irrigation, ensuring greater effi ciencies in power<br />
and irrigation, rationalising grants and fees for<br />
higher educational institutions and containing<br />
unproductive administrative expenditures. It is<br />
also necessary to target expenditure on backward<br />
regions and districts and improve the delivery<br />
systems to enhance productivity of expenditure.<br />
The debt swap scheme introduced recently would<br />
provide some fi scal space to the state government<br />
to enhance spending on human development in<br />
48
<strong>Karnataka</strong> <strong>Human</strong> <strong>Development</strong> <strong>Report</strong> <strong>2005</strong><br />
the next few years. Similarly, the introduction of<br />
VAT could enhance the revenue productivity of the<br />
tax system in the medium and long term.<br />
The chapter has put forward suggestions as to<br />
how the additional resources needed to achieve<br />
human development targets set for the Tenth<br />
Plan and the MDGs can be garnered. It has also<br />
explored the fi scal space available to the state. It<br />
is estimated that in order to achieve the targets<br />
set for the Tenth Plan, the state government<br />
will have to make an additional allocation of<br />
about two per cent of GSDP. However, resource<br />
availability of this magnitude is uncertain. A<br />
major initiative in tax reform envisaged is the<br />
introduction of VAT from April 1, <strong>2005</strong>. The tax<br />
reform initiatives taken by the governments in<br />
recent times have been unstable, sometimes<br />
with contradictory signals given in successive<br />
years. Hopefully, the introduction of intra-state<br />
VAT with the promise of imposing a full–fl edged,<br />
destination-based VAT in the near future would<br />
provide a clear signal and incentives to economic<br />
agents. The proposed VAT, with its self-policing<br />
nature, is also supposed to improve the revenue<br />
productivity signifi cantly. However, it is important<br />
to ensure that the design of the VAT levied is<br />
appropriate, it is implemented properly and that<br />
the state develops the information system and<br />
the computerisation needed to implement the<br />
tax. In order to reach the targets set for the Tenth<br />
Plan and to achieve the MDGs, it is important<br />
to increase the allocation of public investment<br />
in social sectors, target the expenditures to<br />
lagging regions and increase their productivity<br />
by improving the delivery system. Towards this<br />
end, it is necessary to initiate both policy and<br />
institutional reforms. In the wake of a constrained<br />
fi scal environment, creating the necessary fi scal<br />
space for increased fi nancing of social sectors,<br />
changing the focus of interventions to backward<br />
regions and improving productivity in them are<br />
by no means easy tasks, but with determined<br />
effort, they are eminently feasible. The extent of<br />
success in achieving the targets will depend upon<br />
the ability of the state government in directing<br />
the policies and institutions on the lines detailed<br />
in this chapter.<br />
PART II<br />
Financing Education: A Case<br />
Study<br />
Trends and patterns in financing<br />
education – Intra-sectoral priorities<br />
The attainment of the goals and objectives of<br />
primary and secondary education and literacy<br />
is a prerequisite for the attainment of human<br />
development. This does not imply that higher<br />
education is not relevant in this context. In<br />
fact, higher education remains essential for<br />
economic growth, which sets the stage for human<br />
development. However, universal elementary<br />
education for children in the age group 6 to 14 is<br />
a Constitutional mandate, and therefore, a priority<br />
area for state investment.<br />
This case study will analyse trends in fi nancing<br />
education using the ratios discussed in Part I, i.e.<br />
the public expenditure ratio (PER) for education<br />
is equal to public education expenditure as a<br />
percentage of state income (i.e. Gross State<br />
Domestic Product at factor cost and current prices).<br />
The social allocation ratio (SAR) for education<br />
is equal to public education expenditure as a<br />
percentage of total public expenditure in the state.<br />
The study will examine the intra-sectoral priorities<br />
of the government in education, as manifested by<br />
its budgetary allocation (based on accounts data),<br />
and assess the extent to which the government is<br />
able to strike a fi scal balance between providing<br />
for salaries, infrastructure development and inputs<br />
directed to improving the quality of instruction. It<br />
will look at the outlays required to meet the MDGs<br />
and Tenth Plan goals and suggest how these<br />
resources can be raised.<br />
PER and SAR<br />
Table 3.2.1 presents the computed PER and SAR<br />
by types of education (i.e. general, technical,<br />
medical and agricultural education) in the state<br />
for select years from 1990-91 to 2002-03. 11 The<br />
ratios capture the efforts and priorities of public<br />
11<br />
Throughout the analysis, unless stated otherwise, all budget<br />
fi gures before 2003-04 refer to accounts/estimates. All fi gures<br />
for 2003-04 (2004-05) refer to Revised (Budget) estimates.<br />
49
Financing <strong>Human</strong> <strong>Development</strong><br />
Sl.<br />
No.<br />
TABLE 3.2.1<br />
Public expenditure ratio and social allocation ratio by type of<br />
education: 1990-91 to 2002-03<br />
Type/level of<br />
education<br />
Expenditure/<br />
Allocation<br />
Percentage share of total expenditure<br />
in state income<br />
1990-91 1994-95 1998-99 2002-03<br />
1 General education PER 3.03 2.87 2.78 2.99<br />
SAR 15.75 15.86 16.85 15.21<br />
1.1 Elementary education PER 1.62 1.50 1.48 1.58<br />
SAR 8.45 8.26 9.00 8.02<br />
1.2 Secondary education PER 0.88 0.89 0.89 0.93<br />
SAR 4.60 4.90 5.39 4.72<br />
1.3 University and higher PER 0.45 0.43 0.35 0.42<br />
education<br />
SAR 2.33 2.36 2.13 2.14<br />
2 Technical education PER 0.09 0.08 0.08 0.08<br />
SAR 0.46 0.46 0.47 0.39<br />
3 Medical education, PER 0.07 0.09 0.10 0.11<br />
training and research SAR 0.38 0.50 0.61 0.57<br />
4 Agricultural education PER 0.07 0.09 0.06 0.09<br />
and research<br />
SAR 0.38 0.49 0.38 0.47<br />
Total<br />
PER 3.26 3.14 3.02 3.27<br />
SAR 16.97 17.32 18.30 16.64<br />
Source: Computed using data from the Budget papers of Government of <strong>Karnataka</strong> state income data from Directorate<br />
of Economics and Statistics, <strong>Karnataka</strong>.<br />
expenditure for promotion and development<br />
of education in the state. 12 The PER and SAR<br />
have ranged from 3.26 and 16.97 per cent in<br />
1990-91 to 3.14 and 17.32 per cent respectively<br />
in 1994-95; from 3.02 per cent and 18.30<br />
per cent in 1998-99 to 3.27 per cent and 16.64<br />
per cent respectively in 2002-03.<br />
The PER (SAR) for general education has varied<br />
from 3.03 (15.75) per cent in 1990-91 to 2.87<br />
(15.86) per cent in 1994-95, and 2.78 (16.85)<br />
per cent in 1998-99 to 2.99 (15.21) per cent in<br />
2002-03. During the period from 1990-91 to<br />
2002-03, the PER for primary education ranged<br />
between 1.62 per cent and 1.48 per cent, and<br />
from 0.93 per cent to 0.88 per cent for secondary<br />
education. SAR ranged between 8.02 per cent and<br />
9.0 per cent (primary) and from 5.39 per cent to<br />
4.60 per cent (secondary). This indicates that the<br />
combined PER and SAR for primary and secondary<br />
education has remained stagnant at around 2.4<br />
per cent and 13.3 per cent respectively over these<br />
12 years. The share of primary and secondary<br />
education in both, state income and education<br />
budget has remained static, instead of increasing<br />
signifi cantly to meet rising needs.<br />
Thus, in terms of the PER and SAR, from<br />
1990-91 to 2002-03, the biggest chunk of<br />
public education expenditure went to: (i) general<br />
education among all types of education; (ii)<br />
primary and secondary education within general<br />
education; and (iii) general higher education<br />
among all types of higher education. This pattern<br />
refl ects the government’s priorities. The lack of<br />
increase in SAR and PER signifi es the absence<br />
of noticeable hikes in expenditure over the period.<br />
Social allocation ratio by types<br />
of education and by pattern of<br />
expenditure<br />
The share of the education sector in the total<br />
revenue expenditure and capital expenditure<br />
of the state has remained less than 21 and<br />
1 per cent respectively. The social allocation ratio<br />
(SAR) i.e. public education expenditure as a<br />
percentage of total public expenditure in the state,<br />
reveals the relative priorities of the government<br />
within the education sector. Table 3.2.2 presents<br />
the SAR by types of education and by revenue<br />
expenditure, capital expenditure, and total<br />
expenditure (inclusive of loans and advances). 13<br />
Expenditure in government is classifi ed as revenue<br />
expenditure, which includes salaries, maintenance<br />
and grants and capital expenditure, which, in turn,<br />
includes investment in infrastructure. 14 Within all<br />
12<br />
This justifi cation for PER for education is elaborated in Tilak<br />
(2003): ‘Share of education in gross national product is the<br />
most standard indicator of national efforts on the development<br />
of education in a given society. This refl ects the relative<br />
priority being accorded to education in the national economy.<br />
This indicator is also found to be superior to several other<br />
indicators’, (p. 9).<br />
13<br />
In case of primary and secondary (or high school) education,<br />
capital expenditure reported under plan expenditure of the<br />
ZP and TP programmes are accounted in revenue expenditure<br />
at the state level. Thus, capital expenditure for primary and<br />
secondary education is not reported in the Table 3.2.2.<br />
1 4<br />
Total revenue (capital) expenditure includes both plan and<br />
non-plan expenditure.<br />
50
<strong>Karnataka</strong> <strong>Human</strong> <strong>Development</strong> <strong>Report</strong> <strong>2005</strong><br />
Year<br />
TABLE 3.2.2<br />
Social allocation ratio by level of education and pattern of expenditure: 1990-91 to 2002-03<br />
Type of<br />
expenditure<br />
General Elementary Secondary University<br />
and higher<br />
Technical<br />
education<br />
Medical<br />
training<br />
and<br />
research<br />
Agricultural<br />
research<br />
Expenditure<br />
on<br />
education<br />
(Rs. lakh)<br />
Total<br />
expenditure<br />
1 2 3 4 5 6 7 8 9 10 11<br />
1990-91<br />
1994-95<br />
1998-99<br />
2002-03<br />
Revenue 75852.7 40758.3 22150.1 11182.9 2225.6 1772.0 1826.0 81676.3 397109.0<br />
% 92.9 49.9 27.1 13.7 2.7 2.2 2.2 20.6<br />
Capital 88.5 0.8 36.6 51.0 13.6 64.0 0.0 166.1 65481.0<br />
% 53.3 0.5 22.1 30.7 8.2 38.6 0.0 0.3<br />
Total 75959.1 40777.0 22186.7 11233.9 2239.0 1836.0 1826.0 81860.3 482364.0<br />
% 92.8 49.8 27.1 13.7 2.7 2.2 2.2 17.0<br />
Revenue 136899.5 71656.5 42176.9 20120.8 3822.2 4303.4 4216.2 149286.3 726452.0<br />
% 91.7 48.0 28.3 13.5 2.6 2.9 2.9 20.6<br />
Capital 656.4 NR 297.8 357.8 199.7 71.8 0.0 927.9 113681.0<br />
% 70.7 NR 32.1 38.6 21.5 7.7 0.0 0.8<br />
Total 137555.9 71656.5 42474.7 20478.6 4021.9 4375.2 4261.2 150214.2 867386.0<br />
% 91.6 48.0 28.3 13.6 2.7 2.9 2.9 17.3<br />
Revenue 243523.0 130378.8 77829.6 30646.3 6642.1 8254.2 5475.5 263876.9 1244561.0<br />
% 92.3 49.4 29.5 11.6 2.5 3.1 2.1 21.2<br />
Capital 470.9 NR 238.4 232.0 169.3 510.9 0.0 1151.1 174423.0<br />
% 40.9 NR 20.7 20.2 14.7 44.4 0.0 0.7<br />
Total 243993.9 130378.8 78068.0 30878.3 6811.4 8765.2 5457.5 265028.0 1448024.0<br />
% 92.1 49.4 29.5 11.7 2.6 3.3 2.1 18.3<br />
Revenue 339963.9 179578.0 105426.6 47676.8 8739.9 12643.9 10556.7 371904.3 1881450.0<br />
% 91.4 48.3 28.4 12.8 2.4 3.4 2.8 19.8<br />
Capital 344.6 NR 131.3 213.4 10.8 136.1 0.0 491.5 293600.0<br />
% 70.1 NR 26.7 43.4 2.8 27.7 0.0 0.2<br />
Total 340308.5 179578.0 105557.9 47890.2 8750.6 12780.0 10556.7 372395.8 2237807.0<br />
% 91.4 48.3 28.4 12.9 2.4 3.4 2.8 16.6<br />
Notes:<br />
1. All expenditure fi gures are at current prices.<br />
2. Revenue expenditure under primary and secondary includes capital expenditure of ZP and TP schemes. Hence, capital expenditure for primary and secondary education is not reported;<br />
3. Percentage fi gures in (a) column 3 to 9 are percentages to column 10 i.e. to total expenditure on education and (b) percentage in column 10 is proportion of education expenditure to total<br />
expenditure (column 11) in the state;<br />
4. Total expenditure for general education in 1990-91 is inclusive of Rs.17.88 lakh under loans and advances for primary education;<br />
5. NR: not reported.<br />
Source: Budget papers of Government of <strong>Karnataka</strong>.<br />
51
Financing <strong>Human</strong> <strong>Development</strong><br />
Within all categories<br />
of education, one finds<br />
that revenue expenditure<br />
dominates total<br />
expenditure and is as high<br />
as 99 per cent and above.<br />
The share of capital<br />
expenditure is negligible<br />
in the education sector.<br />
The share of primary<br />
education in the total<br />
revenue expenditure<br />
is about 50 per cent<br />
and that of secondary<br />
education is 27 per cent.<br />
categories of education, one fi nds that revenue<br />
expenditure dominates total expenditure and is<br />
as high as 99 per cent and above. The share of<br />
capital expenditure is negligible in the education<br />
sector.<br />
General education takes the lion’s share<br />
(92 per cent) of the total revenue expenditure<br />
on education. Most importantly, the share<br />
of primary education in the total revenue<br />
expenditure is about 50 per cent and that of<br />
secondary education is 27 per cent: the combined<br />
share of primary and secondary education in<br />
total education expenditure is, thus, about<br />
77 per cent, which is as it should be.<br />
Thus, expenditure within the education sector in<br />
<strong>Karnataka</strong> is characterised by the dominant role of:<br />
(i) revenue expenditure in all types of education;<br />
(ii) general education within the education sector;<br />
and (iii) primary and secondary education within<br />
the general education.<br />
Comparison with all-India and<br />
selected states<br />
A comparison of the ratios and patterns of<br />
expenditure at all-India level (all states and<br />
Central Government), and with other southern<br />
states (Andhra Pradesh, Kerala and Tamil Nadu)<br />
for three years [2000-01 (Actual/Accounts),<br />
2001-02 (Revised Estimates), and 2002-03<br />
(Budget Estimates)] reveals the following insights<br />
for <strong>Karnataka</strong> (Table 3.2.3):<br />
<strong>Karnataka</strong>’s PER (i.e. public education<br />
expenditure as a percentage of state income)<br />
on revenue expenditure was 3.41 per cent<br />
in 2000-01. This ratio was higher than that<br />
of Andhra Pradesh (2.86 per cent) and the<br />
Central Government (0.54 per cent), but<br />
lower than those of Kerala (4.11 per cent),<br />
Tamil Nadu (3.47 per cent) and the all states’<br />
average (4.36 per cent).<br />
<strong>Karnataka</strong>’s SAR (i.e. public education<br />
expenditure as a percentage of total public<br />
expenditure in the state) on revenue<br />
expenditure has declined since 2000-01;<br />
it fell from 21.34 per cent in 2000-01 to<br />
19.02 per cent in 2001-02 and to 18.96<br />
per cent in 2002-03. These fi gures, too, are<br />
<br />
higher than those of Andhra Pradesh and the<br />
Central Government, but lower than those of<br />
Kerala and Tamil Nadu.<br />
<strong>Karnataka</strong>’s SAR on capital expenditure was<br />
about 0.1 per cent from 2000-01 through<br />
2002-03. Kerala consistently recorded<br />
the highest SAR on capital account: 1.34<br />
per cent in 2000-01, 2.35 per cent in<br />
2001-02 and 2.92 per cent in 2002-03.<br />
These fi gures clearly imply that revenue expenditure<br />
(or expenditure on salaries and grants) dominates<br />
education expenditure in all states and in the<br />
country as a whole. The inadequacy of funds, (as<br />
low as 1 per cent), mainly impacts the non-salary<br />
component of education expenditure, which is<br />
used for inputs such as infrastructure (construction<br />
of classrooms, providing equipment, libraries,<br />
laboratories, drinking water and toilets), teachers’<br />
training, curriculum development and instructional<br />
material – all of which contribute to improving the<br />
quality of education in state schools.<br />
Total revenue expenditure in public education is<br />
distributed between plan and non-plan expenditure.<br />
A comparison of these expenditure patterns reveals<br />
that non-plan education expenditure is higher<br />
than plan expenditure on education in total plan<br />
expenditure, in all states and at the all-India level,<br />
in all the years. The non-plan expenditure of the<br />
Education Department as a percentage of total<br />
non-plan expenditure in <strong>Karnataka</strong> was 21.12<br />
per cent in 2000-01, 18.18 per cent in 2001-02<br />
and 18.22 per cent in 2002-03. These shares are<br />
lower than those of Kerala and Tamil Nadu, but<br />
higher than Andhra Pradesh, all states’ average<br />
(for 2000-01) and the Central Government (for<br />
all three years). Since plan expenditure is used for<br />
developmental activities and non-plan expenditure<br />
for maintenance of assets created during earlier<br />
Plan periods, the size of plan outlays is a true<br />
indicator of improvements, either in coverage or in<br />
quality, or both, in education (Table 3.2.3).<br />
The share of plan expenditure of the Education<br />
Department in <strong>Karnataka</strong>’s total expenditure is<br />
the highest among all southern states, all states’<br />
average as well as the Central Government.<br />
Important components of plan expenditure include<br />
52
<strong>Karnataka</strong> <strong>Human</strong> <strong>Development</strong> <strong>Report</strong> <strong>2005</strong><br />
Sl.<br />
No.<br />
TABLE 3.2.3<br />
Public expenditure ratio, social allocation ratio and patterns of expenditure in<br />
<strong>Karnataka</strong> and southern states: 2000-01 to 2002-03<br />
Indicator Year <strong>Karnataka</strong> Andhra<br />
Pradesh<br />
1 Education and training budget (revenue) to GSDP or<br />
GDP at factor cost and current prices<br />
(Per cent)<br />
Kerala Tamil All-India/ Central<br />
Nadu states Govt.,<br />
2000-01 3.41 2.86 4.11 3.47 4.36 0.54<br />
2 Education and training budget to total revenue budget 2000-01 21.34 17.39 24.17 22.5 24.57 3.67<br />
2001-02 19.02 17.63 24.67 22.83 21.97 3.55<br />
2002-03 18.96 17.71 23.68 20.8 21.14 3.82<br />
3 Capital expenditure on education to total capital 2000-01 0.12 0.03 1.34 0.52 0.68 0.0003<br />
expenditure outside Revenue Account<br />
2001-02 0.08 1.59 2.35 0.19 1.03 0.0003<br />
2002-03 0.13 0.14 2.92 0.04 0.78 0.0012<br />
4 Plan and non-plan revenue expenditure of Education Department in state’s total expenditure<br />
a. Plan expenditure 2000-01 13.92 1.39 5.82 5.63 11.74 9.49<br />
2001-02 12.83 3.71 5.59 7.52 11.3 9.01<br />
b. Non-plan expenditure 2000-01 21.12 18.17 24.59 21.86 19.6 1.36<br />
2001-02 18.18 16.75 24.52 21.46 19.89 1.03<br />
c. Total expenditure 2000-01 19.62 19.09 21.52 19.77 18.48 2.85<br />
2001-02 17.06 14.01 22.06 19.8 18.55 2.65<br />
2002-03 16.97 13.94 20.85 18.21 17.7 2.88<br />
5 Plan and non-plan revenue expenditure of education and other depts. in state’s expenditure<br />
a. Plan expenditure 2000-01 16.86 4.67 9.79 10.8 17.05 11.79<br />
2001-02 16.24 5.61 10.41 13.95 16.59 11.4<br />
2002-03 14.76 7.56 7.31 5.01 14.04 12.62<br />
b. Non-plan expenditure 2000-01 22.52 20.25 26.98 24.22 25.82 1.84<br />
2001-02 19.75 20.83 26.8 24.03 22.96 1.55<br />
2002-03 14.76 7.56 7.31 5.01 14.04 12.62<br />
c. Total expenditure 2000-01 21.34 17.39 24.17 22.5 24.57 3.67<br />
2001-02 19.02 17.63 24.67 22.83 21.97 3.55<br />
2002-03 18.96 17.71 23.68 20.8 21.14 3.82<br />
6 Plan revenue expenditure of Education Dept. in total 2000-01 14.8 1.69 4.42 3.65 9.02 61.19<br />
education expenditure<br />
(Total education expenditure=expenditure of Education 2001-02 15.72 5.57 3.3 4.52 9.5 69.02<br />
and other departments)<br />
2002-03 11.71 6.41 3.29 2.24 8.22 71.74<br />
7 Plan revenue expenditure within total education 2000-01 16.49 4.92 6.62 6.16 9.85 59.06<br />
expenditure<br />
2001-02 17.86 6.7 5.49 7.27 11.78 65.25<br />
2002-03 13.83 9.81 6.82 4.35 10.81 68.33<br />
Notes:<br />
1. Number of states obtaining all-India average for indicator 1 and 2 is 26 (excludes Chhattisgarh and Jharkhand). These 26 states are: Andhra Pradesh, Arunachal Pradesh, Assam, Bihar, Goa,<br />
Gujarat, Haryana, Himachal Pradesh, Jammu and Kashmir, <strong>Karnataka</strong>, Kerala, Madhya Pradesh, Maharashtra, Manipur, Meghalaya, Mizoram, Nagaland, Orissa, Punjab, Rajasthan, Sikkim,<br />
Tamil Nadu, Tripura, Uttar Pradesh, West Bengal and Delhi. For all other indicators, the number of states is 28, including Chhattisgarh and Jharkhand.<br />
2. Total education expenditure includes expenditure of education department and expenditure of other departments on Education.<br />
Source: Department of Secondary and Higher Education, Ministry of <strong>Human</strong> Resource <strong>Development</strong>, GoI, 2004.<br />
53
Financing <strong>Human</strong> <strong>Development</strong><br />
TABLE 3.2.4<br />
Pattern of allocation and annual growth of expenditure on general<br />
education: 1990-91 to 2002-03<br />
(Per cent)<br />
Year Revenue expenditure Capital expenditure<br />
Plan Non-plan Total Plan Non-plan Total<br />
1990-91<br />
Allocation 97.69 97.09 97.15 86.67 0.00 86.67<br />
Annual growth 64.62 6.95 11.00 -32.21 0.00 6.87<br />
1998-99<br />
Allocation 94.09 97.96 97.34 73.55 0.00 73.35<br />
Annual growth 27.62 16.80 18.33 -28.86 0.00 16.63<br />
2002-03<br />
Allocation 98.73 97.29 97.49 96.95 0.00 96.98<br />
Annual growth -32.54 10.49 1.29 52.02 0.00 10.53<br />
Note: Allocation as a percentage of total expenditure in the Education Department.<br />
Source: Computed by using the basic data of various issues of budget papers, GoK.<br />
TABLE 3.2.5<br />
Intra-sectoral allocation in general education: 1990-91 to 2002-03<br />
(Per cent)<br />
Year<br />
1990-91<br />
1998-99<br />
2002-03<br />
1990-91<br />
1998-99<br />
2002-03<br />
1990-91<br />
1998-99<br />
2002-03<br />
1990-91<br />
1998-99<br />
2002-03<br />
1990-91<br />
1998-99<br />
2002-03<br />
Allocation<br />
Revenue expenditure<br />
Capital expenditure<br />
Plan Non-plan Total Plan Non-plan Total<br />
Elementary education<br />
42.22<br />
65.82<br />
72.98<br />
31.77<br />
21.18<br />
14.6<br />
13.54<br />
4.45<br />
2.2<br />
11.42<br />
0.93<br />
0.32<br />
0.42<br />
7.26<br />
9.57<br />
55.07<br />
51.32<br />
49.48<br />
28.9<br />
33.9<br />
33.74<br />
53.73<br />
53.54<br />
52.82<br />
Secondary education<br />
29.20<br />
31.96<br />
31.01<br />
0.93<br />
0.00<br />
0.00<br />
41.42<br />
50.64<br />
38.09<br />
University and higher education<br />
14.88<br />
14.05<br />
15.98<br />
0.06<br />
0.13<br />
0.13<br />
0.67<br />
0.12<br />
0.19<br />
14.74<br />
12.58<br />
14.02<br />
Adult education<br />
1.24<br />
0.26<br />
0.16<br />
General education<br />
0.64<br />
1.21<br />
1.52<br />
57.65<br />
49.36<br />
61.91<br />
0.00<br />
0.00<br />
0.00<br />
0.00<br />
0.00<br />
0.00<br />
0.00<br />
0.00<br />
0.00<br />
0.00<br />
0.00<br />
0.00<br />
0.00<br />
0.00<br />
0.00<br />
0.00<br />
0.00<br />
0.00<br />
0.00<br />
0.00<br />
0.00<br />
0.93<br />
0.00<br />
0.00<br />
41.42<br />
50.64<br />
38.09<br />
57.65<br />
49.36<br />
61.91<br />
0.00<br />
0.00<br />
0.00<br />
0.00<br />
0.00<br />
0.00<br />
Language development<br />
1990-91 0.63 0.42 0.44 0.00 0.00 0.00<br />
1998-99 0.36 0.47 0.45 0.00 0.00 0.00<br />
2002-03 0.33 0.49 0.47 0.00 0.00 0.00<br />
Source: Computed using basic data from various issues of budget papers, GoK.<br />
construction of primary school buildings and<br />
classrooms, construction of toilets and provision<br />
of drinking water facility, supply of free text books<br />
and uniforms, and the midday meal programme.<br />
Thus, a major part of plan expenditure is directed<br />
at improvements in infrastructure and providing<br />
incentives for students to reduce dropout rate<br />
in government primary schools. Since plan<br />
expenditure represents new policy initiatives, this<br />
suggests that <strong>Karnataka</strong> has prioritised spending<br />
on education in recent years.<br />
Expenditure within the Education<br />
Department<br />
The total expenditure of the Education Department<br />
is the total expenditure on general and technical<br />
education (medical and agricultural education<br />
are not included in this sector). Expenditure on<br />
general education is divided among six major<br />
heads: primary/elementary education, secondary<br />
education, university and higher education,<br />
adult education, language development and<br />
general education. The patterns and annual growth<br />
of expenditure on these major heads are described<br />
below for select years from 1990-91 to 2002-03.<br />
It is apparent that, of the total expenditure in<br />
the Education Department, about 97 per cent of<br />
total revenue expenditure is allocated to general<br />
education (Table 3.2.4). Of the total plan revenue<br />
expenditure; the share of general education<br />
has varied from about 98 per cent in 1990-91<br />
to 94 per cent in 1998-99 and 99 per cent in<br />
2002-03. On the other hand, all capital<br />
expenditures incurred have been plan expenditures.<br />
Capital expenditure on general education varies<br />
from about 87 per cent in 1990-91 to 74 per cent<br />
in 1998-99 and 97 per cent in 2002-03.<br />
The annual growth (percentage) of expenditure<br />
on general education – both plan and non-plan<br />
– reveals that there are large variations in annual<br />
growth in plan expenditure in both revenue and<br />
capital accounts. For instance, the annual growth<br />
of revenue expenditure ranges from 64.62 per<br />
cent in 1990-91 to 27.62 per cent in 1998-99<br />
and -32.54 per cent in 2002-03. The annual<br />
growth of capital expenditure varies from -32.21<br />
per cent in 1990-91 to -28.86 per cent in 1998-<br />
54
<strong>Karnataka</strong> <strong>Human</strong> <strong>Development</strong> <strong>Report</strong> <strong>2005</strong><br />
99 to 52.02 per cent in 2002-03. This step up<br />
in 2002-03 is the result of specifi c policy<br />
interventions to improve infrastructure. On<br />
the other hand, variations in annual growth of<br />
non-plan revenue expenditure have been positive,<br />
if not incremental, throughout: 6.95 per cent in<br />
1990-91, 16.80 per cent in 1998-99 and 10.49<br />
per cent in 2002-03. However, the increase in<br />
total non-plan revenue over the years is primarily<br />
a result of accounting procedures, wherein<br />
expenditure incurred during the plan period<br />
moves into the non-plan category on the expiry<br />
of the plan period, along with some increases in<br />
maintenance amounts.<br />
Table 3.2.5 shows that, of the total revenue<br />
expenditure on general education, about 53<br />
per cent is spent on primary education, 31<br />
per cent on secondary education, 13 per cent<br />
on university and higher education, and the<br />
remaining 3 per cent is shared by adult education,<br />
language development and general education.<br />
The largest proportion of revenue expenditure<br />
(plan and non-plan) in general education has<br />
been divided between primary and secondary<br />
education for all the years. Capital expenditure in<br />
plan outlays, on the other hand, is shared between<br />
secondary (and PU) education and university and<br />
higher education. However, the relative share of<br />
secondary education varies over the years: 41.42<br />
per cent in 1990-91, 50.64 per cent in 1998-99<br />
and 38.09 per cent in 2002-03.<br />
The annual growth (percentage) of expenditure<br />
by 4 major heads of general education shows<br />
considerable variations in plan expenditure on both<br />
revenue and capital account, but positive growth on<br />
non-plan revenue expenditure (Table 3.2.6). Most<br />
importantly, a decline in annual growth of plan<br />
revenue expenditure is evident, except for adult<br />
education in 2002-03. However, non-plan revenue<br />
expenditure has increased in primary, secondary<br />
and university and higher education, as indicated<br />
by their positive annual growth. This huge increase<br />
in revenue expenditure is salary-related which,<br />
in a department like education, would normally<br />
comprise a substantial part of the expenditure.<br />
Nevertheless, the current bias towards revenue<br />
expenditure, caused, no doubt, by fi scal constraints,<br />
TABLE 3.2.6<br />
Annual growth of intra-sectoral allocation on general education:<br />
1990-91 to 2002-03<br />
(Per cent)<br />
Year Revenue expenditure Capital expenditure<br />
1990-91<br />
1998-99<br />
2002-03<br />
1990-91<br />
1998-99<br />
2002-03<br />
1990-91<br />
1998-99<br />
2002-03<br />
1990-91<br />
1998-99<br />
2002-03<br />
Plan Non-plan Total Plan Non-plan Total<br />
76.18<br />
40.56<br />
-30.77<br />
68.15<br />
4.47<br />
-49.13<br />
48.51<br />
6.26<br />
-49.39<br />
58.96<br />
-0.47<br />
16.29<br />
6.80<br />
13.87<br />
13.19<br />
6.88<br />
22.34<br />
6.99<br />
4.90<br />
15.21<br />
9.86<br />
-8.74<br />
27.88<br />
23.80<br />
Elementary education<br />
10.35<br />
18.08<br />
0.62<br />
-74.05<br />
0.00<br />
0.00<br />
Secondary education<br />
11.48<br />
20.26<br />
-0.38<br />
22.05<br />
-15.87<br />
7.34<br />
University and higher education<br />
7.93<br />
14.69<br />
7.06<br />
-44.15<br />
-21.88<br />
104.36<br />
Adult education<br />
54.21<br />
10.42<br />
21.55<br />
-100.00<br />
0.00<br />
0.00<br />
Source: Computed using basic data from various issues of budget papers, GoK.<br />
Sl.<br />
No.<br />
1<br />
2<br />
3<br />
4<br />
5<br />
0.00<br />
0.00<br />
0.00<br />
0.00<br />
0.00<br />
0.00<br />
0.00<br />
0.00<br />
0.00<br />
0.00<br />
0.00<br />
0.00<br />
-74.05<br />
0.00<br />
0.00<br />
22.05<br />
-15.87<br />
7.34<br />
-44.15<br />
-21.88<br />
104.36<br />
-100.00<br />
0.00<br />
0.00<br />
TABLE 3.2.7<br />
Intra-sectoral allocation by level of education in <strong>Karnataka</strong> and<br />
southern states: 2000-01 to 2002-03<br />
(Per cent)<br />
Indicator Year <strong>Karnataka</strong> Andhra<br />
Pradesh<br />
Elementary<br />
education<br />
Secondary<br />
education<br />
University<br />
and higher<br />
education<br />
Adult<br />
education<br />
Technical<br />
education<br />
2000-01<br />
2001-02<br />
2002-03<br />
2000-01<br />
2001-02<br />
2002-03<br />
2000-01<br />
2001-02<br />
2002-03<br />
2000-01<br />
2001-02<br />
2002-03<br />
2000-01<br />
2001-02<br />
2002-03<br />
49.73<br />
50.17<br />
52.53<br />
29.98<br />
32.26<br />
29.57<br />
16.87<br />
13.29<br />
13.30<br />
0.17<br />
0.17<br />
0.18<br />
1.89<br />
1.91<br />
2.28<br />
40.00<br />
42.44<br />
39.66<br />
31.59<br />
31.12<br />
34.74<br />
24.56<br />
22.11<br />
21.76<br />
0.30<br />
0.82<br />
0.37<br />
2.46<br />
2.26<br />
2.25<br />
Kerala<br />
46.28<br />
46.43<br />
44.49<br />
33.52<br />
33.43<br />
35.36<br />
15.06<br />
15.28<br />
14.98<br />
0.00<br />
0.00<br />
0.00<br />
4.24<br />
4.10<br />
3.88<br />
Tamil<br />
Nadu<br />
43.69<br />
44.60<br />
43.35<br />
36.85<br />
37.10<br />
37.55<br />
11.99<br />
12.36<br />
13.08<br />
0.06<br />
0.03<br />
0.03<br />
3.20<br />
3.10<br />
2.93<br />
All-<br />
India/<br />
states<br />
49.50<br />
51.57<br />
50.77<br />
33.40<br />
32.51<br />
33.33<br />
12.78<br />
11.87<br />
11.93<br />
0.17<br />
0.23<br />
0.17<br />
2.52<br />
2.36<br />
2.34<br />
Central<br />
Govt.<br />
39.35<br />
44.32<br />
43.96<br />
14.63<br />
15.29<br />
13.94<br />
28.84<br />
20.45<br />
17.34<br />
1.41<br />
2.20<br />
2.17<br />
13.94<br />
15.42<br />
14.27<br />
Source: Analysis of Budgeted Expenditure on Education 2001-02 to 2002-03, Department of Secondary and Higher<br />
Education, Ministry of <strong>Human</strong> Resource <strong>Development</strong>, GoI, 2004.<br />
55
Financing <strong>Human</strong> <strong>Development</strong><br />
Employee-related/salary<br />
expenditure dominates<br />
over all other types of<br />
expenditure, in both plan<br />
and non-plan expenditure.<br />
About 88 (87) per cent of<br />
total non-plan expenditure<br />
in 2000-01 (2001-02)<br />
is employee-related<br />
expenditure.<br />
impacts adversely on providing funds for other<br />
inputs which improve the quality of education such<br />
as teachers’ training and school infrastructure.<br />
Comparison with all-India and selected<br />
states<br />
A comparison of the intra-sectoral allocation<br />
of resources in education for <strong>Karnataka</strong>, other<br />
southern states (Andhra Pradesh, Kerala<br />
and Tamil Nadu) and all-India (all states)<br />
and the Central Government for three years:<br />
2000-01 (actual), 2001-02 (revised estimates),<br />
and 2002-03 (budget estimates), offers some<br />
insights into state priorities (Table 3.2.7). In<br />
<strong>Karnataka</strong>, expenditure on elementary education<br />
is about 50 per cent of the total expenditure of<br />
the Education Department’s outlay – the highest<br />
among the southern states, all states’ average and<br />
the Central Government. However, expenditure on<br />
secondary education is the lowest in <strong>Karnataka</strong>,<br />
next only to the Central Government. The combined<br />
expenditure on elementary and secondary<br />
education, which, in <strong>Karnataka</strong>, was 79.71<br />
per cent in 2000-01, 82.43 per cent in 2001-02<br />
and 82.1 per cent in 2002-03, is higher than that<br />
of other states (except Tamil Nadu), the Central<br />
Government as well as the all states’ average.<br />
<strong>Karnataka</strong>’s expenditure on university and higher<br />
education is lower than that of Andhra Pradesh<br />
and the Central Government. As in other states,<br />
<strong>Karnataka</strong> incurs less than one per cent of the<br />
total Education Department’s expenditure on adult<br />
education, depending as they all do, on Central<br />
assistance. Expenditure on technical education in<br />
<strong>Karnataka</strong> is the lowest among southern states, all<br />
states’ average and the Central Government. This<br />
could be because there are few government and<br />
aided institutions in this sector.<br />
Patterns of expenditure in primary and<br />
secondary education<br />
The ‘Departmental Medium Term Fiscal Plan’<br />
(DMTFP) of the Primary and Secondary Education<br />
Department provides a projection of plan and<br />
non-plan expenditure based on objectives. The<br />
analysis reveals that overall expenditure on<br />
employees and transfer payments dominates the<br />
total expenditure in the Department of Primary<br />
and Secondary Education.<br />
The fi rst DMTFP was prepared in 2002. Table 3.2.8<br />
presents a comparison of expenditure (actual/<br />
accounts) on primary education as presented in the<br />
DMTFP in 2002 and 2003. In the DMTFP in 2002,<br />
expenditure under the revenue and capital account<br />
are separated, while, in the DMTFP in 2003, the<br />
total expenditure is classifi ed. 15 About 97 per<br />
cent of total expenditure in 2000-01 is revenue<br />
expenditure. Employee-related/salary expenditure<br />
dominates over all other types of expenditure, in<br />
both plan and non-plan expenditure. About 88 (87)<br />
per cent of total non-plan expenditure in 2000-01<br />
(2001-02) is employee-related expenditure.<br />
Transfer payments constitute the next sizeable<br />
chunk (about 13 per cent). Transfer payments<br />
include budgetary assistance to zilla panchayats and<br />
taluk panchayats, which, in turn, have a substantial<br />
salary component.<br />
A decomposition of expenditures in the DMTFP<br />
for secondary (high school) education in<br />
2000-01 and 2001-02 shows certain signifi cant<br />
patterns (Table 3.2.9). First, as in primary<br />
education, revenue expenditure constitutes about<br />
99 per cent of total expenditure in 2000-01.<br />
Second, employee-related (or salary) expenditure<br />
is the highest component among all types of<br />
expenditure, especially under plan expenditure.<br />
For instance, of the total plan expenditure, about<br />
66 per cent in 2000-01 and 55 per cent in<br />
2001-02 was earmarked for employee-related<br />
expenditure. Third, next to employee-related<br />
expenditure, transfer payments account for<br />
the largest expenditure (51 per cent). Transfer<br />
payments include budgetary assistance to ZPs<br />
and TPs, which, in turn, as noted earlier, have a<br />
signifi cant salary component.<br />
In pre-university education, as in primary<br />
and secondary education, employee-related<br />
expenditure, transfer payments and supplies<br />
and services dominate the total expenditure<br />
(over 90 per cent).<br />
15<br />
In the DMTFP 2002, several expenditure items under revenue<br />
heads (especially, under 2202-01-052 and 2202-01-800) are<br />
classifi ed as capital expenditure in state and ZP sector. Thus,<br />
in the ultimate analysis, the classifi cation of expenditure by<br />
revenue and capital heads is subject to nature of expenditure<br />
as well.<br />
56
<strong>Karnataka</strong> <strong>Human</strong> <strong>Development</strong> <strong>Report</strong> <strong>2005</strong><br />
TABLE 3.2.8<br />
Pattern of expenditure in DMTFP for primary education: 2000-01 and 2001-02<br />
Sl. No. Pattern of expenditure 2000-01 2001-02<br />
1<br />
1.1<br />
1.2<br />
1.3<br />
2<br />
2.1<br />
2.2<br />
2.3<br />
3<br />
3.1<br />
3.2<br />
3.3<br />
4<br />
4.1<br />
4.2<br />
4.3<br />
5<br />
5.1<br />
5.2<br />
5.3<br />
6<br />
6.1<br />
6.2<br />
6.3<br />
Employee related (%)<br />
State sector<br />
Zilla panchayat sector<br />
Taluka panchayat sector<br />
Plan Non-plan Total Plan Non-plan Total<br />
30.23<br />
0.05<br />
36.31<br />
0.72<br />
2.03<br />
84.97<br />
8.16<br />
1.53<br />
72.69<br />
25.83<br />
0.04<br />
35.99<br />
0.48<br />
1.80<br />
84.29<br />
Sub-total 66.59 87.72 82.38 61.86 86.57 79.51<br />
Transfer payments (%)<br />
State sector<br />
Zilla panchayat sector<br />
Taluka panchayat sector<br />
11.75<br />
0.00<br />
1.75<br />
0.31<br />
0.02<br />
11.75<br />
3.20<br />
0.02<br />
9.22<br />
13.08<br />
0.00<br />
1.58<br />
0.38<br />
0.02<br />
12.40<br />
Sub-total 13.50 12.08 12.44 14.66 12.80 13.34<br />
Maintenance (%)<br />
State sector<br />
Zilla panchayat sector<br />
Taluka Panchayat sector<br />
3.37<br />
0.00<br />
0.36<br />
0.20<br />
0.00<br />
0.00<br />
Sub-total 3.73 0.20 1.09 10.08 0.63 3.33<br />
Supplies and services (%)<br />
State sector<br />
Zilla panchayat sector<br />
Taluka panchayat sector<br />
0.94<br />
0.00<br />
0.00<br />
0.00<br />
0.00<br />
0.00<br />
Sub-total 0.94 0.00 0.24 6.07 0.00 1.73<br />
Other payments (%)<br />
State sector<br />
Zilla panchayat sector<br />
Taluka panchayat sector<br />
1.58<br />
0.00<br />
0.00<br />
0.00<br />
0.00<br />
0.00<br />
Sub-total 1.58 0.00 0.40 7.33 0.00 2.09<br />
Total recurring expenditure (%) 86.34 100.00 96.55 100.00 100.00 100.00<br />
Capital (%)<br />
State sector<br />
Zilla panchayat sector<br />
Taluka panchayat sector<br />
12.56<br />
0.18<br />
0.92<br />
0.00<br />
0.00<br />
0.00<br />
Total capital expenditure (%) 13.66 0.00 3.45 NR NR NR<br />
Total percentage 100.00 100.00 100.00 100.00 100.00 100.00<br />
Grand total (Rs. lakh) 44381.82 131535.9 175917.7 51033.65 127440.2 178473.9<br />
Source: DMTFP, Department of Primary and Secondary Education, GoK, 2002 and 2003.<br />
Note: NR refers to ‘Not <strong>Report</strong>ed’.<br />
1.00<br />
0.00<br />
0.09<br />
0.24<br />
0.00<br />
0.00<br />
0.40<br />
0.00<br />
0.00<br />
3.17<br />
0.05<br />
0.23<br />
8.73<br />
0.16<br />
1.19<br />
6.07<br />
0.00<br />
0.00<br />
7.33<br />
0.00<br />
0.00<br />
NR<br />
NR<br />
NR<br />
0.63<br />
0.00<br />
0.00<br />
0.00<br />
0.00<br />
0.00<br />
0.00<br />
0.00<br />
0.00<br />
NR<br />
NR<br />
NR<br />
7.73<br />
1.30<br />
70.48<br />
4.01<br />
0.02<br />
9.31<br />
2.95<br />
0.04<br />
0.34<br />
1.73<br />
0.00<br />
0.00<br />
2.09<br />
0.00<br />
0.00<br />
NR<br />
NR<br />
NR<br />
57
Financing <strong>Human</strong> <strong>Development</strong><br />
Sl.<br />
No.<br />
1<br />
1.1<br />
1.2<br />
1.3<br />
2<br />
2.1<br />
2.2<br />
2.3<br />
3<br />
3.1<br />
3.2<br />
3.3<br />
4<br />
4.1<br />
4.2<br />
4.3<br />
TABLE 3.2.9<br />
Pattern of expenditure in DMTFP for secondary education: 2000-01 and 2001-02<br />
Pattern of expenditure 2000-01 2001-02<br />
Plan Non-plan Total Plan Non-plan Total<br />
Employee related (%)<br />
State sector<br />
Zilla panchayat sector<br />
Taluk panchayat sector<br />
1.31<br />
0.12<br />
64.13<br />
3.28<br />
2.41<br />
38.88<br />
3.04<br />
2.12<br />
42.11<br />
4.54<br />
0.88<br />
49.58<br />
3.21<br />
2.29<br />
39.98<br />
3.41<br />
2.09<br />
41.35<br />
Sub-total 65.56 44.57 47.27 55.00 45.48 46.85<br />
Transfer payments (%)<br />
State sector<br />
Zilla panchayat sector<br />
Taluk panchayat sector<br />
7.51<br />
11.84<br />
0.00<br />
0.41<br />
54.94<br />
0.00<br />
1.32<br />
49.42<br />
0.00<br />
17.66<br />
10.55<br />
0.00<br />
0.37<br />
53.57<br />
0.00<br />
2.82<br />
47.46<br />
0.00<br />
Sub-total 19.35 55.35 50.74 28.21 53.94 50.28<br />
Maintenance (%)<br />
State sector<br />
Zilla panchayat sector<br />
Taluk panchayat sector<br />
2.47<br />
1.35<br />
0.00<br />
0.00<br />
0.00<br />
0.00<br />
Sub-total 3.82 0.00 0.49 15.30 0.46 2.56<br />
Supplies and services (%)<br />
State sector<br />
Zilla panchayat sector<br />
Taluk panchayat sector<br />
0.86<br />
0.04<br />
0.00<br />
Sub-total 0.90 0.08 0.18 1.49 0.12 0.31<br />
5 Other payments (%)<br />
5.1 State sector 0.00 0.00 0.00 0.00 0.00 0.00<br />
5.2 Zilla panchayat sector 0.00 0.00 0.00 0.00 0.00 0.00<br />
5.3 Taluk panchayat sector 0.00 0.00 0.00 0.00 0.00 0.00<br />
Sub-total 0.00 0.00 0.00 0.00 0.00 0.00<br />
Total recurring expenditure (%) 89.63 100.00 98.68 100.00 100.00 100.00<br />
6 Capital (%)<br />
6.1 State sector 5.10 0.00 0.65 NR NR NR<br />
6.2 Zilla panchayat sector 5.27 0.00 0.67 NR NR NR<br />
6.3 Taluk panchayat sector 0.00 0.00 0.00 NR NR NR<br />
Total capital expenditure (%) 10.37 0.00 1.32 NR NR NR<br />
Total percentage 100.00 100.00 100.00 100.00 100.00 100.00<br />
Grand total (Rs. lakh) 9814.4 66928.03 76742.43 11756.87 70972.25 82729.12<br />
Note: NR refers to ‘Not <strong>Report</strong>ed’.<br />
Sources:<br />
1. DMTFP 2002-03 to <strong>2005</strong>-06, Department of Primary and Secondary Education, GoK, 2002<br />
2. DMTFP 2003-04 to 2006-07, Department of Primary and Secondary Education, GoK, 2003.<br />
0.08<br />
0.00<br />
0.00<br />
0.32<br />
0.17<br />
0.00<br />
0.18<br />
0.00<br />
0.00<br />
9.15<br />
6.15<br />
0.00<br />
1.46<br />
0.03<br />
0.00<br />
0.46<br />
0.00<br />
0.00<br />
0.12<br />
0.00<br />
0.00<br />
1.69<br />
0.87<br />
0.00<br />
0.31<br />
0.00<br />
0.00<br />
Rural local bodies and school<br />
education<br />
Notably, almost 90 per cent of elementary education<br />
expenditure is spent at the level of local bodies. 16<br />
16<br />
Of the total expenditure on elementary education in <strong>Karnataka</strong>,<br />
public expenditure constituted about three-quarters of the<br />
expenditure on elementary education in 1995-96, and<br />
about one-quarter by households (World Bank 2002). It<br />
may, however, be noted that this is a comparison primarily of<br />
recurrent expenditure on education and excludes annualised<br />
cost of past fi xed investment (much of which is incurred by<br />
the government over the years). The study also points out that<br />
the share of private expenditure is less in case of children from<br />
relatively poor families.<br />
An examination of the district-wise expenditure<br />
by local bodies on elementary education and the<br />
number of schools (both in terms of per-child in the<br />
age group 6-14 years), shows that the correlation<br />
coeffi cient between the two is very high (about<br />
0.9). This is because these expenditures are mainly<br />
incurred for payment of salaries of school teachers<br />
and pass-through expenditures for the grants-inaid<br />
to private institutions, which are, nevertheless,<br />
considered “local expenditures”.<br />
Table 3.2.10 presents district-wise expenditures<br />
on school education by rural local governments<br />
58
<strong>Karnataka</strong> <strong>Human</strong> <strong>Development</strong> <strong>Report</strong> <strong>2005</strong><br />
District<br />
TABLE 3.2.10<br />
District-wise block assistance per child and schooling achievements<br />
in <strong>Karnataka</strong>: 2000-01<br />
Expenditure<br />
per child in the<br />
age group 6-14<br />
years (Rs.)<br />
School<br />
attendance<br />
rate (%)<br />
No. of out-ofschool<br />
children<br />
(2003-04)<br />
Literacy rate<br />
2001<br />
Male-female<br />
gap in<br />
literacy rate<br />
1 2 3 4 5 6<br />
Bagalkot 1579.873 86.78 37385 57.30 27.33<br />
Bangalore Rural 2029.215 95.60 12691 64.70 19.00<br />
Bangalore Urban 1307.839 97.28 21687 82.96 10.44<br />
Belgaum 1716.016 91.54 51567 64.21 23.38<br />
Bellary 1358.678 83.25 57634 57.40 23.92<br />
Bidar 1791.658 87.59 35264 60.94 23.66<br />
Bijapur 1775.829 82.68 59685 57.01 26.47<br />
Chamarajnagar 1744.458 90.86 13106 50.87 16.55<br />
Chikmaglur 2788.493 93.22 11061 72.20 16.27<br />
Chitradurga 2058.406 92.50 18205 64.45 20.89<br />
Dakshina Kannada 1982.709 98.24 4418 83.35 12.49<br />
Davangere 1925.148 92.30 22023 67.43 18.33<br />
Dharwad 1817.076 91.46 19081 71.61 18.90<br />
Gadag 1714.471 89.89 15836 66.11 26.80<br />
Gulbarga 1576.489 75.63 136667 50.01 23.87<br />
Hassan 2427.975 94.89 12981 68.63 19.37<br />
Haveri 1415.211 91.60 20506 67.79 20.24<br />
Kodagu 2463.753 91.48 6062 77.99 11.44<br />
Kolar 1995.583 90.19 42570 62.84 20.94<br />
Koppal 1109.969 79.05 46046 54.10 28.81<br />
Mandya 2245.639 95.73 11101 61.05 18.97<br />
Mysore 2039.405 90.99 29635 63.48 15.07<br />
Raichur 1146.402 73.27 80105 48.81 25.60<br />
Shimoga 1995.752 93.90 14911 74.52 15.13<br />
Tumkur 2502.724 95.50 17403 67.01 19.84<br />
Udupi 1963.855 98.90 2059 81.25 13.04<br />
Uttara Kannada 2942.866 93.11 13874 76.60 16.07<br />
Sources:<br />
1. <strong>Report</strong> of the High Power Committee for Redressal of Regional Imbalances, <strong>Karnataka</strong>, June 2002.<br />
2. Budget document 2002-03, Finance Department, <strong>Karnataka</strong>.<br />
59
Financing <strong>Human</strong> <strong>Development</strong><br />
Transfer of responsibility<br />
from the state government<br />
to rural local bodies must<br />
bring about more equity<br />
for the underprivileged,<br />
in terms of access to<br />
elementary education<br />
services in the state.<br />
in the state, along with the indicators of schooling<br />
requirements and achievements. There are<br />
wide variations in the expenditure per child of<br />
schooling age (6-14 years), among the districts<br />
in <strong>Karnataka</strong>. There is positive and signifi cant<br />
correlation (Table 3.2.11) between per child<br />
expenditures and school attendance rate (0.57)<br />
as well as between per capita expenditures and<br />
the literacy rate (0.59).<br />
Although it would be tempting to conclude from<br />
this that higher expenditure, by itself, results in<br />
better literacy rates, such a conclusion ignores<br />
the fact that the literacy rate depends on a<br />
variety of factors and not public expenditure<br />
alone. Parental education, the socio-economic<br />
environment in the region, employment avenues<br />
for the educated, availability of schools within<br />
a reasonable distance and availability of private<br />
schools are other factors that can infl uence the<br />
enrolment and retention rates. Another way of<br />
interpreting the signifi cant correlation is that<br />
expenditures are lower where they are needed<br />
most, i.e. in the less literate districts which are<br />
also economically underdeveloped. Districts<br />
with high expenditures show very high school<br />
attendance rates. Thus, in the poorer districts of<br />
Bellary, Bidar, Gulbarga, Bijapur, Haveri, Koppal<br />
and Raichur, expenditure per child is substantially<br />
lower than the average and these are the<br />
districts with low literacy rates, a high gender<br />
gap in literacy and low school attendance. On<br />
the other hand, districts with high educational<br />
achievements, like Bangalore Rural, Chikmaglur,<br />
Dakshina Kannada, Uttara Kannada, Udupi and<br />
Kodagu have higher than average per-child<br />
expenditures. However, very high expenditures<br />
are also seen in districts with median level<br />
achievements, such as Mandya, Mysore, Hassan<br />
and Tumkur. Per-child expenditures are the lowest<br />
in Hyderabad <strong>Karnataka</strong> and Bombay <strong>Karnataka</strong><br />
regions, the highest in south <strong>Karnataka</strong> and<br />
about average in the coastal region. Interestingly,<br />
while the educational achievement in the coastal<br />
region of the state is the best among the various<br />
districts, the expenditures are about average. The<br />
reasons for this optimum cost effi ciency could<br />
be the existence of a good educational<br />
infrastructure dating back to the pre-state<br />
reorganisation period, the high demand for<br />
education and the existence of strong private<br />
initiatives.<br />
This analysis shows that even after entrusting<br />
the responsibility of school education to local<br />
bodies, the pattern of expenditures continues<br />
to be dictated by historical factors, rather<br />
than by the specifi c requirements of various<br />
districts. Transfer of responsibility from the state<br />
government to rural local bodies must bring about<br />
more equity for the underprivileged, in terms of<br />
access to elementary education services in the<br />
state. Educationally backward districts are also<br />
economically backward, and therefore, a large<br />
majority of the people cannot afford expensive<br />
private education. Another aspect of the scenario<br />
is that the middle-class and the rich exit the<br />
system and send their children to private schools.<br />
Since it is these groups who have the capacity to<br />
lobby effectively for improvements in the system,<br />
their absence leaves the users of state systems<br />
without strong advocacy.<br />
TABLE 3.2.11<br />
Correlation matrix of outcomes and expenditure on elementary<br />
education across districts<br />
Correlation matrix<br />
Literacy<br />
rate<br />
School<br />
attendance<br />
rate<br />
Female<br />
literacy<br />
gap<br />
Expenditure<br />
per child<br />
Literacy rate 1<br />
School attendance rate 0.78 1<br />
Male-female gap in literacy -0.61 -0.59 1<br />
Expenditure per child 0.59 0.57 1<br />
Note: Data on all the variables refers to 2001.<br />
Assessment of financial requirements<br />
for primary and secondary education<br />
The projected annual growth for primary education<br />
in DMTFP-2002 (Table 3.2.12) is 15.53 per cent,<br />
16.25 per cent, and 23.13 per cent for each year from<br />
2003-04 to <strong>2005</strong>-06. For secondary education the<br />
annual growth projected is 8.75 per cent, 9.65 per<br />
cent and 11.80 per cent. The table also highlights the<br />
fact that different DMTFPs show different fi nancial<br />
forecast values for the same year: for instance, the<br />
difference between the forecast values in DMTFP-<br />
2002 and DMTFP-2003 for the year 2004-05<br />
60
<strong>Karnataka</strong> <strong>Human</strong> <strong>Development</strong> <strong>Report</strong> <strong>2005</strong><br />
(<strong>2005</strong>-06) is Rs.517.11 (Rs.1,012.77) crore for<br />
primary education and Rs.156.00 (Rs.262.57)<br />
crore for secondary education. 17<br />
The difference between the DMTFP-2002’s 18<br />
forecast and the amount provided in the Budget in<br />
2004-05 is Rs.605.92 crore for primary education<br />
and Rs.142.4 crore for secondary education. The<br />
difference between the DMTFP-2003’s forecast<br />
and the Budget outlay in 2004-05 is Rs.88.81<br />
crore for primary education and (-) Rs.13.53 crore<br />
for secondary education. The fi rst DMTFP represents<br />
the department’s actual requirements commensurate<br />
with its objectives, whereas the second DMTFP<br />
represents a downscaled version in accordance<br />
with the reality of the resources available to fi nance<br />
education. Nevertheless, even the scaled-down<br />
version has not been fully funded.<br />
The World Bank’s (2002) report provides an<br />
assessment of fi nancial requirements for education<br />
in <strong>Karnataka</strong>. Under various assumptions of<br />
demographic and enrolment projections, and<br />
provision for infrastructure facilities, projected<br />
fi nancial requirements for elementary education,<br />
high school education and pre-university<br />
education are estimated from 2002-03 through<br />
2006-07, using 2001-02 as the base year. 19 The<br />
17<br />
In principle, the DMTFP is prepared as a combination of the<br />
Department’s requirements and the guidelines/assumptions<br />
in the state level Medium Term Fiscal Plan (MTFP) for the<br />
Department in different years. For instance, in the state’s MTFP<br />
2003-04 to 2006-07 [Government of <strong>Karnataka</strong> (2003)], the<br />
following guidelines are relevant for primary and secondary<br />
education. First, basic salaries to grow at 2.75 per cent per<br />
annum, DA to grow at 5 per cent per annum, provision for<br />
80 per cent of vacant posts, non-salary revenue expenditure<br />
as a percentage of salary expenditure to grow from the<br />
existing level of 18 per cent to 22 per cent in 2006-07, and<br />
capital expenditure to increase by more than 52 per cent on<br />
an average per annum. Thus, the difference in forecast values<br />
for the same year can be accounted for by a combination of<br />
these two factors. These details are available in the World Bank<br />
(2002) <strong>Report</strong> No.24207-IN.<br />
18<br />
In the DMTFP 2002, several expenditure items under revenue<br />
heads (especially, under 2202-01-052 and 2202-01-800)<br />
are classifi ed as capital expenditure in state and ZP sector.<br />
Thus, in the ultimate analysis, the classifi cation of expenditure<br />
by revenue and capital heads is subject to the nature of<br />
expenditure as well.<br />
19<br />
The estimates of physical requirements, unit costs and total<br />
costs for these projections are provided in the Technical Annex<br />
to the report of World Bank (2002). The Technical Annex is<br />
prepared by Ms. Vandana Sipahimalani Rao of the World Bank<br />
and is available in processed form (pp.23).<br />
TABLE 3.2.12<br />
Financial requirements for primary and secondary education<br />
(Rs. crore)<br />
Year Primary education Secondary education<br />
DMTFP 2002 DMTFP 2003 DMTFP 2002 DMTFP 2003<br />
2002-03 (BE: base) 2045.41 1074.38<br />
2003-04 (BE: base) 2141.08 1088.05<br />
2003-04 (forecast) 2363.00 1168.42<br />
Annual growth % 15.53 8.75<br />
2004-05 (forecast) 2747.00 2229.89 1281.17 1125.17<br />
Annual growth % 16.25 4.15 9.65 3.41<br />
<strong>2005</strong>-06 (forecast) 3382.34 2369.57 1432.36 1169.79<br />
Annual growth % 23.13 4.47 11.80 3.98<br />
2006-07 (forecast) 2433.34 1216.05<br />
Annual growth % 4.45 3.95<br />
Note: BE refers to ‘Budget Estimates’.<br />
Sources:<br />
1. DMTFP 2002-03 to <strong>2005</strong>-06, Department of Primary and Secondary Education, GoK, 2002.<br />
2. DMTFP 2003-04 to 2006-07, Department of Primary and Secondary Education, GoK 2003.<br />
World Bank estimates show that the base level<br />
total fi nancial requirement would increase from<br />
Rs.2,660 crore in 2001-02 (RE) to Rs.3,382<br />
crore in 2002-03 to Rs.4,992 crore in 2006-07,<br />
i.e. a 26 per cent increase in the fi rst year of the<br />
projections (mainly attributed to the increased<br />
cost of transition to an eight-year elementary<br />
cycle from the present seven-year), and about 47<br />
per cent over the next four years. There are major<br />
differences in the estimates between the World<br />
Bank and DMTFP-2003. The Bank’s estimates<br />
for primary and secondary education exceed the<br />
requirements projected in DMTFP 2003 but its<br />
estimate for PU education is less than the DMTFP<br />
2003. This is in consonance with the Bank’s policy<br />
of prioritising primary and secondary education<br />
alone, while the DMTFP is more aspirational<br />
in ensuring that students are enabled to access<br />
tertiary education.<br />
A comparison of estimates of fi nancial<br />
requirements with the objective of universalisation<br />
of primary education is presented in Table 3.2.13.<br />
In essence, about 1.9 per cent of GSDP would be<br />
required in 2006-07 to meet the objective. In this<br />
context, the forecast of 1.3 per cent of GSDP by<br />
the DMTFP seems to be woefully inadequate to<br />
meet the goal of universalising school enrolment<br />
and retention.<br />
61
Financing <strong>Human</strong> <strong>Development</strong><br />
TABLE 3.2.13<br />
Projected resource requirement for universalising elementary education<br />
(Rs. crore)<br />
Sl. No. Estimates 2004-05 <strong>2005</strong>-06 2006-07<br />
1<br />
Tapas Majumdar Committee (TMC) <strong>Report</strong><br />
2 World Bank (with revision of teachers’ pay in line with 5th Pay<br />
Commission)<br />
3<br />
4<br />
World Bank (with rationalisation of teachers across districts)<br />
Projected expenditure by DMTFP of Department of Primary<br />
and Secondary Education, <strong>Karnataka</strong><br />
Notes:<br />
1. * Estimated based on the methodology used in the TMC report.<br />
2. Figures in italics are percentages of expenditure to GSDP (projected by the Finance Department’s DMTFP).<br />
2336.98* 3426.49 4671.38*<br />
1.6 2.1 2.5<br />
3682 4021 4319<br />
2.5 2.5 2.4<br />
2955 3284 3465<br />
2.0 2.0 1.9<br />
2229.89 2329.56 2433.33<br />
1.5 1.4 1.3<br />
Sources:<br />
1. Tapas Majumdar Expert Committee <strong>Report</strong>, Ministry of <strong>Human</strong> Resource <strong>Development</strong>, GoI, 1999.<br />
2. India: <strong>Karnataka</strong>-Financing Education in the context of Economic Restructuring, <strong>Report</strong> No.24207-IN, <strong>Human</strong> <strong>Development</strong> Sector<br />
Unit, South Asia Region, the World Bank (Washington), 2002.<br />
3. Departmental Medium Term Fiscal Plan 2003-04 to 2006-07, Department of Primary and Secondary Education, GoK, 2003.<br />
Resources for financing education<br />
Given the competing demands from other growth<br />
sectors such as irrigation and power, not to<br />
mention demands from within the sector broadly<br />
classifi ed as ‘social services’, combined with the<br />
constraints on resources (all discussed in Part I),<br />
this section will examine how resources can be<br />
generated from within the sector itself. Resource<br />
mobilisation is more broadly addressed in Part I.<br />
Cost recovery from within primary and<br />
secondary education<br />
Making resources available, even for projections in<br />
the fi rst DMTFP, requires imaginative strategies for<br />
increasing the PER and SAR in education. Revenue<br />
and other receipts are critical inputs for an analysis<br />
of cost recovery in primary and secondary education<br />
for the state government. Broadly speaking, the<br />
composition of revenue and other receipts varies<br />
between primary and secondary education. The<br />
major components of revenue for primary education<br />
include tuition, examination and other fees from<br />
students and other receipts include contribution to<br />
buildings and income from properties. In secondary<br />
education, the main components of revenue (and<br />
other receipts) include tuition, examination and<br />
other fees from students in high schools converted<br />
into junior colleges (and fees from managements<br />
and sale proceeds of old answer books etc.). Tuition,<br />
examination and other fees from students are the<br />
single largest component of total revenue and other<br />
receipts in primary and secondary education.<br />
The total receipts of elementary education have<br />
declined from Rs.60.45 lakh in 1990-91 to<br />
Rs.0.10 lakh in 2002-03. As a percentage of total<br />
receipts of the education sector (general education),<br />
this decline is from 3.68 (7.59) per cent to zero<br />
per cent (Table 3.2.14). Thus, no cost recovery<br />
from the primary education sector can (or should)<br />
be expected, both at present and in future (as the<br />
Budget Estimates coincide with the accounts fi gures<br />
of 2002-03). This is consistent with the recent 86th<br />
Amendment to the Indian Constitution that ensures<br />
education, as a Constitutional right, for children in<br />
the age group 6-14 years.<br />
On the other hand, total receipts of secondary<br />
education have increased over the years, from<br />
Rs.711.81 lakh in 1990-91 to Rs.1,264.01 lakh<br />
in 1998-99, and further, to Rs.3,666.55 lakh in<br />
2002-03. As a percentage of total receipts of the<br />
general education sector, the increase has been<br />
from 43.28 per cent to 80.06 per cent. Thus, any<br />
62
<strong>Karnataka</strong> <strong>Human</strong> <strong>Development</strong> <strong>Report</strong> <strong>2005</strong><br />
cost recovery in primary and secondary education<br />
will essentially be from secondary education.<br />
However, the larger issue is whether the secondary<br />
education sector should be squeezed to generate<br />
resources for primary education. As more children<br />
start completing 7 years of schooling, the demand<br />
for secondary education will burgeon and the<br />
infrastructure should be in a position to meet the<br />
demand. Hence, cutting costs here is not advisable,<br />
especially since the sector is currently underfi<br />
nanced as it is. Putting secondary education<br />
beyond the reach of the poor by raising costs is also<br />
not an acceptable scenario.<br />
Budgetary subsidy to higher education<br />
A reduction in grant-in-aid (GIA) to private higher<br />
education institutions is a fi scal policy measure<br />
often suggested on many grounds including<br />
(i) lack of budgetary resources to meet the<br />
existing needs of GIA, (ii) switching budgetary<br />
expenditure from higher education to meet the<br />
resources required for the establishment and<br />
expansion of school education in backward areas,<br />
and (iii) the assumption that some aided colleges,<br />
especially older institutions in urban centres,<br />
are now fi nancially strong and can reduce their<br />
dependence on grants from government.<br />
Some steps have been taken in this direction.<br />
The GIA to collegiate education has been reduced<br />
in several ways: all private degree colleges<br />
established after June 1, 1987 are treated as<br />
permanently unaided; 20 since 1990-91, no new<br />
courses have been brought under grant; and<br />
since 1993-94, there has been a ban on fi lling<br />
up vacant posts of non-teaching staff; a large<br />
number of teaching posts have remained vacant<br />
for several years and are being gradually converted<br />
into unaided posts; and an increase in student<br />
fees with a built-in provision for annual upward<br />
revisions has been put in place. 21 In essence, these<br />
20<br />
This is relevant for institutions in secondary education as well.<br />
This is evident in the summary of the recent changes in GIA<br />
policy to secondary education in Panchamukhi et al (2004a).<br />
21<br />
Consequent upon the above measures, the amount of GIA to<br />
collegiate education has come down from what it would have<br />
been in the absence of the measures. Nevertheless, to date, no<br />
empirical evidence is available on the impact of this expenditure<br />
reduction on the quantity and quality of provisioning of<br />
education services by private aided colleges in the state.<br />
TABLE 3.2.14<br />
Revenue receipts from primary and secondary education<br />
(Rs. lakh)<br />
Sl. No. Level of education 1990-91 1998-99 2002-03<br />
1 Revenue receipts from elementary 60.45 1.02 0.10<br />
education<br />
1.1 Per cent to total revenue receipts from all 3.68 0.04 0.00<br />
levels and types<br />
1.2 Per cent to total revenue receipts from<br />
7.59 0.08 0.00<br />
general education<br />
1.3 Per cent to total revenue expenditure on 0.15 0.00 0.00<br />
primary education<br />
2 Revenue receipts from secondary 711.81 1264.01 3666.55<br />
education<br />
2.1 Per cent to total revenue receipts from all 43.28 46.28 80.06<br />
levels and types<br />
2.2 Per cent to total revenue receipts from 89.39 99.92 99.92<br />
general education<br />
2.3 Per cent to total revenue expenditure on 3.21 0.86 3.48<br />
secondary education<br />
Total revenue receipts: Primary and 772.26 1265.03 3666.65<br />
secondary education<br />
Source: Various issues of ‘Budget Papers’ of Government of <strong>Karnataka</strong>.<br />
steps aim at switching expenditure from higher<br />
education to ensuring a higher budget allocation<br />
for school education, especially primary education,<br />
in government schools. Thus, other things being<br />
the same, a reduction in GIA to higher education<br />
could generate additional fi nancial resources for<br />
primary and secondary education in the state.<br />
Implicit budgetary subsidy to higher education,<br />
as estimated for 1990-91, 1998-99 and 2002-<br />
03, is summarised in Table 3.2.15. The aggregate<br />
subsidy to higher education has increased from<br />
Rs.20,615.82 lakh in 1990-91 to Rs.46,137.98<br />
lakh in 1998-99 and to Rs.74,464.83 lakh in<br />
2002-03. Of the aggregate subsidy, the largest, but<br />
declining share goes to general education: 75.9 per<br />
cent in 1990-91, 65.38 per cent in 1998-99 and<br />
63.06 per cent in 2002-03. Subsidy to technical<br />
and agricultural education shows a moderate<br />
increase from 8.85 and 7.79 per cent in 1990-91<br />
to 9.63 and 11.88 per cent in 1998-99 and to<br />
10.3 and 13.8 per cent in 2002-03.<br />
However, the share of medical education in<br />
the total subsidy varies from 7.45 per cent in<br />
63
Financing <strong>Human</strong> <strong>Development</strong><br />
TABLE 3.2.15<br />
Budgetary subsidy to higher education in <strong>Karnataka</strong>:<br />
1990-91 to 2002-03<br />
(Per cent)<br />
Sl. No. Aggregate subsidy 1990-91 1998-99 2002-03<br />
1 Aggregate subsidy (Rs. in lakh at current<br />
prices)<br />
20615.82 46137.98 74464.83<br />
1.1 Share of general education 75.90 65.38 63.06<br />
1.2 Share of technical education 8.85 9.63 10.30<br />
1.3 Share of agricultural education 7.79 11.88 13.80<br />
1.4 Share of medical education 7.45 13.10 12.83<br />
2 Subsidy to aided institutions to total<br />
aggregate subsidy<br />
79.74 70.91 72.92<br />
3 Aggregate subsidy to revenue expenditure 5.19 3.71 3.96<br />
4 Total subsidy to aided institutions as<br />
percentage of revenue expenditure<br />
4.14 2.63 2.89<br />
5 Aggregate subsidy to NSDP (at factor cost) 0.92 0.59 0.74<br />
6 Aggregate subsidy to higher education to<br />
total expenditure on<br />
6.1 Primary education 47.71 31.81 35.04<br />
6.2 Primary and secondary education 30.89 19.90 22.07<br />
7 Aggregate subsidy to general higher<br />
education to total expenditure on<br />
7.1 Primary education 38.39 23.14 26.15<br />
7.2 Primary and secondary education 24.86 14.47 16.47<br />
8 Aggregate subsidy to aided institutions to<br />
total expenditure on<br />
8.1 Primary education 40.34 25.09 30.23<br />
8.2 Primary and secondary education 26.12 15.70 19.04<br />
Source: Estimated by using the framework in Narayana, M.R. ‘Budgetary Subsidies of the state government to Higher<br />
Education: Evidence from <strong>Karnataka</strong> State (India)’, Journal of Indian School of Political Economy, XIII, 2001,<br />
443-470.<br />
1990-91 to 13.10 per cent in 1998-99, and<br />
to 12.83 per cent in 2002-03. The share<br />
of aided institutions in subsidy dominates<br />
over the government institutions (in tertiary<br />
education, at least): 79.74 per cent in<br />
1990-91, 70.91 in 1998-99 and 72.92 per<br />
cent in 2002-03. Further, aggregate subsidy<br />
as a percentage of the state’s total revenue<br />
expenditure (income) varies from 5.19 (4.14)<br />
per cent in 1990-91 to 3.71 (2.63) per cent<br />
in 1998-99 and to 3.96 (2.89) per cent in<br />
2002-03. 22<br />
Most importantly, subsidy to higher education<br />
ranged from 47.71 (30.89) per cent in 1990-91,<br />
to 31.81 (19.90) per cent in 1998-99 and<br />
35.04 (22.07) per cent in 2002-03 of the<br />
total expenditure on primary (primary and<br />
secondary) education. The share of aggregate<br />
subsidy to general higher education in total<br />
expenditure on primary (primary and secondary)<br />
education varies from 38.39 (24.86) per cent in<br />
1990-91, 23.14 (14.47) per cent in 1998-99<br />
and to 26.15(16.47) per cent in 2002-03. The<br />
share of aggregate subsidy to aided institutions in<br />
higher education in total expenditure on primary<br />
(primary and secondary) education varies from<br />
40.34 (26.12) per cent in 1990-91, 25.09 (15.70)<br />
per cent in 1998-99 and to 30.23 (19.04) per cent<br />
in 2002-03. These estimates indicate the extent<br />
to which aggregate subsidy to higher education in<br />
general and general higher education in particular,<br />
can fi nance the expenditure on primary education<br />
alone, or primary and secondary education, in the<br />
state.<br />
As mentioned above, the Government of <strong>Karnataka</strong><br />
has partially reduced funding to higher education,<br />
but it is generally agreed that this sector needs<br />
major reforms to: (i) improve the quality of<br />
instruction and learning; (ii) grant academic<br />
autonomy to institutions; and (iii) ensure greater<br />
private sector participation. However, merely<br />
cutting back on funding without reforms might<br />
well be counter-productive.<br />
An alternative perspective is offered by the Task<br />
Force on Higher Education (2004) for fi nancing<br />
education in general, and higher education in<br />
particular (Box 3.2.1).<br />
22<br />
This is clearly refl ected in the state level MTFP 2003-04 to 2006-<br />
07 [Government of <strong>Karnataka</strong> (2003c)]: ‘In higher and secondary<br />
education, there is no justifi cation to carry on with the current<br />
grant-in-aid system, which is now, in many cases adding profi t<br />
to institutions which have long broken even. Cosmetic changes to<br />
GIA will not serve the purpose due to the strong interest groups,<br />
which propel this sector. A clear policy prescription is being<br />
worked out. The approach will be to freeze GIA at current levels in<br />
all secondary and higher education institutions immediately, and<br />
the savings there from used for enhanced allocations and quality<br />
improvement in government institutions’ (p.25).<br />
64
<strong>Karnataka</strong> <strong>Human</strong> <strong>Development</strong> <strong>Report</strong> <strong>2005</strong><br />
BOX 3.2.1<br />
Recommendations - Task Force on Higher Education for financing higher education<br />
<br />
<br />
<br />
<br />
<br />
Public expenditure on education in the state should be increased, in<br />
the fi rst phase, to 6 per cent of the Net State Domestic Product and<br />
gradually to 10 per cent as state fi nances improve. Six per cent has<br />
been suggested in the Kothari Committee <strong>Report</strong> in the sixties and,<br />
with the current size of our population, it is nearer ten per cent.<br />
Within expenditure on education, expenditure on higher education<br />
should be increased to 20 per cent at least.<br />
All input funding in higher education should be considered as a<br />
form of productive human capital expenditure in the state budget<br />
and, hence, as an investment. With globalisation, increased<br />
competition and knowledge driven economies, this investment has<br />
become particularly necessary if the state is to survive in the new<br />
environment.<br />
Higher education should be treated as one of the ‘high priority<br />
development expenditures’ in the state. Without appropriate<br />
funding, the state cannot be expected to survive in a knowledge<br />
society and a competitive world economy. Hence, it should not be<br />
subjected to reduction as a subsidy, but treated as its investment for<br />
development.<br />
The state government may address the following methods to increase<br />
funding for collegiate education in particular and higher education in<br />
general:<br />
Grant permanent affi liation to colleges and provide autonomy as<br />
funds can be accessed from the UGC on both counts.<br />
Instead of loans, which have a poor history of returns in most<br />
countries, tax the educated employed over their working life<br />
taking into consideration the income earned.<br />
Tax employers of those who employ graduates of the system based<br />
on the nature of the degree and the salary. Such a tax should<br />
include all employers, government and private companies.<br />
Place a small tax on IT and other knowledge-based industries as<br />
they maximally employ graduates of the system.<br />
Permit colleges that do not want grants, to opt out as it is done<br />
in the case of schools, which do not take grants.<br />
Introduce a system of tuition fees-based on the type of school<br />
attended with a higher level of fees from those who went to high<br />
fee paying schools, next grade to those who went to middle level<br />
fee paying schools, the third level for those who went to aided<br />
schools, and the lowest fees for those who went to Government/<br />
Municipal schools. Only then we will have equity in terms of cost<br />
of education to the individual. The college admission form and the<br />
school-leaving certifi cate should carry the fees paid. If the school had<br />
given concession, the school and the department of education should<br />
certify this.<br />
Source: <strong>Report</strong> of the Task Force on Higher Education, Government of <strong>Karnataka</strong>, 2004.<br />
Conclusions<br />
First, the state government has the right priorities<br />
in terms of allocating the lion’s share of the<br />
resources in education to primary, followed by<br />
secondary education. <strong>Karnataka</strong> performs well in<br />
terms of plan expenditure on education. However,<br />
the overwhelmingly large share of revenue<br />
expenditure indicates that, in <strong>Karnataka</strong>, as in<br />
other states, not enough investment is being<br />
directed towards capital expenditure. The nonsalary<br />
component is low and the expenditure<br />
on infrastructure, teaching aids, curriculum<br />
development, instructional material, laboratories,<br />
libraries, in-service teachers’ training, in short<br />
all the things that contribute to the quality of<br />
education is totally inadequate.<br />
Second, as school attendance rate is positively<br />
associated with the literacy rate, and negatively<br />
associated with the male-female gap in<br />
education, targeting expenditure towards school<br />
attendance will also help to move towards other<br />
goals in education. This scenario must take note<br />
of increasing enrolment in school education over<br />
the years, as evinced by a commensurate increase<br />
in the number of fi rst time entrants to collegiate<br />
education. Many of these fi rst time entrants are girls,<br />
and students from the Scheduled Castes and Tribes<br />
and backward classes who have traditionally not<br />
enjoyed access to higher education. Government<br />
colleges and, to a lesser extent, aided colleges<br />
provide them with education with a reasonable<br />
fee structure. There is need for reforms in higher<br />
education to ensure that it teaches the vocational<br />
skills required by the job market. However, doing<br />
away with all subsidies is, perhaps, draconian, and<br />
those who least can afford it will feel its impact.<br />
High-income students in tertiary education do<br />
not need government subsidies and it is not<br />
equitable that the children of the poor should<br />
subsidise them. There can be greater economies<br />
in tertiary education and those who can afford to<br />
While <strong>Karnataka</strong> performs<br />
well in terms of plan<br />
expenditure on education,<br />
not enough investment is<br />
being directed towards<br />
capital expenditure.<br />
65
Financing <strong>Human</strong> <strong>Development</strong><br />
The main aim of gender<br />
budgets and gender audits<br />
is not a separate budget<br />
for women, but better<br />
analysis of the incidence<br />
of the expenditures and<br />
tax measures.<br />
To be complete, gender budgets require good<br />
pay can and must be made to pay the real cost of<br />
higher education. This would reduce the sector’s<br />
dependence on state subsidies.<br />
Third, in the context of improving educational<br />
performance, while maximising existing<br />
resources, the educationally backward regions<br />
require special focus. Transfers to districts are not<br />
necessarily based on need and equity. Changing<br />
the pattern of devolution and sanctioning<br />
more resources to needy districts is necessary.<br />
The former would sensitise the rural local<br />
governments towards greater accountability<br />
from teachers and the latter would permit a<br />
larger allocation of resources to educationally<br />
backward districts.<br />
PART III<br />
Engendering Public Spending:<br />
Gender Budget and Audit<br />
The main aim of gender budgets and gender<br />
audits is not a separate budget for women, but<br />
better analysis of the incidence of the expenditures<br />
and tax measures, as well as overall impact of a<br />
budget, improved targeting of public spending,<br />
and a clearer fi nancial basis for counteracting<br />
any potential negative consequences of the<br />
budget. For the purposes of this discussion, we<br />
use the terms ‘gender audit’ and ‘gender budget’<br />
interchangeably.<br />
The fi rst systematic audit of a government<br />
budget for its impact on girls and women was<br />
done in Australia in 1984. Since then, ‘gender<br />
budget exercises’, as they are called, have been<br />
undertaken in a number of countries, chief among<br />
them being South Africa, Fiji, St. Kitts and Nevis,<br />
Barbados, Sri Lanka, Canada, UK, Mozambique,<br />
Tanzania and Uganda. This growing acceptance<br />
of gender budgeting as a tool for engendering<br />
macroeconomics gained momentum after the<br />
Fourth World Conference on Women at Beijing<br />
in 1995, and after the Commonwealth Women’s<br />
Affairs Ministerial meeting in New Delhi in<br />
2000. 23 quality data. In practice, of course, a number of<br />
gender audits have yet to reach sophisticated levels<br />
of analysis, not having access to the data needed to<br />
incorporate many of the elements. Many existing<br />
audits include gender-aware policy appraisal and<br />
benefi ciary assessment, but other elements require<br />
either a level of sensitisation of offi cials (for example,<br />
budget statements) or the kind of capacity for<br />
analysis (for example, tax incidence) that are not yet<br />
available in women’s development departments or<br />
ministries. However, even just benefi ciary incidence<br />
is a good place to begin, and a number of insights<br />
into the gender impact of development can be<br />
obtained through this process.<br />
Evolution of gender audits in India<br />
The Ninth Five Year Plan (1997-2002) fi rst<br />
proposed a Women’s Component Plan under<br />
which both Central and state governments were<br />
asked to ensure that at least 30 per cent of funds<br />
and benefi ts were earmarked in all the women<br />
related sectors, and that a holistic approach to<br />
empowering women should be followed. After<br />
2000, when a major conference on South Asia<br />
was held, the National Institute of Public Finance<br />
and Policy (NIPFP) was commissioned to carry<br />
out research on a project on Gender Related<br />
Economic Policy Issues. Following this, a State<br />
Budgets Workshop was held in 2001, which led<br />
to gender audit projects in different states, but the<br />
results have not yet been collated.<br />
The NIPFP report classifi ed public expenditure<br />
into three classes:<br />
1. Allocations under schemes and programmes<br />
specifi cally targeted to women and girls;<br />
2. Pro-women allocations as part of the<br />
composite expenditure of schemes with<br />
a component for women, e.g. in social<br />
sector ministries like health, family welfare,<br />
education, rural development, etc. where<br />
women may benefi t, both from targeted<br />
schemes and also from a share in the<br />
composite expenditure;<br />
3. Pro-women allocations in specifi c composite<br />
23<br />
http://wcd.nic.in/chap11.htm<br />
schemes in other ministries where there is<br />
typically no or very little women’s component<br />
as such.<br />
66
<strong>Karnataka</strong> <strong>Human</strong> <strong>Development</strong> <strong>Report</strong> <strong>2005</strong><br />
A look at most budgets will show that allocations<br />
under (1) above are a small fraction of the<br />
budget, while the relative size of (2) may vary,<br />
based on the priority given to the social sectors<br />
and to pro-women allocations within them. The<br />
bulk of public expenditure, however, is likely to<br />
fall under ministries/departments where there is<br />
not only little gender sensitivity, but which also<br />
include many public goods whose benefi ts cannot<br />
be specifi cally gender-attributed. In these latter<br />
ministries, one cannot assume that the impacts<br />
of expenditures will be gender neutral or provide<br />
equal benefi ts to women and men. Even seemingly<br />
neutral measures can be seen to have unequal<br />
benefi ts when viewed through a gender lens of<br />
differential use by women and men: for instance,<br />
road construction that leads to places where men<br />
rather than women work. Some measures may<br />
also actually be inimical to women: an example is<br />
expenditure on converting a street market where<br />
vendors (both women and men) hawk their wares,<br />
into a built set of stalls requiring leasing by small<br />
shop owners (mostly men because women often<br />
do not have access to the money needed to obtain<br />
a lease). Alternatively, by consuming the bulk of<br />
public expenditures, these sectors may crowd out<br />
other spending that more directly benefi ts women,<br />
e.g. the crowding out of social sector spending by<br />
other ‘neutral’ sectors.<br />
Important as an analysis of such impacts may<br />
be, the current state-of-the-art of gender audits<br />
in the country is still at the level of analysing<br />
women-specifi c schemes and women’s<br />
components under categories (1) and (2) of the<br />
NIPFP report.<br />
Gender audit in <strong>Karnataka</strong><br />
Data for recent years in <strong>Karnataka</strong> allow us to<br />
look at both these categories. 24 The fi rst task<br />
is to look at how the allocations for women’s<br />
welfare (which accounts for a portion of the<br />
budget of the Department of Women and<br />
Child <strong>Development</strong>) have fared relative to the<br />
department as a whole. This is meaningless<br />
unless we have columns showing total plan/<br />
non-plan outlay for each year from 1999-2000<br />
to 2002-03. Thereafter, (i) WCD (total) outlays<br />
can be shown as percentages of total state plan/<br />
non-plan outlay, (ii) for all other sub-heads e.g.<br />
‘Women’s welfare’, ‘Correctional services’ etc.<br />
outlays must be shown as a percentage of the<br />
Department of Women and Child <strong>Development</strong><br />
(WCD) budget.<br />
Over the period from 1999-2000 to<br />
2002-03, total expenditure on ‘Women’s Welfare’<br />
in <strong>Karnataka</strong> (Table 3.3.1) went from Rs.159<br />
crore (Rs.101 crore for plan, and Rs.58 crore for<br />
Even seemingly neutral<br />
measures can be seen<br />
to have unequal benefits<br />
when viewed through a<br />
gender lens of differential<br />
use by women and men.<br />
TABLE 3.3.1<br />
Women’s welfare (plan and non-plan expenditure)<br />
(Rs. lakh)<br />
Heads of Account 1999-2000 (A/C) 2000-01 (A/C) 2001-02 (A/C) 2002-03 (R.E.)<br />
Plan Non-plan Plan Non-plan Plan Non-plan Plan Non-plan<br />
Direction and administration 83.97 224.04 107.34 227.93 89.69 239.94 94.00 260.55<br />
Welfare of handicapped 276.28 4039.27 325.43 3916.07 374.32 4178.67 239.00 4046.56<br />
Child welfare 491.79 122.78 623.07 129.42 1219.89 133.3 537.83 129.74<br />
Women’s welfare 505.69 12.35 1338.55 14.02 1663.63 16.16 959.60 13.00<br />
Welfare of aged, infi rm and destitutes 1293.45 0.11 687.20 - 1046.71 - 276.00 23.80<br />
Correctional services 140.80 880.92 196.00 876.33 218.78 946.58 151.40 832.70<br />
Assistance to local bodies and 7290.28 522.41 9420.43 404.98 9654.86 340.29 10398.46 418.98<br />
Corporations etc.<br />
Total 10082.26 5801.88 12698.02 5568.75 14267.88 5854.94 12656.29 5725.33<br />
Percentage 5.02 0.21 10.54 0.25 11.66 0.28 7.58 0.23<br />
Source: Finance Department, Detailed Estimates of Expenditure, Volume-V, various years.<br />
24<br />
This is not an entirely congruent classifi cation. While DWCD’s Women’s Welfare Schemes clearly belong under the NIPFP category 1,<br />
there are also women-targeted schemes in other departments. These have been included largely under KMAY.<br />
67
Financing <strong>Human</strong> <strong>Development</strong><br />
<strong>Karnataka</strong> was the first<br />
state to introduce a<br />
Women’s Component<br />
Plan.<br />
BOX 3.3.1<br />
Undertaking a gender budget initiative<br />
non-plan) to Rs.184 crore (Rs.127 crore for<br />
plan, and Rs.57 crore for non-plan). While plan<br />
expenditure has increased somewhat, non-plan<br />
expenditure has fallen in real terms, given the<br />
positive rate of infl ation during the period. This<br />
stagnation of non-plan expenditure can be seen<br />
in ‘Women’s Welfare’ as well. However, plan<br />
expenditure has seen signifi cant fl uctuation, rising<br />
from Rs.5 crore to Rs.16 crore and falling back<br />
to Rs 9.6 crore. Overall, the outlay for women’s<br />
welfare ranged between 5.02 per cent and<br />
11.66 per cent of the overall Women and Child<br />
<strong>Development</strong> plan budget, and around ¼ of 1<br />
per cent of the non-plan budget. The bulk of the<br />
non-plan WCD budget goes to ‘Welfare of the<br />
Handicapped’. The bulk of the plan budget goes<br />
as assistance to local bodies and corporations,<br />
etc. However, a look at the details makes it clear<br />
that the ‘Integrated Child <strong>Development</strong> Scheme’<br />
(ICDS) accounts for most of this expenditure.<br />
Undoubtedly, girls as well as boys benefi t from<br />
ICDS expenditure, but again, the relative incidence<br />
is not easily correlated with this data.<br />
Undertaking a gender budget initiative can include some or all of the following:<br />
Gender-aware policy appraisal – Designed to analyse policies and programmes from<br />
a gender perspective, and identify the ways in which these policies and the resources<br />
allocated to them are likely to reduce or increase existing gender inequalities;<br />
Gender disaggregated benefi ciary assessment – Implemented to evaluate the extent to<br />
which programmes or services are meeting the needs of actual or potential benefi ciaries,<br />
as identifi ed and expressed by themselves;<br />
Gender disaggregated public expenditure benefi t incidence analysis – Used to evaluate the<br />
distribution of budget resources among women and men, girls and boys by estimating the<br />
unit costs of a certain service and calculating the extent to which this service is being used<br />
by each of the groups;<br />
Gender disaggregated analysis of the impact of the budget on time use – To establish a<br />
link between budget allocations, the services provided through them and the way in which<br />
different members within a household spend their time;<br />
Gender-aware medium term economic policy framework – Designed to incorporate a<br />
gender perspective into the medium term frameworks of policy development, planning<br />
and budgetary allocations, by disaggregating variables by gender. A gender aware budget<br />
statement refers to reports generated by government agencies on the implications of their<br />
expenditure on gender equity objectives;<br />
Disaggregated tax incidence analysis – Used to assess the differential impacts of taxation<br />
on women and men, as well as to evaluate the level of revenue raised in relation to the<br />
needs and demands for public expenditure.<br />
<strong>Karnataka</strong> Mahila Abhivrudhi Yojane<br />
The budget of the <strong>Karnataka</strong> Mahila Abhivrudhi<br />
Yojane 25 (KMAY) that was launched by DWCD in<br />
1995-96 would fall in NIPFP’s category (2) i.e. a<br />
woman’s component plan. <strong>Karnataka</strong> was the fi rst<br />
state in the country to actually introduce a scheme<br />
earmarking one third of its resources for women<br />
in individual benefi ciary-oriented schemes and<br />
labour intensive schemes of different departments.<br />
As many as 26 departments now earmark a third<br />
of the physical and fi nancial allocations in this<br />
way over 297 different Central, state and district<br />
schemes. In 2003, a special KMAY cell was<br />
created to monitor the programme. The objectives<br />
of the KMAY were: (i) to desegregate women<br />
from the confi nes of the DWCD where budgetary<br />
support was low and where the approach was<br />
predominantly welfarist; (ii) to make visible<br />
the contributions of women to the economic<br />
productivity of the state economy, and thereby;<br />
(iii) ensure that line departments are enlarged.<br />
The consolidated table (see Table 3.3.2) indicates<br />
that, over the last fi ve years, KMAY’s achievement<br />
in fi nancial terms has risen from 81 per cent to<br />
95 per cent and in physical terms (number of<br />
benefi ciaries) from 84 per cent to 106 per cent.<br />
By 2003-04, Rs.853 crore was being earmarked<br />
for women and 95 per cent of this was spent.<br />
The detailed table (Table 3.3.3) provides some<br />
valuable indicators for analysis. The different<br />
departments can be categorised according to<br />
the size of the allocation for women as follows<br />
(Box 3.3.2).<br />
It is clear from the above (Box 3.3.2) that schemes<br />
in 3 departments – Housing, Rural <strong>Development</strong>,<br />
and Social Welfare department – account for a<br />
large share in the earmarked total for women. In<br />
2003-04, out of a total expenditure of Rs.811<br />
crore, Rs.571 crore came from just these three<br />
departments. Thus, if KMAY’s effectiveness is to be<br />
improved, then these three departments will be<br />
important.<br />
25<br />
Including both women-targeted schemes and women’s share<br />
of composite schemes – again not exactly identical to NIPFP<br />
category 2.<br />
68
<strong>Karnataka</strong> <strong>Human</strong> <strong>Development</strong> <strong>Report</strong> <strong>2005</strong><br />
Year<br />
TABLE 3.3.2<br />
<strong>Karnataka</strong> Mahila Abhivrudhi Yojane - Targets and achievements: 1999-2004<br />
No. of<br />
programmes<br />
No. of<br />
depts.<br />
(Rs. lakh)<br />
Budget allocation Earmarked for women Progress up to March Percentage of<br />
progress<br />
Fin.<br />
Physical<br />
(Nos.)<br />
Fin.<br />
Physical<br />
(Nos.)<br />
Fin.<br />
Physical<br />
(Nos.)<br />
Fin.<br />
Physical<br />
(Nos.)<br />
1999-2000 247 24 107693 10889108 41776 5690827 34007 4802293 81 84<br />
2000-01 251 25 130400 2018318 54982 5703682 44509 2036643 81 36<br />
2001-02 252 26 151061 11789744 59639 132153388 54283 14177625 91 107<br />
2002-03 256 26 145289 99660262 44057 19944703 47123 22121758 106 110<br />
2003-04 297 26 151354 31205359 85325 13656666 81091 14433210 95 106<br />
Source: Department of Women and Child <strong>Development</strong>.<br />
To judge the extent to which the allocations<br />
for women were actually spent, and whether<br />
this has improved over time, the departments<br />
were classifi ed into six classes on the basis<br />
of expenditure: A++ (over 100 per cent),<br />
A+ (between 90 and 100 per cent), A (between<br />
80 and 89 per cent), B (between 70 and 79<br />
per cent), C (between 60 and 69 per cent) and D<br />
(less than 60 per cent). The following conclusions<br />
can be drawn:<br />
1. Of the three large departments, Housing had<br />
allocations only in the fi rst and last years, the<br />
latter being the new scheme under which<br />
low income housing is being constructed<br />
with women being given titles; RDPR has<br />
been consistently above its allocation; the<br />
performance of Social Welfare has improved<br />
over time but with fl uctuations;<br />
2. There are large fl uctuations in the performance<br />
of the majority of departments with swings<br />
between D and A++ being not uncommon;<br />
3. In 2003-04, there were a few A++ performers<br />
while 5-6 departments fared rather badly;<br />
and<br />
4. Interestingly, the expenditure performance<br />
of as many as 15 departments appears to<br />
improve in years when their overall allocation<br />
is high; in only one or two departments does<br />
performance improve when overall allocation<br />
is low; in 9-10 departments, there appears<br />
to be no correlation between increases<br />
or decreases in overall allocation and the<br />
percentage actually spent.<br />
BOX 3.3.2<br />
Categorisation of departments<br />
<br />
<br />
<br />
<br />
Category 1 26 (greater than or equal to Rs.100 crore): Housing, Rural <strong>Development</strong>, Social<br />
Welfare.<br />
Category 2 (between Rs.10 crore and Rs.100 crore): Agriculture, Backward Class Welfare<br />
Department, Employment and Training, Education, Forest, Health and Family Welfare, SC/<br />
ST <strong>Development</strong> Corporation.<br />
Category 3 (between Rs.1 crore and Rs.10 crore): Animal Husbandry, Horticulture, Industries<br />
and Commerce, Backward Class <strong>Development</strong> Corporation, Sports and Youth Services,<br />
Scheduled Tribes Welfare Department, <strong>Karnataka</strong> Milk Federation, Minorities Welfare<br />
Department, Watershed <strong>Development</strong> Department, Minorities <strong>Development</strong> Corporation.<br />
Category 4 (less than Rs.1.0 crore): Cooperation, Disabled Welfare, Fisheries, Handloom<br />
and Textiles, Sericulture.<br />
Such performance may be related to three<br />
factors: greater effort at spending on women by<br />
the relevant department; more women-targeted<br />
schemes becoming available within a department;<br />
or simply more funds becoming available to the<br />
department overall, and this getting translated<br />
into an automatic increase in the 1/3 allocation<br />
for women. The fact that, in a large number of<br />
departments, performance appears to improve<br />
in years when the overall allocation improves<br />
lends credence to the last factor. This is disturbing,<br />
especially when one considers the converse, i.e.<br />
that in years when a department is short of funds,<br />
it cuts spending on women disproportionately.<br />
Expenditure for women appears to get crowded<br />
out in the lean fi nancial years. Given the current<br />
26<br />
In any of the fi ve years considered.<br />
69
Financing <strong>Human</strong> <strong>Development</strong><br />
Sl.<br />
No.<br />
Name of<br />
Department<br />
TABLE 3.3.3<br />
<strong>Karnataka</strong> Mahila Abhivrudhi Yojane - Targets and achievements (Department-wise): 1999-2004<br />
(Rs. lakh)<br />
A - Actual expenditure out of 1/3rd allocation for women “A” as % of 1/3 rd allocation for women “A” as % of total department allocation<br />
1999-2000 2000-01 2001-02 2002-03 2003-04 1999-2000 2000-01 2001-02 2002-03 2003-04 1999-2000 2000-01 2001-02 2002-03 2003-04<br />
1 Agriculture 1180.06 761.61 992.44 658.03 809.71 90 72 70 73 100 30 24 23 24 33<br />
2 Animal Husbandry 133.55 82.60 65.33 118.03 53.53 78 62 41 147 56 26 21 14 49 19<br />
and Veterinary Services<br />
3 Backward Classes 1408.46 1221.99 1289.16 1213.09 1286.40 95 63 59 50 49 32 21 20 17 16<br />
Welfare<br />
4 Cooperation 60.83 156.18 55.41 55.78 29.80 72 102 64 65 71 24 34 21 22 24<br />
5 Disabled Welfare 61.07 65.97 24.00 66.55 27.99 79 87 30 90 73 26 29 10 30 24<br />
6 Employment and 1050.33 1549.30 524.12 477.09 664.08 75 87 77 71 100 25 29 26 24 33<br />
Training<br />
7 Education 2002.85 2790.07 3939.48 11645.91 9751.18 97 99 94 275 99 32 33 31 92 33<br />
8 Fisheries 12.62 6.88 8.00 3.60 4.98 84 59 97 100 82 28 20 32 33 27<br />
9 Forest 2863.21 1692.14 2271.52 1196.08 1624.26 107 65 116 56 81 36 22 39 19 27<br />
10 Handloom and Textiles 11.33 22.99 24.86 19.57 23.70 35 99 59 59 61 12 33 20 20 20<br />
11 Horticulture 149.09 184.94 276.79 288.08 180.26 29 129 48 56 95 10 43 16 19 32<br />
12 Housing 2022.31 - - - 29215.09 117 - - - 77 39 - - - 26<br />
13 Health and Family 3106.21 3665.55 908.82 1972.8 1145.04 75 90 52 70 68 25 30 17 23 23<br />
Welfare Services<br />
14 Industries and<br />
212.04 7902.09 14704.07 69.80 56.84 68 58 85 115 113 23 19 28 38 38<br />
Commerce<br />
(Table 3.3.3 Contd...)<br />
70
<strong>Karnataka</strong> <strong>Human</strong> <strong>Development</strong> <strong>Report</strong> <strong>2005</strong><br />
(Table 3.3.3 Contd...)<br />
(Rs. lakh)<br />
Sl.<br />
No.<br />
Name of<br />
Department<br />
15 <strong>Karnataka</strong> Backward<br />
Classes <strong>Development</strong><br />
Corporation<br />
16 <strong>Karnataka</strong> Minorities<br />
<strong>Development</strong> Corpn.<br />
17 <strong>Karnataka</strong> SC/STs<br />
<strong>Development</strong> Corpn.<br />
18 Municipal<br />
Administration<br />
A - Actual expenditure out of 1/3rd allocation for women “A” as % of 1/3 rd allocation for women “A” as % of total department allocation<br />
1999-2000 2000-01 2001-02 2002-03 2003-04 1999-2000 2000-01 2001-02 2002-03 2003-04 1999-2000 2000-01 2001-02 2002-03 2003-04<br />
211.65 333.71 256.52 1906.76 751.79 40 69 36 158 88 13 23 12 53 29<br />
80.41 111.54 93.28 134.49 212.8 30 33 20 32 53 10 11 7 11 18<br />
994.33 1245.17 982.46 1137.41 5708.7 95 101 64 55 139 32 34 21 18 46<br />
- 842.2 1294.29 1958.91 532.84 - 56 87 60 190 - 19 29 20 63<br />
19 Rural <strong>Development</strong> 9257.33 9333.98 12949.04 12645.7 17658.86 102 114 156 152 188 34 38 52 51 63<br />
20 Social Welfare (SCs) 8490.9 11431.67 12021.85 10067.7 10223.85 63 81 88 69 79 21 27 29 23 26<br />
21 Sericulture 51.43 34.04 70.08 57.74 65.58 78 60 65 70 59 26 20 22 23 20<br />
22 Sports and Youth 103.73 123.59 103.11 91.71 96.75 76 102 80 94 98 25 34 27 31 33<br />
Services<br />
23 Scheduled Tribes 433.65 837.59 773.79 624.66 415.65 66 116 84 81 55 22 39 28 27 18<br />
Welfare<br />
24 <strong>Karnataka</strong> Milk 109.71 51.4 75.27 150.94 217.96 70 43 35 46 109 23 14 12 15 36<br />
Federation<br />
25 Minorities Welfare - 62.69 122.08 128.28 108.92 - 77 85 92 87 - 26 28 31 29<br />
26 Watershed - - 457.26 434.33 224.8 - - 29 26 80 - - 10 9 27<br />
Total 34007.1 44509.8 54283.03 47123.04 81091.38 81 81 91 107 95 27 27 30 36 32<br />
Source: Department of Women and Child <strong>Development</strong>, Progress <strong>Report</strong>s under <strong>Karnataka</strong> Mahila Abhivrudhi Yojane.<br />
71
Financing <strong>Human</strong> <strong>Development</strong><br />
situation of straitened fi scal circumstances for<br />
the state, this is particularly problematic in the<br />
scenario (see chapter 8) of a growing work and<br />
income crisis for women, especially in the poorer<br />
regions of the state. Thus, although overall, KMAY<br />
is a valuable beginning, its real potential is still<br />
untapped.<br />
Recommendations<br />
<br />
<br />
The state must start on the process of<br />
institutionalising a gender audit unit, either<br />
in WCD department or in the Planning<br />
Department. This would mean identifi cation<br />
of objectives, developing a gender<br />
disaggregated database for analysis and<br />
putting monitoring mechanisms in place.<br />
KMAY should be independently evaluated<br />
to assess the extent to which women have<br />
benefi ted from this initiative.<br />
<br />
<br />
The current monitoring system focuses almost<br />
entirely on fi nancial and physical numbers.<br />
This may have been necessary when KMAY<br />
was fi rst put in place, but it is now time to<br />
start looking at the quality of outcomes.<br />
There is little evidence to suggest that<br />
KMAY seriously looks at indicators that refl ect<br />
women’s socio-economic status (e.g. work<br />
participation rate, MMR and IMR, female<br />
literacy, girls’ enrolment and retention in<br />
schools, women in Panchayat institutions or<br />
the specifi c problems of women from the<br />
minorities or SC and ST women). As the<br />
nodal department for a gender responsive<br />
administration, WCD must periodically<br />
review women’s status in all sectors and<br />
motivate departments to either step up their<br />
interventions or devise new programmes to<br />
address issues that have now surfaced.<br />
72
Income, Employment and Poverty
Women Work Participation Rate 2001 (%)<br />
North<br />
<strong>Karnataka</strong><br />
26.2<br />
South<br />
<strong>Karnataka</strong><br />
34.9<br />
28.5<br />
33.3<br />
34.7<br />
32.7<br />
37.7<br />
28.6<br />
38.9<br />
35.9<br />
27.8<br />
33.7<br />
30.1<br />
37.7<br />
28.0<br />
33.9 30.9<br />
41.3 39.0<br />
41.7<br />
39.7<br />
33.9<br />
34.7<br />
Bangalore Urban<br />
18.7<br />
36.2<br />
25.3<br />
31.1
CHAPTER 4<br />
Income, Employment and Poverty<br />
Introduction<br />
Poverty has received special policy focus among<br />
the international development goals accepted by<br />
the UN member countries on the eve of the new<br />
millennium. In fact, it is the fi rst and foremost<br />
goal specifi ed in the Millennium <strong>Development</strong><br />
Goals. The goal is to reduce poverty by half<br />
between the base year 1990, and the reference<br />
year, 2015. What is most important here is the<br />
explicit recognition that poverty has multiple<br />
dimensions, with implications for opportunities,<br />
security and empowerment. Any discussion<br />
on poverty during the new millennium must,<br />
therefore, focus on the different dimensions of<br />
deprivation and their policy implications before<br />
attempting to evaluate policy efforts to deal<br />
with them. This chapter will highlight issues<br />
relating to poverty, income and employment in<br />
<strong>Karnataka</strong> along with policy efforts to deal with<br />
these issues.<br />
Income distribution and<br />
income poverty: Institutional<br />
parameters<br />
Income and consumption distribution, and<br />
the incidence of income poverty depend on<br />
the distribution of assets and employment<br />
opportunities for utilising the only endowment of<br />
the asset-less rural poor, i.e. labour, and its price,<br />
viz. real wage rate. Hence, this section will examine<br />
the situation in rural <strong>Karnataka</strong> with respect to<br />
these factors that have critical implications for<br />
income distribution and poverty.<br />
The sectoral distribution of state income shows a<br />
decline in the share of the primary sector from<br />
38.10 per cent in 1993-94 to 20.90 per cent<br />
in 2003-04. The secondary sector’s share<br />
has increased marginally, from 24 per cent in<br />
1993-94 to 25.5 per cent in 2003-04. There<br />
is, however, a signifi cant increase in the share of<br />
the tertiary sector, with 37.9 per cent in 1993-94<br />
increasing to nearly 54 per cent in 2003-04,<br />
contributing to more than half of the state’s<br />
income.<br />
TABLE 4.1<br />
Sectoral shares of Net State Domestic Product (at 1993-94 prices)<br />
Sector<br />
The average area of operational holdings 1<br />
in <strong>Karnataka</strong> in 1991-92 was 1.85 hectare<br />
(ha.), which was higher than the all-India<br />
estimate of 1.34 ha. The extent of inequality<br />
in the distribution of operational holdings, as<br />
measured by the Gini ratio, was 0.609 (0.641)<br />
in rural <strong>Karnataka</strong> (all-India). Available estimates<br />
indicate an increase in the extent of inequality<br />
between three time-points in rural <strong>Karnataka</strong><br />
as well as in rural all-India (Table 4.2).<br />
During the same period, the percentage of<br />
marginal holdings increased from 28.76<br />
per cent (45.77 per cent) to 38.40 per cent (56.00<br />
per cent), and fi nally, to 49.71 per cent (62.79<br />
per cent) in rural <strong>Karnataka</strong> (rural all-India);<br />
the corresponding estimates of area operated<br />
were 5.10 per cent (9.21 per cent), 5.80<br />
per cent (11.50 per cent) and 9.56 per cent<br />
(15.60 per cent) respectively (NSSO 1997).<br />
The distributional perspective indicates that<br />
the percentage of tenant holdings is low in<br />
<strong>Karnataka</strong> (8.0 per cent in 1991-92) relative<br />
to the all-India level (11.0 per cent) (NSSO<br />
1997). This is an outcome of the land reforms<br />
implemented in the 1980s. However, from<br />
the perspective of vulnerability (a major focus<br />
of any debate on deprivation), the percentage<br />
Share in NSDP (per cent)<br />
1993-94 2003-04<br />
Primary sector 38.10 20.90<br />
Secondary sector 24.00 25.50<br />
Tertiary sector 37.90 53.60<br />
Source: Directorate of Economics and Statistics, <strong>Karnataka</strong>.<br />
1 The NSS defi nes an operational holding as a techno-economic<br />
unit used wholly or partly for agricultural production and<br />
operated (directed/managed) by one person alone, or with the<br />
assistance of others, without regard to title, size or location. The<br />
unit may consist of one or more parcels of land and would be<br />
comprehensive with respect to land, agricultural equipments,<br />
machinery and draught animals etc.<br />
Poverty is the first and<br />
foremost goal specified<br />
in the Millennium<br />
<strong>Development</strong> Goals.<br />
75
Income, Employment and Poverty<br />
TABLE 4.2<br />
Changes in Gini Coefficient of operational holdings in 15 major states<br />
State Gini Coefficient Average area (ha.)<br />
1970-71 1981-82 1991-92 1991-92<br />
Andhra Pradesh 0.603 0.599 0.576 1.29<br />
Assam 0.422 0.519 0.494 0.88<br />
Bihar 0.556 0.606 0.637 0.75<br />
Gujarat 0.540 0.558 0.604 1.99<br />
Haryana 0.464 0.598 0.675 2.19<br />
<strong>Karnataka</strong> 0.527 0.581 0.609 1.85<br />
Kerala 0.647 0.649 0.636 0.35<br />
Madhya Pradesh 0.533 0.535 0.558 2.24<br />
Maharashtra 0.526 0.571 0.598 2.25<br />
Orissa 0.501 0.526 0.514 1.13<br />
Punjab 0.418 0.702 0.730 1.46<br />
Rajasthan 0.564 0.604 0.613 3.08<br />
Tamil Nadu 0.516 0.640 0.646 0.71<br />
Uttar Pradesh 0.495 0.565 0.572 1.01<br />
West Bengal 0.490 0.597 0.585 0.60<br />
India 0.586 0.629 0.641 1.34<br />
Source: Government of India (1997): Land and Livestock Holdings Survey NSS Forty-Eighth Round (January – December<br />
1992) <strong>Report</strong> 2 Operational Land Holdings in India 1991-92 Salient Features, National Sample Survey<br />
Organisation, Department of Statistics, Ministry of Planning and Programme Implementation, New Delhi; p. 26.<br />
BOX 4.1<br />
Major features of occupational categories<br />
1. Agricultural labour households constitute the largest segment and account for 40 per cent<br />
of the total population in rural <strong>Karnataka</strong>. The average level of consumption of this segment<br />
is the lowest. The extent of relative inequality in consumption is also low. Accordingly, the<br />
incidence of poverty among agricultural labour households is the highest across different<br />
occupational groups. Variations in real wages and district poverty estimates are closely<br />
interlinked, providing good inputs for strategies for improving the levels of living of the<br />
poor.<br />
2. The self-employed in agriculture constitute the second largest segment (38 per cent). Its<br />
average consumption level being relatively higher, its incidence of poverty is the second<br />
lowest in rural <strong>Karnataka</strong>. Agricultural labour households, together with the self-employed<br />
in agriculture, constitute the bulk (78 per cent) of the rural population.<br />
3. In urban <strong>Karnataka</strong>, the regular wage/salary earning class constitutes the largest<br />
occupational group. It is also the richest in terms of measures of average consumption and<br />
deprivation; incidence of poverty in this group is a mere 14.43 per cent. Casual labour<br />
households, though accounting for less than a sixth of total urban population, constitute<br />
the poorest segment. Their average consumption is the lowest and more than half of them<br />
are poor.<br />
of irrigated operated area was as low as<br />
19.33 per cent in <strong>Karnataka</strong>, as against the<br />
all-India average of 35.39 per cent in 1991-92<br />
(NSSO 1997). This has serious implications for<br />
agricultural production and productivity, as well<br />
as for poverty and deprivation.<br />
Consumption pattern by occupation<br />
The economic profi le of the population by different<br />
occupational categories, their relative importance<br />
and their differential participation in the growth<br />
process provides invaluable inputs for poverty<br />
reduction policies. Such a profi le can be explained<br />
with the help of important measures of the quality<br />
of life such as monthly per capita consumer<br />
expenditure (MPCE), incidence of poverty and<br />
relative inequality in levels of living. The relative<br />
importance of each occupational group from<br />
the perspective of equity can be assessed with<br />
reference to its relative size, i.e. its percentage<br />
share in the total population. Estimates of all<br />
the relevant parameters are provided in Table<br />
4.3. Some major features of the profi les by<br />
occupational categories are presented in Box 4.1.<br />
Rate of growth and regional<br />
disparities<br />
<strong>Karnataka</strong>’s economy grew at the rate of 4.8<br />
per cent per annum during the decade of the<br />
1980s, i.e. at a rate less than the all-India average<br />
of 5.4 per cent (World Bank, 2002c). However, its<br />
growth rate picked up in the 1990s when it reached<br />
6.9 per cent and exceeded the all-India average<br />
(6.1 per cent).<br />
Between 1993-94 and 2003-04, the state’s<br />
manufacturing and service sectors grew at 7.50<br />
and 10.61 per cent respectively (Table 4.4), while<br />
the primary sector grew at a relatively lower rate<br />
of 0.61 per cent per annum. During this period,<br />
the economy as a whole grew at a rate of 6.84<br />
per cent per annum and the average growth rate<br />
of per capita income has been commendable at<br />
5.30 per cent per annum.<br />
Consequently, <strong>Karnataka</strong>’s share in the total<br />
GDP of the nation increased from 4.8 per cent<br />
in 1990-91 to 5.22 per cent in 2001-02 (GoK,<br />
Economic Survey 2002-03). In 2002-03, the<br />
76
Household<br />
type<br />
<strong>Karnataka</strong> <strong>Human</strong> <strong>Development</strong> <strong>Report</strong> <strong>2005</strong><br />
TABLE 4.3<br />
Levels of living, inequality and poverty by occupational groups: <strong>Karnataka</strong> and all-India (1999-2000)<br />
Self-employed<br />
non-agriculture<br />
Share in<br />
total<br />
population<br />
(%)<br />
Average<br />
per capita<br />
consumption<br />
(Rs./month)<br />
Proportion of<br />
poor<br />
population<br />
(%)<br />
Relative<br />
inequality in<br />
consumption<br />
-distribution<br />
(Lorenz ratio<br />
%)<br />
Share in<br />
total<br />
population<br />
(%)<br />
Average<br />
per capita<br />
consumption<br />
(Rs./month)<br />
Proportion<br />
of<br />
poor<br />
population<br />
(%)<br />
Relative<br />
inequality in<br />
consumption<br />
distribution<br />
(Lorenz ratio<br />
%)<br />
Rural <strong>Karnataka</strong><br />
Rural all-India<br />
10.38 593.04 13.22 27.36 13.82 502.28 23.78 25.51<br />
Agri. labour 40.08 411.28 25.05 19.72 31.05 385.98 41.46 22.22<br />
Other labour 4.61 488.05 19.89 23.66 7.39 482.74 27.01 25.69<br />
Self-employed 37.68 533.22 12.57 23.53 37.71 519.53 20.43 25.31<br />
agriculture<br />
Others 7.20 687.68 5.50 26.68 9.85 652.05 13.76 29.26<br />
All 100.00 499.60 18.08 24.48 100.00 485.88 27.73 26.58<br />
Urban <strong>Karnataka</strong><br />
Urban all-India<br />
Self-employed 34.49 847.90 27.91 30.59 39.09 812.96 27.46 35.00<br />
Regular wage/ 41.35 1081.97 14.43 31.42 39.86 981.49 13.01 31.16<br />
salary earning<br />
Casual labour 16.90 541.29 52.98 23.23 14.28 540.66 50.51 30.00<br />
Others 7.06 1101.20 15.17 34.42 6.42 1030.82 17.45 36.23<br />
All 100.00 910.78 25.83 62.75 100.00 854.70 24.58 34.68<br />
Notes:<br />
1. Estimates of different measures are based on data from Government of India (2001e): Differences in Level of Consumption among Socio-Economic Groups 1999-2000, National Sample<br />
Survey Organisation, New Delhi.<br />
2. Estimates of rural and urban poverty correspond to the Government of India Expert Group Poverty Lines per month at current prices for the year 1999-2000 as follows: Rs. 309.59 (Rural<br />
<strong>Karnataka</strong>), Rs. 327.56 (Rural all-India), Rs. 511.44 (Urban <strong>Karnataka</strong>) and Rs. 454.11 (Urban all-India) published in Government of India (2001d): Poverty Estimates for 1999-2000,<br />
Press Information Bureau, New Delhi.<br />
3. These estimates of poverty are made with reference to mean consumption, poverty line and parameters of the Lorenz curve.<br />
4. The estimates of aggregate poverty (all households) for rural/urban <strong>Karnataka</strong> differ from those presented in Table 4.9 because of differences in methodology.<br />
per capita State Domestic Product at current<br />
prices (Rs.19,865) was higher than the national<br />
average (Rs.18,912) (GoK, Economic Survey<br />
2004-05).<br />
<strong>Karnataka</strong> is marked by strong regional disparities.<br />
Bangalore Urban and Dakshina Kannada emerged<br />
as the most developed districts in 1980-81<br />
(Iyengar and Sudarshan, 1983) with Kodagu,<br />
Shimoga, Dharwad and Belgaum following<br />
closely behind. Bellary, Mandya, Chikmaglur,<br />
Mysore, Chitradurga, Uttara Kannada and Kolar<br />
were in the developing category. Hassan, Tumkur<br />
and Bijapur were the backward districts. Three<br />
Hyderabad <strong>Karnataka</strong> districts, viz. Raichur, Bidar<br />
and Gulbarga, emerged as the most backward<br />
districts of <strong>Karnataka</strong>. By 2001-02, Bangalore<br />
Urban, Kodagu, Dakshina Kannada, Bangalore<br />
Rural, Udupi, Mysore and Chikmaglur were<br />
generating a per capita domestic product higher<br />
than the state average (Table 4.5). The city of<br />
Bangalore alone contributed about 22 per cent<br />
of the state income; Bangalore Rural and Urban<br />
districts together generated a quarter of the state<br />
income. These two districts share nearly 16 per cent<br />
of the state’s population in 2001. Bijapur, along<br />
with the Hyderabad <strong>Karnataka</strong> triumvirate of<br />
Bidar, Gulbarga and Raichur continued to be<br />
in the poorest quartile in terms of per capita<br />
domestic product. The pattern of growth over two<br />
77
Income, Employment and Poverty<br />
TABLE 4.4<br />
Net Domestic Product at factor cost by industry of origin (at 1993-94 prices)<br />
Industry Primary Secondary Tertiary Total NSDP Per capita NSDP<br />
Year (Rs. lakh) Growth rate<br />
(% per<br />
annum)<br />
(Rs. lakh)<br />
Growth rate<br />
(% per<br />
annum)<br />
(Rs. lakh)<br />
Growth rate<br />
(% per<br />
annum)<br />
(Rs. lakh)<br />
Growth rate<br />
(% per<br />
annum)<br />
1993-94 1408934 887568 1401726 3698229 7838<br />
(Rs.)<br />
Growth rate<br />
(% per<br />
annum)<br />
1994-95 1399646 -0.66 959367 8.09 1532692 9.34 3891705 5.23 8097 3.30<br />
1995-96 1428078 2.03 982761 2.44 1686550 10.04 4097390 5.29 8368 3.35<br />
1996-97 1497911 4.89 1076722 9.56 1899022 12.60 4473655 9.18 8990 7.44<br />
1997-98 1458813 -2.61 1205367 11.95 2087502 9.93 4751682 6.21 9416 4.73<br />
1998-99 1624978 11.39 1456045 20.80 2315069 10.90 5396093 13.56 10549 12.04<br />
1999-2000 1782517 9.69 1325530 -8.96 2546280 9.99 5654327 4.79 10912 3.44<br />
2000-01 2007800 12.63 1370200 3.36 2880000 13.10 6258100 10.67 11939 9.41<br />
2001-02 1704100 -15.13 1538900 12.31 3155200 9.55 6298200 2.23 12029 0.75<br />
2002-03 1585400 -6.97 1702600 10.63 3453600 9.45 6741600 5.36 12518 4.06<br />
2003-04 1497000 -5.58 1828400 7.38 3841700 11.23 7167200 6.31 13141 4.97<br />
(Q.E.)<br />
Average<br />
Annual<br />
Growth*<br />
0.61 7.50 10.61 6.84 5.30<br />
Note: * Compound growth rate.<br />
Source: Directorate of Economics and Statistics, <strong>Karnataka</strong>.<br />
An encouraging trend is<br />
the fact that out of the<br />
seven districts which have<br />
experienced growth rates<br />
higher than the state<br />
average, Koppal, Gadag,<br />
Haveri and Bagalkot are<br />
in north <strong>Karnataka</strong>.<br />
decades indicates a stratifi cation of districts based<br />
on geographic location, with the northern districts<br />
consistently performing poorly. This has serious<br />
implications for the distribution of poverty across<br />
districts.<br />
Labour productivity: Regional<br />
dimensions<br />
Estimates of the level of labour productivity and<br />
its growth are important indicators of poverty<br />
and human development. They measure the<br />
potential for improvement in the quality of life<br />
of the people. Estimates of labour productivity<br />
for all the 27 districts for the year 2000-01<br />
(Table 4.6) reveal that labour productivity was<br />
highest in Bangalore Urban district, followed by<br />
Kodagu and Dakshina Kannada districts in 1991,<br />
and these districts retained their ranking in 2001<br />
as well (except Kodagu). It may be noted that all<br />
districts (except Dharwad) in north <strong>Karnataka</strong><br />
had labour productivity below the state average<br />
in 1991 and 2001. While Haveri district had the<br />
lowest labour productivity in 1991, followed by<br />
Tumkur and Koppal districts, in 2001 Raichur<br />
had the lowest labour productivity, followed by<br />
Tumkur and Haveri districts. The relative ranking<br />
of Raichur district has come down from 17 in<br />
1991 to 27 in 2001. The annual compound<br />
growth of labour productivity was the highest in<br />
Bangalore Rural, followed by Bangalore Urban<br />
between 1991 and 2001. Other districts which<br />
have growth rates higher than the state average<br />
(5.30) are Koppal, Mysore, Gadag, Haveri and<br />
Bagalkot. An encouraging trend is the fact that<br />
out of the seven districts which have experienced<br />
growth rates higher than the state average,<br />
Koppal, Gadag, Haveri and Bagalkot are in north<br />
<strong>Karnataka</strong>.<br />
Migration<br />
According to the NSS data on migration for<br />
the year 1999-2000, about 27 per cent of the<br />
state’s population is migrant. The proportion of<br />
migration in urban <strong>Karnataka</strong> is 33 per cent as<br />
78
<strong>Karnataka</strong> <strong>Human</strong> <strong>Development</strong> <strong>Report</strong> <strong>2005</strong><br />
compared to 26 per cent migrant population in<br />
rural areas. Among the total migrants, female<br />
migrants (77 per cent) outnumber male migrants<br />
(23 per cent) signifi cantly. However, the proportion<br />
of females who migrate for reasons of employment<br />
is signifi cantly lower than males. A high percentage<br />
of migrants, 57.3 per cent of urban and 34.2<br />
per cent of rural migrants, are males who migrated<br />
in search of employment contrasted with only<br />
3.9 per cent urban females and 1.8 per cent<br />
rural females.<br />
Trends in wages and prices<br />
Agricultural labourers constitute the bulk of the<br />
rural poor in <strong>Karnataka</strong>. Their endowment of<br />
assets is virtually nil; hence, their level of living<br />
depends upon their income earning potential,<br />
as refl ected in the available employment<br />
opportunities and real wages for unskilled labour.<br />
Available estimates indicate that average real<br />
wages (i.e. nominal wages adjusted for increase<br />
in cost-of-living reported by the Consumer<br />
Price Index for Agricultural Labourers) in rural<br />
<strong>Karnataka</strong> in December 2004 exceeded the level<br />
in the agricultural year (AY) 1993-94 by about<br />
47 per cent for men and 35.4 per cent for women<br />
respectively (Table 4.7). When compared with the<br />
base period of 1993-94, real wages for women<br />
are lower by 12 percentage points as compared<br />
to men.<br />
There are wide variations across districts in the<br />
changes in real wages in comparison with the<br />
base period, 1993-94. Dharwad has registered<br />
the highest increase in real wages for men<br />
between 1993-94 and 2003-04 (161 per cent)<br />
followed by Haveri (156 per cent). Kodagu has<br />
experienced negative changes in real wages for<br />
men, while Kolar and Mandya have experienced<br />
no change in real wages for men. Changes in<br />
real wages for women during this period are the<br />
highest in Haveri district (203 per cent), followed<br />
by 100.56 per cent in Dharwad, while Mandya has<br />
experienced negative changes. The above analysis<br />
shows that real wages for men have increased<br />
substantially more than the wages for women<br />
during the period from 1993-94 to December<br />
2004. This trend is discussed in greater detail in<br />
the chapter on gender.<br />
TABLE 4.5<br />
Estimates of Net District Domestic Product at current prices: 2001-02<br />
District<br />
Net District<br />
Domestic Product<br />
(Rs. lakh)<br />
Income deprivation<br />
A crucial aspect of material deprivation is income<br />
deprivation, which is examined in terms of<br />
estimates of poverty based on the National Sample<br />
Survey on household consumer expenditure<br />
distribution, which is generally used as a proxy for<br />
income distribution.<br />
Per capita<br />
NDDP (Rs.)<br />
Share in state NSDP<br />
(per cent)<br />
Bagalkot 261180 15638 2.8<br />
Bangalore Urban 2097138 31804 22.5<br />
Bangalore Rural 414126 21821 4.4<br />
Belgaum 642472 15106 6.9<br />
Bellary 323854 15819 3.5<br />
Bidar 168077 11075 1.8<br />
Bijapur 239266 13085 2.5<br />
Chamarajnagar 135296 13880 1.4<br />
Chikmaglur 220799 19175 2.3<br />
Chitradurga 207120 13567 2.2<br />
Dakshina Kannada 524735 27373 5.6<br />
Davangere 254300 14056 2.7<br />
Dharwad 273630 16878 2.9<br />
Gadag 137685 14013 1.5<br />
Gulbarga 380602 12049 4.1<br />
Hassan 240021 13794 2.5<br />
Haveri 174367 11996 1.9<br />
Kodagu 133400 24200 1.4<br />
Kolar 345638 13550 3.7<br />
Koppal 183016 15170 2.0<br />
Mandya 244670 13739 2.6<br />
Mysore 478344 18027 5.1<br />
Raichur 182772 10970 2.0<br />
Shimoga 278223 16787 3.0<br />
Tumkur 337555 12945 3.7<br />
Udupi 236505 21087 2.6<br />
Uttara Kannada 223493 16337 2.4<br />
<strong>Karnataka</strong> 9338282 17518 100.00<br />
Source: State Domestic Product 2001-02, Directorate of Economics and Statistics, <strong>Karnataka</strong>, 2003, Bangalore, p. 62.<br />
79
Income, Employment and Poverty<br />
TABLE 4.6<br />
Estimates of Gross Domestic Product per worker<br />
(at 1993-94 prices)<br />
Districts 1990-91<br />
(Rs.)<br />
2000-01<br />
(Rs.)<br />
Growth rate<br />
(per cent per annum)<br />
Bagalkot 15498 26821 5.64<br />
Bangalore Urban 32691 63641 6.89<br />
Bangalore Rural 14197 36454 9.89<br />
Belgaum 16494 25106 4.29<br />
Bellary 16845 27328 4.96<br />
Bidar 13041 20833 4.80<br />
Bijapur 15914 23147 3.82<br />
Chamarajnagar 14717 22137 4.17<br />
Chikmaglur 21362 29703 3.35<br />
Chitradurga 14496 21478 4.01<br />
Dakshina Kannada 29034 41893 3.73<br />
Davangere 15584 23058 4.00<br />
Dharwad 20009 29724 4.04<br />
Gadag 12653 22764 6.05<br />
Gulbarga 13095 20159 4.41<br />
Hassan 14017 20653 3.95<br />
Haveri 10645 18922 5.92<br />
Kodagu 32280 38983 1.90<br />
Kolar 13804 19867 3.71<br />
Koppal 12459 23677 6.63<br />
Mandya 13749 20996 4.32<br />
Mysore 17300 31494 6.17<br />
Raichur 14434 17232 1.79<br />
Shimoga 18605 28181 4.24<br />
Tumkur 12182 18628 4.34<br />
Udupi 23824 35544 4.08<br />
Uttara Kannada 18860 28342 4.16<br />
<strong>Karnataka</strong> 17604 29509 5.30<br />
Note: The concept ‘worker’ includes both main and marginal workers.<br />
Source: Government of <strong>Karnataka</strong> (2003): State Domestic Product 2001-02, Directorate of Economics and Statistics,<br />
Bangalore.<br />
Estimates reveal a reduction in the number<br />
of the poor from 156.45 lakh in 1993-94 to<br />
104.40 lakh in 1999-2000 in <strong>Karnataka</strong>, i.e. by<br />
about 33 per cent (Table 4.8). This performance<br />
is much better than the all-India reduction by<br />
18.8 per cent (from 3,203.68 lakh to 2,602.50<br />
lakh) during the same period. As a proportion<br />
of the population, poverty in <strong>Karnataka</strong> declined<br />
from 33.16 to 20.04 per cent (reduction of about<br />
13 percentage points) as against the all-India<br />
decline from 35.97 to 26.10 per cent (reduction<br />
of 10 percentage points) during the same period.<br />
As a result of economic growth and the poverty<br />
reduction strategies of the government, the state<br />
is moving towards achieving the Millennium<br />
<strong>Development</strong> Goals. The government must,<br />
however, ensure that the process of growth and<br />
poverty alleviation policies continues and the<br />
disparities of caste, gender and region addressed<br />
at the grassroots level.<br />
Table 4.9 shows that in 1993-94, Kodagu, with<br />
its per capita domestic product of Rs.13,718<br />
was fi rst among all the districts, while in 1999-<br />
2000 Bangalore Urban is fi rst with Rs.25,740.<br />
Bidar continues as the poorest performer in the<br />
list of 20 districts, though its per capita domestic<br />
product increased by 46 per cent during this<br />
period. Head count ratio indicates that in 1993-94,<br />
Bidar had the highest percentage of poor people<br />
(56.1 per cent). Bangalore Rural has seen a<br />
tremendous decline in its head count ratio from<br />
38.2 per cent in 1993-94 to 5.2 per cent in 1999-<br />
2000. One interesting point to note is that in<br />
Raichur, the head count ratio has, indeed, increased<br />
subsequently. This is an important area where state<br />
policy will have to take remedial steps.<br />
Poverty and levels of living by social<br />
groups<br />
This section provides a profi le across different<br />
social groups (Table 4.10). The Scheduled Caste<br />
(SC) households account for about 20 per cent<br />
of the rural population. Together with Scheduled<br />
Tribe (ST) households, they form nearly 28 per cent<br />
of the rural population. These two social categories<br />
have the lowest levels of average consumption<br />
and the highest incidence of poverty. About 25<br />
per cent of their respective populations is poor. In<br />
urban <strong>Karnataka</strong>, the combined population share<br />
of the SCs and STs is about 15 per cent. Nearly<br />
half of these two social categories are poor, whereas<br />
this proportion comes to only a sixth for other<br />
households. Thus, there exists a sharp gap between<br />
these social groups and the rest of the population in<br />
terms of improvements in levels of living.<br />
80
TABLE 4.7<br />
Agricultural wages for men and women: <strong>Karnataka</strong><br />
<strong>Karnataka</strong> <strong>Human</strong> <strong>Development</strong> <strong>Report</strong> <strong>2005</strong><br />
District (Rs. per day at current prices) Change (adjusted for<br />
Men<br />
Women<br />
CPIAL)<br />
1993-94 Dec-2004 Nominal ratio 1993-94 Dec-2004 Nominal ratio<br />
(1993-94 - Dec. 2004)<br />
Bagalkot 21.9 52.78 2.41 14.4 30.08 2.09 35.39 17.42<br />
Bangalore Urban 29.5 81.95 2.78 26.0 68.38 2.63 56.18 47.75<br />
Bangalore Rural 28.3 62.99 2.23 19.1 35.86 1.88 25.28 5.62<br />
Belgaum 20.9 50.62 2.42 15.0 34.94 2.33 35.96 30.9<br />
Bellary 15.6 51.56 3.31 12.9 35.69 2.77 85.96 55.62<br />
Bidar 24.6 74.44 3.03 16.0 30.00 1.88 70.22 5.62<br />
Bijapur 21.9 82.89 3.78 14.4 37.33 2.59 112.36 45.51<br />
Chamarajnagar 26.7 64.93 2.43 16.7 46.50 2.78 36.52 56.18<br />
Chikmaglur 26.8 60.81 2.27 21.4 41.69 1.95 27.53 9.55<br />
Chitradurga 19.8 46.94 2.37 14.0 36.11 2.58 33.15 44.94<br />
Dakshina Kannada 32.9 75.00 2.28 21.6 50.00 2.31 28.09 29.78<br />
Davangere 19.8 47.61 2.40 14.0 37.47 2.68 34.83 50.56<br />
Dharwad 13.6 63.08 4.64 10.4 37.09 3.57 160.67 100.56<br />
Gadag 13.6 42.59 3.13 10.4 36.84 3.54 75.84 98.88<br />
Gulbarga 21.6 55.67 2.58 12.0 30.36 2.53 44.94 42.13<br />
Hassan 17.5 45.63 2.61 14.9 30.56 2.05 46.63 15.17<br />
Haveri 13.6 61.98 4.56 10.4 56.21 5.40 156.18 203.37<br />
Kodagu 29.9 51.33 1.72 26.2 60.00 2.29 -3.34 1.29<br />
Kolar 28.0 49.72 1.78 18.6 42.22 2.27 0.00 27.53<br />
Koppal 19.7 75.90 3.85 10.4 33.16 3.19 116.29 79.21<br />
Mandya 36.5 64.97 1.78 25.4 32.94 1.30 0.00 -26.97<br />
Mysore 26.7 57.22 2.14 16.7 47.22 2.83 20.22 58.99<br />
Raichur 19.7 55.24 2.8 13.4 33.09 2.47 57.3 38.76<br />
Shimoga 21.8 57.20 2.62 17.9 39.67 2.22 47.19 24.72<br />
Tumkur 24.6 53.33 2.17 19.2 35.00 1.82 21.91 2.25<br />
Udupi 32.9 69.00 2.1 21.6 44.45 2.06 17.98 15.73<br />
Uttara Kannada 26.8 70.32 2.62 21.1 61.06 2.89 47.19 62.36<br />
<strong>Karnataka</strong> 22.1 58.00 2.62 15.8 38.00 2.41 47.19 35.39<br />
CPIAL 1105.0 1975 1.78 1105.0 1975 1.78<br />
Notes:<br />
1. CPIAL: Consumer Price Index for Agricultural Labourers (Base: 1960-61).<br />
2. Annual averages refer to the agricultural year July-June.<br />
Source: Directorate of Economics and Statistics, <strong>Karnataka</strong>, Bangalore.<br />
Men<br />
Women<br />
81
Income, Employment and Poverty<br />
State/<br />
Nation<br />
TABLE 4.8<br />
Incidence of poverty: <strong>Karnataka</strong> vs. all-India<br />
No. of<br />
persons<br />
(lakh)<br />
Rural Urban Combined<br />
Proportion<br />
(%)<br />
No. of<br />
persons<br />
(lakh)<br />
Proportion<br />
(%)<br />
No. of<br />
persons<br />
(lakh)<br />
Proportion<br />
(%)<br />
1973-74<br />
<strong>Karnataka</strong> 128.40 55.14 42.27 52.53 170.67 54.47<br />
All-India 2612.90 56.44 600.46 49.01 3213.36 54.88<br />
1977-78<br />
<strong>Karnataka</strong> 120.39 48.18 47.78 50.36 168.17 48.78<br />
All-India 2642.47 53.07 646.48 45.24 3288.95 51.32<br />
1983-84<br />
<strong>Karnataka</strong> 100.50 36.33 49.31 42.82 149.81 38.24<br />
All-India 2519.57 45.65 709.40 40.79 3228.97 44.48<br />
1987-88<br />
<strong>Karnataka</strong> 96.81 32.82 61.80 48.42 158.61 37.53<br />
All-India 2318.79 39.09 751.69 38.20 3070.48 38.86<br />
1993-94<br />
<strong>Karnataka</strong> 95.99 29.88 60.46 40.14 156.45 33.16<br />
All-India 2440.31 37.27 763.37 32.36 3203.68 35.97<br />
1999-2000<br />
<strong>Karnataka</strong> 59.91 17.38 44.49 25.25 104.40 20.04<br />
All-India 1932.43 27.09 670.07 23.62 2602.50 26.10<br />
Note: The estimates of poverty are obtained as per the methodology recommended by the Lakdawala Committee<br />
(Government of India (1993): <strong>Report</strong> of the Expert Group on Estimation of Proportion and Number of Poor,<br />
Perspective Planning Division, Planning Commission, New Delhi).<br />
Sources:<br />
1. Government of India (2001c).<br />
2. Government of <strong>Karnataka</strong> (1999).<br />
In <strong>Karnataka</strong>, about<br />
23 per cent<br />
of the rural child<br />
population lives in poor<br />
households while the<br />
incidence of urban child<br />
poverty is one and a half<br />
times that of the rural<br />
areas.<br />
Among the remaining social groups, ‘Other<br />
Backward Communities’ (OBCs) constitute<br />
39 per cent of the rural population, of whom<br />
16 per cent are below the poverty line, which<br />
is signifi cantly lower than the proportion of poor<br />
among the SCs and STs. In urban <strong>Karnataka</strong><br />
OBCs constitute about 31 per cent of the urban<br />
population and nearly 30 per cent of them are<br />
poor – a proportion almost double that of their<br />
rural counterparts.<br />
Child poverty<br />
A subset of the poor that calls for policy attention<br />
with regard to all the multiple parameters of<br />
deprivation is that of ‘children under 15’. Child<br />
poverty will have a lasting adverse impact on<br />
the ground reality as well as potential for human<br />
development of both, the individual and society.<br />
Children from poor households perform poorly<br />
relative to those from non-poor households with<br />
respect to food security, health and education.<br />
Therefore, estimates of the incidence of child<br />
poverty are useful in that they indicate the<br />
percentage of children living in misery with<br />
a bleak future. Hence, this parameter has<br />
policy implications in terms of policy design,<br />
regional targeting and budgetary support. Some<br />
estimates of the magnitude of child poverty<br />
in rural and urban <strong>Karnataka</strong> are presented in<br />
Table 4.11.<br />
Poverty is defi ned and estimated with reference to<br />
consumption which is measured at the household<br />
level. In other words, child poverty could be<br />
defi ned as the proportion of children living in<br />
consumption-poor households. Estimates for<br />
the year 1999-2000 show that the incidence of<br />
child poverty is about the same in both rural and<br />
urban sectors, across India as a whole. However,<br />
the incidence of child poverty in urban areas is<br />
twice that of the rural levels in Andhra Pradesh<br />
and Kerala. In <strong>Karnataka</strong>, about 23 per cent<br />
of the rural child population lives in poor<br />
households while the incidence of urban child<br />
poverty is one and a half times that of the rural<br />
areas (Table 4.11).<br />
Child labour<br />
Child labour is a manifestation of household<br />
poverty, which is exploited by employers who<br />
do not wish to pay adult wages. Child labour<br />
is a violation of child as well as human rights.<br />
It stunts the development of the child during<br />
his/her crucial learning years and leads to<br />
irreparable physical and psychological damage,<br />
impairing for life, his/her opportunities for<br />
social mobility. Child labour also creates a<br />
vicious cycle of illiteracy and low income, while<br />
simultaneously depriving adults of employment<br />
and higher wages. The prevalence of child labour<br />
also deprives the nation of an educated, skilled<br />
and productive workforce which could form the<br />
basis of rapid economic growth. Thus, employing<br />
children robs them of their childhood and stunts<br />
the growth of the nation.<br />
82
<strong>Karnataka</strong> <strong>Human</strong> <strong>Development</strong> <strong>Report</strong> <strong>2005</strong><br />
The absolute number of child labour in India<br />
was estimated to be about 12.59 million, 2 with<br />
a labour force participation rate of more than 5<br />
per cent according to the 2001 census, with<br />
<strong>Karnataka</strong> contributing 8.23 lakh as compared to<br />
9.76 lakh child labour in 1991. However, when<br />
compared to the neighbouring states of Andhra<br />
Pradesh, Tamil Nadu and Kerala, it is evident that<br />
<strong>Karnataka</strong> has the second highest child work<br />
participation rate of 13.9 per cent, next only to<br />
Andhra Pradesh, which has 17.8 per cent.<br />
If enrolment and dropout data for the past seven<br />
years, based on the Education Department’s<br />
statistics are considered (1996-97 to 2003-04), a<br />
total of 97.9 lakh children were enrolled in class I<br />
over the last seven years, and 18.39 lakh children<br />
dropped out, which constitutes 18.78 per cent<br />
of the total children enrolled. In addition, 45.54<br />
per cent of children failed to complete eight years<br />
of compulsory schooling. If we go by the defi nition<br />
that ‘any child out of school is a child labourer’,<br />
then 45 per cent of the children in <strong>Karnataka</strong> are<br />
child labourers for some period of their childhood<br />
and 18 per cent are child labourers at any given<br />
point of time. Though the percentage of dropouts<br />
may be decreasing, the absolute numbers of<br />
out-of-school children are still large.<br />
According to the National Family Health Survey-<br />
India (1998-99) for <strong>Karnataka</strong>, conducted by the<br />
International Institute for Population Sciences,<br />
cultural attitudes, such as lack of interest in<br />
education or child marriage, accounted for the<br />
main reason, for an average of 43.4 per cent of<br />
the responses, for not enrolling children or taking<br />
them out of school. Poverty related reasons, such<br />
as ‘the child is required to work’ or ‘schooling costs<br />
too much’, accounted for 36.18 per cent of the<br />
responses. School-related reasons, such as ‘the<br />
school is too far away’ or ‘school facilities are not<br />
adequate’ were cited by 10.65 per cent of the<br />
respondents.<br />
TABLE 4.9<br />
District-wise per capita domestic product and incidence of poverty<br />
District 1993-94 1999-2000<br />
Per capita<br />
domestic<br />
product<br />
(Rs. per annum)<br />
Head count<br />
ratio (%)<br />
Per capita<br />
domestic<br />
product<br />
(Rs. per<br />
annum)<br />
Head<br />
count<br />
ratio (%)<br />
Bangalore Urban 12391 31.4 25740 9.9<br />
Bangalore Rural 7786 38.2 12215 5.2<br />
Belgaum 8107 29.9 13377 17.9<br />
Bellary 6491 44.5 12200 33.1<br />
Bidar 5384 56.1 7861 30.4<br />
Bijapur 6563 29.0 10049 32.1<br />
Chikmaglur 10724 15.6 17609 2.3<br />
Chitradurga 6993 39.0 10989 16.3<br />
Dakshina Kannada 9223 8.9 20167 7.4<br />
Dharwad 6781 49.8 10397 21.4<br />
Gulbarga 6430 45.5 9516 26.8<br />
Hassan 6814 14.4 12346 11.5<br />
Kodagu 13718 20.7 24623 4.9<br />
Kolar 6065 48.5 10013 41.9<br />
Mandya 7134 30.2 11081 16.6<br />
Mysore 8036 28.9 14576 15.5<br />
Raichur 5688 25.1 8688 45.6<br />
Shimoga 8357 25.6 13970 8.1<br />
Tumkur 6342 40.6 9011 18.5<br />
Uttara Kannada 7389 25.0 12019 6.7<br />
<strong>Karnataka</strong> 7835 33.2 13621 20.1<br />
Rank Correlation<br />
between per capita<br />
domestic product and<br />
head count ratio<br />
(-) 0.60 (-) 0.77<br />
Note: Poverty estimates have been worked out for the year 1999-2000 for erstwhile 20 districts only for the purpose of<br />
comparison with 1993-94 estimates.<br />
Sources:<br />
1. Government of India (2001): Differences in Level of Consumption among Socio-Economic Groups 1999-2000,<br />
National Sample Survey Organisation, New Delhi.<br />
2. Government of India (2001): Poverty Estimates for 1999-2000, Press Information Bureau, New Delhi.<br />
The distribution pattern of child labour across<br />
different sectors indicates that child work<br />
2<br />
Compiled by National Resource Centre on Child Labour, Noida,<br />
based on Census fi gures.<br />
participation as agricultural labourers accounts<br />
for nearly 50 per cent of total child labour<br />
in the state (1991 census), followed by 28.7<br />
per cent as cultivators and 8.0 per cent in the<br />
manufacturing, processing and repair sector. The<br />
83
Income, Employment and Poverty<br />
Household<br />
type<br />
TABLE 4.10<br />
Levels of living, inequality and poverty by social groups: <strong>Karnataka</strong> and all-India (1999-2000)<br />
Share in<br />
total<br />
population<br />
(%)<br />
Average<br />
per capita<br />
consumption<br />
(Rs./month)<br />
Proportion of<br />
poor<br />
population<br />
(%)<br />
Rural <strong>Karnataka</strong><br />
Relative<br />
inequality in<br />
consumption<br />
distribution<br />
(Lorenz ratio<br />
%)<br />
Share in<br />
total<br />
population<br />
(%)<br />
Average<br />
per capita<br />
consumption<br />
(Rs./month)<br />
Proportion<br />
of<br />
poor<br />
population<br />
(%)<br />
Rural all-India<br />
Relative<br />
inequality in<br />
consumption<br />
distribution<br />
(Lorenz ratio<br />
%)<br />
SCs 19.65 419.39 26.87 21.63 27.17 418.51 35.82 23.76<br />
STs 7.83 404.28 24.78 17.71 6.70 387.69 45.12 24.81<br />
OBCs 39.15 507.45 16.15 23.42 6.77 473.65 27.46 24.97<br />
Others 33.31 560.08 12.11 25.53 59.04 577.22 15.82 26.89<br />
All 100.00 499.60 18.08 24.48 100.00 485.88 27.73 26.58<br />
Urban <strong>Karnataka</strong><br />
Urban all-India<br />
SCs 10.79 592.72 47.50 27.95 14.35 608.79 38.12 27.86<br />
STs 4.50 634.20 50.93 33.49 3.40 690.52 35.29 32.61<br />
OBCs 30.65 829.05 29.09 30.92 30.38 734.82 29.69 32.46<br />
Others 54.02 1044.02 16.81 31.56 51.70 1004.75 16.15 34.46<br />
All 100.00 910.78 25.83 32.75 100.00 854.70 24.58 34.68<br />
Notes:<br />
1. Estimates of different measures are based on data from Government of India (2001e): Differences in Level of Consumption among Socio-Economic Groups 1999-2000, National Sample<br />
Survey Organisation, New Delhi.<br />
2. Estimates of rural and urban poverty correspond to the Government of India Expert Group Poverty Lines per month at current prices for the year 1999-2000 as follows: Rs.309.59 (Rural<br />
<strong>Karnataka</strong>), Rs.327.56 (Rural all-India), Rs.511.44 (Urban <strong>Karnataka</strong>) and Rs.454.11 (Urban all-India) published in Government of India (2001d): Poverty Estimates for 1999-2000,<br />
Press Information Bureau, New Delhi.<br />
3. These estimates of poverty are made with reference to mean consumption, poverty line and parameters of the Lorenz curve.<br />
4. The estimates of aggregate poverty (all households) for rural/urban <strong>Karnataka</strong> differ from those presented in Table 4.9 because of differences in methodology.<br />
TABLE 4.11<br />
Percentage of child population living in poor households: 1999-2000<br />
State Rural Urban<br />
India 33.65 32.28<br />
Andhra Pradesh 15.05 34.40<br />
<strong>Karnataka</strong> 23.40 33.95<br />
Kerala 12.40 24.78<br />
Tamil Nadu 28.06 29.52<br />
Note: The estimates of poverty are obtained with reference to the poverty lines for 1999-2000 obtained as per the<br />
methodology recommended by the Lakdawala Committee [Government of India (1993): <strong>Report</strong> of the Expert Group<br />
on Estimation of Proportion and Number of Poor, Perspective Planning Division, Planning Commission, New Delhi].<br />
The poverty lines are from Government of India (2001): Poverty Estimates for 1999-2000, Press Information Bureau,<br />
New Delhi.<br />
Sources:<br />
1. Government of India (1993): <strong>Report</strong> of the Expert Group on Estimation of Proportion and Number of Poor, Perspective<br />
Planning Division, Planning Commission, New Delhi.<br />
2. Government of India (2001): Poverty Estimates for 1999-2000, Press Information Bureau, New Delhi.<br />
sectoral distribution pattern of child labour shows<br />
that child workers are employed primarily in<br />
the unorganised farm sector and their collective<br />
share as cultivators and agricultural labourers is<br />
more than three-fourth of the total child labour<br />
population (Table 4.13).<br />
Thus, there is an urgent need for intensive and<br />
concerted efforts to not only target working<br />
children and motivate them to attend school<br />
and complete at least eight years of elementary<br />
education, but also provide institutional<br />
arrangements and support to facilitate this<br />
process.<br />
In the current economy, there are emerging<br />
demands for child labour from new sectors. For<br />
instance, while child labour in the silk-twisting<br />
sector has been decreasing, it has been increasing<br />
84
<strong>Karnataka</strong> <strong>Human</strong> <strong>Development</strong> <strong>Report</strong> <strong>2005</strong><br />
in the hybrid cotton seed producing sector, as a<br />
result of a shift from subsistence agriculture to<br />
commercial crop production. The service industry<br />
and fl oriculture are other sectors where child<br />
labour is increasing steadily under the impact of<br />
global markets. Domestic labour is another area<br />
where there is much abuse and exploitation.<br />
State interventions<br />
Despite several interventions, the impact of<br />
government programmes on the prevalence of<br />
child labour has not been satisfactory for various<br />
reasons. The focus, so far, has been on a welfare<br />
approach and on persuasion, exhortation and<br />
incentives, rather than a rights-based approach.<br />
Further, a strategy to address the causes at<br />
source has not received the same attention as<br />
a curative approach. Policies concentrate on<br />
rehabilitation through universal enrolment and<br />
retention. This has made rehabilitation an endless<br />
exercise since the school system has continued to<br />
leak fresh dropouts, even as earlier dropouts are<br />
rehabilitated. Dropouts occur as a result of both<br />
pull-out and push-out factors. The supply side<br />
(pull-out) causes, namely (i) poverty; (ii) poor<br />
enforcement of the law on compulsory education;<br />
and (iii) illiteracy and ignorance, have not been<br />
adequately addressed. The Education Department<br />
has no mechanism for addressing issues of poverty<br />
and child labour, which are the main reasons cited<br />
by parents and children for never enrolling or<br />
dropping out of school. The <strong>Karnataka</strong> Education<br />
Act has no mechanisms or procedures to assist<br />
parents who may be disabled, ill or otherwise<br />
dependent on a child’s income. The Education<br />
Act also offers no solution to the large numbers<br />
of children who migrate with their parents for<br />
employment. There are several new initiatives to<br />
bring working children back to school and they<br />
have been successful, but sustained environmentbuilding<br />
activities to dispel the illiteracy and<br />
ignorance that justifi es child labour are also<br />
required. Entrenched attitudes, which justify poor<br />
children working for a living, are still common,<br />
even among the elite. The attitude of rationalising<br />
child labour as ‘inevitable’ and a ‘necessary evil’, is<br />
yet to disappear. A large percentage of employers<br />
continue to see their employment of children as a<br />
‘favour’ they are doing to the children and their<br />
Year<br />
TABLE 4.12<br />
Enrolment in class I and dropouts: 1996-97 to 2002-03<br />
Enrolment<br />
in class I<br />
1996-2003<br />
(A)<br />
Enrolment in<br />
2003-04 in<br />
classes II to VIII<br />
(B)<br />
Dropout in<br />
elementary<br />
cycle (A-B)<br />
Percentage<br />
of<br />
dropouts<br />
(Lakh)<br />
Dropouts<br />
over classes<br />
A to B<br />
1996-97 14.24 7.77 (VIII) 6.47 45.44 1 to 8<br />
1997-98 13.97 9.92 (VII) 4.05 28.99 1 to 7<br />
1998-99 13.70 11.27 (VI) 2.43 17.73 1 to 6<br />
1999-2000 14.24 13.01 (V) 1.23 8.64 1 to 5<br />
2000-01 14.01 12.47 (IV) 1.54 10.99 1 to 4<br />
2001-02 14.01 12.55 (III) 1.46 10.39 1 to 3<br />
2002-03 13.73 12.52 (II) 1.21 8.81 1 to 2<br />
Total 97.9 79.51 18.39 18.78<br />
Source: Education Department, Director, Primary Education, <strong>Karnataka</strong>.<br />
TABLE 4.13<br />
Classification of child labourers according to<br />
economic activity: <strong>Karnataka</strong><br />
Activity Total workers (1981) Total workers (1991)<br />
Male Female Persons Male Female Persons<br />
Cultivators 220792 111424 332216 155133 125355 280488<br />
Agricultural labourers 248970 275286 524256 216842 277490 494332<br />
Livestock, forestry 75626 27230 102856 40777 17802 58579<br />
Mining and quarrying 2120 1600 3720 2833 1724 4557<br />
Manufacturing,<br />
processing, repairs, etc.<br />
52412 51749 104161 39861 37313 77174<br />
Construction 6969 3862 10831 8660 2225 10885<br />
Trade and commerce 22636 3338 25977 22383 2660 25043<br />
Transport 3553 760 4313 2931 327 3258<br />
Other services 12278 10922 23200 9221 12710 21931<br />
Total 645359 486171 1131530 498641 477606 976247<br />
Source: Registrar General of India, Census 1991.<br />
families to help them survive. The belief that it<br />
is alright for a poor child to earn full time and<br />
learn for a few hours is held by far too many<br />
people. Therefore, while parents may agree that<br />
education is desirable, they are often unable or<br />
unwilling to send their children to school. The<br />
idea that education should lead to a job in the<br />
organised sector, preferably government, is also<br />
held by many parents. Gender bias that says that<br />
The attitude of<br />
rationalising child labour<br />
as ‘inevitable’ and a<br />
‘necessary evil’, is yet to<br />
disappear.<br />
85
Income, Employment and Poverty<br />
The Tenth Plan seeks to<br />
bring down poverty in<br />
<strong>Karnataka</strong> to 7.85<br />
per cent by the year 2007.<br />
girl children will end up as housewives and need<br />
not be educated means that girls are pulled out<br />
of school to work. Existing child labour laws do<br />
not cover the so-called non-hazardous sectors,<br />
such as agriculture, domestic and home-based<br />
work and the informal sector, where more than<br />
90 per cent of children work 3 . There is, thus, a<br />
contradiction between the law on compulsory<br />
education and the child labour law. There are<br />
also contradictions between these two laws on<br />
the magnitude of punishments for employers of<br />
children. There are currently no inspectors under<br />
the Bonded Labour System (Abolition) Act of<br />
1976, and hence, hardly any identifi cations of,<br />
and punishment for, practising child bonded<br />
labour. The Children (Pledging of Labour) Act of<br />
1933 is also rarely invoked for freeing pledged<br />
children even though pledging and bondage of<br />
children are very common practices. The Action<br />
Plan on Child Labour has remained a broad policy<br />
document and a ‘statement of intent’. It needs to<br />
TABLE 4.14<br />
Targets for poverty reduction: Tenth<br />
Five Year Plan 2007<br />
State<br />
Percentage of<br />
poor<br />
No. of poor<br />
(lakh)<br />
India 19.34 2200.94<br />
Andhra Pradesh 8.49 68.72<br />
<strong>Karnataka</strong> 7.85 45.00<br />
Kerala 3.61 12.04<br />
Tamil Nadu 6.61 44.07<br />
Source: Government of India (2002): Tenth Five Year Plan<br />
(2002-07), State Plans: Trends, Concerns and Strategies,<br />
Volume III (Draft), Planning Commission, New Delhi,<br />
p. 133.<br />
be disaggregated into action points with concrete<br />
physical and fi nancial targets on a priority basis.<br />
Targets for poverty reduction:<br />
Tenth Five Year Plan<br />
<strong>Karnataka</strong> is committed to the Millennium<br />
<strong>Development</strong> Goals as well as the Tenth Plan goals.<br />
One of these goals is to reduce income poverty by<br />
50 per cent between 1990 and 2015. The Tenth<br />
Five Year Plan has been formulated keeping this<br />
goal in mind. The Tenth Plan seeks to bring down<br />
poverty in <strong>Karnataka</strong> to 7.85 per cent by the year<br />
2007 (Table 4.14).<br />
Employment<br />
The employment scenario can be examined<br />
from different angles, depending upon the policy<br />
perspective and emphasis. For instance, the size<br />
distribution of the workforce across age groups<br />
throws light on the size of child labour force<br />
and its policy imperatives. Data on the mode of<br />
employment highlights policy implications for<br />
social security, particularly for the vulnerable,<br />
casual labour. A profi le of the sectoral distribution<br />
of the workforce is critical for an assessment of<br />
the relative importance of various employment<br />
opportunities.<br />
Work participation rate<br />
With the growth in population, there has been<br />
an increase in the work participation rate in the<br />
economy. The work participation rate increased<br />
from 40.2 per cent in 1981 to 42 per cent in<br />
1991 and 44.6 per cent in 2001. As a result, the<br />
workforce too has increased from 14.95 million<br />
in 1981 to 18.89 million in 1991 (an increase of<br />
Year<br />
Total population<br />
(lakh)<br />
TABLE 4.15<br />
Work participation rate: 1981, 1991 and 2001<br />
Workforce (lakh)<br />
(Main + Marginal)<br />
Work participation rate<br />
(per cent)<br />
Male Female Persons Male Female Persons Male Female Persons<br />
1981 189.23 182.13 371.36 103.31 46.13 149.44 54.06 25.03 40.02<br />
1991 229.52 220.25 449.77 124.14 64.73 188.87 54.01 29.30 42.00<br />
2001 268.56 258.78 527.34 152.73 82.48 235.21 56.09 31.09 44.60<br />
Source: Government of <strong>Karnataka</strong> (2003): Economic Survey 2002-03; p.275<br />
3 PROBE Study 2002, Ramesh Kanbargi and National Family Health Survey 1and 2.<br />
86
2.64 per cent per annum) and to 23.52 million<br />
in 2001 (2.45 per cent per annum) (Table 4.15).<br />
The increase in the total work participation rate<br />
occurred largely because of the increase in female<br />
work participation.<br />
Work participation rates by social<br />
groups<br />
The 2001 census provides data on SC and ST<br />
workers by broad category of activities. According<br />
to available data, 16.85 per cent of the total<br />
workers (main + marginal) are SCs and 7.27<br />
per cent are STs. A category-wise comparison<br />
shows that out of total cultivators, SCs constitute<br />
nearly 12 per cent and STs 7.6 per cent. The<br />
proportion of SC agricultural labourers is about 28<br />
per cent and that of STs, about 12 per cent (Table<br />
4.16). This indicates that SC and ST workers are<br />
found predominantly in the agrarian sector where<br />
they cluster in low-end jobs.<br />
Women’s work participation rate<br />
A comparison of work participation by women<br />
(both general and among SCs and STs) shows<br />
that participation among SC and ST women,<br />
at about 41 per cent, is higher than women’s<br />
work participation for all groups (35 per cent).<br />
However, the composition of women workers<br />
across different economic activities reveals more<br />
or less similar trends for both SCs, STs and all<br />
groups. Out of total cultivators, the proportion<br />
of women workers is about 30 per cent. SC<br />
and ST women as a proportion of SC and ST<br />
cultivators exhibit the same pattern. About 55<br />
to 60 per cent of total agricultural labourers are<br />
women, both for all groups and SCs/STs, and<br />
among those engaged in household industries,<br />
about 60 per cent are women. Women’s work<br />
participation is high in activities relating to<br />
agro-based manual work and household<br />
industrial activities requiring low skills. The<br />
proportion of SCs and STs in the total ‘other<br />
workers’, which includes high-end jobs of the<br />
tertiary sector and manufacturing sector, is 14.0<br />
and 4.0 per cent respectively. The proportion of<br />
women as a proportion of the total number of<br />
SC and ST workers is about 28 per cent, which<br />
is signifi cantly higher than women workers<br />
as a proportion of the total ‘other workers’<br />
(22 per cent). SC and ST women’s participation<br />
as a proportion of total SC and ST workers in<br />
the ‘other workers category’ is also signifi cantly<br />
higher than the total women workers under this<br />
category.<br />
<strong>Karnataka</strong> <strong>Human</strong> <strong>Development</strong> <strong>Report</strong> <strong>2005</strong><br />
The increase in the total<br />
work participation rate<br />
occurred largely because<br />
of the increase in female<br />
work participation.<br />
TABLE 4.16<br />
Category of workers by social groups: 2001<br />
Category of workers Number of workers SCs as<br />
SCs STs Total % to Total<br />
Cultivators<br />
Agricultural labourers<br />
Total Women Total Women Total Women<br />
1 2 3 4 5 6 7 8 9<br />
Workers in household industries<br />
Other workers<br />
Total<br />
Note: * Figures in parenthesis indicate percentage of respective totals.<br />
Source: Registrar General of India, Census of India 2001.<br />
STs as<br />
% to<br />
Total<br />
814788 242220 526827 152025 6883856 2051016 11.84 7.65<br />
(29.72) (28.85) (29.80)<br />
1737148 947259 738751 423346 6226942 3606015 27.90 11.86<br />
(54.53) (57.30) (57.90)<br />
100447 57831 45146 27003 959665 554574 10.47 4.70<br />
(57.57) (59.80) (58.80)<br />
1314062 373684 399296 110350 9464328 2087833 13.88 4.22<br />
(28.43) (27.64) (22.00)<br />
3966445 1620994 1710020 712724 23534791 8299438 16.85 7.27<br />
(40.86) (41.67) (35.26)<br />
87
Income, Employment and Poverty<br />
TABLE 4.17<br />
Distribution of workforce by employment status (usual status adjusted)<br />
Year Rural Urban Total<br />
SE RS CL Total SE RS CL Total SE RS CL Total<br />
1983 55.93 4.65 38.82 100.00 35.36 36.80 27.65 100.00 51.16 12.20 36.18 100.00<br />
1993-94 55.90 4.80 39.30 100.00 41.30 36.90 21.80 100.00 52.40 12.78 34.82 100.00<br />
1999-2000 50.20 5.30 44.50 100.00 38.80 39.60 21.60 100.00 47.03 14.83 38.14 100.00<br />
Note: SE: Self employed, RS: Regular salaried, CL: Casual labour.<br />
Sources:<br />
1. National Sample Survey fi ndings cited in Chadha, G.K. and P.P. Sahu (2002): ‘Post-reform setbacks in Rural Employment: Issues that need further Scrutiny’.<br />
2. Economic and Political Weekly, Vol. XXXVII, No.21.<br />
TABLE 4.18<br />
Main and marginal workers 1991 and 2001:<br />
Southern states and all-India<br />
State Year Main workers Marginal<br />
workers<br />
<strong>Karnataka</strong><br />
Andhra Pradesh<br />
Tamil Nadu<br />
Kerala<br />
All-India<br />
Note: Figures in bracket indicates percentage to total.<br />
Source: Registrar General of India, Census 1991 and 2001.<br />
Total workers<br />
1991 17292117 1594681 18886798<br />
(91.55) (8.45) (100.00)<br />
2001 19364759 4170032 23534791<br />
(82.30) (17.70) (100.00)<br />
1991 28465427 1529684 29995111<br />
(94.90) (5.10) (100.00)<br />
2001 29040873 5852986 34893859<br />
(83.23) (16.77) (100.00)<br />
1991 22790450 1396474 24186924<br />
(94.23) (5.77) (100.00)<br />
2001 23757783 4120499 27878282<br />
(85.22) (14.78) (100.00)<br />
1991 8293078 843857 9136935<br />
(90.76) (9.24) (100.00)<br />
2001 8236973 2046914 10283887<br />
(80.10) (19.90) (100.00)<br />
1991 285951666 28511310 314462976<br />
(90.93) (9.07) (100.00)<br />
2001 313004983 89229741 402234724<br />
(77.82) (22.18) (100.00)<br />
Composition of employment<br />
Given the trend of the movement of the workforce<br />
towards the non-agricultural sector and the<br />
monetisation of the economy, it is important<br />
to examine the forms of employment and the<br />
changes therein over time. Self-employment in<br />
rural <strong>Karnataka</strong> declined from 55.93 per cent in<br />
1983 to 50.20 per cent in 1999-2000. Regular<br />
salaried jobs have increased in both rural and<br />
urban <strong>Karnataka</strong>. The proportion of the rural<br />
workforce employed as casual labour was not only<br />
high at 38.8 per cent in 1983, but also increased<br />
further, to 44.50 per cent by 1999-2000<br />
(Table 4.17).<br />
The proportion of marginal labour in the total<br />
workforce is increasing steadily. The share of<br />
marginal workers as a proportion of the total<br />
workers in 1991 was 8.4 per cent, which<br />
increased to 17.7 per cent in 2001. A decline<br />
can be seen in the proportion of main workers<br />
and a signifi cant increase in the proportion of<br />
marginal workers in all southern states and at<br />
the all-India level (Table 4.18).<br />
Over the years the average size of operational<br />
holdings has been steadily declining, which<br />
indirectly shows that net addition to the number of<br />
marginal workers is increasing, particularly in the<br />
farm sector. The quinquennial agricultural census<br />
carried out by the Department of Economics<br />
and Statistics shows that the average size of<br />
operational holdings in <strong>Karnataka</strong> in 1970-71<br />
was 3.20 ha., which has declined to 2.13 ha in<br />
1991 and 1.74 ha in 2000-01. This casualisation<br />
88
<strong>Karnataka</strong> <strong>Human</strong> <strong>Development</strong> <strong>Report</strong> <strong>2005</strong><br />
of labour reveals the increasing inability of the<br />
market to provide full-time employment.<br />
Organised and unorganised sector<br />
employment<br />
Organised sector employment, comprising public<br />
and private sector employment, has registered<br />
a negative rate of growth. Total organised sector<br />
employment in <strong>Karnataka</strong> was 18.80 lakh in the<br />
year 2000-01 and declined to 18.18 lakh by<br />
the end of November 2004. There is no readily<br />
available data on unorganised sector employment.<br />
The 55th round NSS data for 1999-2000 provides<br />
estimated employment for different sectors.<br />
If one takes out the corresponding share of<br />
organised sector employment from the aggregate<br />
employment, one can arrive at an estimate of the<br />
proportion of unorganised sector employment<br />
in the state. Unorganised sector employment<br />
contributes to nearly 92 per cent of aggregate<br />
employment. The share of organised sector<br />
employment is not only small, but also declining,<br />
resulting in greater dependency on unorganised<br />
sector employment. This unhealthy trend holds<br />
true, not only for <strong>Karnataka</strong>, but for the all-India<br />
level as well.<br />
Sectoral growth of employment<br />
In the context of the changes accompanying<br />
the economic reform process, it is important<br />
to examine the pattern of employment growth<br />
across sectors in <strong>Karnataka</strong>. Two periods of time<br />
will be considered, viz. (i) 1983 to 1993-94 and<br />
(ii) 1993-94 to 1999-2000. In rural <strong>Karnataka</strong>,<br />
the growth rate of employment in the agricultural<br />
sector as well as trade decelerated during the<br />
second period, and actually became negative for<br />
mining and quarrying, manufacturing, utilities,<br />
and community, social and personal services. The<br />
only sectors wherein the growth rate accelerated<br />
were transport, storage, communication, fi nance,<br />
insurance and real estate. In sum, the rural<br />
sector as a whole experienced little growth in<br />
employment during the second period.<br />
Urban <strong>Karnataka</strong> on the other hand, seems to<br />
have sustained its employment growth during<br />
the second period. The growth rates for the two<br />
periods were 2.95 and 2.54 per cent respectively.<br />
BOX 4.2<br />
Changes in employment patterns over time: <strong>Karnataka</strong> versus<br />
all-India<br />
<br />
<br />
<br />
A decline in the extent of chronic unemployment (male and female; usual principal status)<br />
in both rural and urban <strong>Karnataka</strong>; this is confi rmed further by estimates adjusted for<br />
subsidiary status employment. The experience was different at the all-India level: the<br />
estimates (adjusted as well as unadjusted) based on the usual status criterion show some<br />
increase in unemployment for male and female in rural all-India, as well as for male in<br />
urban all-India, as against a decrease in female unemployment in urban all-India.<br />
Intermittent unemployment, as indicated by estimates of current weekly status, show a<br />
marginal increase for both male and female in rural <strong>Karnataka</strong> and a decline for both in<br />
urban <strong>Karnataka</strong>. At the all-India level, intermittent unemployment increased for both<br />
sexes in the rural sector, increased for males in the urban sector and decreased for females<br />
in the urban sector.<br />
Unemployment by current daily status decreased for rural males, registered a marginal<br />
increase for rural females and declined for both in the urban areas of <strong>Karnataka</strong>. However,<br />
unemployment by this criterion registered a perceptible increase for both males and<br />
females in rural all-India and for males in urban all-India. At the all-India level, the urban<br />
sector experienced a decline the in female unemployment rate.<br />
Thus, in sum, <strong>Karnataka</strong> seems to have done relatively better than the rest of the country in<br />
dealing with the unemployment situation during the 1990s.<br />
Employment declined in agriculture, mining and<br />
quarrying, utilities and community, social and<br />
personal services, but registered an increase in<br />
manufacturing, construction, trade, transport,<br />
storage, communication, fi nance, insurance, real<br />
estate and non-agricultural activities.<br />
Sectoral composition of employment<br />
Agriculture continues to be the major source of<br />
employment in the rural sector. The proportion of<br />
rural workers employed in agriculture (including<br />
animal husbandry, forestry and logging and<br />
fi shing) declined from 84.40 per cent in 1983 to<br />
81.90 per cent in 1993-94 and remained at about<br />
the same level thereafter. However, with the urban<br />
sector’s workforce dependence on agriculture<br />
declining, a similar trend is evident in the state<br />
overall. The manufacturing sector, as a source of<br />
employment, has declined in importance in rural<br />
<strong>Karnataka</strong> but has virtually remained static in<br />
urban <strong>Karnataka</strong>. Consistent with this profi le, the<br />
proportion of <strong>Karnataka</strong>’s workforce engaged in<br />
non-agriculture, especially in the urban sector,<br />
has increased during the same period. For the<br />
state as a whole, the proportion increased from<br />
89
Income, Employment and Poverty<br />
Status<br />
30.40 per cent in 1983 to 37.50 per cent in<br />
1999-2000 (Table 4.19).<br />
Regional dimensions of employment<br />
Employment (main + marginal workers) has<br />
grown at a decennial growth rate of 24.6 per cent<br />
TABLE 4.19<br />
Sectoral distribution of usual (principal + subsidiary) status of<br />
workers: 1983, 1993-94 and 1999-2000<br />
(Per cent)<br />
Year Rural Urban Total (Rural + Urban)<br />
A M NA A M NA A M NA<br />
1983 84.40 6.00 15.60 19.90 28.90 80.10 69.60 11.30 30.40<br />
1993-94 81.90 6.70 18.10 16.60 26.90 83.40 65.70 11.70 34.30<br />
1999-2000 82.10 5.90 17.90 10.90 27.10 81.10 62.50 11.80 37.50<br />
Notes:<br />
1. A: Agriculture, M: Manufacturing, NA: Non-agriculture.<br />
2. Manufacturing is a sub-set of Non-agriculture<br />
Sources:<br />
1. National Sample Survey fi ndings cited in Chadha, G.K. and P.P. Sahu (2002): ‘Post-Reform Setbacks in Rural<br />
employment: Issues that need further Scrutiny’.<br />
2. Economic and Political Weekly, Vol. XXXVII, No.21, pp.1998-2026.<br />
TABLE 4.20<br />
Unemployment rates: <strong>Karnataka</strong> and all-India<br />
Unemployment rates<br />
1993-94 1999-2000 1993-94 1999-2000<br />
M F P M F P M F P M F P<br />
Rural <strong>Karnataka</strong><br />
Urban <strong>Karnataka</strong><br />
Usual status 1.3 0.6 1.1 1.0 0.3 0.8 3.4 7.5 4.3 3.0 4.7 3.4<br />
Usual status 0.9 0.4 0.7 1.0 0.3 0.7 2.9 5.6 3.6 3.0 4.4 3.3<br />
adjusted<br />
Current weekly 1.8 1.2 1.6 2.0 1.5 1.8 4.0 6.9 4.7 3.8 4.7 4.0<br />
Current daily 4.7 3.9 4.4 4.4 4.0 4.3 5.6 8.9 6.3 5.3 5.9 5.4<br />
Rural all-India<br />
Urban all-India<br />
Usual status 2.0 1.4 1.8 2.1 1.5 1.8 4.5 8.2 5.2 4.8 7.1 5.2<br />
Usual status 1.4 0.8 1.2 1.7 1.0 1.5 4.0 6.2 5.2 4.5 5.7 4.7<br />
adjusted<br />
Current weekly 3.0 3.0 3.0 3.9 3.7 3.8 5.2 8.4 5.8 5.6 7.3 5.9<br />
Current daily 5.6 5.6 5.6 7.2 7.0 7.1 6.7 10.5 7.4 7.3 9.4 7.7<br />
Note: M-Male, F-Female and P-Persons.<br />
Sources:<br />
1. Government of India (1996a): ‘A Note on Employment and Unemployment Situation in India. Fifth Quinquennial<br />
Survey, NSS 50th Round (July 1993 – June 1994)’ Sarvekshana, Vol. XX, No.1, pp. 1-146.<br />
2. Government of India (2001f): Employment and Unemployment Situation in India 1999-2000 (Part-I) NSS 55th Round<br />
(July 1999-June 2000), National Sample Survey Organisation, Ministry of Statistics and Programme Implementation,<br />
New Delhi, pp.140-142.<br />
between 1991 and 2001, largely contributed<br />
to by the growth in the number of marginal<br />
workers. The number of main workers increased<br />
at a rate of 12 per cent and marginal workers<br />
by 161.5 per cent during this period. The<br />
growth of employment is highest in Bangalore<br />
Urban district (54.8 per cent), followed by<br />
Dakshina Kannada (27.8 per cent), Dharwad<br />
(27.6 per cent), Koppal (24.9 per cent) and<br />
Mysore and Raichur with about 26 per cent<br />
each. These are the districts where employment<br />
growth is higher than the state average. Across<br />
districts there is signifi cant growth in Bangalore<br />
Urban in terms of main and marginal workers,<br />
whereas the districts of Bidar, Bijapur, Gulbarga<br />
and Raichur have a negative rate of growth for<br />
main workers. All these districts are located in<br />
north <strong>Karnataka</strong>.<br />
This broadly reveals that growth in employment<br />
is mainly Bangalore-centric. Bangalore is<br />
supporting a large number of Information<br />
Technology based industries, which generate<br />
high-end, skill-based employment. There<br />
has been a signifi cant increase in marginal<br />
employment in Bangalore as well, mainly due<br />
to construction activities. There is a large infl ux<br />
of migrant unskilled labourers to Bangalore<br />
resulting in the high growth of marginal workers.<br />
Much of this migration has been triggered by low<br />
growth and recurrent drought in the state. This<br />
phenomenon of employment growth centering<br />
only around Bangalore imposes great stress on<br />
its infrastructure. In recent times the state has<br />
initiated policies to develop growth centres in<br />
other cities as well.<br />
Unemployment<br />
The extent of unemployment will be examined<br />
from different perspectives, viz. (i) usual status;<br />
(ii) current weekly status; and (iii) current daily<br />
status. Estimates of unemployment in <strong>Karnataka</strong><br />
corresponding to these three perspectives<br />
are presented separately for male and<br />
female, by sector, for the years 1993-94 and<br />
1999-2000 in Table 4.20. The estimate by the<br />
usual status criterion provides a measure of<br />
chronic unemployment; this estimate adjusted<br />
for (excluding) workers on subsidiary status is<br />
90
<strong>Karnataka</strong> <strong>Human</strong> <strong>Development</strong> <strong>Report</strong> <strong>2005</strong><br />
called ‘Usual Status Adjusted’. Estimates by<br />
the current weekly status measures current<br />
unemployment (chronic as well as temporary);<br />
and current daily status encompasses chronic<br />
unemployment, temporary unemployment and<br />
under-employment. In other words, among<br />
these measures, the current daily status<br />
estimate would be the most comprehensive<br />
measure. It is an estimate of the average level<br />
of unemployment on a day during the survey<br />
year. It is a comprehensive estimate since it is<br />
based on the unemployed days of the chronically<br />
unemployed, the unemployment days of those<br />
who are usually employed but unemployed<br />
intermittently and the unemployed days of those<br />
who are employed as per the current weekly<br />
status approach. Thus, it takes into account the<br />
unemployed days of even employed persons,<br />
and hence, seasonal unemployment also. The<br />
estimates for the rural and urban areas of<br />
<strong>Karnataka</strong> and all-India show diverse patterns<br />
of change (Table 4.20).<br />
The Table 4.21 indicates that there was a decline<br />
in the extent of unemployment (male and female)<br />
in both rural and urban <strong>Karnataka</strong> as against<br />
an increase (male and female) in rural all-India,<br />
(male) in urban all-India and a decrease only<br />
in female unemployment in urban all-India. The<br />
conclusion is that <strong>Karnataka</strong> seems to have fared<br />
better than India as a whole in dealing with the<br />
unemployment situation.<br />
Policy responses<br />
The Government of <strong>Karnataka</strong> has explored<br />
many policy options to reduce the deprivation<br />
levels of the population. The policies include<br />
programmes to promote growth and<br />
redistribution. Broadly, the redistributive<br />
strategy seeks to reduce poverty by means of<br />
the following interventions:<br />
Promote asset endowment of the poor by<br />
programmes such as land reforms and<br />
Swarnajayanti Gram Swarozgar Yojana<br />
(SGSY);<br />
Offer direct employment opportunities<br />
through programmes like the Sampoorna<br />
Grameen Rozgar Yojana (SGRY) and<br />
Stree Shakti; and<br />
TABLE 4.21<br />
No. of unemployed person days per thousand person days<br />
(current daily status): <strong>Karnataka</strong> vs. all-India<br />
Year Rural Urban<br />
Male Female Persons Male Female Persons<br />
<strong>Karnataka</strong><br />
1993-94 27 13 20 31 14 22<br />
1999-2000 25 12 19 29 10 20<br />
All-India<br />
1993-94 30 13 22 36 14 26<br />
1999-2000 37 15 26 38 12 26<br />
Sources:<br />
1. Government of India (1996): ‘Results on Employment and Unemployment Situation in India, Fifth Quinquennial<br />
Survey, NSS 50th Round (July 1993- June 1994)’, Sarvekshana, Vol. XX, No. 1, p. 113.<br />
2. Government of India (2000): Employment and Unemployment in India 1999-2000 Key Results. NSS 55th Round<br />
(July 1999- June 2000), National Sample Survey Organisation, New Delhi, p. 35.<br />
3. Government of <strong>Karnataka</strong> (2001): Economic Survey 2000-01, Planning and Statistics Department, Bangalore;<br />
p.195.<br />
Year<br />
TABLE 4.22<br />
Progress of SGRY (Stream I): 1998-99 to 2002-03<br />
Financial<br />
(Rs. crore)<br />
Physical<br />
(Lakh man days)<br />
Food grains<br />
(’000 MT)<br />
Target Achievement Target Achievement Released Distributed<br />
1998-99 154.77 134.83 - 292.42 - -<br />
1999-2000 103.59 100.91 195 186.96 - -<br />
2000-01 66.32 72.83 113 103.57 - -<br />
2001-02 100.21 101.55 130 142.40 92.13 58.84<br />
2002-03 95.16 128.68 123.82 245.33 108.07 126.48<br />
Source: Government of <strong>Karnataka</strong> (2003): Annual <strong>Report</strong> 2002-03, Rural <strong>Development</strong> and Panchayat Raj department,<br />
Bangalore, p. 5.<br />
Year<br />
TABLE 4.23<br />
Progress of SGRY (Stream II): 1998-99 to 2002-03<br />
Financial<br />
(Rs. crore)<br />
Physical<br />
(lakh man days)<br />
Food grains<br />
(’000 MT)<br />
Target Achievement Target Achievement Released Distributed<br />
1998-99 110.48 112.89 188.77 225.15 - -<br />
1999-2000 93.83 101.92 188.82 175.48 - -<br />
2000-01 87.87 94.22 113.98 128.94 - -<br />
2001-02 99.90 95.12 129.58 140.79 89.50 60.74<br />
2002-03 92.81 114.26 120.40 276.13 164.19 142.27<br />
Source: Government of <strong>Karnataka</strong> (2003): Annual <strong>Report</strong> 2002-03, Rural <strong>Development</strong> and Panchayat Department,<br />
Bangalore, p. 6.<br />
91
Income, Employment and Poverty<br />
TABLE 4.24<br />
Wage employment generated under<br />
various government programmes<br />
(Crore)<br />
Year<br />
Man days generated<br />
1999-2000 14.82<br />
2000-01 16.49<br />
2001-02 14.82<br />
2002-03 14.71<br />
2003-04 18.88<br />
2004-05 (up to Dec.04) 10.00<br />
Source: Planning Department, Government of <strong>Karnataka</strong>.<br />
<br />
Promote food security through the public<br />
distribution system and subsidised food<br />
grains.<br />
These measures have achieved some success<br />
as refl ected in the reduction in the estimates<br />
of poverty over time. However, the reduction in<br />
poverty has not been uniform across districts.<br />
The percentage point reduction in the incidence of<br />
poverty between 1993-94 and 1999-2000 was<br />
much less in northern <strong>Karnataka</strong> than in the south<br />
and the average for the state (Suryanarayana and<br />
Zaidi, 2002).<br />
One major policy emphasis in recent years has<br />
been on growth in the rural areas by measures<br />
to promote (i) productivity in agriculture and<br />
related activities; (ii) coverage and quality<br />
of infrastructure; (iii) quality of services and<br />
hence, human resources. The government has<br />
also been implementing schemes to develop<br />
rural infrastructure encompassing rural<br />
communications, housing, water supply and<br />
sanitation, watershed development and minor<br />
irrigation.<br />
Employment generation<br />
Programmes for employment generation are<br />
of two types: (i) the set of schemes falling<br />
under Sampoorna Grameen Rozgar Yojana<br />
(SGRY) to provide wage employment; and (ii)<br />
those promoting self-employment of the rural<br />
poor falling under three broad schemes called<br />
Swarnajayanti Gram Swarozgar Yojana (SGSY),<br />
Stree Shakti and Swavalambana. Some salient<br />
features and achievements of these programmes<br />
in recent years are as follows:<br />
Various government programmes, including<br />
direct wage employment programmes, such<br />
as Swarnajayanti Gram Swarozgar Yojana,<br />
Sampoorna Grameen Rozgar Yojana, departmental<br />
works in irrigation, roads, buildings, command<br />
area development etc. generate considerable<br />
wage employment, which support the<br />
employment needs of the rural sector. The<br />
details of wage employment generated from<br />
1999-2000 to 2004-05 may be seen in<br />
Table 4.24.<br />
TABLE 4.25<br />
Swarnajayanti Gram Swarozgar Yojana (SGSY): 1999-2000 to 2002-03<br />
Year Financial (Rs. lakh) Physical<br />
Allocation Achievement % Groups formed No of ‘swarozgaries’ (self employed)<br />
Target Achieved Target Achieved %<br />
1999-2000 6262.20 3969.52 63 226 6534 33275 19004 57<br />
2000-01 4706.77 4212.40 89 1695 5771 25025 26942 108<br />
2001-02 3089.34 5147.38 167 1112 5592 16420 42944 262<br />
2002-03 3089.34 4882.33 158 1112 5481 16420 37116 226<br />
Source: Government of <strong>Karnataka</strong> (2003): Annual <strong>Report</strong> 2002-03, Rural <strong>Development</strong> and Panchayat Raj Department,<br />
Bangalore, p. 11.<br />
92
Concerns<br />
<br />
<br />
<br />
<br />
<br />
<br />
Comparable with all-India trends, <strong>Karnataka</strong><br />
is experiencing a structural change in the<br />
composition of its State Domestic Product<br />
with the share of the primary sector declining<br />
in favour of the tertiary sector and the<br />
intermediary secondary sector remaining<br />
almost constant. Employment, however, is<br />
still primary sector oriented, with secondary<br />
and tertiary sectors contributing relatively<br />
lower proportions. Though the economy has<br />
grown at a moderate compound growth rate<br />
of around 6 per cent during the decade, the<br />
growth of the primary sector has increased<br />
only marginally, (by less than one per cent)<br />
and it is the secondary and tertiary sectors<br />
that have fuelled this growth in the state.<br />
Another area of concern is the low<br />
participation of women in the secondary and<br />
tertiary sectors. Women are found largely<br />
in unskilled low-end jobs like agriculture<br />
labour, household industries etc. Women<br />
constitute nearly 60 per cent of agricultural<br />
labourers. There is a disparity in the relative<br />
agricultural wages between men and women<br />
besides disparity in real and nominal wages.<br />
This further pushes women into a poverty<br />
trap.<br />
<strong>Karnataka</strong> has the second largest percentage<br />
of children living in poor households, rural<br />
and urban, among the four southern states.<br />
While government has initiated many<br />
programmes for child labour, the results<br />
are mixed because the policy focuses on<br />
rehabilitation rather than prevention.<br />
Existing child labour laws do not cover the<br />
so-called non-hazardous sectors such as<br />
agriculture, domestic and home-based work,<br />
and the informal sector, where more than 90<br />
per cent of children work. There is, thus, a<br />
contradiction between the law on compulsory<br />
education which bans all work during school<br />
hours and the child labour law. There are also<br />
contradictions between these two laws on<br />
the magnitude of punishments for employers<br />
of children.<br />
Another area of concern is negative growth<br />
in organised sector employment in recent<br />
years. While the share of the organised sector<br />
<br />
<br />
in the aggregate employment is very low at<br />
eight per cent, a proportion comparable with<br />
all-India, it will further decline to lower levels<br />
if remedial policy measures are not taken<br />
with appropriate state interventions.<br />
Poverty trends show a declining trend in the<br />
state, comparable with the all-India trend.<br />
However, urban poverty in <strong>Karnataka</strong> is<br />
higher than the rural poverty levels. One of<br />
the apparent reasons for the high incidence<br />
of urban poverty is migration from the rural<br />
to urban areas for employment.<br />
The large number of agricultural labourers<br />
as a proportion of the total work force<br />
adversely impacts labour productivity,<br />
per capita income and poverty levels due<br />
to an excessive dependence on agriculture.<br />
Inter-district comparisons show that leading<br />
districts such as Bangalore, Kodagu, and<br />
Dakshina Kannada have a low proportion<br />
of agricultural labourers in the aggregate<br />
employment. These districts have high<br />
labour productivity and per capita income,<br />
and a low incidence of poverty. Backward<br />
districts like Raichur, Gulbarga and Haveri<br />
have a high proportion of agricultural<br />
labour but relatively low productivity levels,<br />
per capita income and a high incidence of<br />
poverty.<br />
Recommendations<br />
<br />
<br />
Formulate a comprehensive employment<br />
strategy aiming at sectoral and regional<br />
diversifi cation; identify appropriate labour<br />
intensive technologies; encourage faster<br />
growth in the primary sector; reduce regional<br />
disparities.<br />
Reorient the employment strategy to absorb<br />
the growing labour force by creating more job<br />
opportunities and a growth strategy focusing<br />
on the primary sector, which can sustain and<br />
absorb the increasing employment needs.<br />
The growth strategy must also focus on<br />
creating employment opportunities in the<br />
non-farm and household industry sectors<br />
which are highly labour intensive. The tertiary<br />
sector though contributing signifi cantly to the<br />
state income, is not labour intensive and is<br />
confi ned to highly skilled jobs. There is a large<br />
<strong>Karnataka</strong> <strong>Human</strong> <strong>Development</strong> <strong>Report</strong> <strong>2005</strong><br />
There is a disparity in the<br />
relative agricultural wages<br />
between men and women<br />
besides disparity in real<br />
and nominal wages. This<br />
pushes women into a<br />
poverty trap.<br />
93
Income, Employment and Poverty<br />
chunk of the educated unemployed without<br />
any technical skills, who need to be provided<br />
with training for productive employment. The<br />
state must devise a policy aimed at absorbing<br />
such segments of the labour force through<br />
appropriate training.<br />
Strengthen policies to empower women<br />
to emerge from the poverty syndrome<br />
and to also increase access to better<br />
economic resources by encouraging them<br />
to participate in skill-based productive<br />
economic activities.<br />
Counter and reverse the process of<br />
marginalisation of labour through<br />
self- employment and regular employment.<br />
Manage rural out-migration with a suitable<br />
region specifi c employment policy to create<br />
more sustainable job opportunities in rural<br />
areas.<br />
Promote non-farm income generating<br />
activities to generate more productive<br />
employment opportunities in the non-farm<br />
sector.<br />
The ongoing efforts of the state government<br />
in setting up self-help groups like Stree Shakti<br />
will have to be intensifi ed.<br />
Attack the problem of child labour on several<br />
fronts: reduction of household poverty,<br />
universal enrolment and retention in school,<br />
and strengthening legal provisions and<br />
enforcement.<br />
Amend labour legislation to cover children in<br />
non-hazardous sectors.<br />
The Bonded Labour System (Abolition) Act<br />
of 1976 should be amended so as to identify<br />
and punish those who are practising child<br />
bonded labour.<br />
94
Literacy and Education
CHAPTER 5<br />
Literacy and Education<br />
Introduction<br />
Education is recognised as a fundamental human<br />
right, along with other necessities, such as food,<br />
shelter and water in The Universal Declaration on<br />
<strong>Human</strong> Rights (1948). The advantages it confers<br />
on individuals and nations are multi-dimensional<br />
and multi-faceted. It sustains economic growth<br />
by providing basic as well as specialised skills<br />
that ensure increased productivity and higher<br />
per capita incomes. <strong>Human</strong> development is<br />
predicated upon universal access to education,<br />
with its implications for equity and social justice.<br />
Education empowers people to make informed<br />
choices about their lives and about their rights<br />
as citizens in a democracy. Gender justice gets<br />
a boost when women have access to education,<br />
which, by enhancing women’s knowledge and<br />
employment capacity, increases their sense of<br />
autonomy and self worth. People’s health status<br />
improves as their education levels rise. Above all,<br />
education is valued, quite simply, for itself and<br />
the avenues of knowledge and awareness that<br />
it opens for us.<br />
Achievements in education in <strong>Karnataka</strong> have<br />
been quite remarkable, and the state is moving<br />
towards universal literacy at a steady pace. The<br />
literacy rate increased from 56.04 per cent in<br />
1991 to 66.64 per cent in 2001, with the female<br />
literacy rate increasing more swiftly than the<br />
male literacy rate. Overall, the gender disparity<br />
in literacy is declining rather perceptibly and<br />
the decline is much more evident in the less<br />
economically developed districts of the state.<br />
<strong>Karnataka</strong> has 51,904 primary schools (2003-04)<br />
and the number of habitations with primary schools<br />
within a distance of one kilometre increased from<br />
84 per cent in 1993 to 88 per cent in 2002.<br />
Enrolment in primary education grew at the rate of<br />
one per cent for boys and two per cent for girls per<br />
annum from 1990-91 to 2003-04. The dropout<br />
rate for Classes I to IV came down from a high 31<br />
per cent in 1993-94 to six per cent in 2001-02, but<br />
increased thereafter, to 11 per cent in 2003-04.<br />
For classes I to VIII, the dropout rate declined<br />
from 54-59 per cent between 1992 and 2000<br />
to 45.4 per cent in 2003-04. <strong>Karnataka</strong> has<br />
taken steps to recruit women teachers, whose<br />
numbers went up to 54 per cent in 2003-04.<br />
At present there exists an extensive high school<br />
network in the state and the midday meal scheme<br />
covers nearly 66 lakh children in classes I to VII, in<br />
both government and aided schools. As many as<br />
1,088 high schools have computer-aided learning<br />
centres, thereby bringing information technology<br />
within the reach of rural students.<br />
The constraints and challenges will have to be<br />
confronted head-on. Overall, the mean years<br />
of schooling have improved only marginally<br />
over a four-year period, from 1999-2000 to<br />
2003-04. The high levels of regional, caste and<br />
gender disparities imply that not all the children<br />
in the state have equal access to education.<br />
The dropout rate in south <strong>Karnataka</strong> districts<br />
in 2003-04 was lower than the state average<br />
as well as north <strong>Karnataka</strong>’s average for boys<br />
and girls. In terms of infrastructure in primary<br />
schools, Hyderabad <strong>Karnataka</strong> performs poorly<br />
while south <strong>Karnataka</strong> has better infrastructure<br />
than other regions. More than 3 per cent schools<br />
BOX 5.1<br />
UN Millennium <strong>Development</strong> Goals<br />
Goals Target Indicators<br />
1. Achieve<br />
universal<br />
primary<br />
education.<br />
2. Promote<br />
gender equality<br />
and empower<br />
women.<br />
Ensure that, by 2015,<br />
children everywhere, boys<br />
and girls alike, will be able<br />
to complete a full course of<br />
primary schooling.<br />
Eliminate gender disparity<br />
in primary and secondary<br />
education, preferably by<br />
<strong>2005</strong>, and in all levels of<br />
education not later than<br />
2015.<br />
Education is recognised<br />
as a fundamental human<br />
right, along with other<br />
necessities, such as food,<br />
shelter and water in The<br />
Universal Declaration on<br />
<strong>Human</strong> Rights (1948).<br />
1. Net enrolment ratio in primary<br />
education.<br />
2. Proportion of pupils starting grade I<br />
who reach grade V.<br />
3. Primary completion rate.<br />
4. Literacy rate of 15–24 year-olds.<br />
1. Ratio of girls to boys in primary,<br />
secondary and tertiary education.<br />
2. Ratio of literate females to males<br />
among 15–24 year-olds.<br />
97
Literacy and Education<br />
do not have teachers and 19 per cent function<br />
with single teachers (Seventh All-India School<br />
Education Survey, Provisional Statistics, 2002).<br />
The percentage of girls’ and boys’ enrolment<br />
in secondary education in the state still shows<br />
marked differentials (boys: 6,86,893 and<br />
BOX 5.2<br />
Monitorable targets in the Tenth<br />
Five Year Plan of India<br />
1. All children in school by 2003.<br />
2. All children to complete 5 years of schooling<br />
by 2007.<br />
3. Reduction in gender gap in literacy by at<br />
least 50 per cent by 2007.<br />
4. Increase in literacy rate to 75 per cent within<br />
2002-03 to 2006-07.<br />
Source: Planning Commission, Government of India.<br />
girls: 5,97,244 in 2003-04) despite a steady<br />
improvement over the years. The quality of<br />
instruction and instructional material will have to<br />
improve considerably to ensure better retention<br />
of students.<br />
As noted in chapter 3, from 1990-91 to 2002-03,<br />
the largest allocation of public education<br />
expenditure went to general education, and<br />
primary and secondary education within<br />
general education, a pattern which refl ects the<br />
government’s priorities. Despite this, the share<br />
of primary and secondary education in the<br />
state income and in the education budget has<br />
been more or less static. The combined public<br />
expenditure ratio (PER) and the social allocation<br />
ratio (SAR) for primary and secondary education<br />
has straggled along at around 2.4 per cent and<br />
13.3 per cent for over 12 years. While the state<br />
government has, quite rightly, prioritised primary<br />
BOX 5.3<br />
Selected social indicators with reference to the Tenth Plan targets and<br />
Millennium <strong>Development</strong> Goals – <strong>Karnataka</strong><br />
Indicator Year Rural Urban<br />
Male Female All Male Female All<br />
Literacy<br />
School attendance<br />
Gender gap in<br />
literacy<br />
Head count ratio of<br />
poverty<br />
1991 60.3 34.8 47.7 82.0 65.7 74.2<br />
2001 70.5 48.0 59.3 86.7 74.1 80.6<br />
1993-94 73 62.3 67.8 86.1 84 85<br />
1999-2000 77.7 72.6 75.1 87.4 88.4 88.2<br />
1991 -25.5 -16.3<br />
2001 -22.5 -12.6<br />
1993-94 22 36<br />
1999-2000 19.1 27.1<br />
Infant mortality rate<br />
1991 87 47 (77)<br />
2004 64 24 (52)<br />
Sources:<br />
1. Head count ratio based on calculation of poverty estimates by Sen and Himanshu (2004).<br />
2. Sarvekshana (1997) for school attendance rates for 1993-94.<br />
3. School attendance rates for 1999-2000 were calculated by Himanshu (2004) using unit level NSSO data.<br />
4. Himanshu (2004), School attendance rates for different states of India: Estimates based on unit level data from the 55th Round<br />
of Employment-Unemployment Survey, CESP, Jawaharlal Nehru University, New Delhi.<br />
5. Literacy Rate: Census 1991 and 2001.<br />
6. Infant Mortality Rate: SRS 2004 (fi gures in brackets indicate state average).<br />
98
<strong>Karnataka</strong> <strong>Human</strong> <strong>Development</strong> <strong>Report</strong> <strong>2005</strong><br />
and secondary education in terms of resources,<br />
the overwhelmingly large share of revenue<br />
expenditure in total expenditure indicates that,<br />
in <strong>Karnataka</strong>, as in other southern states, not<br />
enough investment is being directed towards<br />
capital expenditure. The non-salary component is<br />
low and the expenditure on school infrastructure,<br />
curriculum development, instructional material,<br />
in-service teachers’ training – in short, all the<br />
elements that contribute to improving the quality<br />
of education – is inadequate.<br />
Literacy<br />
Literacy’s positive association with improved<br />
socio-economic development indicators, as well<br />
as some demographic indicators, underlines its<br />
crucial role in the process of human development.<br />
Attainment of literacy improves people’s<br />
productivity by strengthening their knowledge<br />
and skill base, and this, in turn, increases their<br />
income. The coeffi cient of correlation between<br />
the population below the poverty line and the<br />
female literacy rate in rural areas is –0.62,<br />
indicating clearly that poverty and female<br />
illiteracy are very closely linked (Table 5.1).<br />
There is also likely to be greater improvement<br />
in women’s status when their literacy levels<br />
rise: for instance, there is a positive correlation<br />
(0.28) between female literacy and the sex ratio<br />
(Table 5.1). This is apparent from the situation<br />
prevailing in Dakshina Kannada and Udupi<br />
districts, which have the highest sex ratio in the<br />
state, as well as a very high female literacy rate.<br />
<strong>Karnataka</strong>’s literacy rate (66.64) has increased by<br />
10 percentage points between 1991 and 2001.<br />
Its literacy rate has been consistently higher than<br />
all-India in all census years and is even higher than<br />
the literacy rate in some neighbouring countries<br />
such as Pakistan (44.0), Bangladesh (40.10)<br />
and Nepal (39.20), but lower than Sri Lanka<br />
(91.10). <strong>Karnataka</strong>, however, still has to catch<br />
up with its neighbours, Kerala (90.9), Tamil Nadu<br />
(73.5) and Maharashtra (76.9). The scenario in<br />
<strong>Karnataka</strong> is somewhat mixed. About one-third<br />
of the state’s population is still illiterate; the<br />
illiteracy rate is more than 63 per cent and 58<br />
per cent respectively among Scheduled Tribe<br />
and Scheduled Caste females. As many as 15<br />
TABLE 5.1<br />
District-wise rural female literacy rate and percentage of rural families<br />
below poverty line: 2001<br />
Sl.<br />
No.<br />
Districts<br />
Female<br />
literacy rate<br />
2001<br />
Rural female<br />
literacy rate<br />
2001<br />
Sex<br />
ratio<br />
No. of rural families<br />
below poverty line<br />
(%)<br />
1 Bagalkot 43.56 36.33 980 23.50<br />
2 Bangalore Rural 54.99 50.95 955 35.75<br />
3 Bangalore Urban 77.48 60.78 908 15.67<br />
4 Belgaum 52.32 45.80 960 23.70<br />
5 Bellary 45.28 36.82 969 44.57<br />
6 Bidar 48.81 43.64 949 39.60<br />
7 Bijapur 43.47 37.32 950 42.00<br />
8 Chamarajnagar 42.48 38.59 971 36.00<br />
9 Chikmaglur 64.01 60.70 984 27.00<br />
10 Chitradurga 53.78 49.12 955 41.50<br />
11 Dakshina Kannada 77.21 72.69 1022 15.40<br />
12 Davangere 58.04 52.02 962 20.00<br />
13 Dharwad 61.92 47.70 949 39.00<br />
14 Gadag 52.52 46.28 969 46.40<br />
15 Gulbarga 37.90 29.43 966 33.70<br />
16 Hassan 59.00 54.72 1004 27.13<br />
17 Haveri 57.37 54.52 944 32.00<br />
18 Kodagu 72.26 70.10 996 19.00<br />
19 Kolar 52.23 44.99 972 40.27<br />
20 Koppal 39.61 35.81 983 42.50<br />
21 Mandya 51.53 47.65 986 29.86<br />
22 Mysore 55.81 42.31 964 28.14<br />
23 Raichur 35.93 28.86 983 43.20<br />
24 Shimoga 66.88 60.66 978 36.00<br />
25 Tumkur 56.94 52.29 967 31.40<br />
26 Udupi 75.19 72.97 1130 24.67<br />
27 Uttara Kannada 68.47 63.52 971 30.45<br />
South <strong>Karnataka</strong> 63.02 53.68 966 28.71<br />
North <strong>Karnataka</strong> 48.30 41.15 964 37.29<br />
<strong>Karnataka</strong> 56.90 48.01 965 33.00<br />
Correlation-coefficient -0.62 0.28<br />
Sources:<br />
1. Registrar General of India, Primary Census Abstract 2001.<br />
2. <strong>Report</strong> of High Power Committee for Redressal of Regional Imbalances, 2002.<br />
99
Literacy and Education<br />
TABLE 5.2<br />
Literacy rate of <strong>Karnataka</strong> and all-India<br />
Year <strong>Karnataka</strong> All-India<br />
Persons Male Female IGD 1 Persons Male Female IGD<br />
1961 29.80 42.29 16.70 0.47 28.30 40.40 15.35 0.48<br />
1971 36.83 48.51 24.55 0.36 34.45 45.96 21.97 0.38<br />
1981 46.21 58.73 33.17 0.32 43.56 56.37 29.75 0.35<br />
1991 56.04 67.26 44.34 0.25 52.20 64.13 39.29 0.29<br />
2001 66.64 76.10 56.90 0.19 64.80 75.80 54.20 0.22<br />
Note: IGD=Index of Gender Disparity.<br />
Source: Registrar General of India, Census of India, various volumes.<br />
TABLE 5.3<br />
Region-wise literacy-gender disparity index in <strong>Karnataka</strong>:<br />
1991 and 2001<br />
Region Rural Urban Total<br />
1991 2001 1991 2001 1991 2001<br />
South <strong>Karnataka</strong> 0.27 0.20 0.12 0.09 0.21 0.15<br />
Bombay <strong>Karnataka</strong> 0.34 0.27 0.20 0.15 0.29 0.23<br />
Hyderabad <strong>Karnataka</strong> 0.47 0.33 0.24 0.18 0.38 0.28<br />
State 0.31 0.24 0.15 0.11 0.25 0.19<br />
Note: Estimated using data from the source.<br />
Source: Registrar General of India, Census of India, 1991 and 2001.<br />
The coastal districts<br />
of Dakshina Kannada<br />
(83.35) and Udupi<br />
(81.25) along with<br />
Bangalore Urban district<br />
(82.96) continued to<br />
maintain their lead status<br />
as high performers, well<br />
on the way to catching up<br />
with Kerala.<br />
districts (9 in north <strong>Karnataka</strong> and 6 in south<br />
<strong>Karnataka</strong>) have a literacy rate that is below the<br />
state average and 11 districts are even below<br />
the national average, ranging from Raichur with<br />
48.8 per cent to Mysore with 63.48 per cent.<br />
One encouraging feature is that the female<br />
literacy rate increased more rapidly (around<br />
28 per cent) from 1991 to 2001 than the male<br />
literacy rate (around 14 per cent). The gender<br />
disparity in literacy has declined steadily over<br />
the years, from 0.47 in 1961 to 0.19 in 2001,<br />
indicating signifi cant progress in the reduction<br />
of female illiteracy. Another trend, which is<br />
refl ective of the success of policy interventions,<br />
is the sharp decline in gender disparity in the<br />
rural areas of even the relatively less developed<br />
region of Hyderabad <strong>Karnataka</strong>. While the<br />
literacy-gender disparity is higher in rural areas<br />
1<br />
Disparity Index = Log (X 2<br />
/X 1<br />
) + Log [(Q-X 1<br />
)/(Q-X 2<br />
)], Where X 2<br />
≥<br />
X 1<br />
and Q ≥ 200, Sopher, D.K (1974) ‘Measurement of Disparity’,<br />
The Professional Geographer, 26/2, (Nov), 380-92.<br />
than in urban areas, the good news is that the<br />
disparity has reduced more rapidly in the rural areas<br />
(Table 5.3).<br />
Literacy rates in the various districts of the state<br />
have improved signifi cantly in 2001. The coastal<br />
districts of Dakshina Kannada (83.35) and Udupi<br />
(81.25) along with Bangalore Urban district<br />
(82.96) continued to maintain their lead status as<br />
high performers, well on the way to catching up<br />
with Kerala, while four districts of the Hyderabad<br />
<strong>Karnataka</strong> region were below the all-India<br />
literacy rate in respect of total, male and female<br />
literacy levels in both census years (1991 and<br />
2001). The malnad districts of Kodagu (77.99),<br />
Shimoga (74.52) and Chikmaglur (72.20)<br />
maintained a steady growth in the literacy rate.<br />
Within Hyderabad <strong>Karnataka</strong>, Bidar, despite<br />
being below the state average, emerged as the<br />
best performing district (60.94), while Raichur<br />
occupied the lowest position in both census years.<br />
Bijapur’s literacy rate was higher than the all-India<br />
literacy rate in 1991, but regressed below the<br />
all-India male, female and total literacy levels<br />
in 2001. Other districts, which showed similar<br />
deterioration and fell below the national literacy<br />
rate, are Chitradurga (male and total literacy),<br />
Bagalkot (male), Gadag (female) and Belgaum<br />
(total literacy). It is possible that this somewhat<br />
grim scenario is the outcome of the bifurcation<br />
of certain districts (viz. Chitradurga, Bijapur<br />
and Dharwad) in 1997, whereby pre-existing<br />
intra-district differentials in literacy became<br />
sharply outlined. The less developed Hyderabad<br />
<strong>Karnataka</strong> districts gave cause to rejoice, having<br />
registered the most marked improvements in<br />
literacy in the state with the highest increases in<br />
decennial growth: Raichur (3.58), Koppal (3.53)<br />
and Bidar (3.05), while the lowest was Bijapur<br />
with 0.13. Even Chamarajnagar, one of the most<br />
underdeveloped districts in south <strong>Karnataka</strong>,<br />
managed to improve its performance from 38.19<br />
per cent in 1991 to 50.87 per cent in 2001.<br />
The low female literacy rate in <strong>Karnataka</strong>, as in<br />
India, is a visible manifestation of gender bias,<br />
which refuses to acknowledge women’s inherent<br />
right to education. Caste, class and geographical<br />
factors are other sources of inequity that shape<br />
100
female literacy levels. This becomes evident when<br />
the inter-district performance in female literacy is<br />
analysed. The highest female literacy rates are to<br />
be found in Bangalore Urban (77.48), Dakshina<br />
Kannada (77.21), and Udupi (75.19) districts,<br />
and the lowest in Raichur (35.93), Gulbarga<br />
(37.90) and Koppal (39.61). Geographically,<br />
Gulbarga, Raichur and Koppal are contiguous and<br />
share the same socio-economic characteristics<br />
of underdevelopment, while Dakshina Kannada<br />
and Udupi (which were originally one district)<br />
have traditionally maintained good human<br />
development indicators. The female literacy rate<br />
in Bangalore Rural was a low 54.99 per cent –<br />
lower than the state average, and lower than some<br />
southern districts such as Davangere (58.04) or<br />
Tumkur (56.94), which do not have the advantage<br />
of lying in the immediate periphery of India’s<br />
fastest growing city. Figure 5.1 shows the rural<br />
female literacy rate between different districts of<br />
the state and reveals wide variations between<br />
north and south <strong>Karnataka</strong>. The mean literacy<br />
rate of the districts of north <strong>Karnataka</strong> 2 (60.99<br />
per cent) is less than that of south <strong>Karnataka</strong> 3<br />
(69.52 per cent). There has been a sharp decline<br />
in the variation (as refl ected through coeffi cient of<br />
variation) during the decade among districts, both<br />
in the south (17.17 per cent in 1991 and 13.18<br />
per cent in 2001) and the north (20.94 per cent in<br />
1991 and 13.97 per cent in 2001). The variation<br />
in literacy over the decade has been narrowing for<br />
all caste groups. In Hyderabad <strong>Karnataka</strong>, female<br />
literacy rates in rural areas reveal signifi cant<br />
improvements (the maximum in the state) in all<br />
the districts during this period, showing that the<br />
initiatives taken in the state have started bearing<br />
fruit in recent years.<br />
The literacy rate of rural females in <strong>Karnataka</strong><br />
is lower than that of urban females, as the<br />
urban female literacy rate grew at a faster rate<br />
than the rural female literacy rate. Raichur and<br />
Koppal have the lowest urban female literacy<br />
rates in <strong>Karnataka</strong>. As many as 10 districts in<br />
north <strong>Karnataka</strong> and four districts of south<br />
<strong>Karnataka</strong> have a rural female literacy rate that<br />
is below the state average. The poor performing<br />
districts in Bombay <strong>Karnataka</strong> are Bijapur and<br />
Bagalkot while Raichur and Gulbarga are the<br />
low performers in Hyderabad <strong>Karnataka</strong> and<br />
<strong>Karnataka</strong> <strong>Human</strong> <strong>Development</strong> <strong>Report</strong> <strong>2005</strong><br />
In Hyderabad <strong>Karnataka</strong>,<br />
female literacy rates<br />
in rural areas reveal<br />
significant improvements.<br />
FIGURE 5.1<br />
Inter-district disparities in the rural female literacy rate<br />
Literacy rate (%)<br />
80.00<br />
70.00<br />
60.00<br />
50.00<br />
40.00<br />
30.00<br />
20.00<br />
36.33<br />
60.78<br />
50.95<br />
45.80<br />
36.82<br />
43.64<br />
37.32<br />
38.59<br />
60.70<br />
49.12<br />
72.69<br />
52.02<br />
47.70<br />
46.28<br />
29.43<br />
54.72<br />
54.52<br />
70.10<br />
44.99<br />
35.81<br />
47.65<br />
42.31<br />
28.86<br />
60.66<br />
52.29<br />
72.97<br />
63.52<br />
48.01<br />
10.00<br />
0.00<br />
Bagalkot<br />
Bangalore Urban<br />
Bangalore Rural<br />
Belgaum<br />
Bellary<br />
Bidar<br />
Bijapur<br />
Chamarajnagar<br />
Chikmaglur<br />
Chitradurga<br />
Dakshina Kannada<br />
Davangere<br />
Dharwad<br />
Districts<br />
Gadag<br />
Gulbarga<br />
Hassan<br />
Haveri<br />
Kodagu<br />
Kolar<br />
Koppal<br />
Mandya<br />
Mysore<br />
Raichur<br />
Shimoga<br />
Tumkur<br />
Udupi<br />
Uttara Kannada<br />
State<br />
2<br />
North <strong>Karnataka</strong> includes: Belgaum, Bijapur, Bagalkot, Dharwad, Gadag, Haveri, Uttara Kannada, Bellary, Bidar, Gulbarga, Raichur<br />
and Koppal.<br />
3<br />
South <strong>Karnataka</strong> includes: Bangalore Urban, Bangalore Rural, Chitradurga, Davangere, Kolar, Shimoga, Tumkur, Chikmaglur, Dakshina<br />
Kannada, Udupi, Hassan, Kodagu, Mandya, Mysore and Chamarajnagar.<br />
101
Literacy and Education<br />
The lowest gender<br />
disparity in literacy is in<br />
Bangalore Urban and the<br />
highest in Raichur.<br />
Chamarajnagar in south <strong>Karnataka</strong> (Appendix<br />
Tables: Series 4).<br />
The gender disparity index has been calculated<br />
by using Sophers’ disparity index where a high<br />
index means high gender disparity. A noticeable<br />
and welcome element is the fact that the gender<br />
disparity in literacy has declined sharply over<br />
the decade. The lowest gender disparity is in<br />
Bangalore Urban and the highest disparity is<br />
in Raichur. While gender disparity in literacy is<br />
higher in north <strong>Karnataka</strong> than in south <strong>Karnataka</strong>,<br />
it would be simplistic to say gender disparities are<br />
insignifi cant in the southern districts. The female<br />
literacy rate in Bangalore Rural district may have<br />
improved over the decade, but it is still too low for<br />
a district that has the advantage of being adjacent<br />
to an urban centre. The intensity of difference may<br />
be less in the southern districts, but the disparity<br />
does exist and has serious effects on female<br />
health and poverty. While it is reassuring to note<br />
that, overall, the gender disparity in literacy is<br />
declining and that the decline is faster in the more<br />
underdeveloped regions, more policy interventions<br />
are required if <strong>Karnataka</strong> is to meet the MDG<br />
(Figure 5.2).<br />
Since the Scheduled Caste and Scheduled Tribe<br />
populations are characterised by low literacy<br />
rates, districts with high SC and ST populations<br />
tend to have lower literacy rates than others (see<br />
chapters 9 and 10).<br />
State interventions<br />
One reason for the existence of such high levels<br />
of illiteracy in India, even today, when it is poised<br />
to become a super power in this millennium, is<br />
the low priority accorded to both adult literacy<br />
and primary education in the post-Independence<br />
years. The institutions of higher learning<br />
established in those years have contributed<br />
immeasurably to the country’s emergence as a<br />
leader in the current knowledge-based global<br />
economy, but the lack of policy seriousness in<br />
tackling illiteracy as a grassroots movement<br />
meant that increases in literacy levels took place<br />
incrementally. The National Adult Education<br />
Programme (NAEP), launched in 1978, was a<br />
national programme to remove illiteracy, under<br />
which funds were made available to states to<br />
set up departments of adult education. The next<br />
initiative, the National Literacy Mission 1988,<br />
was launched in the then popular mission mode.<br />
The Literacy Mission used a community based<br />
approach to address adult illiteracy, drawing upon<br />
volunteers and NGOs and using catchy tactics<br />
such as jathas and street theatre to mobilise<br />
people. In some states, the Literacy Mission met<br />
with unexpected success in mobilising women<br />
around social issues, as in the anti-arrack<br />
agitation in Nellore, Andhra Pradesh. This kind<br />
of social activism on this scale can be described<br />
as true education (through empowerment) in<br />
the broadest sense of the term. However, the<br />
outcomes of the efforts of the NLM, when viewed<br />
FIGURE 5.2<br />
Gender disparity index of the literacy rate<br />
Gender disparity in literacy rate (%)<br />
0.40<br />
0.35<br />
0.30<br />
0.25<br />
0.20<br />
0.15<br />
0.10<br />
0.05<br />
0.00<br />
0.35<br />
0.37<br />
0.25<br />
0.28<br />
0.25<br />
0.19<br />
SC ST All Community<br />
1991 2001 Social Groups<br />
102
<strong>Karnataka</strong> <strong>Human</strong> <strong>Development</strong> <strong>Report</strong> <strong>2005</strong><br />
through the lens of census data on literacy, are<br />
somewhat mixed.<br />
In <strong>Karnataka</strong>, Bijapur and Dakshina Kannada<br />
were the fi rst two districts to be selected for<br />
implementation of the NLM. Their relative<br />
performances are given in Table 5.5. It is now<br />
recognised that the NLM could neither eradicate<br />
illiteracy, as promised, nor make a spectacular<br />
impact in Bijapur.<br />
Having completed the Total Literacy Campaign and<br />
Post Literacy Campaign in all districts, continuing<br />
education programmes are now being run in 18<br />
districts. At the village level, there are Continuing<br />
Education Centres (CEC) and Nodal Continuing<br />
Education Centres (NCEC) at the taluk level.<br />
Currently there are 1,513 NCECs and 14,145<br />
CECs in the state. This lull in fi nancing adult<br />
literacy programmes by the Centre needs serious<br />
rethinking when 33 per cent of the population is<br />
still illiterate.<br />
Looking ahead, it may be noted that in 2001, the<br />
literacy rate in urban and rural <strong>Karnataka</strong> was<br />
80.58 and 59.33 per cent respectively, hence<br />
the Tenth Plan goal of 75 per cent literacy rate<br />
has already been met, in the urban areas at least,<br />
although it will take some time for the rural areas<br />
to catch up. The rate of increase in the literacy rate<br />
in the rural areas between 1991 and 2001 was<br />
about 12 percentage points and at this rate, ceteris<br />
paribus, <strong>Karnataka</strong> is unlikely to meet the Tenth<br />
Plan goal of literacy in the rural areas. Furthermore,<br />
the goal of reducing the gender gap in literacy<br />
by 50 per cent by 2007 can be achieved only<br />
through strong policy initiatives. Between 1991<br />
and 2001, the gender gap in literacy reduced by<br />
only 3.1 and 3.76 percentage points in the rural<br />
and urban areas of <strong>Karnataka</strong> respectively. Hence,<br />
adult education needs another boost if the MDG<br />
and Tenth Plan goals are to be fulfi lled. A change<br />
in strategy, which addresses the issue bottom–up,<br />
i.e. from the gram panchayat up, is critical to the<br />
success of adult literacy programmes.<br />
Education<br />
This section will focus on school education from<br />
primary, up to and inclusive of plus-two education.<br />
TABLE 5.4<br />
Coefficient of variation (percentage) in literacy rates by social groups<br />
Region/Gender All SC ST<br />
1991 2001 1991 2001 1991 2001<br />
South <strong>Karnataka</strong><br />
Male 12.7 10.4 16.2 9.1 22.6 15.1<br />
Female 24.3 17.2 32.3 16.7 36.9 22.5<br />
Total 17.2 13.2 21.5 12.0 27.1 17.9<br />
North <strong>Karnataka</strong><br />
Male 15.2 9.9 22.8 13.5 27.8 17.2<br />
Female 31.5 20.4 41.2 27.1 47.5 31.8<br />
Total 20.9 14.0 28.5 18.4 33.4 22.2<br />
All Districts<br />
Male 14.0 10.6 19.0 11.8 24.7 16.5<br />
Female 29.6 21.3 37.5 25.0 44.6 30.4<br />
Total 19.8 14.8 24.8 16.7 30.5 21.5<br />
Source: Registrar General of India, Census of India, 2001, Primary Census Abstract, (estimated).<br />
TABLE 5.5<br />
Decennial growth in literacy: Bijapur and Dakshina<br />
Kannada districts - 1991 and 2001<br />
(Per cent)<br />
District Total Male Female Compound growth rate<br />
1991 2001 1991 2001 1991 2001 T M F<br />
Bijapur 56.55 57.01 70.50 69.94 41.81 43.47 0.08 -0.03 0.45<br />
Dakshina 76.74 83.35 84.88 89.70 68.84 77.21 0.88 0.65 1.15<br />
Kannada<br />
Note: In 1991 Dakshina Kannada included Udupi and Bijapur included Bagalkot.<br />
Source: Registrar General of India, Census 1991 and 2001.<br />
Tertiary education is a vast sphere, encompassing<br />
as it does, diverse fi elds such as professional<br />
courses as well as general education. A plethora<br />
of issues has emerged in higher education such as<br />
fi nancing, autonomy, governance, and quality – all<br />
in the context of equity and social justice. It would<br />
be diffi cult to address all these complex issues<br />
within the confi nes of this chapter. The Task Force<br />
on Higher Education (2004) has dealt with these<br />
aspects of higher education very comprehensively.<br />
Primary education<br />
The Supreme Court ruling in 1994 that a child has<br />
a fundamental right to free education up to age<br />
14 clearly directs the state government to take<br />
responsibility for universal elementary education<br />
(UEE). The state of <strong>Karnataka</strong> has made major<br />
With an urban literacy<br />
rate of 80.58 per cent,<br />
<strong>Karnataka</strong> has achieved<br />
the Tenth Plan goal of<br />
75 per cent literacy rate<br />
in the urban areas<br />
at least.<br />
103
Literacy and Education<br />
BOX 5.4<br />
Objectives and goals of the Department of Primary and Secondary<br />
Education<br />
Objectives/Goals<br />
Performance targets from 2002-03 (actual level) to<br />
2006-07 (targeted level)<br />
1. Enhance literacy rates. 1. Increase in literacy rate from 66.64 per cent in 2001<br />
to 80 per cent by 2004-05.<br />
2. Ensure that all children<br />
complete 8 years of primary<br />
schooling and enable 80<br />
per cent of those who<br />
complete 8 years to pursue<br />
secondary schooling and<br />
acquire the knowledge,<br />
skills and qualifi cations for<br />
further education or for<br />
employment.<br />
3. Increase achievement<br />
levels.<br />
4. Reduce income, gender,<br />
caste, religious, rural and<br />
regional gaps in enrolment,<br />
retention, completion,<br />
achievement and ensure<br />
a progression to higher<br />
education.<br />
5. Increase in non-salary<br />
expenditure.<br />
Source: Education Department, <strong>Karnataka</strong>.<br />
2.1 Reduction in percentage of children aged 6–14 who<br />
are out of school from 7.38 per cent to 0 per cent;<br />
2.2 Increase in survival rate of class I children reaching<br />
class V from 88.82 per cent to 100 per cent;<br />
2.3 Increase in survival rate of class I children reaching<br />
class VIII from 48 per cent to 85 per cent;<br />
2.4 Increase in survival rate of class I children reaching<br />
class X from 41.35 per cent to 80 per cent;<br />
2.5 Increase in gross enrolment ratio in classes I to X from<br />
84.5 per cent to 100 per cent.<br />
3.1 Increase in pass percentage in class VII from 94.96<br />
per cent to 100 per cent;<br />
3.2 Increase in pass percentage in class X from 55.57<br />
per cent to 65 per cent.<br />
4.1 Reduction in gap in percentage of out-of-school<br />
children between boys and girls from 0.4 per cent to<br />
0 per cent;<br />
4.2 Reduction in gap in percentage of out-of-school<br />
children between total and SC from 2 per cent to 0<br />
per cent;<br />
4.3 Reduction in gap in percentage of out-of-school<br />
children between total and ST from 5 per cent to 0<br />
per cent;<br />
4.4 Reduction in gap in percentage of out-of-school<br />
children between state and northeast region from<br />
6.19 per cent to 0 per cent;<br />
4.5 Reduction in gap in percentage in class X between<br />
boys and girls from 4.75 per cent to 0 per cent;<br />
4.6 Reduction in gap in percentage in class X between all<br />
students and SC/ST students from 14.2 per cent to 2<br />
per cent;<br />
4.7 Reduction in gap in percentage in class X between the<br />
state and the northeast region from 10.98 per cent to<br />
0 per cent.<br />
5.1 Increase in percentage of non-salary expenditure<br />
in total expenditure on primary education from<br />
6.86 per cent to 20 per cent;<br />
5.2 Increase in percentage of non-salary expenditure<br />
in total expenditure on secondary education from<br />
7.91 per cent to 10 per cent.<br />
strides towards achieving the goal of UEE, which<br />
requires the fulfi lment of the following objectives:<br />
(i) universal access to primary schools for all<br />
children; (ii) universal enrolment; (iii) universal<br />
retention; and (iv) universal achievement of<br />
minimum essential levels of learning by all<br />
children.<br />
Access and enrolment<br />
<strong>Karnataka</strong> has 51,904 primary schools (classes<br />
I to VIII) in 2003-04, of which 43,447 are<br />
government schools. Districts with the largest<br />
number of primary schools are Kolar (3,940),<br />
Tumkur (3,878), Belgaum (3,465) and Bangalore<br />
Urban (3,242). However, the number of primary<br />
schools by habitation is a better indicator of access<br />
than mere numbers of schools. The number of<br />
habitations with primary schools within a distance<br />
of one kilometre increased from 84 per cent in<br />
1993 to 88 per cent in 2002 (Seventh All-India<br />
Education Survey: 2002). South <strong>Karnataka</strong><br />
schools generally serve smaller populations per<br />
habitation (509) than north <strong>Karnataka</strong> schools<br />
(1,024), with the exception of Uttara Kannada,<br />
according to the Sixth All-India Education Survey.<br />
In certain districts viz. Shimoga, Chikmaglur,<br />
Hassan and Uttara Kannada, less than 75 per cent<br />
of the habitations have a primary school within<br />
a distance of one kilometre. These districts are<br />
situated in the Western Ghats, where habitations<br />
are small and widely dispersed. In most of the north<br />
<strong>Karnataka</strong> districts, however, 90 to 99 per cent of<br />
the habitations have a primary school within a<br />
distance of one kilometre, due in part to the fact<br />
that habitations are large and concentrated, but<br />
also as an outcome of policies and projects in this<br />
region (Table 5.6).<br />
The government is the dominant provider of<br />
primary education in <strong>Karnataka</strong>. The role of the<br />
private sector is minimal, but it has registered<br />
some growth in recent times. In 1990-91, about<br />
89 per cent of all primary schools were government<br />
schools, fi ve per cent were private schools, which<br />
received grants from the government, and six<br />
per cent were unaided schools. By 2003-04,<br />
aided schools and unaided schools constituted<br />
4.83 per cent and 11.46 per cent respectively and<br />
government schools constituted 83.71 per cent of<br />
104
<strong>Karnataka</strong> <strong>Human</strong> <strong>Development</strong> <strong>Report</strong> <strong>2005</strong><br />
the total number of schools, indicating a modest<br />
increase in the number of unaided schools and a<br />
relative decline in the proportion of government<br />
schools over a period of 13 years. The number of<br />
private unaided schools in the state increased at a<br />
compound growth rate of eight per cent per annum<br />
during the period 1990-91 to 2003-04 while<br />
aided schools and government schools increased<br />
at 1.8 and 1.5 per cent respectively during the<br />
same period. This suggests that there is now a<br />
slight increase in the demand for unsubsidised,<br />
primary schools but overall, the government’s<br />
role as provider of education to the poor and<br />
the vulnerable has not diminished signifi cantly.<br />
The absolute number of government schools has<br />
increased, hence the government’s proactive role<br />
continues. Districts with the highest percentage<br />
of government primary schools (classes I to VIII)<br />
are Udupi (95.05), Chikmaglur (91.63), Haveri<br />
(91.59) and Bangalore Rural (91.00) (Appendix<br />
Tables : Series 4) Table 5.7 reinforces this position:<br />
the demand for private schooling is urban-driven<br />
with a high concentration (34.1 per cent) of<br />
private, unaided schools in urban areas where the<br />
distribution of government schools is low at 47.4<br />
per cent. Predictably, Bangalore Urban district<br />
has the highest percentage (38.74) of private<br />
unaided schools. Providers of private schooling<br />
do not fi nd it profi table to establish institutions in<br />
rural areas where the population is predominantly<br />
low-income and where habitations can be<br />
both small and dispersed. The responsibility of<br />
educating the poor is shouldered by the state<br />
and any fallback here would have adverse<br />
consequences for the attainment of UEE.<br />
Enrolment in primary education (classes I to VII)<br />
grew at the rate of 1.4 per cent, encompassing<br />
growth of one per cent for boys and two per cent<br />
for girls per annum, from 1990-91 to 2003-04,<br />
indicating that girls’ education has received<br />
an impetus. Girls’ enrolment grew from 36<br />
per cent of the total enrolment in 1980-81<br />
to 48 per cent in 2003-04. Bijapur, which<br />
had the lowest rank among all the districts<br />
in girls’ enrolment in 1997-98 (KHDR 1999),<br />
continues to be the lowest ranked district in<br />
2003-04, although enrolment increased from<br />
42.2 per cent in 1997-98 to 46.8 per cent in<br />
BOX 5.5<br />
Learning via satellite<br />
The Edusat Primary Education Project is a pilot project in distance education in primary education<br />
and the fi rst of its kind in the country. It is being implemented in collaboration with ISRO.<br />
The infrastructure consists of a central hub at Bangalore and Receive only Terminals (ROTs)<br />
with 29 sets in 885 schools in the educationally backward district of Chamarajnagar. Education<br />
programmes uplinked from the hub are received via the Edusat satellite in all schools<br />
simultaneously.<br />
Edusat’s objectives are:<br />
To bring in quality improvement in classroom transactions at the primary level;<br />
To make learning child centred, interesting and motivating;<br />
To supplement classroom teaching with audio-visual support;<br />
To take children through real life situations;<br />
To give students access to the best teachers in every fi eld;<br />
To ensure that ‘diffi cult’ topics in every subject are easily understood by children;<br />
To provide inputs in non-curricular areas for the overall development of children;<br />
To encourage teachers to develop teaching learning materials (TLM) and use them<br />
effectively in classrooms.<br />
Source: Education Department.<br />
TABLE 5.6<br />
Ratio of schools to students in primary education: A profile - 2003-04<br />
Districts No. of schools Children per school<br />
Kolar 3940 114<br />
Tumkur 3878 100<br />
Belgaum 3465 221<br />
Bangalore Urban 3242 282<br />
North <strong>Karnataka</strong><br />
Bijapur 1901 210<br />
Gulbarga 2594 273<br />
Koppal 982 243<br />
Uttara Kannada 2264 98<br />
South <strong>Karnataka</strong><br />
Chikmaglur 1696 103<br />
Chitradurga 1907 147<br />
Mandya 2104 120<br />
Mysore 2339 176<br />
Note: The fi rst four districts have the highest number of primary schools in the state. The remaining eight districts are<br />
selected randomly (Appendix Tables, Series 4).<br />
Source: Commissioner for Public Instruction, <strong>Karnataka</strong>.<br />
105
Literacy and Education<br />
BOX 5.6<br />
Involving parents and the community<br />
In 2001, School <strong>Development</strong> and Monitoring Committees (SDMCs) replaced the Village<br />
Education Committees (VECs) in <strong>Karnataka</strong>. An SDMC has a 3-year term. SDMCs comprise<br />
nine elected parent members, four ex-offi cio members and six nominated members (including<br />
students) to ensure parental and community involvement and participation in the day to day<br />
activities of schools. A committee meets once a month to review the functioning of the school.<br />
A study found:<br />
85 per cent of the parents rated the functioning of SDMCs as good;<br />
83 per cent of the parents attend meetings every month;<br />
30 per cent of the teachers said that SDMCs have been effective in carrying out<br />
improvements to schools through collective participation;<br />
According to 28 per cent of the parents, the SDMC has a positive impact on retention,<br />
attendance and enrolment;<br />
Around 30 per cent of the parents said that SDMCs have improved the functioning of the<br />
midday meal scheme;<br />
79 per cent of the students reported that SDMC members visit schools regularly;<br />
87 per cent of the students reported that SDMC members visit classes, verify whether<br />
teachers conduct classes and randomly test some of the learning competencies; and<br />
More than 70 per cent of the presidents of committees said that they have attempted to<br />
bring out-of-school children back to school.<br />
Contributed by SDMCs (2002-03):<br />
38 per cent have contributed towards land and buildings;<br />
26 per cent have provided teaching learning materials (TLMs); and<br />
19 per cent have contributed cash.<br />
Every day one family supplies the vegetables and coconuts required for the midday meal served<br />
at the Government Lower Primary School, Jumbebeta, 40 km from Honnavara. The community<br />
has constructed a separate dining room. In fact, the community itself started the school, which<br />
the government later took over. The school is situated amid the thick forests of Uttara Kannada<br />
district. Despite the distance factor and geographical location the community has ensured that<br />
the school has furniture like benches, chairs, cupboards, etc. It cleans the playground through<br />
shramadana.<br />
Then and now...what a change!<br />
Old timers say this higher primary school at Sivarampet in Mysore looked like a cowshed.<br />
However, today it has been transformed by the local committee. This SDMC has formed<br />
sub-committees to look after the various developmental activities of the school. It has provided a<br />
range of facilities like drinking water, toilets, classrooms, power, a garden, teaching and learning<br />
material, sports equipment, gymnasium, a computer and books.<br />
Source: An evaluation study conducted by the Policy Planning Unit, DSERT, in collaboration with Centre for<br />
Child and the National Law School of India University.<br />
2003-04. There is not much variation between<br />
districts in girls’ enrolment. Mandya has the<br />
highest enrolment of ST girls and Gulbarga the<br />
lowest enrolment for SC girls. Enrolment was the<br />
highest in Bangalore Urban and the lowest in<br />
Bellary, though it may be noted that there is not<br />
much difference between the highest and lowest<br />
enrolment numbers.<br />
Gross and net enrolment ratios capture the<br />
multiple dimensions of schooling. It is useful<br />
to distinguish between the concept of gross<br />
enrolment and net enrolment rate. Generally, the<br />
gross and net enrolment ratios are used to capture<br />
child schooling. The enrolment rate is defi ned as<br />
the number of children enrolled in school divided<br />
by the child population in the relevant age group.<br />
The gross enrolment rate (GER) includes children<br />
at a given educational level who may be over or<br />
under-aged relative to the age group used as a<br />
divisor. The net enrolment rate (NER) is obtained<br />
by dividing the number of children in the relevant<br />
age group enrolled in a particular stage by the<br />
total child population in that specifi ed age group.<br />
The GER may, therefore, exceed 100 per cent.<br />
The GER of the state increased from 92 in 1996-97<br />
to 99 in 2000-01 and fell to 94.14 in 2003-04. In<br />
1998-99, Raichur had the lowest GER and Udupi<br />
the highest. In 2000-01, there was no change<br />
in the status of Raichur where the GER (74.54)<br />
was still the lowest, while Bangalore Urban<br />
(128.21) was the highest. During 2003-04,<br />
Dakshina Kannada had the highest GER and<br />
Raichur still had the lowest GER. Bidar’s GER has<br />
improved markedly particularly the GER of girls,<br />
TABLE 5.7<br />
Distribution of primary schools by<br />
management and area: 2002-03<br />
(Percentage)<br />
Type of school Rural Urban Total<br />
Government 91.1 47.4 84.2<br />
Private aided 2.6 18.5 5.1<br />
Private unaided 6.3 34.1 10.7<br />
All schools 84.0 16.0 100.0<br />
Source: Saikshanic Anki Anshagala Pakshinota, 2002-03,<br />
<strong>Karnataka</strong>.<br />
106
<strong>Karnataka</strong> <strong>Human</strong> <strong>Development</strong> <strong>Report</strong> <strong>2005</strong><br />
which is now on a par with their male counterparts.<br />
Across castes, the GER of the Scheduled Tribes<br />
(STs) is lower than that of the general population<br />
and the Scheduled Castes (SCs). In fact, there has<br />
been a great improvement in the GER of the SCs,<br />
which has overtaken the general population in<br />
2000-01, and which is a direct outcome of the<br />
government’s special incentive schemes. Some<br />
introspection and remedial action is called for<br />
with regard to the STs, who have a different set of<br />
problems altogether.<br />
Table 5.8 reveals that all north <strong>Karnataka</strong> districts<br />
have very high net enrolment ratios. In 2004-05,<br />
Bidar for example, has an NER of 130 for classes<br />
I to V and 131 for classes VI to VII, the highest in<br />
the state.<br />
The high GER and NER fi gures indicate that<br />
the fi rst two objectives – universal access and<br />
enrolment – have largely been achieved, and<br />
increased attention is now required in the areas of<br />
retention/attendance and quality of learning.<br />
Retention<br />
The mean years of schooling are used as an<br />
indicator of levels of educational attainment.<br />
Overall, the mean years of schooling have<br />
improved only marginally over a four year period,<br />
from 3.97 in 1999-2000 to 4.25 in 2003-04, and<br />
there is little difference between boys and girls.<br />
Across social groups the mean years of schooling<br />
of Scheduled Tribe students is slightly lower than<br />
the Scheduled Castes as well as the non-SC and<br />
non-ST students.<br />
Boys out-perform girls among the Scheduled<br />
Castes and Tribes, but overall, there is no signifi cant<br />
difference in the mean years of schooling for girls<br />
and boys in the non-SC and non-ST group. Ten<br />
districts (all 5 districts of Hyderabad <strong>Karnataka</strong>;<br />
Chamarajnagar, Davangere, Bijapur, Bagalkot,<br />
and Belgaum) are below the state average for<br />
mean years of schooling for girls in 2003-04. If<br />
free education up to the age of 14, as mandated<br />
in the Constitution, is taken as the norm, then all<br />
children must have eight mean years of schooling,<br />
and current achievement levels, therefore, fall well<br />
short of this objective.<br />
The dropout rate is an indicator of the effi ciency<br />
of the primary school system since it presents an<br />
overview of the wastage of human resources.<br />
Non-attendance and/or dropping-out are the<br />
outcomes of a combination of factors at the<br />
individual, institutional and structural levels.<br />
Structurally, poverty means that parents cannot<br />
afford the opportunity costs, preferring to put<br />
their children to work, either at home or for other<br />
people. For girls, gender disparity combines with<br />
poverty to keep them out of school for a variety of<br />
reasons, ranging from early marriage to using girls<br />
for housework and sibling care. Lack of parental<br />
support, caused largely by the parents’ own low<br />
education levels and lack of motivation, is another<br />
strong inhibiting factor. If schools are far from the<br />
habitation or have inadequate infrastructure with<br />
reference to classrooms, toilets for girls and drinking<br />
water, then parents feel discouraged. Within schools,<br />
multi-grade teaching, poor instructional quality,<br />
teacher absenteeism, repetition and the lack of<br />
BOX 5.7<br />
TABLE 5.8<br />
Net enrolment ratio<br />
Sl. No Region Age 6–11 (classes I-V) Age 12–13 (classes VI-VII)<br />
Boys Girls Total Boys Girls Total<br />
1 <strong>Karnataka</strong> 95.97 95.95 95.96 99.53 101.42 100.48<br />
2 North <strong>Karnataka</strong> 96.58 96.47 96.52 102.46 104.15 103.30<br />
3 South <strong>Karnataka</strong> 90.01 90.06 90.03 91.32 93.25 92.29<br />
Source: EMIS 2004-05, Children’s Census <strong>2005</strong>, <strong>Karnataka</strong>.<br />
Mahiti Sindhu: IT at the grassroots<br />
The high GER and NER<br />
figures indicate that the<br />
objectives of universal<br />
access and enrolment have<br />
largely been achieved.<br />
This year, the Government High School in the Indian Institute of Science Campus, Bangalore<br />
was adjudged the best secondary school providing computer education in the state and was<br />
honoured by the President of India.<br />
This success story has been replicated in 1,000 government secondary schools across the state<br />
where computer learning has become a way of life for nearly 4,00,000 children over the past<br />
4 years.<br />
Quarterly evaluations of the programme are being regularly conducted by the Computer Science<br />
departments of local engineering colleges under the guidance of the Indian Institute of Science,<br />
Bangalore. Teachers in these schools are trained in computer application, thereby enhancing<br />
their teaching skills.<br />
107
Literacy and Education<br />
% of girls’ enrolment<br />
GER values<br />
Dropout Rate<br />
70<br />
60<br />
50<br />
40<br />
30<br />
20<br />
10<br />
0<br />
48.5<br />
48<br />
47.5<br />
47<br />
46.5<br />
46<br />
45.5<br />
105.00<br />
100.00<br />
95.00<br />
90.00<br />
85.00<br />
80.00<br />
FIGURE 5.3<br />
Percentage of girls’ enrolment to total enrolment<br />
47.74<br />
46.45<br />
47.73<br />
47.38<br />
48.29<br />
1998-99 1999-2000 2000-01 2001-02 2002-03 2003-04<br />
Years<br />
95.49<br />
FIGURE 5.4<br />
Gross enrolment ratio for classes I to VIII<br />
87.82<br />
91.67<br />
96.45<br />
89.09<br />
92.83<br />
101.36<br />
96.14<br />
1996-97 1998-99 2000-01<br />
Years<br />
59 58.1 61.2 58.6<br />
48.7 52.8 49.1 51.4<br />
37.7 36.4<br />
27<br />
1992-93<br />
FIGURE 5.5<br />
Dropout rate in primary education in <strong>Karnataka</strong><br />
31<br />
1993-94<br />
I-IV<br />
1994-95<br />
I-V<br />
32.8 32.1<br />
26.7<br />
I-VII<br />
21.8<br />
1995-96<br />
I-VIII<br />
61.6 59.4<br />
46.8<br />
1996-97<br />
43.4<br />
1997-98<br />
55.2 53.9<br />
39.1<br />
28.5 28.1 29.9<br />
19.7<br />
Years<br />
16.5<br />
13.6<br />
1998-99<br />
35.6<br />
20.5<br />
12.9<br />
1999-2000<br />
98.81<br />
50.3 52<br />
37.2<br />
17.5<br />
7.9<br />
2000-01<br />
32.9<br />
11.2<br />
6<br />
2001-02<br />
48.12<br />
Boys<br />
Girls<br />
Total<br />
45.4<br />
29<br />
11<br />
8.3<br />
2003-04<br />
correlation between education and market-based<br />
job skills are some factors that encourage dropouts.<br />
This combination of factors means that 45 out of<br />
100 children enrolled in class I are likely to drop<br />
out by class VIII.<br />
The dropout rate increases as students move up<br />
from class I: 2003-04 fi gures show that out of<br />
100 children who enrolled in class I, 11 per cent<br />
dropped out by the end of class IV, 29 per cent<br />
dropped out by the end of class VII and 45 per cent<br />
by the end of class VIII. The survival rate of<br />
children in the higher classes declines even<br />
more sharply. The dropout rate for classes I to<br />
IV ranged from a high 31 per cent in 1993-94<br />
to 6 per cent in 2001-02; for classes I to VII,<br />
it fl uctuated between 52.8 per cent (1993-94)<br />
to 29 per cent (2003-04); for classes I to VIII,<br />
the dropout rate has been fairly high from<br />
1992-93 to 1999-2000 (59 to 54 per cent),<br />
before it dropped to 45.4 per cent in 2003-04<br />
(Figure 5.5).<br />
Poverty has been identifi ed as one of the main<br />
reasons for high dropout rates since the poor<br />
cannot afford the opportunity costs of education.<br />
However, there are other facets of this issue. The<br />
dropout rate for girls is invariably higher than<br />
that of boys in all classes. While there has been a<br />
decline in the dropout rate over the years, for both<br />
boys and girls, the decline is more perceptible for<br />
boys, who are regarded as socio-economic assets<br />
by the family and investing in their education is<br />
perceived as producing favourable outcomes by<br />
way of enhanced vocational skills and higher wages.<br />
Investing in girls’ education is not high priority,<br />
partly because it does not benefi t the birth family<br />
directly, but mainly because women are treated as<br />
marginal beings who can be pulled out of school<br />
to manage the home and assist in sibling care.<br />
Figure 5.6 indicates the dropout rate for both boys<br />
and girls. The dropout rate for the state is further<br />
shaped by regional disparities. The dropout rate<br />
in the districts of south <strong>Karnataka</strong> in 2003-04 is<br />
lower than both the state average and the average<br />
for north <strong>Karnataka</strong>, for boys, girls and all children.<br />
Even in north <strong>Karnataka</strong> itself, there are gaps<br />
between the Hyderabad <strong>Karnataka</strong> and Bombay<br />
<strong>Karnataka</strong> regions. The dropout rate in the districts<br />
108
<strong>Karnataka</strong> <strong>Human</strong> <strong>Development</strong> <strong>Report</strong> <strong>2005</strong><br />
of Hyderabad <strong>Karnataka</strong>, which was 56.5 per cent<br />
(1999-2000) and 46.7 per cent (2003-04),<br />
was markedly higher than 36.8 per cent<br />
(1999-2000) and 29.7 per cent (2003-04) in<br />
the districts of the Bombay <strong>Karnataka</strong> region. The<br />
gender gap in the dropout rate is very high in the<br />
northern districts whereas it has been steadily<br />
dwindling in the southern districts. The sharp<br />
decline in the dropout rate can be attributed to the<br />
concerted efforts of the state to enroll all eligible<br />
children, retain them in school and to bring back<br />
out-of-school children into either the formal or a<br />
non-formal system. Many of these schemes target<br />
the educationally backward districts of the state.<br />
According to the Children’s Census conducted by<br />
the Department of Public Instruction in <strong>2005</strong>, the<br />
highest percentage of out-of-school children in the<br />
age group 7-14 is among STs and SCs. These two<br />
social classes also have the highest percentage of<br />
out-of-school girls.<br />
The state has a gamut of schemes directed at<br />
ensuring universal enrolment and retention. Under<br />
the Vidya Vikasa programme, school children in<br />
classes I to VII get free text books and uniforms.<br />
Akshara Dasoha, the midday meals scheme, was<br />
initially introduced in seven northern districts and<br />
was subsequently extended to cover all children<br />
in classes I to VII in both government-and privateaided<br />
schools. This helps over 60 lakh children and<br />
the expenditure is of the order of Rs.280 crore.<br />
For girls, there are attendance scholarships.<br />
<strong>Karnataka</strong> has pioneered various schemes for<br />
bringing out-of-school children back to school.<br />
The schemes directly address all the major<br />
constraints faced by out-of-school children and<br />
their families. They are Chinnara Angala (bringing<br />
out-of-school children back to school), Coolienda<br />
Shalege (for child labour), fl exi schools (night<br />
schools for working children), mobile schools (for<br />
slum children), Beediyinda Shalege (for street<br />
children), Baa Baale Shalege (for the girl child),<br />
Kishori Kendra (residential bridge courses for girls<br />
in Bellary and Koppal), and Samudayadatta Shale<br />
(community rallies). These schemes have enabled<br />
the state to mainstream a number of out-ofschool<br />
children into primary education. Chinnara<br />
BOX 5.8<br />
Initiatives for north <strong>Karnataka</strong><br />
On the basis of the recommendations of the<br />
<strong>Report</strong> for the Redressal of Regional Imbalances<br />
(2002), certain actions have been initiated to<br />
improve education indicators in the northern<br />
districts of the state:<br />
Separate Additional Commissionerates<br />
of Public Instruction were established at<br />
Belgaum and Gulbarga in 2003-04;<br />
Separate Regional Secondary Examination<br />
Boards were established at Belgaum and<br />
Gulbarga.<br />
The cooked midday meals programme was<br />
initially launched in 9,724 government<br />
primary schools in the northern districts of<br />
<strong>Karnataka</strong> during 2001-02;<br />
50 per cent of the non-salary grants of the<br />
state education budget under primary and<br />
secondary heads have been earmarked for north <strong>Karnataka</strong> from 2001-02 onwards;<br />
2,587 posts of primary school teachers were moved from other parts of the state during<br />
2001-02 and 2002-03 to this region to improve the pupil–teacher ratio.<br />
The pupil-teacher ratio in north <strong>Karnataka</strong> districts came down from 42.04 in the year<br />
2001-02 to 40.97 in the year 2003-04;<br />
Large education districts were bifurcated to improve effi ciency.<br />
Dakshina<br />
Kannda<br />
Madhugiri<br />
TABLE 5.9<br />
Region-wise dropout rate at the primary level (I-VII)<br />
Region/State 1999-2000 2003-04<br />
Boys Girls Total Boys Girls Total<br />
South <strong>Karnataka</strong> 27.6 25.8 26.7 20.1 20.8 20.4<br />
Bombay <strong>Karnataka</strong> 31.4 43.1 36.8 28.1 31.5 29.7<br />
Hyderabad <strong>Karnataka</strong> 54.5 58.9 56.5 42.8 51.1 46.7<br />
North <strong>Karnataka</strong> 42.3 50.4 46.0 34.9 40.5 37.5<br />
State total 34.6 36.7 35.6 27.6 30.4 29.0<br />
Source: Commissioner for Public Instruction, <strong>Karnataka</strong>.<br />
TABLE 5.10<br />
Percentage of children who are out of school in the age group 7–14<br />
Sl. No. Category Percentage of out-of-school children<br />
Male Female Total<br />
1 All 1.47 1.62 1.54<br />
2 SCs 1.99 2.47 2.22<br />
3 STs 2.11 2.67 2.42<br />
4 Muslims 1.3 1.24 1.27<br />
Source: Children’s Census, Department of Public Instruction, <strong>2005</strong>.<br />
109
Literacy and Education<br />
BOX 5.9<br />
How to guarantee learning<br />
The Learning Guarantee Programme is co-managed by the Government of <strong>Karnataka</strong> and the<br />
Azim Premji Foundation with the goal of creating willingness among schools and communities<br />
to come forward and be evaluated on the criteria of enrolment, attendance and learning<br />
achievements of children. Schools that satisfy the criteria are eligible for awards. The programme<br />
aims to inspire and motivate teachers and schools to develop classroom practices and processes<br />
that enable every child to learn.<br />
The programme was launched in 8 education districts of north <strong>Karnataka</strong> – Bellary, Bijapur,<br />
Bagalkot, Raichur, Bidar, Gulbarga, Yadgir and Koppal. Participation in the programme was<br />
voluntary and open to all primary and upper primary schools that chose to participate. As many as<br />
6,484 schools sent in applications expressing an interest to participate in the programme and 896<br />
schools volunteered for assessment in 2003 with the number increasing to 1,443 in 2004.<br />
Criteria for a ‘Learning Guarantee School’<br />
Criteria Category A Category B Category C<br />
Enrolment 100 per cent of children in the 6–14 age group.<br />
Attendance 90 per cent of the students enrolled should have attended at least 75 per<br />
cent of the total number of working days in school.<br />
Learning 80 per cent of all children<br />
enrolled should have<br />
attained the prescribed<br />
competencies.<br />
70 per cent of all<br />
children enrolled should<br />
have attained the<br />
prescribed competencies<br />
60 per cent of all<br />
children enrolled<br />
should have<br />
the prescribed<br />
competencies.<br />
Results of school evaluation 2004<br />
1,888 schools (20 per cent of the government schools) are participating in the<br />
programme;<br />
Over 2,00,000 children were tested;<br />
82 schools won the Learning Guarantee Programme Award for 2004;<br />
The average pupil–teacher ratio (PTR) in the winning schools is 28.5 against the north<br />
<strong>Karnataka</strong> average of 43;<br />
11 per cent of the lower primary schools (LPS) evaluated were winners vs. 3 per cent<br />
higher primary schools;<br />
While 24 schools that won in 2003 did not win again in 2004, 16 schools repeated their<br />
success and 48 schools that did not win in 2003 came out winners in 2004, showing that<br />
schools can improve but must also guard their excellence zealously.<br />
The Lower Primary School at Hanakanahalli, a small village in Bellary district, stands out as<br />
a good example of what dedicated teachers, a supportive SDMC and enlightened parents can<br />
achieve if they work together as a team. The school, which was graded ‘B’ last year, upped its<br />
ante this year and emerged as an ‘A’ grade school. It is also the only school where all its<br />
students demonstrated 100 per cent achievement in Kannada and Mathematics. Yet,<br />
this multi-grade school has just two teachers who manage 33 students studying in fi ve classes<br />
in two rooms, one of which also serves as the offi ce.<br />
Angala has succeeded in mainstreaming more<br />
than half of the total benefi ciary children. The<br />
highest proportion of children mainstreamed for<br />
all schemes is in the Hyderabad <strong>Karnataka</strong> region.<br />
However, even programmes with a small number<br />
of benefi ciaries are no less critical since the real<br />
effort lies in enrolling the ‘last mile’ children.<br />
These children are from the most disadvantaged<br />
sections of society – urban street children and<br />
child labourers – whose income is critical to their<br />
families, and getting them into school is a diffi cult<br />
task (Table 5.11).<br />
Infrastructure<br />
Lack of infrastructure or inadequate infrastructure<br />
is among the factors cited for high dropout rates.<br />
Causes range from lack of classrooms, latrines,<br />
and separate latrines for girls, to not provisioning<br />
safe drinking water. An infrastructure index has<br />
been constructed based on the percentage of<br />
schools run in their own buildings, availability<br />
of electricity, water, common toilets, separate<br />
toilets for girls, pucca buildings/kutcha buildings/<br />
no building. The infrastructure index has been<br />
constructed by using the formula: average of<br />
[(Actual - Min)/(Max - Min)]. Based on this index,<br />
Bangalore Urban district (0.81) tops in terms of<br />
facilities provided to students and Uttar Kannada<br />
(0.20) is last. The extent of the gulf between<br />
TABLE 5.11<br />
Percentage of children benefited<br />
through various programmes:<br />
<strong>Karnataka</strong><br />
Name of programmes<br />
Percentage of<br />
beneficiaries<br />
Chinnara Angala 51.50<br />
Baa Marali Shalege 10.52<br />
Coolienda Shalege 1.57<br />
Beediyinda Shalege 0.54<br />
Baa Baale Shalege 5.12<br />
Special Enrolment Drive 27.70<br />
Through EGS 2.62<br />
Flexi School 0.21<br />
Mobile School 0.22<br />
Grand Total 100.00<br />
Source: Sarva Shiksha Abhiyana Samithi, <strong>Karnataka</strong>.<br />
110
<strong>Karnataka</strong> <strong>Human</strong> <strong>Development</strong> <strong>Report</strong> <strong>2005</strong><br />
Bangalore Urban and the second ranking district,<br />
Kodagu, is represented by 0.16 points. Across<br />
regions, Hyderabad <strong>Karnataka</strong> has the lowest and<br />
south <strong>Karnataka</strong> the highest infrastructure index.<br />
Within south <strong>Karnataka</strong>, Chitradurga, Tumkur<br />
and Hassan have lower infrastructure indices<br />
than certain districts of north <strong>Karnataka</strong> such as<br />
Dharwad and Gadag (Figure 5.7). A study found<br />
that poor school infrastructure not only repelled<br />
students, it also kept teachers away as well (World<br />
Bank 2004). Better infrastructure for teachers<br />
meant availability of teachers’ toilets, electricity,<br />
covered classrooms, non-mud fl oors and libraries.<br />
In fact, it has been found that schools that are<br />
near paved roads have less teacher absence.<br />
Teachers<br />
Ensuring that there is an adequate number of<br />
trained teachers obviously improves the quality of<br />
instruction in schools. In <strong>Karnataka</strong>, only trained<br />
teachers are recruited, and the department is<br />
conducting in-service training regularly. There has<br />
been a perceptible improvement in the pupil–<br />
teacher ratio (PTR) at the primary level, which<br />
declined from 38 in 1998-99 to 35 in 2003-04,<br />
indicating that <strong>Karnataka</strong> has now attained the<br />
national norm of 35 students per teacher at the<br />
primary level. Across districts, however, no district<br />
in north <strong>Karnataka</strong>, except Uttara Kannada, and all<br />
the districts of south <strong>Karnataka</strong> except Bangalore<br />
Urban and Dakshina Kannada have fulfi lled this<br />
norm (Appendix Tables: Series 4). This is probably<br />
because habitations in most of south <strong>Karnataka</strong>,<br />
as in Uttar Kannada district, are small and widely<br />
dispersed. Within Hyderabad <strong>Karnataka</strong>, Bidar<br />
has the lowest PTR. Urban schools have a higher<br />
PTR than rural schools, due, in part, to the lower<br />
student strength in rural schools. Managementwise,<br />
the PTR for 2003-04 indicates that the<br />
PTR is higher in private aided schools than in<br />
government and unaided schools. The trend shows<br />
that a high PTR is correlated with low enrolment<br />
and a high dropout rate. The Learning Guarantee<br />
Scheme found that the high-performing schools<br />
in north <strong>Karnataka</strong> had a PTR (28.5) which was<br />
markedly lower than the local average of 43.<br />
More than 3 per cent of schools are still without<br />
teachers and 19 per cent schools function<br />
State<br />
TABLE 5.12<br />
Basic infrastructure in primary schools: India and selected states<br />
Drinking<br />
water<br />
Urinal<br />
Percentage of schools with:<br />
Separate<br />
urinal for<br />
girls<br />
Lavatory<br />
Separate<br />
lavatory<br />
for girls<br />
Andhra Pradesh 31.42 7.34 4.94 6.01 4.27<br />
<strong>Karnataka</strong> 23.94 4.57 2.28 3.31 1.77<br />
Kerala 76.16 81.38 50.97 40.29 12.05<br />
Tamil Nadu 62.34 19.97 12.10 12.57 8.23<br />
India 44.23 18.93 8.66 10.86 5.12<br />
Source: Sixth All-India School Education Survey, 1993.<br />
Infrastructure index values<br />
Dropout Rate<br />
90<br />
80<br />
70<br />
60<br />
50<br />
40<br />
30<br />
20<br />
10<br />
0.00<br />
60<br />
50<br />
40<br />
30<br />
20<br />
10<br />
0<br />
FIGURE 5.7<br />
District-wise infrastructure index for primary schools: 2003-04<br />
0.46<br />
0.40<br />
Bagalkot<br />
6.7<br />
19<br />
0.81<br />
FIGURE 5.6<br />
Dropout rate (percentage) in various classes<br />
34.6<br />
52.1<br />
Boys Girls Total Boys Girls Total<br />
1999-2000<br />
2003-04<br />
Year and Children I-IV I-V I-VII I-VIII<br />
0.36<br />
0.41<br />
0.32<br />
0.29<br />
0.48<br />
0.42<br />
0.28<br />
Bangalore Rural<br />
Bangalore Urban<br />
Belgaum<br />
Bellary<br />
Bidar<br />
11.6<br />
22<br />
Bijapur<br />
35.6<br />
Chamarajnagar<br />
Chikmaglur<br />
56<br />
9.1<br />
0.64<br />
20.5<br />
0.37<br />
35.6<br />
53.9<br />
0.60<br />
0.61<br />
12.1<br />
8.7<br />
0.25<br />
0.28<br />
27.6<br />
0.38<br />
Districts<br />
Note: Infrastructure index calculated for all type of management schools.<br />
42.8<br />
0.65<br />
9.8<br />
7.9<br />
0.33<br />
0.38<br />
0.48<br />
30.4<br />
0.61<br />
48.2<br />
11<br />
8.3<br />
0.34<br />
0.44<br />
0.30<br />
Chitradurga<br />
D. Kannada<br />
Davangere<br />
Dharwad<br />
Gadag<br />
Gulbarga<br />
Hassan<br />
Haveri<br />
Kodagu<br />
Kolar<br />
Koppal<br />
Mandya<br />
Mysore<br />
Raichur<br />
Shimoga<br />
Tumkur<br />
29<br />
0.54<br />
45.4<br />
0.20<br />
Udupi<br />
U. Kannada<br />
0.47<br />
0.38<br />
0.43<br />
South <strong>Karnataka</strong><br />
North <strong>Karnataka</strong><br />
<strong>Karnataka</strong><br />
111
Literacy and Education<br />
Girls’ education gets<br />
a strong impetus with<br />
the presence of female<br />
teachers in a school.<br />
Government policy<br />
directs that women shall<br />
constitute not less than<br />
50 per cent of teachers<br />
recruited to the state<br />
school system. The<br />
proportion of female<br />
teachers has, accordingly,<br />
increased from 46<br />
per cent in 1998-99 to<br />
54 per cent in 2003-04.<br />
TABLE 5.13<br />
Teacher absence and teaching activity<br />
in schools: <strong>Karnataka</strong> and selected<br />
states<br />
State<br />
Teacher<br />
absence<br />
percentage<br />
Non-teaching<br />
activity -<br />
percentage of<br />
observations<br />
<strong>Karnataka</strong> 21.70 44.00<br />
Maharashtra 14.60 40.70<br />
Gujarat 17.00 43.10<br />
Madhya Pradesh 17.60 48.90<br />
Kerala 21.20 43.50<br />
Tamil Nadu 21.30 50.40<br />
Orissa 23.40 56.20<br />
Rajasthan 23.70 63.40<br />
West Bengal 24.70 53.90<br />
Andhra Pradesh 25.30 57.00<br />
Source: World Bank Survey, 2004.<br />
with single teachers (Seventh All-India School<br />
Education Survey, Provisional Statistics, 2002).<br />
This problem is more pronounced in rural areas,<br />
while urban areas often have a glut of teachers.<br />
This affects the quality of instruction and widens<br />
the rural–urban and inter-district disparity in<br />
teaching and learning.<br />
Teacher absenteeism, whether for authorised or<br />
unauthorised reasons, has an adverse effect on<br />
the quality of education. A World Bank survey<br />
(2004) found that nearly 22 per cent of teachers<br />
are absent from government primary schools on a<br />
typical day in <strong>Karnataka</strong>.<br />
Teachers who are more powerful, defi ned in this<br />
context, as male, older and better educated, and<br />
head teachers, are more likely to be absent. In<br />
this respect, the survey found that there was not<br />
much difference between government and private<br />
(aided and unaided) school teachers or regular<br />
and contract employees. Multi-grade schools<br />
report a higher incidence of teacher absence. Only<br />
45 per cent of the teachers surveyed were actually<br />
found teaching during the survey. Low teacher<br />
attendance translates into low student attendance<br />
and poor examination scores.<br />
Girls’ education gets a strong impetus with<br />
the presence of female teachers in a school.<br />
Government policy directs that women shall<br />
constitute not less than 50 per cent of teachers<br />
recruited to the state school system. The proportion<br />
of female teachers has, accordingly, increased<br />
from 46 per cent in 1998-99 to 54 per cent in<br />
2003-04. Kodagu has the highest proportion<br />
of female teachers (79.2 per cent) and Bijapur<br />
the lowest (38 per cent) in 2003-04. Dakshina<br />
Kannada has seen a signifi cant improvement in<br />
this regard, from 39.26 per cent in 1998-99 to<br />
73.91 per cent in 2003-04, but the percentage<br />
of female teachers has declined in Bangalore<br />
Urban, Koppal and Udupi districts. The proportion<br />
of women teachers in rural schools is about half of<br />
that in urban schools with a few exceptions. While<br />
this says something about the lack of facilities for<br />
women teachers in rural areas, it also has adverse<br />
gender outcomes in terms of low girls’ enrolment<br />
and retention in rural <strong>Karnataka</strong>.<br />
Minimum levels of learning<br />
Achievement of certain minimum levels of<br />
learning is the fourth objective of UEE and the<br />
most diffi cult to attain. Given the huge spread of<br />
the public school system, maintaining uniformity<br />
in instructional quality is a challenging task.<br />
Certain programmes have been introduced by the<br />
government to improve the quality of teaching<br />
and learning. Keli-Kali is an innovative radio<br />
programme for primary school children. The radio<br />
programmes are broadcast across the state to<br />
cover nearly 6.1 million students in classes III<br />
to VI. Its objectives are to provide the benefi t of<br />
expert teaching to all students, promote student<br />
teacher interaction and to inculcate in children<br />
an awareness of joyful learning. Songs, local<br />
dialects, folklore and sound effects contribute to<br />
the attractiveness and topicality of the lessons.<br />
With so many multi-grade schools still in<br />
existence, managing uniform levels of learning<br />
in all grades becomes a complex task for the<br />
teacher. Bahumukhi, a training module on<br />
multi-grade and multi-level learning, enables<br />
teachers to implement strategies such as<br />
effective implementation of instructional plan,<br />
activity-based teaching methodology, effective<br />
112
use of teaching and learning material (TLM) and<br />
community resources, co-curricular activities,<br />
classroom management, time management,<br />
Keli-Kali radio lessons and continuous and<br />
comprehensive evaluation, to ensure that students<br />
in multi-grade schools do not lose out on quality.<br />
More recently, the trimester system has been<br />
introduced: (i) to ensure there is continuous and<br />
activity-based learning during the academic<br />
year, through project work; (ii) to render learning<br />
more meaningful and interesting to children, by<br />
including non-cognitive areas such as drawing,<br />
music, yoga, drama and value education in the<br />
curriculum; (iii) to build systems for internal<br />
assessment and evaluation by introducing grades<br />
for evaluation. All these are recent initiatives<br />
directed at improving the quality of instruction and<br />
learning and the real test is whether the system<br />
can be successfully replicated across regions and<br />
schools with varying levels of infrastructure.<br />
Examination scores may not be the best way of<br />
testing a child’s learning skills since the system<br />
itself prioritises rote learning over comprehension<br />
and analysis. At present, however, it is the only<br />
formal system of evaluation of student and teacher<br />
performance and one way of assessing the quality<br />
of instruction is to look at the number of children<br />
who appear for, and pass the examinations<br />
after completing seven years of schooling. The<br />
government has a policy of ‘no detention till<br />
class V’, thereby ensuring that all children who<br />
attend school for a minimum number of days are<br />
promoted to the next higher class, irrespective<br />
of learning achievements. While this policy helps<br />
to keep children in school, thus increasing the<br />
years of schooling and reducing dropouts, its<br />
effect on levels of learning is not satisfactory. The<br />
examination results indicate an improvement in<br />
the pass percentage from 84 per cent in 1997 to<br />
91 per cent in 2002. Despite their high dropout<br />
rate, girls have a better pass percentage than boys.<br />
This trend is manifested across all caste groups,<br />
leading to the inevitable conclusion that the socioeconomic<br />
factors that work against retaining girls<br />
in school cause a tremendous waste of human<br />
potential for the individual and the country. Across<br />
districts, Gulbarga had the lowest and Mandya<br />
the highest pass percentage in 2002. There is<br />
little signifi cant difference in the pass percentages<br />
of different caste groups. It is self-evident that<br />
districts with high literacy rates, a low dropout<br />
rate, low PTR and good infrastructure in schools<br />
will perform well in the class VII examination.<br />
Table 5.14 presents a summary of examination<br />
results.<br />
Secondary education<br />
The demand for secondary education is bound<br />
to increase as <strong>Karnataka</strong> moves steadily<br />
towards universal elementary education. The<br />
demand is likely to peak within a few years<br />
of the inception of the Eleventh Plan period.<br />
The educational sector will have to address the<br />
challenges of universal secondary education by<br />
ensuring budgetary support for putting in place<br />
the infrastructure required to meet the needs of<br />
the most underdeveloped districts of the state,<br />
so that quality does not become a casualty as<br />
the system expands its outreach. Universal<br />
access is emerging as a critical concern since<br />
denial of quality education to children because<br />
of gender, economic class, caste and geographic<br />
location raises serious equity issues. Retention<br />
of students who enter secondary education calls<br />
for imaginative approaches to ensuring that<br />
instructional material and curricula are relevant<br />
and develop vocational skills in students.<br />
<strong>Karnataka</strong> Education Department’s EduVision<br />
document stated that 65 per cent of children<br />
in the relevant age group would enter the<br />
Year<br />
TABLE 5.14<br />
7th standard examination pass<br />
percentages: <strong>Karnataka</strong><br />
Pass percentages<br />
Boys Girls Total<br />
1997 81.90 86.05 83.77<br />
1998 84.77 88.59 86.49<br />
1999 88.29 91.34 89.68<br />
2000 91.32 93.68 92.40<br />
2001 90.99 93.52 92.16<br />
2002 89.88 92.54 91.12<br />
Source: <strong>Karnataka</strong> Secondary Education Examination Board,<br />
Bangalore.<br />
<strong>Karnataka</strong> <strong>Human</strong> <strong>Development</strong> <strong>Report</strong> <strong>2005</strong><br />
The educational sector<br />
will have to address the<br />
challenges of universal<br />
secondary education<br />
by ensuring budgetary<br />
support for putting in<br />
place the infrastructure<br />
required to meet the<br />
needs of the most<br />
underdeveloped districts<br />
of the state, so that<br />
quality does not become<br />
a casualty as the system<br />
expands its outreach.<br />
113
Literacy and Education<br />
Given the dominance<br />
of the private sector in<br />
secondary education,<br />
government schools<br />
fortunately have a strong<br />
presence in rural areas<br />
where they can achieve<br />
optimal impact in terms of<br />
universal access.<br />
secondary education stream, and 80 per cent of<br />
those who joined should complete the course,<br />
and that secondary school leavers should be<br />
equipped with the technical and communication<br />
skills necessary to join the world of work.<br />
Access<br />
In the year 2003-04, <strong>Karnataka</strong> had 9,012<br />
high schools, representing a 10 per cent growth<br />
since the last HDR (1999). Of these, 3,029 were<br />
government, 2,621 were private aided and 3,362<br />
were unaided institutions. Bangalore Urban<br />
district (1,179) had the largest number of high<br />
schools followed by Belgaum (636) and Tumkur<br />
(593) (Appendix Tables: Series 4).<br />
Private, unaided schools grew very rapidly from<br />
845 in 1990-91 to 3,362 in 2003-04. From<br />
1998-99 to 2002-03, however, the rate of<br />
growth of unaided schools was 20 per cent while<br />
government and aided schools grew at 46 and<br />
seven per cent respectively. About two-third of high<br />
schools are located in south <strong>Karnataka</strong> whereas<br />
only 57.3 per cent of the state’s population<br />
resides in this region. This pattern is replicated<br />
for all types of management. Gulbarga had the<br />
highest number of government schools (251),<br />
Belgaum the largest number of aided schools<br />
(271) and Bangalore Urban had 841 unaided<br />
schools. In fact, Bangalore Urban depends heavily<br />
on the private sector to provide school education.<br />
It also had a large number of private, aided<br />
schools (235). Districts adjacent to Bangalore<br />
Urban such as Tumkur, Kolar and Bangalore Rural,<br />
and Belgaum and Bidar in north <strong>Karnataka</strong> also<br />
had a signifi cant number of unaided high schools.<br />
In addition to Bangalore Urban district, Belgaum,<br />
Bijapur, Bangalore Rural, Chitradurga, Dakshina<br />
Kannada, Davangere, Tumkur and Uttara Kannada<br />
had a heavy concentration of aided schools.<br />
TABLE 5.15<br />
Secondary schools in <strong>Karnataka</strong>: 2003-04<br />
Region Government Aided Unaided Total<br />
South <strong>Karnataka</strong> 1769 1567 2349 5685<br />
North <strong>Karnataka</strong> 1260 1054 1013 3327<br />
Total 3029 2621 3362 9012<br />
Source: Commissioner of Public Instruction, <strong>Karnataka</strong>.<br />
The distribution pattern of high schools does not<br />
seem to be correlated with the socio-economic<br />
needs of the student population. Given the<br />
dominance of the private sector in secondary<br />
education, government schools fortunately have<br />
a strong presence in rural areas where they can<br />
achieve optimal impact in terms of universal<br />
access, while unaided schools are concentrated<br />
in urban areas where incomes are higher and<br />
parents are ready to pay for what is perceived<br />
as ‘quality education’. ‘Quality’ is that highly<br />
marketable commodity which is associated with<br />
private schools, aided and unaided, though<br />
unaided schools which do not have to conform<br />
to certain government regulations are seen as<br />
vastly superior by parents. The social awareness of<br />
urban parents about the importance of education<br />
in enhancing their wards’ life skills and enlarging<br />
their choices leads them to demand quality in<br />
education, and they are both willing and able to<br />
pay for ‘quality’ education, which often means<br />
education in English-medium schools.<br />
The scenario is quite different among the poor,<br />
who have to be persuaded into accepting the<br />
value of education and be motivated to send<br />
their children to school. The elite do not send their<br />
wards to government schools because they lack<br />
quality. Private schools typically provide better<br />
infrastructure such as classrooms, laboratories,<br />
libraries, and other resources such as sports<br />
and extra-curricular activities, but at a price. In<br />
terms of quality, government has highly qualifi ed<br />
teachers, but in terms of motivation and outcomes,<br />
private schools often do better. This does result in<br />
a scenario where the poor and marginal groups<br />
have access to an education quite different from<br />
that which the elite enjoy. The answer would be to<br />
improve the quality of education in government<br />
schools and hope that private schools will provide<br />
scholarships to the academically gifted poor, as in<br />
the West.<br />
Enrolment<br />
Enrolment in high schools increased from 5,57,735<br />
in 1997-98 to 19,49,404 in 1999-2000 and was<br />
19,51,313 in 2002-03. In the year 1997-98, the<br />
percentage of girls was 43, which increased to<br />
46.5 in 2003-04 (Table 5.16).<br />
114
<strong>Karnataka</strong> <strong>Human</strong> <strong>Development</strong> <strong>Report</strong> <strong>2005</strong><br />
South <strong>Karnataka</strong> may have the highest percentage<br />
of enrolled girls, but enrolment has grown more<br />
rapidly in the Bombay and Hyderabad <strong>Karnataka</strong><br />
regions. There has been a truly impressive growth<br />
in ST girls’ enrolment in Hyderabad <strong>Karnataka</strong>.<br />
Overall, the proportion of enrolment among girls<br />
from the Scheduled Tribes is higher than that of<br />
Scheduled Castes and over the years, the enrolment<br />
of ST girls has increased at a faster rate than that<br />
of others. Hassan had the highest percentage of<br />
enrolled girls and Koppal the lowest in 2003-04.<br />
However, the enrolment among the SC and ST girls<br />
in some districts is still a matter of concern; for<br />
example, it is below 25 per cent and 29 per cent<br />
in Koppal and Gulbarga districts respectively.<br />
Signifi cant gender differentials in enrolment exist<br />
between rural and urban areas in some of the less<br />
developed districts of north <strong>Karnataka</strong>, viz. Bijapur,<br />
Bagalkot, Gulbarga, Bellary and Raichur (Seventh<br />
All-India Education Survey, 2002, Provisional<br />
Statistics). Government schools have the highest<br />
number of enrolled girls, indicating that they either<br />
fulfi ll the demands of equity or that parents are<br />
less willing to incur the costs of private schooling<br />
for daughters. However, the retention rate of girls<br />
declines in the higher classes as they are pulled out<br />
of school to get married or to stay at home.<br />
The gross enrolment ratio in secondary education<br />
in classes I to X has improved from 84 in 1998-99<br />
to 90 in 2000-01. There is a marked difference<br />
between the GER of girls (87) and boys (93).<br />
Across social groups, the GER of ST students is<br />
lower than that of SCs and all communities.<br />
A completely different picture emerges if one<br />
examines the GER for classes XI and XII only. In<br />
1998-99, the GER for the secondary stage was<br />
47.9 and it increased to 52.1 in 2003-04. There<br />
is not much difference between boys and girls. The<br />
GER for these two classes is almost half of the<br />
GER for classes I to X (Table 5.17). In 2000-01<br />
and 2003-04, the GER of Raichur was the lowest<br />
in respect of all children, girls and boys. Gulbarga<br />
has the lowest GER for ST children in 2000-01.<br />
Retention<br />
There has been a decline in the dropout rate in<br />
secondary education (classes I to X) over the<br />
years. In 1992-93, the dropout rate in secondary<br />
Percentage of Schools<br />
60.00<br />
50.00<br />
40.00<br />
30.00<br />
20.00<br />
10.00<br />
0.00<br />
31.06<br />
48.78<br />
FIGURE 5.8<br />
High schools by management<br />
20.16<br />
1990-91 1998-99 2002-03<br />
education was 71 per cent and it declined to<br />
59.61 per cent in 2003-04. Kodagu had the<br />
lowest dropout rate and Bellary the highest in<br />
1999-2000. In 2003-04, Kodagu and Tumkur<br />
had the lowest dropout rates, i.e. below 23<br />
per cent and 30 per cent respectively. Gulbarga<br />
(76.55 per cent) and Bellary (75.77 per cent)<br />
had the highest percentage of dropouts that year.<br />
About 61 per cent girls drop out when they reach<br />
class X. The dropout rate of girls varied from 16<br />
28.25 33.44 38.30 37.94<br />
31.97 30.09<br />
Govt. Pvt. Aided Pvt. Unaided<br />
TABLE 5.16<br />
Percentage of girls enrolled in secondary schools<br />
Region/State 1998-99 2003-04<br />
All SC ST All SC ST<br />
Bombay <strong>Karnataka</strong> 39.9 36.7 39.0 44.0 33.7 42.3<br />
Hyderabad <strong>Karnataka</strong> 39.5 34.0 31.8 44.2 36.1 37.1<br />
South <strong>Karnataka</strong> 46.8 45.8 43.7 48.2 44.1 46.3<br />
North <strong>Karnataka</strong> 39.7 35.7 35.5 44.1 34.8 39.7<br />
State 44.2 42.9 40.9 46.5 41.3 43.9<br />
Source: Commissioner of Public Instruction, <strong>Karnataka</strong>.<br />
TABLE 5.17<br />
GER for secondary education for classes I–X and XI–XII<br />
Year GER: Class I-X GER: Class XI-XII<br />
Boys Girls Total Boys Girls Total<br />
1998-99 (All) 87.03 80.37 83.77 48.03 47.82 47.93<br />
2000-01 (All) 92.86 86.89 89.95 55.53 44.98 50.47<br />
2000-01 (SCs) 97.63 90.77 94.31 46.85 44.32 45.66<br />
2000-01 (STs) 85.59 76.51 81.17 42.20 35.20 38.91<br />
2003-04 (All) 86.99 84.31 85.69 53.91 50.13 52.08<br />
Source: Commissioner of Public Instruction, <strong>Karnataka</strong>.<br />
115
Literacy and Education<br />
The enrolment of girls<br />
is lower than that of<br />
boys and their dropout<br />
rate is higher, but the<br />
inescapable reality is<br />
that if girls continue with<br />
their education, then they<br />
perform exceedingly well.<br />
per cent (Kodagu) to a high 79 per cent in<br />
Gulbarga in 2003-04. The overall dropout rate<br />
is high in north <strong>Karnataka</strong> as only three districts<br />
of this region are below the state average as<br />
compared to eight districts of south <strong>Karnataka</strong>,<br />
which are below the state average. Figure 5.9<br />
depicts that even though the dropout ratio has<br />
been declining since 1992-93 to 2003-04, it is<br />
still quite high at around 60 per cent.<br />
Appointment of teachers<br />
Recruitment of teachers has kept pace with<br />
enrolment, as the pupil–teacher ratio has<br />
remained almost constant: merely changing<br />
from 23 in 1997-98 to 25 in 2002-03. Bidar<br />
has the highest PTR and Kodagu the lowest, but<br />
the variation between regions is not signifi cant.<br />
The presence of women teachers, especially in<br />
rural areas, actively enhances the enrolment and<br />
retention of girls at the secondary level. Parents<br />
hesitate to send teenagers to schools that are<br />
staffed almost exclusively by men. The percentage<br />
of female teachers in the state was 33.37<br />
per cent in 1998-99, but fell to 32.33 per cent<br />
in 2002-03. Bijapur had the lowest percentage<br />
of female teachers (13.2) and Bangalore Urban<br />
the highest (64.5) in 1998-99. By 2003-04<br />
Gulbarga had the lowest percentage (10.16)<br />
while Bangalore Urban still topped the list with<br />
58.68 per cent female teachers. This highlights<br />
an unfortunate trend which is confi rmed by the<br />
Seventh All-India Education Survey provisional<br />
fi gures: the percentage of women teachers in<br />
rural areas is almost half the number in urban<br />
areas in almost all districts. Districts in the<br />
Hyderabad <strong>Karnataka</strong> and Bombay <strong>Karnataka</strong><br />
region, with low retention numbers for girls, are<br />
also below the state average in terms of women<br />
teachers (Table 5.18). This scenario does little<br />
to whittle away at socio-cultural biases that<br />
work for the attrition of girls in secondary<br />
education. The gender biases that women<br />
teachers experience in the work place also<br />
encourage them to opt for the relative security<br />
of urban areas. This is one Catch 22 situation to<br />
which innovative solutions, such as residential<br />
quarters for women teachers and residential<br />
schools for girls, will have to be found.<br />
School infrastructure<br />
This is another variable that infl uences both<br />
enrolment and retention, especially of girl students.<br />
Drinking water and separate toilets for girls are<br />
not always available in high school buildings. Only<br />
32 per cent of the high schools in the state have<br />
separate toilets for girls and only 46 per cent<br />
have common toilets for boys and girls. Gadag<br />
has the highest percentage of high schools with<br />
toilets for girls and Chamarajnagar the lowest.<br />
The absence of toilets for adolescent girls is rather<br />
high in the state. Uttara Kannada, Gulbarga and<br />
Chamarajnagar have the lowest infrastructure<br />
index while Dakshina Kannada, Udupi and<br />
Chikmaglur have the highest (Figure 5.10).<br />
Educational attainments<br />
Performance in board examinations shows that<br />
students in privately managed schools and<br />
urban schools perform better than students from<br />
government and rural schools. The performance<br />
Dropout rate (%)<br />
80<br />
70<br />
60<br />
50<br />
40<br />
30<br />
20<br />
10<br />
0<br />
1992-93<br />
FIGURE 5.9<br />
Dropout rate in classes I–X<br />
70.85 67.21 66.76 65.72 67.78 67.29 64.83 66.89 62.78<br />
58.65 55.79<br />
1993-94<br />
1994-95<br />
1995-96<br />
1996-97<br />
Years<br />
1997-98<br />
1998-99<br />
1999-2000<br />
2000-01<br />
2001-02<br />
2002-03<br />
2003-04<br />
59.61<br />
TABLE 5.18<br />
Percentage of female teachers in<br />
secondary schools by rural and urban<br />
areas in <strong>Karnataka</strong>: 2002<br />
Region Rural Urban<br />
Bombay <strong>Karnataka</strong> 19.24 40.52<br />
Hyderabad <strong>Karnataka</strong> 17.36 49.24<br />
South <strong>Karnataka</strong> 24.93 63.75<br />
North <strong>Karnataka</strong> 18.59 44.10<br />
State 22.46 58.13<br />
Source: Seventh All-India Education Survey, Provisional Statistics,<br />
2002.<br />
116
of SC/ST students is also unsatisfactory, but<br />
overall, girls in every social group usually outperform<br />
boys. As we saw, the enrolment of girls<br />
is lower than that of boys and their dropout rate<br />
is higher, but the inescapable reality is that if girls<br />
continue with their education, then they perform<br />
exceedingly well. Their high attrition rate from<br />
class I to X signals wastage of human resources<br />
on an unimaginable scale. This is a loss, both for<br />
women as gender-class and for a nation where<br />
vulnerable sub-groups such as women, SCs and<br />
STs dropout of a system that can bring great<br />
rewards to those who perform well.<br />
Infrastructure index<br />
0.80<br />
0.70<br />
0.60<br />
0.50<br />
0.40<br />
0.30<br />
0.20<br />
0.10<br />
0.00<br />
0.27<br />
<strong>Karnataka</strong> <strong>Human</strong> <strong>Development</strong> <strong>Report</strong> <strong>2005</strong><br />
FIGURE 5.10<br />
District-wise infrastructure index for secondary schools<br />
0.56<br />
0.55<br />
0.47<br />
0.46<br />
0.25<br />
0.36<br />
0.17<br />
0.62<br />
0.46<br />
0.73<br />
0.44<br />
0.33<br />
0.51<br />
0.19<br />
0.38<br />
0.43<br />
0.42<br />
0.23<br />
0.52<br />
0.47<br />
0.46<br />
0.47<br />
Bagalkot<br />
Bangalore Rural<br />
Bangalore Urban<br />
Belgaum<br />
Bellary<br />
Bidar<br />
Bijapur<br />
Chamarajnagar<br />
Chikmaglur<br />
Chitradurga<br />
D. Kannada<br />
Davangere<br />
Dharwad<br />
Gadag<br />
Gulbarga<br />
Hassan<br />
Haveri<br />
Kodagu<br />
Kolar<br />
Koppal<br />
Mandhya<br />
Mysore<br />
Raichur<br />
Shimoga<br />
Tumkur<br />
U. Kannada<br />
Udupi<br />
0.25<br />
0.55<br />
0.19<br />
0.69<br />
The highest pass percentage in the secondary<br />
school board examination in 2004 was in Udupi<br />
and the lowest was in Gulbarga district. Over<br />
the years, the pass percentage has not shown<br />
any consistent trend. There was a marginal<br />
increase in the pass percentage from 54 per cent<br />
in 1990 to 56 per cent in 2004 in the state<br />
(Appendix Tables: Series 4)<br />
Plus-two education<br />
Since the focus of this chapter is school education,<br />
we propose to dwell only briefl y on the next levels<br />
of education. ‘Plus-two’, or ‘pre-university’ (PU)<br />
education, in <strong>Karnataka</strong> is conducted in both high<br />
schools and pre-university colleges. Conceptually, it<br />
is a bridge leading from high school to professional<br />
courses in medicine, engineering, agriculture et. al.<br />
or to general education. A student who passes high<br />
school should ideally decide at this point whether<br />
he or she wants to pursue vocational education in<br />
polytechnics, industrial training institutes or at the<br />
plus-two stage itself in pre-university courses, or<br />
move on to tertiary education.<br />
The ratio of PU colleges increased from 3.9<br />
per one lakh population in 1998 to 4.4 in<br />
2003-04. Overall, PU colleges are unevenly<br />
distributed across the state, with southern<br />
<strong>Karnataka</strong> having the highest number of PU<br />
colleges and Hyderabad <strong>Karnataka</strong> the least.<br />
In 2003-04, eight districts in north <strong>Karnataka</strong><br />
and four districts in south <strong>Karnataka</strong> were<br />
below the state average. The enrolment in PU<br />
colleges has increased at a faster rate than for<br />
all other institutions.<br />
TABLE 5.19<br />
SSLC results: Percentage of students who passed the class X<br />
examination<br />
Results by 1990 1993 1995 1997 1999 2001 2003 2004 <strong>2005</strong><br />
Type of School<br />
Government 45.4 39.8 30.6 32.5 47.3 42.5 51.2 62.2 NA<br />
Private 60.0 56.7 51.5 57.2 61.7 56.3 58.6 68.8 NA<br />
Gender<br />
Boys 52.3 48.7 42.5 43.2 55.0 49.7 52.2 61.7 59.3<br />
Girls 58.4 55.9 48.8 48.3 58.9 52.4 58.5 64.5 66.1<br />
Region<br />
Rural 52.4 46.4 40.5 40.3 54.1 47.9 53.7 57.1 NA<br />
Urban 56.4 56.4 48.8 57.2 59.9 55.9 56.4 55.6 NA<br />
Social groups<br />
SC/ST 41.3 40.8 32.5 32.1 43.8 36.7 51.3 52.7 49.40<br />
General 57.1 53.6 47.8 48.5 59.6 48.1 54.6 57.0 66.02<br />
State Total 54.3 51.4 44.9 45.3 56.7 50.9 55.1 63.01 62.47<br />
Source: <strong>Karnataka</strong> Secondary Education Examination Board, Bangalore.<br />
Note: NA - Not Available.<br />
The performance of students in PU examinations<br />
shows that there has been signifi cant<br />
improvement in pass percentages in the state,<br />
from 48 per cent in 1997-98 to 58 per cent in<br />
2003-04. Girls have done better than boys in all<br />
districts. While this is heartening, it also leads to<br />
some uncomfortable questions about attrition at<br />
the next level, i.e. enrolment in tertiary education<br />
where girls are under-represented. Across<br />
districts, Dakshina Kannada tops the list while<br />
117
<strong>Karnataka</strong> <strong>Human</strong> <strong>Development</strong> <strong>Report</strong> <strong>2005</strong><br />
Bidar and Gulbarga have a pass percentage that<br />
is less than 30 per cent (1998–99). In 2003-04,<br />
Gulbarga’s performance had improved (36.70)<br />
(Appendix Tables: Series 4). There is not much<br />
difference between the pass percentage of SCs<br />
and STs, but the pass percentage of non-SC/STs<br />
is better than that of SCs, STs and ‘all categories’<br />
(Figure 5.12).<br />
Vocational education<br />
A student can pick vocational courses from a<br />
variety of institutions: polytechnics, industrial<br />
training institutes (ITIs) and vocational courses<br />
at the PU level itself. The objective here is to<br />
reduce the pressure on higher education, but<br />
more important, to impart vocational skills to<br />
prepare students for self-employment. About<br />
182 polytechnics (38 government, 36 aided and<br />
108 private institutions) offer diploma courses<br />
in various engineering disciplines, fashion<br />
technology, commercial practice, cinematography,<br />
etc. About 70,000 students are enrolled in these<br />
courses. The department of Vocational Education<br />
runs 890 courses as diverse and disparate as<br />
dairying, accountancy, garment design, civil<br />
construction and computer technology to name a<br />
few. There were 68 government and 328 private<br />
ITIs in the state in 1998-99, which increased to<br />
104 and 466 by 2003-04, showing a growth rate<br />
of 8.9 per cent and 7.3 per cent per annum for<br />
government and private ITIs respectively.<br />
The spread of government polytechnics varies<br />
from a low 11 per cent in Bombay <strong>Karnataka</strong> to<br />
a high 28 per cent each in southern <strong>Karnataka</strong><br />
and Hyderabad <strong>Karnataka</strong>. The southern districts<br />
have the highest proportion of private unaided<br />
institutions (61.67) in 2002-03. The dominance<br />
of private institutions, particularly in the backward<br />
areas of the state, is likely to create inequalities,<br />
as only the higher income groups can afford<br />
them. The predominance of the private sector is<br />
again apparent when we look at the ITI stream<br />
of vocational training. In 2003-04, Belgaum<br />
district had the highest number of government<br />
institutions and Koppal had the lowest number of<br />
private ITIs, while south <strong>Karnataka</strong> has a better<br />
distribution of institutions than north <strong>Karnataka</strong>.<br />
The enrolment in ITIs increased at a compound<br />
Institution per lakh popln. and<br />
enrolment in lakh<br />
Pass percentage<br />
70.0<br />
60.0<br />
50.0<br />
40.0<br />
30.0<br />
20.0<br />
10.0<br />
0.0<br />
7<br />
6<br />
5<br />
4<br />
3<br />
2<br />
1<br />
0<br />
FIGURE 5.11<br />
Growth of PU colleges and enrolment<br />
1998-99 2000-01 2003-04<br />
Enrolment<br />
PUC Colleges<br />
FIGURE 5.12<br />
Pass percentages of PUC results by social groups<br />
47.9<br />
4.6<br />
3.9<br />
57.8<br />
34.2<br />
46.0<br />
All Communities SC ST Non-SC/ST<br />
growth rate of 8.5 per cent per annum during the<br />
period 1998-99 to 2003-04.<br />
The enrolment in government institutions<br />
increased at 10.8 per cent while in private<br />
institutions it grew at 7.2 per cent per annum<br />
during the same period. Girls constitute only 16.6<br />
per cent of all students and the enrolment of girls<br />
was about 2.5 times higher in south <strong>Karnataka</strong><br />
than in north <strong>Karnataka</strong> (2003-04). The lowest<br />
proportion of girls’ enrolment was in Koppal<br />
district (0.95) while Chitradurga (50.2) had the<br />
highest. Disturbingly, girls’ enrolment in ITIs is<br />
very low in the less developed districts.<br />
Vocational education institutions, both government<br />
and private, show a sharp decline over the period<br />
1998-99 to 2003-04. The decline in private<br />
institutions (3.63 per cent) is more marked than in<br />
government institutions (0.68) but there has been<br />
5.8<br />
3.9<br />
34.2<br />
47.2<br />
1998-99 2003-04<br />
7.0<br />
4.4<br />
50.3<br />
60.2<br />
119
Literacy and Education<br />
TABLE 5.20<br />
District-wise education index: 1991 and 2001<br />
Sl.No. Districts Education Index<br />
(I-X)<br />
1991 2001 All<br />
Communities<br />
Education Index<br />
(I-X): 2001<br />
1 Bangalore Urban 0.757 0.93 0.89 0.83 1.29<br />
2 Bangalore Rural 0.582 0.69 0.66 0.62 0.66<br />
3 Kolar 0.576 0.75 0.71 0.64 0.65<br />
4 Tumkur 0.612 0.75 0.71 0.62 0.67<br />
5 Shimoga 0.662 0.80 0.77 0.83 0.78<br />
6 Chitradurga 0.590 0.73 0.70 0.63 0.59<br />
7 Davangere 0.623 0.74 0.71 0.57 0.56<br />
8 Mysore 0.550 0.70 0.67 0.64 0.60<br />
9 Chamarajnagar 0.446 0.60 0.57 0.60 0.50<br />
10 Mandya 0.622 0.72 0.68 0.63 0.71<br />
11 Hassan 0.599 0.76 0.73 0.61 0.65<br />
12 Chikmaglur 0.639 0.78 0.74 0.60 0.65<br />
13 Kodagu 0.739 0.86 0.83 0.72 0.45<br />
14 Dakshina Kannada 0.799 0.88 0.82 0.69 0.80<br />
15 Udupi 0.830 0.88 0.84 1.19 0.77<br />
16 Belgaum 0.586 0.73 0.70 0.65 0.49<br />
17 Bijapur 0.561 0.66 0.64 0.60 1.03<br />
18 Bagalkot 0.567 0.66 0.64 0.55 0.55<br />
19 Dharwad 0.637 0.79 0.76 0.71 0.65<br />
20 Gadag 0.601 0.77 0.75 0.62 0.78<br />
21 Haveri 0.582 0.73 0.70 0.61 0.63<br />
22 Uttara Kannada 0.692 0.82 0.78 0.72 0.58<br />
23 Gulbarga 0.432 0.60 0.57 0.51 0.32<br />
24 Bellary 0.506 0.64 0.62 0.51 0.48<br />
25 Raichur 0.372 0.55 0.52 0.46 0.34<br />
26 Koppal 0.403 0.60 0.58 0.49 0.49<br />
27 Bidar 0.547 0.72 0.69 0.67 0.45<br />
State 0.604 0.74 0.71 0.63 0.56<br />
Sources:<br />
1. KHDR 1999, Planning Department, <strong>Karnataka</strong>.<br />
2. Registrar General of India, 2001: Primary Census Abstract.<br />
3. Commissioner of Public Instruction, <strong>Karnataka</strong>.<br />
SCs<br />
STs<br />
no such reduction in the Hyderabad <strong>Karnataka</strong><br />
districts. Closure of courses probably indicates<br />
their unpopularity with students, especially if they<br />
had no linkages to market needs.<br />
How relevant and useful are these courses and to<br />
what extent do they succeed in providing viable<br />
alternatives to tertiary education courses? The<br />
Task Force on Higher Education (2004) reports<br />
that annually, only 59 per cent of the intake in<br />
polytechnics is utilised, showing severe wastage.<br />
Ultimately, these courses will fi nd takers only<br />
if they lead to employment and enhanced<br />
incomes.<br />
There is a need to evaluate these courses and<br />
ascertain how many students actually get the<br />
jobs/vocations for which they study. Vocational<br />
education is a complex area, since changes in<br />
the job market/business scenario can impact<br />
the courses that are being offered. Institutions<br />
have to be dynamic and have the fl exibility to<br />
add new options/courses, e.g. repair of mobile<br />
phones, computers and eliminate courses that<br />
are no longer relevant to the market. Government<br />
institutions too need to operate under a framework<br />
that allows for such fl exibility. Private institutions<br />
may be slightly better placed in this respect, but<br />
both government and private institutions have<br />
the same boards, which dictate course content<br />
and which are slow to respond to new market<br />
demands.<br />
Education index<br />
An education index of districts (EI) has been<br />
computed based on the literacy rate and the<br />
GER. Despite signifi cant improvement in the EI<br />
of Raichur in 1991-2001, the relative status of<br />
this district has not changed. In 1991, Raichur<br />
district occupied the lowest position and<br />
Dakshina Kannada ranked fi rst among districts.<br />
In 2001, Raichur occupied the lowest place for<br />
all communities and Scheduled Castes, while<br />
Gulbarga district is last in the EI for Scheduled<br />
Tribes. Bangalore Urban, Kodagu, Dakshina<br />
Kannada and Udupi are well above the state<br />
average while Raichur, Gulbarga, Koppal, Bellary<br />
and Chamarajnagar are below the state average<br />
(Table 5.20).<br />
120
<strong>Karnataka</strong> <strong>Human</strong> <strong>Development</strong> <strong>Report</strong> <strong>2005</strong><br />
Concerns<br />
<br />
<br />
<br />
<br />
<br />
<br />
<br />
In 2001, <strong>Karnataka</strong>’s urban literacy rate was<br />
80.58 per cent, hence the Tenth Plan goal of<br />
75 per cent literacy has already been met<br />
in the urban areas at least, but the rural<br />
areas with 59.33 per cent literacy are some<br />
distance from the goal.<br />
The goal of reducing the gender gap in<br />
literacy by 50 per cent by 2007 seems<br />
over-ambitious since, between 1991 and<br />
2001, the gender gap in literacy dwindled<br />
by only 3.1 and 3.76 percentage points<br />
in the rural and urban areas respectively.<br />
The illiteracy rate is more than 63 per cent<br />
among Scheduled Tribes and about 58 per<br />
cent among Scheduled Caste females.<br />
The literacy level of SCs in <strong>Karnataka</strong> was<br />
higher than the all-India SC literacy level<br />
with reference to both female and total<br />
literacy in 1991. In 2001, the SC literacy<br />
rate was lower than the all-India SC male,<br />
female and all, which is a matter of great<br />
concern.<br />
As many as 15 districts (9 in north and 6 in<br />
south <strong>Karnataka</strong>) have a literacy rate that is<br />
below the state average, while fi ve districts of<br />
the Hyderabad <strong>Karnataka</strong> region are below<br />
the all-India literacy rate in respect of total,<br />
male and female literacy levels.<br />
North <strong>Karnataka</strong>, especially Hyderabad<br />
<strong>Karnataka</strong>, performs poorly in several<br />
indicators. Enrolment rates have risen in<br />
primary education in the state particularly in<br />
Raichur district, but unfortunately the GER of<br />
this district has been the lowest in the state<br />
from 1996-97 to 2000-01 meaning that<br />
all districts are working towards improving<br />
enrolment and retention and Raichur will<br />
need special attention to match them. The<br />
highest dropout rate for girls is in Gulbarga<br />
(58 per cent) and Bellary (55.40 per cent) in<br />
2003-04 in classes I to VII. Retention is thus<br />
a crucial challenge.<br />
The mean years of schooling have increased<br />
only slightly from 3.97 in 1999-2000 to<br />
4.25 in 2003-04.<br />
Signifi cant work remains to be done to<br />
enhance the quality of teaching-learning.<br />
The ‘no detention’ policy, while encouraging<br />
<br />
<br />
<br />
<br />
<br />
<br />
<br />
retention of children upto class V, could also<br />
lead to an inadequate assessment of learning<br />
and teaching in the fi rst four years (which are,<br />
admittedly, the most signifi cant years as far<br />
as learning is concerned). Further, measures<br />
to assess learning are still largely dominated<br />
by test-of-memory examinations.<br />
About three per cent primary schools in rural,<br />
and four per cent schools in urban areas, do<br />
not have any teachers at all while slightly more<br />
than 20 per cent in rural and seven per cent<br />
schools in urban areas have only one teacher.<br />
Nine districts in north <strong>Karnataka</strong> and fi ve<br />
districts in south <strong>Karnataka</strong> have less than 50<br />
per cent female teachers in primary schools<br />
in 2003-04.<br />
Primary school infrastructure is a critical<br />
variable for retention. However, as many as<br />
nine out of 12 districts of north <strong>Karnataka</strong><br />
are below the state infrastructure index<br />
average. DPEP districts should have basic<br />
infrastructure as it was one of the objectives<br />
of DPEP, but it seems this has been only<br />
partially fulfi lled with 6 out of 11 (DPEP)<br />
districts still below the state average. As many<br />
as seven districts in southern <strong>Karnataka</strong> are<br />
below the infrastructure index average.<br />
The dropout rate at the secondary level is<br />
about 60 per cent by the time students reach<br />
class X. The low percentage of female teachers<br />
and lack of infrastructure are contributory<br />
factors to the high dropout rate of girls.<br />
The infrastructure of high schools is relatively<br />
poor, particularly in north <strong>Karnataka</strong>, as<br />
the average index (0.37) of these districts<br />
is below the average index of the state<br />
(0.42). In 2002-03, 54 per cent of schools<br />
did not have any toilets and 68 per cent of<br />
schools did not have separate toilets for<br />
girls.<br />
Examination results indicate that government<br />
and rural high schools do not perform as well<br />
as privately managed schools and urban<br />
schools. With government schools catering<br />
to low socio-economic groups, girls, SCs<br />
and STs and rural areas, this is a matter of<br />
concern.<br />
The objective of the EduVision document<br />
(2000) that ‘about 80 per cent of those who<br />
The illiteracy rate is more<br />
than 63 per cent among<br />
Scheduled Tribes and<br />
about 58 per cent among<br />
Scheduled Caste females.<br />
North <strong>Karnataka</strong>,<br />
especially Hyderabad<br />
<strong>Karnataka</strong>, performs<br />
poorly in several<br />
indicators.<br />
Significant work remains<br />
to be done to enhance<br />
the quality of teachinglearning.<br />
123
Literacy and Education<br />
<strong>Karnataka</strong> has dealt<br />
satisfactorily with the<br />
access and enrolment<br />
goals. Retention and<br />
quality of learning are<br />
more complex and<br />
challenging goals, since<br />
they need varied and<br />
qualitative strategies<br />
while the first two<br />
– access and enrolment<br />
– largely need physical/<br />
quantitative remedies.<br />
While the state has<br />
achieved its target of 50<br />
per cent women teachers,<br />
their over-concentration in<br />
urban areas will have to<br />
be corrected.<br />
The quality of<br />
decision-making in the<br />
administration would be<br />
significantly enhanced if<br />
an EMIS was available at<br />
state, district, taluk and<br />
village levels.<br />
<br />
<br />
<br />
join should complete secondary education’<br />
is yet to be achieved as only 40 per cent<br />
of those who joined completed secondary<br />
education in the state in 2003-04.<br />
The increasing popularity of private schools<br />
can be a cause for concern from an equity<br />
perspective. This preference for private<br />
(unaided) schools is most visible in urban<br />
areas, where parents seem to prefer them<br />
to government schools, wherever they can<br />
afford them.<br />
Currently, vocational education lacks the<br />
mechanisms for responding quickly to<br />
changing market demands. Certain courses<br />
are under-subscribed in polytechnics and<br />
many courses have shut down in the<br />
department of Vocational Education.<br />
Vocational courses have become stopovers for<br />
tertiary education instead of being terminal<br />
points.<br />
Recommendations<br />
While literacy rates in urban <strong>Karnataka</strong> are very<br />
good, the literacy levels of the rural population,<br />
women, SCs and STs, and more particularly SC<br />
and ST women indicate that the state is far from<br />
reaching the Tenth Plan goals. Literacy levels in the<br />
northeastern districts are considerably below the<br />
state and national averages. The hiatus in national<br />
spending and targeting of low-performing areas<br />
and groups must give way to a renewed focus on<br />
adult education.<br />
The goals of access, enrolment, retention, are in<br />
a way sequential, in the sense that each goal<br />
needs to be signifi cantly achieved before the next<br />
can be meaningfully addressed. <strong>Karnataka</strong> has<br />
dealt satisfactorily with the access and enrolment<br />
goals. Retention and quality of learning are more<br />
complex and challenging goals, since they need<br />
varied and qualitative strategies while the fi rst two<br />
— access and enrolment — largely need physical/<br />
quantitative remedies. Physical/quantitative goals<br />
are easier to achieve than qualitative/soft goals.<br />
Most vulnerable to dropping out of school are girls<br />
from all social classes, the poor and the Scheduled<br />
Castes and Tribes. Geographically, the northern<br />
districts and especially the Hyderabad <strong>Karnataka</strong><br />
region have poor education indicators. Focused<br />
targeting of these marginal sub-populations thus<br />
becomes necessary.<br />
Infrastructure facilities, particularly classrooms,<br />
separate toilets for girls and drinking water<br />
should be provided to all schools on a priority<br />
basis. Lack of these facilities could negatively<br />
impact retention, especially of girls. Though toilets<br />
have been constructed in many schools, they have<br />
become unworkable without water supply. Hence,<br />
construction of toilets must go hand in hand with<br />
providing water facilities. In addition, upgradation<br />
of laboratories and libraries in high schools should<br />
be taken up.<br />
The proportion of female teachers in rural schools<br />
is about half of that in urban schools with a few<br />
exceptions in some south <strong>Karnataka</strong> districts.<br />
Thus, while the state has achieved its target of 50<br />
per cent women teachers, their over-concentration<br />
in urban areas will have to be corrected to ensure<br />
that rural primary schools do not suffer from a<br />
shortage of women teachers.<br />
From a governance perspective, there will have<br />
to be concerted efforts to ensure that teachers<br />
do not absent themselves from school, even<br />
for authorised purposes. In a single teacher or<br />
multi-grade school, this means that the school<br />
effectively closes down. Good governance is<br />
the critical factor here in curbing indiscipline,<br />
whether it is in ensuring that schools in remote,<br />
underserved areas get teachers and these<br />
teachers actually report for work or in curbing<br />
absenteeism and encouraging committed<br />
teachers to perform well.<br />
The quality of decision-making in the<br />
administration would be signifi cantly enhanced<br />
if an EMIS (Education Management Information<br />
System) was available to administration at the<br />
state, district, taluk and village levels. For instance,<br />
information on the current status of teacher<br />
vacancies and absenteeism, training and training<br />
needs would help administrators signifi cantly.<br />
Panchayat Raj institutions (PRI) and community<br />
support to schools for fully achieving the goals<br />
of education can be split into two categories<br />
124
– ‘hard’ factors such as infrastructure, enrolment,<br />
attendance and ‘soft’ factors such as quality of<br />
teaching-learning. Gram panchayats and School<br />
<strong>Development</strong> and Monitoring Committees (SDMCs)<br />
will have to play an important role in infrastructure<br />
creation and supporting enrolment and attendance<br />
of both teachers and students, while department<br />
offi cers provide academic/pedagogic input.<br />
Village level tracking systems must be put in place<br />
to monitor dropouts and out-of-school children. It<br />
would mean that panchayat institutions, community<br />
based organisations like the SDMC and departments,<br />
viz. Education, Labour and Rural <strong>Development</strong>,<br />
must organise a platform of interventions to ensure<br />
that children enroll and stay on in school.<br />
School adoption is a programme that should be<br />
more fully explored. The department should make<br />
the ‘School Adoption Programme’ easily accessible<br />
to individuals and institutions all over the country,<br />
and to NRIs in particular. The Internet can be a<br />
relevant medium to promote this programme<br />
world wide. School adoption could focus on the<br />
infrastructure needs of the school.<br />
In secondary education, government must take<br />
steps now itself to accommodate the large stream<br />
of students who will seek admission to high schools<br />
in the wake of its successful implementation of the<br />
Sarva Shikshan Abhiyan programme.<br />
The tremendous attrition in secondary education<br />
is due in part to lack of proper evaluation at the<br />
primary level that lets most students pass through<br />
the system, sometimes without having attained<br />
minimum levels of learning. Bridge courses for<br />
such children would ensure that they do not drop<br />
out. The dropout rate at the secondary level is<br />
about 60 per cent by the time students reach class<br />
X. The low percentage of female teachers, lack of<br />
infrastructure, especially separate toilets for girls,<br />
and above all, social restrictions on girls once they<br />
attain puberty, are contributory factors. This is a<br />
diffi cult challenge that needs to be effectively<br />
tackled to ensure that the benefi ts of education<br />
reach girls. The education of girls is known to<br />
have immense emancipatory and empowerment<br />
potential, hence this must be accorded high priority<br />
by recruiting more women high school teachers<br />
as in primary levels, providing schools with basic<br />
infrastructure (68 per cent of high schools do not<br />
have separate toilets for girls) and by building<br />
awareness in the community. Otherwise, girls<br />
who constitute a high percentage of dropouts are<br />
likely to lose out even more when the infl ux to<br />
secondary education begins.<br />
The infrastructure of high schools is poor, especially<br />
in the northern districts. A high 54 per cent of<br />
the schools do not have any toilet whatsoever.<br />
Laboratories are so ill-equipped that Science<br />
practicals are not conducted in the S.S.L.C.<br />
examinations to ensure against urban bias. Many<br />
high schools do not even have furniture for class<br />
rooms. Hence these facilities will have to be<br />
provided.<br />
The tenth class has been conceptualised as a<br />
terminal point for those who wish to discontinue<br />
studies to enter the world of work. However, the<br />
vocation/job opportunities for those who complete<br />
secondary education is limited. This is another<br />
complex area that needs attention. Students who<br />
leave the education stream after completing class<br />
X do not have suffi cient skills, vocational and<br />
communicative, to take up meaningful jobs. All too<br />
often, they become alienated from their traditional<br />
occupations such as agriculture. Incorporating<br />
a vocational base to secondary education has<br />
been tried several times and failed for various<br />
reasons such as lack of relevance to market needs,<br />
infl exibility of curricula and lack of trained teachers.<br />
However, this is one area, which needs to be readdressed<br />
from a fresh perspective.<br />
Vocational education has had its successes when<br />
it has responded to the market, as in the case<br />
of IT-based diplomas or Commercial Practice,<br />
which is popular with girls as they get jobs almost<br />
immediately. The older vocations such as civil and<br />
mechanical engineering have seen a decline in<br />
demand: these courses should be revamped, and<br />
retraining teachers should go hand-in-hand with<br />
this strategy. Developing vocational courses for<br />
dropouts from the school system also needs to be<br />
prioritised.<br />
<strong>Karnataka</strong> <strong>Human</strong> <strong>Development</strong> <strong>Report</strong> <strong>2005</strong><br />
Village tracking systems<br />
must be put in place to<br />
monitor dropouts and<br />
out-of-school children.<br />
The education of girls is<br />
known to have immense<br />
emancipatory and<br />
empowerment potential,<br />
hence this must be<br />
accorded high priority.<br />
Incorporating a vocational<br />
base to secondary<br />
education has been tried<br />
several times and failed<br />
for various reasons such<br />
as lack of relevance to<br />
market needs, inflexibility<br />
of curricula and lack of<br />
trained teachers. However,<br />
this is one area, which<br />
needs to be re-addressed<br />
from a fresh perspective.<br />
125
Demography, Health and Nutrition
CHAPTER 6<br />
Demography, Health and Nutrition<br />
Introduction<br />
Good health is an invaluable asset for better<br />
economic productivity, both at the individual and<br />
national level, but above all, it is valued by those<br />
who own it as a prerequisite for a better quality of<br />
life and better standards of living. Sub-populations<br />
who are at the highest risk from poor health and<br />
its effects on longevity and morbidity are the poor,<br />
women, the Scheduled Castes and Scheduled Tribes.<br />
The main reasons for the high level of vulnerability<br />
of these sub-groups are, fi rst, the inaccessibility of<br />
healthcare, and second, their inability to spend on<br />
healthcare interventions. Public healthcare systems<br />
must, therefore, provide that critical barrier between<br />
ill-health and the ones who are most vulnerable,<br />
but here too, factors such as fi nancing and effi ciency<br />
greatly infl uence the quality and coverage of public<br />
healthcare services.<br />
The health scenario in <strong>Karnataka</strong> today is a<br />
combination of achievements and challenges.<br />
Signifi cant advances have taken place in health<br />
and healthcare services over the past decade. A<br />
brief review of the key demographic indicators that<br />
offer a reliable overview of the status of health in<br />
<strong>Karnataka</strong> suggest that the state’s performance is<br />
much better than the all-India average. The state’s<br />
population increased from 4.49 crore in 1991 to<br />
5.27 crore in 2001. A comparison of the decadal<br />
growth of population shows a signifi cant decline<br />
from 21 per cent between 1981-91 to 17.5<br />
per cent in 1991-2001. Life expectancy at birth<br />
has increased to about 66 years in 2001. Infant<br />
and maternal mortality are among the most<br />
reliable indicators for assessing health status, and<br />
<strong>Karnataka</strong>’s performance here, as in reducing<br />
neonatal mortality, child mortality and maternal<br />
mortality rates – all of which show a downward<br />
trend – is better than the aggregated fi gures for<br />
the whole of India (Table 6.1). In fact, <strong>Karnataka</strong><br />
is well on its way to achieving the Tenth Plan<br />
objective of reducing MMR to 2 per 1000 births<br />
by 2007. Institutional deliveries now account for<br />
51 per cent of total deliveries, compared with 34<br />
per cent for all-India. Small pox has been<br />
eradicated; the state is free from plague and<br />
guinea worm and the incidence of polio has been<br />
considerably reduced. A widespread infrastructure<br />
of health and medical institutions comprising<br />
primary health centres offering basic services to<br />
state-of-the-art super-speciality hospitals with<br />
a national, and even international reputation, is<br />
now in place.<br />
There are, however, some challenges which the state<br />
will have to confront with aggressive strategies.<br />
Rural-urban disparities, far from diminishing, have<br />
only intensifi ed: for example, the infant mortality<br />
rate (IMR) is 64 in rural areas as compared with<br />
24 in urban areas (2004). There are noticeable<br />
regional disparities in spite of overall improvements<br />
in the various health indicators. The fi ve districts of<br />
northeast <strong>Karnataka</strong> – Gulbarga, Bidar, Koppal,<br />
Raichur and Bellary – and two districts of northwest<br />
<strong>Karnataka</strong> – Bagalkot and Bijapur – have worse<br />
health indicators than the rest of the state. The<br />
health status of the Scheduled Castes and Tribes is<br />
cause for serious refl ection because it is so distanced<br />
from the health status of the total population.<br />
Under-nutrition among pregnant women and<br />
infants continues to take its toll. The incidence<br />
of communicable diseases such as tuberculosis,<br />
malaria and intestinal infections is still relatively<br />
high. Now the state must confront HIV/AIDS and<br />
the very human issues it brings to the fore. Lifestylerelated<br />
ailments like diabetes, heart disease, and<br />
cancer are also registering an unwelcome increase.<br />
Certain preventable health problems continue to<br />
State/<br />
Country<br />
TABLE 6.1<br />
Some demographic indicators<br />
Decennial population growth<br />
(1991-2001)<br />
Good health is an<br />
invaluable asset for<br />
better economic<br />
productivity, both at the<br />
individual and national<br />
level, but above all, it is<br />
valued by those who own<br />
it as a prerequisite for a<br />
better quality of life and<br />
better standards of living.<br />
IMR NNM CMR MMR LEB<br />
<strong>Karnataka</strong> 17.5 52 37.1 19.3 195/lakh 65.8<br />
All-India 21 60 43.4 29.3 407/lakh 64.8<br />
Sources:<br />
1. Registrar General of India, Census 2001.<br />
2. National Family and Health Survey-2, IIPS, Mumbai, 1998-99.<br />
3. Registrar General of India, Sample Registration System, SRS bulletin, volume 39 (1), April <strong>2005</strong>.<br />
129
Demography, Health and Nutrition<br />
Private sector<br />
participation in<br />
provisioning healthcare<br />
services is still<br />
predominantly an<br />
urban-based<br />
phenomenon. Rural areas<br />
must rely on<br />
state sponsored<br />
healthcare.<br />
survive stubbornly in geographical pockets and<br />
specifi c population groups. Although the maternal<br />
mortality rate has declined, it is still unacceptably<br />
high for a developed state like <strong>Karnataka</strong>.<br />
Private sector participation in provisioning<br />
healthcare services is still predominantly an<br />
urban-based phenomenon. Rural areas must rely<br />
on state sponsored healthcare. Here again, it is<br />
the poor who are the single largest constituency<br />
for public healthcare. It is for these reasons that<br />
this chapter will focus on public health services in<br />
the state since private sector-managed healthcare<br />
does not target the sub-populations who are most<br />
at risk and have the least capacity to spend on<br />
their health needs.<br />
Population<br />
According to the 2001 census, since 1951 the<br />
population of <strong>Karnataka</strong> has increased two and<br />
BOX 6.1<br />
UN Millennium <strong>Development</strong> Goals<br />
to be achieved by 2015<br />
1. Reduce infant and under-5 mortality rates<br />
by 2/3rd.<br />
2. Reduce maternal mortality rates by threequarters.<br />
3. Halt and begin to reverse the spread of<br />
HIV/AIDS.<br />
4. Halt and begin to reverse the incidence of<br />
malaria and other major diseases.<br />
BOX 6.2<br />
<strong>Karnataka</strong> State Integrated Health Policy 2004<br />
a half times to 52.73 million. It progressively<br />
increased between 1951 and 1981 but registered<br />
a decline in growth, for the fi rst time, in the<br />
decade 1981–1991 i.e. from 26.75 per cent to<br />
21.12. It further declined to 17.5 per cent in the<br />
decade 1991–2001. Two critical demographic<br />
trends which are now becoming visible, are an<br />
increase in the size of the working population<br />
(15 to 59 years) and a decrease in the below<br />
15 population – both of which have signifi cant<br />
policy implications. The fi rst is a possible increase<br />
in joblessness if the economy is unable to provide<br />
employment for this large labour force; the<br />
second is the greying of the population over the<br />
next 25 years, which will trigger a need for social<br />
security. While <strong>Karnataka</strong>’s population growth<br />
during the preceding decade is less than all-India<br />
(21 per cent), it is higher than the neighbouring<br />
states of Kerala (9.4 per cent), Tamil Nadu<br />
(11 per cent) and Andhra Pradesh (13.9 per cent),<br />
indicating how imperative it is for <strong>Karnataka</strong> to<br />
sustain this decline in decennial growth.<br />
The crude birth rate (CBR), which was 33.7 in<br />
1971, declined to 22.0 in 2002 – a decline of<br />
about 35 per cent. The two neighbouring states<br />
of Andhra Pradesh and Tamil Nadu recorded a<br />
decrease of 41 and 42 per cent respectively during<br />
the same period. The crude death rate (CDR) fell by<br />
45 per cent to 7.2 in 2002 from 13.0 in 1971. The<br />
states of Kerala, Andhra Pradesh and Tamil Nadu<br />
recorded a decline in CDR of about 30 per cent, 48<br />
per cent and 50 per cent respectively during this<br />
period. Across districts, Udupi has the lowest CBR<br />
(15.8) and Koppal’s CBR of 28.8 is the highest in<br />
Based on the report of the Task Force on Health and Family Welfare (2001), the government formulated a<br />
State Integrated Health Policy:<br />
1. Providing integrated and comprehensive primary healthcare.<br />
2. Providing a credible and sustainable referral system.<br />
3. Establishing equity in delivery of quality healthcare.<br />
4. Encouraging greater public–private partnership in the provision of quality healthcare in order to better<br />
serve the under-served areas.<br />
5. Addressing emerging issues in public health.<br />
6. Strengthening health infrastructure.<br />
7. Improving access to safe and quality drugs at affordable prices.<br />
8. Increasing access to alternative medicine systems.<br />
130
<strong>Karnataka</strong> <strong>Human</strong> <strong>Development</strong> <strong>Report</strong> <strong>2005</strong><br />
the state. At the regional level, the CBR is higher<br />
in both the Hyderabad <strong>Karnataka</strong> and the Bombay<br />
<strong>Karnataka</strong> areas than in south <strong>Karnataka</strong>. All<br />
districts have experienced a substantial decline in<br />
the CDR during the last decade. The decline in CDR<br />
is higher in Bombay <strong>Karnataka</strong> and Hyderabad<br />
<strong>Karnataka</strong> than in south <strong>Karnataka</strong>, probably<br />
because the northern districts had such high crude<br />
death rates to start with.<br />
This decline in the CBR and CDR has been achieved<br />
through changes in several socio-economic<br />
and demographic variables over time. Many of<br />
these factors relate to women’s unequal status<br />
in society and any improvement in the following<br />
parameters translates into an improvement, not<br />
just in the CBR and CDR, but in many other health<br />
indicators as well: women’s age at marriage,<br />
their education levels, their participation in the<br />
non-agricultural sector and per capita income.<br />
Increasingly, <strong>Karnataka</strong>, over the last decade, has<br />
witnessed many signifi cant changes that have<br />
favourably impacted its demographic profi le. The<br />
proportion of urban population increased from<br />
30.9 per cent to 34.0 per cent, female literacy<br />
increased from 44.3 to 57 per cent, the female<br />
work participation rate went up from 29.4 per cent<br />
to 32.0 and per capita income increased<br />
from Rs.6,739 (1990-91) to Rs.11,516<br />
(2001-02). At the same time, the age at<br />
marriage for females increased to about 20 years<br />
and the proportion of married females in the<br />
age group 15-44 declined to about 75 per cent.<br />
In addition to these changes, the reduction in<br />
mortality as well as fertility can be attributed to<br />
an improvement in medical facilities at different<br />
levels and stages, as there has been a considerable<br />
expansion of health institutions and staff, in both<br />
public and private sectors.<br />
Life expectancy<br />
Expectation of life at birth is the most<br />
comprehensive index of health, in the sense<br />
that good health status translates into higher<br />
life expectancy. <strong>Karnataka</strong> has seen a consistent<br />
improvement in life expectancy at birth (LEB)<br />
since 1971 (Table 6.3). Male life expectancy in<br />
<strong>Karnataka</strong> was higher than female life expectancy<br />
upto 1981, and thereafter the trend has reversed,<br />
TABLE 6.2<br />
CBR and CDR: Regions of <strong>Karnataka</strong>, India and selected states<br />
State/Region CBR CDR<br />
as indeed it should because, biologically, females<br />
have better survival rates than males.<br />
The increase in LEB has brought about a<br />
signifi cant change in the profi le of the population.<br />
The proportion of the population in the age group<br />
60 years and above increased from 7.6 per cent<br />
in 1971 to 11.4 per cent in 1999. The percentage<br />
of female population in the age group 60 years<br />
and above (7.7 per cent), which was less than<br />
the male proportion (7.9 per cent) in 1971 has<br />
now increased to 12 per cent, as compared to 11<br />
per cent for males in 1999. There has also been<br />
a noticeable change in the age structure due to<br />
1990-91 2000-01 1990-91 2000-01<br />
<strong>Karnataka</strong> 27.0 22.4 8.6 7.6<br />
South <strong>Karnataka</strong> 26.2 18.3 7.5 6.8<br />
Hyderabad-<strong>Karnataka</strong> 28.6 23.0 9.0 8.2<br />
Bombay-<strong>Karnataka</strong> 29.4 23.5 8.9 8.1<br />
India 29.5 25.6 9.8 8.5<br />
Kerala 18.3 17.0 6.3 6.4<br />
Uttar Pradesh 35.4 31.4 12.3 9.5<br />
Orissa 29.4 24.0 12.2 10.4<br />
Note: For the regions, estimated from the district level estimated rates.<br />
Source: SRS bulletin of respective period.<br />
TABLE 6.3<br />
Expectation of life at birth of males and females in <strong>Karnataka</strong> and India<br />
(Years)<br />
Year <strong>Karnataka</strong> India<br />
Male Female Total Male Female Total<br />
1971-75 50.9 50.1 50.6 50.5 49.0 49.7<br />
1975-81 53.4 52.8 53.1 52.4 52.7 52.5<br />
1981-86 60.2 61.1 60.7 55.4 55.7 55.5<br />
1986-91 62.2 63.3 62.8 58.1 59.1 58.6<br />
1991-96 64.2 65.3 64.7 60.1 61.4 60.7<br />
1996-2001 65.6 66.6 66.1 62.4 63.4 62.9<br />
Sources:<br />
1. Publications of Sample Registration System, RGI.<br />
2. Registrar General of India, Census of India.<br />
3. Family Planning Year Book.<br />
<strong>Karnataka</strong> has seen a<br />
consistent improvement<br />
in life expectancy at birth<br />
since 1971.<br />
131
Demography, Health and Nutrition<br />
Morbidity rates are<br />
important determinants<br />
of the health status<br />
of a population and<br />
provide policy inputs<br />
to health planners.<br />
Increased morbidity<br />
levels have an adverse<br />
effect on productivity,<br />
resulting in chronic<br />
worker absenteeism, loss<br />
of person-days and a<br />
reduction in income.<br />
the decline in CBR and CDR. This change in the<br />
size of the aging population is refl ected in the<br />
emergence of various healthcare issues associated<br />
with the elderly such as diabetes, heart disease,<br />
diseases related to the nervous system and mental<br />
health. With this greying of the population likely<br />
to increase over the next decade, geriatric care<br />
must become part of the focus of public healthcare<br />
systems.<br />
Morbidity<br />
Morbidity rates are important determinants of<br />
the health status of a population and provide<br />
policy inputs to health planners. The NSS in its<br />
52nd round on morbidity pattern has estimated<br />
that about 4.4 per cent in rural population and<br />
4 per cent in the urban population in the state were<br />
ill during the period 15 days prior to the survey, i.e.<br />
about 22 lakh persons are ill at any given point of<br />
time, which is an indication of the magnitude of<br />
the problem (Table 6.4). Increased morbidity levels<br />
have an adverse effect on productivity, resulting in<br />
chronic worker absenteeism, loss of person-days<br />
and a reduction in income. The hardest hit are the<br />
poor, who fi nd their productivity levels falling at the<br />
very moment that there are demands on their purse<br />
to pay for treatment. Chronic bouts of illness or even<br />
one episode can send a family over the poverty line<br />
into indebtedness. NSS data throws light on the<br />
reasons people give for not seeking treatment for<br />
ill-health. The survey shows that the major reason is<br />
that the ailment is not considered serious enough to<br />
require attention. There have been some signifi cant<br />
changes between the two surveys, i.e. 1986-87<br />
and 1995-96. Financial reasons gain in importance<br />
as a reason for not taking treatment in rural areas<br />
TABLE 6.4<br />
Persons reporting any ailment in the last 15 days prior to survey,<br />
by sex and residence<br />
(Per cent)<br />
Region Male Female Persons<br />
Rural<br />
Urban<br />
India 5.4 5.7 5.5<br />
<strong>Karnataka</strong> 4.1 4.8 4.4<br />
India 5.1 5.8 5.4<br />
<strong>Karnataka</strong> 3.9 4.2 4.0<br />
Source: Morbidity and treatment of ailment, NSS - 52nd round, No.441, 1998.<br />
and both rural and urban areas report an increase<br />
in awareness about health.<br />
The NFHS, during its two rounds of surveys, provided<br />
some valuable information on the prevalence of<br />
some diseases. Between the two survey points<br />
NFHS-1 and NFHS-2, the incidence of malaria<br />
in the rural areas of <strong>Karnataka</strong> increased from<br />
5 to 7.7 per 1,000 persons, while at the national<br />
level, the incidence in rural areas recorded an<br />
increase from 39 to 42.5 during the same period.<br />
The incidence of malaria for the state as a whole<br />
increased to about 21 during 2001 and declined to<br />
about 10 during 2003. Areas with a high incidence<br />
of malaria are Mangalore and Bellary along with the<br />
project areas of the Upper Krishna Project (Almatti<br />
and Narayanpura), which are highly susceptible. 1<br />
The prevalence of tuberculosis in <strong>Karnataka</strong> is about<br />
3 per 1,000 persons in rural areas and 2.2 per<br />
1,000 persons in urban areas (NFHS-2). However,<br />
the overall increase was about 2.98 per cent during<br />
1999–2003. 2<br />
The incidence of leprosy in <strong>Karnataka</strong> is low at<br />
one per 1,000 persons and the latest data from<br />
the National Leprosy Eradication Programme<br />
reveals that the prevalence rate of leprosy in 2003<br />
has further declined to 0.2 per 1,000 persons.<br />
Leprosy is more prevalent in Gulbarga, Raichur,<br />
Bellary, Koppal and Gadag, all north <strong>Karnataka</strong><br />
districts.<br />
HIV/AIDS<br />
Acquired Immune Defi ciency Syndrome (AIDS)<br />
is caused by the HIV virus, which weakens the<br />
body’s immune system and leads to death through<br />
secondary infections. The fi rst case of full-blown<br />
AIDS in <strong>Karnataka</strong> was detected in 1988. Since<br />
then, the prevalence of HIV and AIDS has been<br />
rising and is a cause for concern with 24,236 HIV<br />
cases and 1,730 cases of AIDS being reported<br />
from 1988 to 2003. During the same period, 189<br />
AIDS-related deaths were recorded.<br />
1<br />
Government of <strong>Karnataka</strong> (2004): Data under National Anti<br />
Malaria Programme, Directorate of Health and Family Welfare<br />
Services, Bangalore.<br />
2<br />
Government of <strong>Karnataka</strong> (2004): Data on prevalence rate of<br />
T.B., Leprosy, Directorate of Health and Family Welfare Services,<br />
Bangalore.<br />
132
<strong>Karnataka</strong> <strong>Human</strong> <strong>Development</strong> <strong>Report</strong> <strong>2005</strong><br />
TABLE 6.5<br />
HIV cases in <strong>Karnataka</strong><br />
Year HIV cases Percentage<br />
increase<br />
Upto 1998 4309<br />
1999 1319<br />
2000 1965 48.9<br />
2001 2900 47.8<br />
2002 4488 54.8<br />
2003 9255 106.2<br />
Sources:<br />
1. <strong>Karnataka</strong> AIDS Prevention Society.<br />
2. Directorate of Health and Family Welfare Services, <strong>Karnataka</strong>.<br />
The increase of HIV cases has been alarming,<br />
particularly during the last two years. The<br />
rate of increase during 2001-02 was 55 per<br />
cent and during 2002-03, it increased to<br />
106.2 per cent. Currently an estimated fi ve lakh<br />
people are infected with HIV. <strong>Karnataka</strong> has put a<br />
good reporting and monitoring system in place,<br />
unlike most of the reportedly ‘symptom-free’<br />
states. The objectives of the government’s policy<br />
are to keep HIV prevalence below three per cent,<br />
to reduce blood-borne transmission to less than<br />
one per cent, to achieve condom usage in not<br />
less than 90 per cent of high-risk groups and<br />
to ensure that awareness is created about HIV/<br />
AIDS. In 2004, the state established 40 voluntary<br />
counselling and testing centres (VCTCs) at the<br />
taluk level for the prevention and care.<br />
Infant and child mortality<br />
The present level of infant mortality in <strong>Karnataka</strong><br />
is 52 per thousand live births (SRS 2003) – a<br />
TABLE 6.6<br />
IMR for <strong>Karnataka</strong> and India<br />
Year <strong>Karnataka</strong> India<br />
Total Rural Urban Total Rural Urban<br />
1981 69 77 45 110 119 62<br />
1984 74 84 43 104 113 66<br />
1987 75 86 41 95 104 61<br />
1990 70 80 39 80 86 50<br />
1993 67 79 42 74 82 45<br />
1996 63 71 40 71 80 45<br />
1999 58 69 24 70 75 44<br />
2002 55 65 25 64 69 40<br />
2003 52 61 24 60 66 38<br />
Source: SRS bulletin of various years.<br />
signifi cant decline of about 45 per cent, from 95<br />
in 1971. At the national level, the decline in IMR<br />
is about 62 per cent though the estimated level of<br />
IMR at both points of time is higher than that of<br />
<strong>Karnataka</strong> (Table 6.6).<br />
The various rates of IMR and child mortality rate<br />
(CMR) by residence (NFHS-1 and NFHS-2) are<br />
presented in Table 6.7. There has been a decline of<br />
about two infant deaths per 1000 live births each<br />
year. However, the SRS data on IMR for <strong>Karnataka</strong><br />
prior to both surveys showed a faster decline during<br />
1971–81. Rural mortality rates are signifi cantly<br />
higher than the urban rates. If two segments of<br />
IMR, viz. neonatal and post-neonatal are separated,<br />
it is clear that the proportion of neonatal deaths to<br />
the total IMR has shown a three percentage points<br />
increase between two surveys as against a decline<br />
of three percentage points in post-neonatal deaths.<br />
The objectives of the<br />
government’s policy are<br />
to keep HIV prevalence<br />
below three per cent,<br />
to reduce blood-borne<br />
transmission to less than<br />
one per cent, to achieve<br />
condom usage in not less<br />
than 90 per cent of highrisk<br />
groups and to ensure<br />
that awareness is created<br />
about HIV/AIDS.<br />
TABLE 6.7<br />
Infant and child mortality in NFHS-1 and NFHS-2: <strong>Karnataka</strong><br />
Year Neonatal mortality Post-neonatal mortality Infant mortality Child mortality Under-five mortality<br />
R U T R U T R U T R U T R U T<br />
NFHS-1 (1988-92) 47.7 39.4 45.3 20.0 20.6 20.2 67.7 60.0 65.4 28.6 11.3 23.5 94.4 70.6 87.3<br />
NFHS-2 (1994-98) 39.3 32.1 37.1 17.2 8.1 14.4 56.5 40.1 51.5 23.9 9.0 19.3 79.0 48.8 69.8<br />
Decline during the<br />
period (per cent)<br />
Note: R: Rural; U: Urban; and T: Total.<br />
17.6 18.5 18.1 14.0 60.6 28.7 16.5 33.2 21.3 16.4 20.4 17.8 16.3 30.9 20.1<br />
Source: National Family Health Survey 1 and 2, <strong>Karnataka</strong>, IIPS, Mumbai.<br />
133
Demography, Health and Nutrition<br />
Regions<br />
TABLE 6.8<br />
IMR in the regions of <strong>Karnataka</strong>,<br />
all-India and selected states<br />
IMR<br />
1990-91 2001-02<br />
<strong>Karnataka</strong> 82 55<br />
South <strong>Karnataka</strong> 72 50<br />
Hyderabad <strong>Karnataka</strong> 86 60<br />
Bombay <strong>Karnataka</strong> 85 59<br />
All-India 86 64<br />
Kerala 17 10<br />
Orissa 123 87<br />
Note: Rates are estimated.<br />
Source: SRS bulletin, various years.<br />
There is a correlation between high IMR and<br />
the low socio-economic standing of families,<br />
gender disparity, illiteracy and lack of institutional<br />
support. Contributory factors to infant mortality<br />
range from low per capita income, underrepresentation<br />
of women in the non-agriculture<br />
sector, early marriage for women, female illiteracy,<br />
under-nutrition of both the mother and foetus,<br />
high CBR and CDR, poor access to antenatal care<br />
(ANC), low birth weight, unsafe deliveries and<br />
the inadequate reach of the services provided by<br />
the healthcare system. Kolar, Bijapur, Bagalkot,<br />
Dharwad, Haveri, Gadag, Bidar, Gulbarga, Koppal,<br />
Chikmaglur, Hassan, Raichur, Uttara Kannada,<br />
Mysore, Mandya and Kodagu have an IMR higher<br />
than the state average. While most districts have<br />
some or most of the pre-disposing factors for high<br />
IMR mentioned above, it is indeed surprising to<br />
fi nd the relatively better developed districts such<br />
as Hassan and Kodagu performing poorly.<br />
There is a correlation<br />
between high IMR and<br />
the low socio-economic<br />
standing of families,<br />
gender disparity, illiteracy<br />
and lack of institutional<br />
support.<br />
A sizeable decline of about 61 per cent has occurred<br />
in the urban post-neonatal death rate.<br />
During 2001-02 Dakshina Kannada district (44)<br />
had the lowest IMR followed by Udupi, Bangalore<br />
Urban and Shimoga (45). The district with the highest<br />
IMR is Dharwad (69) followed by Bijapur, and<br />
Gulbarga (67), Bidar and Gadag (66). All districts<br />
with an IMR higher than the national average are<br />
in north <strong>Karnataka</strong>. Overall, the southern districts<br />
in <strong>Karnataka</strong> present the best scenario with an IMR<br />
of 50 compared with Bombay <strong>Karnataka</strong> (59) and<br />
Hyderabad <strong>Karnataka</strong> (60). <strong>Karnataka</strong> will have to<br />
step up its efforts to catch up with states like Kerala<br />
(10) and Tamil Nadu (44). Currently, only the best<br />
performing district is on a par with the Tamil Nadu<br />
aggregate.<br />
There has also been a drop of about 20 per cent<br />
in child mortality and in under-fi ve mortality.<br />
Data on differentials in infant and child mortality<br />
is not easily available, either at state or district<br />
level. Different surveys (which have limitations)<br />
provide some information on districts. Data<br />
provided by NFHS-2 on differentials is useful for<br />
understanding the infl uences of factors related to<br />
infant and child mortality.<br />
Infant death can occur at 2 stages: neonatal<br />
and post-neonatal. Neonatal deaths take<br />
place during the fi rst 4 weeks of life and<br />
post-neonatal deaths occur between 1 to 12<br />
months of age. The incidence of both neonatal<br />
and post-neonatal mortality can be reduced<br />
signifi cantly if the appropriate measures are<br />
taken in time. Timeliness is crucial. About 0.40<br />
lakh neonatal deaths take place annually in the<br />
state. About 80 per cent of total infant deaths in<br />
urban areas and 69 per cent of total infant deaths<br />
in rural areas are neonatal deaths. This is also a<br />
period when mothers are vulnerable, as evidenced<br />
by the fact that most maternal deaths occur in the<br />
four week period after child birth. The majority of<br />
neonatal deaths are caused by the mother’s own<br />
health status (which is normally poor because<br />
of under-nutrition) resulting in low birth weight,<br />
premature birth, asphyxia, infectious diseases,<br />
pneumonia, tetanus, diarrhoea combined with<br />
lack of access to institutional services.<br />
Mortality rates are higher among infants born to<br />
mothers who are below 20 years and above 30<br />
years of age. A clear association is evident between<br />
IMR and birth intervals. The IMR is quite high (98.8)<br />
when the duration of the birth interval is less than<br />
24 months and decreases with an increase in the<br />
interval between births, for example, IMR is 32.3<br />
when the birth interval is 48 months and above.<br />
Since neonatal mortality is lower when the birth<br />
interval is more than 24 months and the age of<br />
the mother is in the age group 20-29, one way of<br />
134
<strong>Karnataka</strong> <strong>Human</strong> <strong>Development</strong> <strong>Report</strong> <strong>2005</strong><br />
reducing neonatal mortality is to encourage young<br />
couples to space births. Currently, only a low fi ve<br />
per cent use spacing methods. Bangalore Urban,<br />
Dakshina Kannada, Kodagu and Uttara Kannada<br />
are the few districts where more than 10 per cent<br />
of couples use spacing methods.<br />
Infant and child mortality declines considerably<br />
with increases in standards of living (Table 6.9).<br />
The poor are caught in a cycle of low income and<br />
ill-health, which are mutually self-reinforcing. The<br />
poor cannot afford the costs of a nutritious diet<br />
or antenatal and post-natal care, the absence of<br />
which can result in high-risk pregnancies which<br />
mean either indebtedness or maternal death. High<br />
rates of female illiteracy have very adverse effects<br />
on the survival of mothers and their children in<br />
terms of women’s lack of awareness of nutrition<br />
or postpartum care.<br />
The causes of death in infancy are the same for<br />
boys and girls. Slow foetal growth because of<br />
malnutrition is the major cause of death and<br />
accounts for 33 to 34 per cent of infant deaths.<br />
Birth asphyxia and other respiratory conditions<br />
account for 26 per cent of infant deaths among<br />
boys and girls. In the age group 1-4 years, injury<br />
and other accidents are a major cause of mortality<br />
Slow foetal growth because<br />
of malnutrition is the<br />
major cause of death and<br />
accounts for 33 to 34<br />
per cent of infant deaths.<br />
Residence<br />
Sex of child<br />
Religion/<br />
Caste/<br />
Tribe<br />
Standard of living<br />
Mother’s education<br />
Mother’s age at birth<br />
Birth order<br />
Birth interval<br />
TABLE 6.9<br />
Infant and child mortality for a ten-year period preceding NFHS-2: <strong>Karnataka</strong> 1999<br />
Characteristics Neonatal Post- neonatal Infant mortality Child mortality Under-five mortality<br />
Source: NFHS - 2 - <strong>Karnataka</strong>, IIPS, Mumbai<br />
Urban 35.6 8.5 44.1 12.1 55.7<br />
Rural 48.3 22.0 70.3 27.1 95.5<br />
Male 53.6 16.5 70.1 21.1 89.7<br />
Female 34.6 19.3 54.1 23.8 76.6<br />
Hindu 47.5 18.1 65.5 24.0 86.0<br />
Muslim 33.0 16.4 49.5 17.0 65.0<br />
SC 46.9 23.0 69.9 37.4 104.6<br />
ST 63.2 21.9 85.0 38.9 120.6<br />
Others 39.6 16.8 56.4 14.2 69.8<br />
Low 60.9 21.2 82.2 38.5 117.5<br />
Medium 36.9 17.7 54.6 13.6 67.5<br />
High 28.7 9.5 38.2 12.4 50.1<br />
Illiterate 52.9 23.3 76.2 29.2 130.1<br />
Middle school 40.8 10.9 51.7 4.3 55.8<br />
High school and above 29.3 8.5 37.8 5.65 43.1<br />
< 20 55.2 19.3 74.4 22.9 96.7<br />
20 - 29 36.6 16.7 53.3 20.7 72.9<br />
30 - 39 52.8 20.4 73.2 31.6 102.3<br />
1 47.9 13.7 61.5 13.4 74.1<br />
2 34.7 16.7 51.4 14.3 65.0<br />
3 40.7 21.2 61.9 30.9 90.9<br />
4+ 54.4 22.5 76.9 36.8 110.9<br />
Demography, Health and Nutrition<br />
TABLE 6.10<br />
Percentage of children who received vaccination, Vitamin A, iron and<br />
folic acid tablets/liquid<br />
Districts<br />
Complete<br />
BCG+ 3 DPT+<br />
3 Polio+<br />
Measles<br />
None<br />
Percentage of<br />
children who<br />
received at least one<br />
dose of Vitamin A<br />
Percentage of<br />
children who<br />
received IFA<br />
tablets/liquid<br />
Bangalore Urban 77.7 (90.3) 0.0 38.5 4.3<br />
Bangalore Rural 83.7 (87.7) 0.6 42.1 6.0<br />
Belgaum 64.8 (57.8) 3.3 46.9 7.6<br />
Bellary 52.6 9.3 31.8 5.7<br />
Bidar 50.3 (65.8) 7.9 19.8 3.7<br />
Bijapur 53.2 6.1 27.9 11.3<br />
Chikmaglur 83.5 (85.1) 0.0 40.4 9.0<br />
Chitradurga 88.4 1.3 54.2 5.0<br />
Dakshina Kannada 86.0 0.5 43.1 7.4<br />
Dharwad 74.8 3.9 59.2 6.0<br />
Gulbarga 25.3 (48.1) 31.1 16.6 1.3<br />
Hassan 92.8 (85.6) 0.6 65.5 1.9<br />
Kodagu 94.8 (88.6) 0.5 54.9 7.1<br />
Kolar 90.6 (86.8) 0.0 61.4 1.3<br />
Mandya 88.0 (89.5) 0.5 73.0 8.0<br />
Mysore 92.7 0.4 55.1 3.3<br />
Raichur 37.2 (57.6) 22.0 20.6 7.6<br />
Shimoga 92.9 0.5 81.8 5.0<br />
Tumkur 88.0 (87.7) 0.5 73.0 8.0<br />
Uttar Kannada 89.9 (92.2) 1.5 66.0 10.5<br />
<strong>Karnataka</strong> 71.8 (78.2) 5.7 48.8 5.6<br />
Note: Figures in brackets refer to RCH data for 2002.<br />
Source: Reproductive and Child Health (RCH) Rapid Survey, 1998-99.<br />
Maternal mortality is a<br />
crucial indicator of both<br />
women’s health and of<br />
gender justice, raising as<br />
it does, questions about<br />
women’s lack of control<br />
over their own bodies.<br />
among both boys and girls. These answer for<br />
19 per cent of deaths among boys and<br />
21 per cent among girls. The second most common<br />
cause of death is diseases of the respiratory system,<br />
which are predominant among boys (13 per cent),<br />
and intestinal infectious diseases among girls<br />
(12 per cent). Tuberculosis causes more than<br />
7 per cent of deaths among children.<br />
Immunisation of children<br />
Immunisation of children against six serious but<br />
preventable diseases viz. tuberculosis, diphtheria,<br />
pertussis, tetanus, poliomyelitis and measles is<br />
an important instrument of child survival. The<br />
state’s programme also includes administration<br />
of fi ve doses of Vitamin A for the prevention of<br />
night blindness and iron folic acid solution for<br />
iron supplementation. The reproductive and child<br />
health (RCH) survey of <strong>Karnataka</strong> (1998-99)<br />
shows that the coverage is satisfactory except in<br />
some of the northern districts. The immunisation<br />
coverage for the children has improved in 14<br />
districts other than Belgaum, Hassan, Kodagu<br />
and Kolar (RCH 2004). The desired objective<br />
of complete coverage seems quite attainable<br />
in some districts, but the performance in<br />
some others, like Raichur, is disappointing<br />
indeed.<br />
Maternal mortality<br />
Women’s health encompasses many areas of<br />
concern but since most female deaths are caused<br />
by child birth, maternal mortality is a crucial<br />
indicator of both women’s health and of gender<br />
justice, raising as it does, questions about women’s<br />
lack of control over their own bodies.<br />
The maternal mortality rate (MMR) in <strong>Karnataka</strong><br />
is 195, which is substantially lower than all-India<br />
(407) (Table 6.11). Among the southern states,<br />
<strong>Karnataka</strong> is better than Kerala (198) but<br />
has a higher MMR than Tamil Nadu (79) and<br />
Andhra Pradesh (159). The leading causes<br />
of maternal deaths in <strong>Karnataka</strong> are sepsis<br />
(33 per cent) haemorrhage (27 per cent), anaemia<br />
(13.3 per cent) and abortion (7 per cent). Deaths<br />
caused by haemorrhage and obstructed labour can<br />
be prevented if good obstetric care is available at<br />
all times, but since such facilities are available only<br />
in big urban hospitals, many rural women cannot<br />
access emergency services in time. Eclampsia is<br />
another leading cause of maternal mortality, which<br />
can be prevented through regular antenatal care.<br />
Abortions should be performed only in hospitals<br />
where proper facilities are available, but ignorance<br />
or fear of detection propels many women into the<br />
doors of unqualifi ed abortionists. As in the case of<br />
infant mortality, and indeed the two are intimately<br />
inter-related, the causes of maternal mortality are<br />
a mix of factors such as women’s lack of control<br />
over their reproduction, poverty, under-nutrition,<br />
illiteracy and lack of accessibility to both anteand<br />
post-natal care.<br />
136
<strong>Karnataka</strong> <strong>Human</strong> <strong>Development</strong> <strong>Report</strong> <strong>2005</strong><br />
TABLE 6.11<br />
Causes of maternal mortality in selected states: 1998<br />
<strong>Karnataka</strong> AP TN Kerala All-India<br />
Maternal mortality rate 195 159 79 198 407<br />
Causes (percentage)<br />
Abortions 6.7 - 16.7 - 8.9<br />
Toxaemia 20.0 - - 9.1 8.3<br />
Haemorrhage 26.7 22.2 16.7 27.3 29.6<br />
Obstructed labour - 33.3 50.0 - 9.5<br />
Puerperal sepsis 33.3 44.4 16.7 9.1 16.1<br />
Anaemia 13.3 - - 18.2 19.0<br />
Others - - - 36.4 2.1<br />
Source: SRS Bulletin, Vol. 33, No.1, 2000.<br />
Maternal and child health<br />
services<br />
Maternal and child health (MCH) services are the<br />
two major components of the reproductive and child<br />
health (RCH) programme that is provided through<br />
primary health centres (PHCs) and sub centres<br />
in the rural areas of <strong>Karnataka</strong>. In urban areas,<br />
maternal and child health services are available<br />
in government hospitals, urban health centres,<br />
hospitals and clinics operated by NGOs and various<br />
private nursing homes and maternity homes. MCH<br />
has several components, of which, antenatal care<br />
and institutional deliveries are critical to ensuring<br />
safe delivery and maternal survival.<br />
As we saw earlier, reducing neonatal deaths,<br />
which constitute nearly 70 per cent of infant<br />
deaths, would bring down the IMR signifi cantly<br />
and position the state within reach of achieving<br />
the MDGs in both infant and maternal mortality.<br />
The government strategy combines community<br />
healthcare with institutional healthcare. Primary<br />
healthcare is mainly provided by health workers<br />
(ANMs) and traditional birth attendants (dais) who<br />
are required to visit the homes of pregnant women<br />
to ensure adequate antenatal care and to ensure<br />
early identifi cation of problem pregnancies.<br />
Antenatal care<br />
The proportion of pregnant women receiving<br />
antenatal care (ANC) increased by about 3<br />
percentage points between two surveys. In urban<br />
areas, this proportion has increased much more<br />
signifi cantly than in rural areas. The proportion<br />
of pregnant women among Scheduled Tribes<br />
receiving professional care has declined though<br />
there has been an increase among Scheduled<br />
Caste women. Antenatal examinations by doctors<br />
have also increased (Table 6.12).<br />
The main components of the government’s<br />
antenatal care programme are supply of iron and<br />
folic acid tablets, tetanus (TT) immunisation, and<br />
three ANC visits. The RCH rapid household survey<br />
during 1997-98 provides information about<br />
district level ANC services (Table 6.13). Coverage<br />
of pregnant women by a complete ANC package<br />
comprising a minimum three ANC visits, at least<br />
one TT injection and supply of IFA tablets, varied<br />
from a high 88 per cent in Kodagu to 26 per cent<br />
in Bellary with the state averaging 60 per cent.<br />
In northern <strong>Karnataka</strong>, while the coverage by any<br />
type of ANC is high, coverage by the complete ANC<br />
package is alarmingly low. Women who do not<br />
complete the full course do not get the protection<br />
required to withstand anaemia and tetanus and<br />
potential problems are not identifi ed in time for<br />
treatment. The situation is more serious when<br />
data on full ANC services of 2002 is analysed. It<br />
shows that while coverage by any type of ANC<br />
service has improved, the percentage of women<br />
receiving full ANC has declined. One inference is<br />
that healthcare staff was not able to ensure that<br />
women who initially utilised ANC services were<br />
Maternal and child health<br />
services are the two<br />
major components of the<br />
reproductive and child<br />
health programme that<br />
are provided through<br />
primary health centres<br />
and sub-centres in the<br />
rural areas of <strong>Karnataka</strong>.<br />
137
Demography, Health and Nutrition<br />
TABLE 6.12<br />
Percentage of pregnant women who received antenatal services by background characteristics<br />
Background<br />
characteristics<br />
NFHS-1<br />
NFHS-2<br />
At home Outside home Total At home Outside home Total<br />
From<br />
doctor<br />
From other health<br />
professionals<br />
From<br />
doctor<br />
From other health<br />
professionals<br />
Mother’s age<br />
<strong>Karnataka</strong> <strong>Human</strong> <strong>Development</strong> <strong>Report</strong> <strong>2005</strong><br />
which is 58.8 per cent. Female sterilisation (52.5<br />
per cent) IUD (3.5 per cent) CC users (1.0 per cent)<br />
and traditional methods (1.3 per cent) are the<br />
principal methods. Male sterilisation is a low<br />
0.7 per cent. The prevalence rate is highest in<br />
Himachal Pradesh followed by West Bengal.<br />
Women continue to bear a disproportionate share<br />
of the responsibility for birth control although the<br />
decision-making rarely rests with them. Among<br />
districts, the prevalence rate varies from 39<br />
per cent in Gulbarga to 75 per cent in Hassan.<br />
Similarly, for spacing methods, Gulbarga records a<br />
low prevalence rate of 0.9 per cent and Dakshina<br />
Kannada records 11.4 per cent, which is not<br />
satisfactory.<br />
TABLE 6.14<br />
Distribution of deliveries by place of delivery<br />
Background<br />
Health facility/institution<br />
Home<br />
characteristics Public NGO/Trust Private Total<br />
Residence<br />
Urban 38.6 1.8 38.4 78.8 21.2<br />
Rural 22.9 1.1 14.5 38.5 61.5<br />
Caste<br />
SCs 26.2 2.0 11.0 40.2 59.8<br />
STs 24.8 - 6.2 31.0 69.0<br />
Low 25.6 0.7 5.1 31.4 68.6<br />
Standard of<br />
Medium 32.6 2.0 20.4 55.0 45.0<br />
living<br />
High 19.1 0.9 58.7 78.7 21.3<br />
Total 27.8 1.3 22.0 51.1 48.9<br />
Source: National Family Health Survey - 2, <strong>Karnataka</strong>, 1998-99.<br />
Nutrition<br />
Nutrition is a signifi cant determinant of good health<br />
and the incidence of mal- and under-nutrition in<br />
the community affects certain indicators such<br />
as IMR and MMR adversely. For the poor, an<br />
improvement in per capita income combined with<br />
the availability of cheaper food is a step towards<br />
ensuring higher levels of food consumption. The<br />
status of nutrition is, however, also dependent<br />
on food consumption patterns, which, in turn,<br />
are shaped to a great degree by women’s status<br />
relative to men. Custom dictates that women eat<br />
least and last in the feeding order, followed closely<br />
by children. Not surprisingly, the greatest levels of<br />
poor nutrition occur among women and children.<br />
An insuffi cient food intake and ignorance about<br />
nutrition coupled with low immunity ensure that<br />
the most vulnerable experience very fragile health.<br />
In this context, the greatest changes can occur<br />
only when there is an improvement in women’s<br />
status and an enhancement of per capita food<br />
availability.<br />
Child nutrition<br />
The NFHS-2 has examined the nutritional status<br />
of children up to 3 years of age by weight-for-age,<br />
height-for-age and weight-for-height. Children<br />
who are more than -2SD below the reference<br />
median on any of the indices are considered<br />
to be undernourished and children who are<br />
more than -3SD below the reference median<br />
are considered to be severely undernourished.<br />
Table 6.15 presents the percentage of children<br />
classifi ed as undernourished by selected<br />
characteristics. About 44 per cent of children<br />
below three years of age are underweight and<br />
about 37 per cent are stunted. The proportion<br />
of children who are severely undernourished is<br />
about 17 per cent according to the weight-forage<br />
and about 16 per cent according to heightfor-age.<br />
These fi gures are lower than India. The<br />
level of wasting (weight-for-height) is about<br />
20 per cent, which is higher than all-India (16<br />
per cent). Girls are more underweight and stunted<br />
than boys while boys are more waisted. Undernourishment<br />
is considerably higher among rural<br />
children and among SC and ST children. The<br />
importance of female education is fl agged by<br />
the fact that the children of illiterate mothers<br />
are more undernourished than the children<br />
of literate mothers and that the proportion of<br />
undernourished children declines sharply with<br />
an increase in the living standards of parents.<br />
In 1998-99, the weight-for-age index<br />
(a composite measure of chronic and acute<br />
under-nutrition) showed that 43.9 per cent<br />
of children below 3 years of age were underweight.<br />
This proportion is the highest among<br />
the southern states though lower than all-India.<br />
With regard to the height-for-age index<br />
36.6 per cent of children below 3 years are<br />
undernourished. Andhra Pradesh has the highest<br />
proportion of undernourished children with 38.6<br />
per cent while Kerala and Tamil Nadu have lower<br />
proportions. According to the weight-for-height<br />
The greatest changes can<br />
occur only when there<br />
is an improvement in<br />
women’s status and an<br />
enhancement of per capita<br />
food availability.<br />
139
Demography, Health and Nutrition<br />
Sex of the child<br />
Residence<br />
Mother’s<br />
education<br />
Caste<br />
Standard of<br />
living<br />
TABLE 6.15<br />
Nutritional status of children under 3 years<br />
(Percentage)<br />
Characteristics Weight-for-age Height-for-age Weight-for-height<br />
Note: -2SD includes children who are below -3SD.<br />
Source: NFHS-2, <strong>Karnataka</strong>, 1998-99.<br />
-3SD -2SD -3SD -2SD -3SD -2SD<br />
Male 14.9 42.2 14.6 35.1 4.2 21.4<br />
Female 18.2 45.7 17.2 38.1 3.5 18.5<br />
Total 16.5 43.9 15.9 36.6 3.9 20.0<br />
Rural 19.7 46.4 17.6 39.3 4.7 21.8<br />
Urban 9.9 38.7 12.2 30.9 2.1 16.2<br />
Illiterate 24.6 56.5 22.1 46.0 6.5 24.8<br />
Literate (< middle school) 12.7 43.8 16.0 36.0 1.7 19.9<br />
Middle school completed 8.5 34.6 10.5 28.5 1.1 13.6<br />
High school and above 5.7 21.6 5.1 20.6 1.2 12.5<br />
SCs 23.0 52.8 17.9 43.7 6.8 27.9<br />
STs 28.7 55.7 22.1 41.2 1.6 21.0<br />
Low 21.9 54.6 21.9 44.1 5.6 25.0<br />
Medium 17.4 45.3 15.3 38.2 3.8 20.2<br />
High 4.0 20.0 6.1 18.3 1.2 10.1<br />
TABLE 6.16<br />
Percentage of undernourished children below 3 years<br />
State Weight-for-age Height-for-age Weight-for-height<br />
-3SD -2SD -3SD -2SD -3SD -2SD<br />
Andhra Pradesh 10.3 37.7 14.2 38.6 1.6 9.1<br />
<strong>Karnataka</strong> 16.5 43.9 15.9 36.6 3.9 20.0<br />
Kerala 4.5 26.9 7.3 21.6 0.7 11.1<br />
Madhya Pradesh 24.3 55.1 28.3 51.0 4.3 19.8<br />
Tamil Nadu 10.6 36.7 12.0 29.4 3.8 19.9<br />
India 18.0 47.0 23.0 45.5 2.8 15.5<br />
Note: -2SD includes children who are below -3SD.<br />
Source: NFHS-2 India, 1998-99.<br />
TABLE 6.17<br />
Anthropometric indicators of nutritional status of children<br />
Weight-for-age Height-for-age Weight-for-height<br />
-3SD -2SD -3SD -2SD -3SD -2SD<br />
12.7 31.0 31.0 22.5 1.4 4.2<br />
Source: National Nutrition Monitoring Bureau, NIN: Assessment of Diet and Nutritional Status of Rural Community,<br />
2004.<br />
index 20 per cent of children, below 3 years are<br />
undernourished, the highest among southern<br />
states and above all-India as well (Table 6.16).<br />
The National Nutrition Monitoring Bureau, in its<br />
Rural Survey 2004 has more current information<br />
on the nutritional status of rural children and<br />
women of <strong>Karnataka</strong>. Table 6.17 presents the<br />
proportion of children in the age group 1–5 years<br />
according to three anthropometric measures.<br />
It is thus clear that the nutritional profi le of rural<br />
children has improved over the last fi ve years.<br />
However, the height-for-age factor remains a<br />
matter of concern. The average intake of food<br />
(gm/day) for children (rural) also shows a<br />
somewhat even distribution and a varied diet<br />
(Table 6.18). Children are not consuming<br />
enough protein as the proportion of children with<br />
‘protein-calorie adequacy’ is 23.3 per cent of<br />
the children in the age group 1-3 years and<br />
31.6 per cent of the children in the age group 4-6<br />
years. However, the scenario in <strong>Karnataka</strong> is better<br />
than Tamil Nadu and Kerala for corresponding age<br />
groups (NNMB, Rural Survey, 2004).<br />
140
<strong>Karnataka</strong> <strong>Human</strong> <strong>Development</strong> <strong>Report</strong> <strong>2005</strong><br />
Anaemia in children<br />
Anaemia has serious implications for children’s<br />
mental and physical growth as well as making<br />
them vulnerable to infectious diseases. The<br />
high-risk group is children aged 6–24 months.<br />
The level of anaemia for children age 6 to 35<br />
months as measured in NFHS-2 (<strong>Karnataka</strong>)<br />
shows that about 71 per cent of children have<br />
some level of anaemia: 20 per cent are mildly<br />
anaemic, 43 per cent are moderately anaemic<br />
and 8 per cent are severely anaemic. Mainly,<br />
boys, children in rural areas and SC and ST<br />
children have high levels of anaemia (Table<br />
6.19). The level of anaemia among children in<br />
<strong>Karnataka</strong> is lower than in Andhra Pradesh and<br />
all-India (Table 6.20).<br />
TABLE 6.18<br />
Average intake of foodstuffs (gm/day) of children: <strong>Karnataka</strong> 2004<br />
Foodstuffs Children 1–3 years Children 4–6 years<br />
Cereals and millets 136 229<br />
Pulses 9 22<br />
Leafy vegetables 5 12<br />
Other vegetables 9 23<br />
Roots and tubers 14 13<br />
Milk and milk products 37 84<br />
Fish/Meat 2 2<br />
Fruit 14 21<br />
Fat and oil 3 5<br />
Sugar and jaggery 10 11<br />
Source: National Nutrition Monitoring Bureau, NIN: Assessment of Diet and Nutritional Status of Rural Community,<br />
2004.<br />
TABLE 6.19<br />
Percentage of children aged 6–35 months classified as having anaemia by background characteristics: <strong>Karnataka</strong><br />
Background characteristics Percentage of children<br />
Percentage of children<br />
with any anaemia Mild anaemia Moderate anaemia Severe anaemia<br />
Male 72.7 17.5 45.6 9.4<br />
By sex of the child Female 68.4 21.9 40.8 5.8<br />
Total 70.6 19.6 43.3 7.6<br />
Residence<br />
Urban 66.3 19.5 41.7 5.1<br />
Rural 72.7 19.7 44.1 8.9<br />
Caste<br />
SCs 77.7 21.9 46.4 9.4<br />
STs 71.9 18.1 43.8 10.1<br />
Low 78.8 18.1 51.0 9.7<br />
Standard of living Medium 68.7 19.3 41.8 7.5<br />
High 62.0 23.9 34.6 3.5<br />
Source: NFHS-2, <strong>Karnataka</strong>, 1998-99.<br />
TABLE 6.20<br />
Percentage of children aged 6–35 months classified as having anaemia: <strong>Karnataka</strong> and selected states<br />
States<br />
Percentage of children<br />
Percentage of children<br />
with any anaemia<br />
Mild anaemia Moderate anaemia Severe anaemia<br />
Andhra Pradesh 72.3 23.0 44.9 4.4<br />
Haryana 83.9 18.0 56.9 7.1<br />
<strong>Karnataka</strong> 70.6 19.6 43.3 7.6<br />
Kerala 43.9 24.4 18.9 0.5<br />
Rajasthan 82.3 20.1 52.7 9.5<br />
Tamil Nadu 69.0 21.9 40.9 6.9<br />
India 74.3 22.9 45.9 5.4<br />
Source: NFHS-2, India, 1998-99.<br />
141
Demography, Health and Nutrition<br />
About 42 per cent of<br />
women in the reproductive<br />
age are anaemic. All age<br />
groups are uniformly<br />
affected, with a slightly<br />
higher prevalence in<br />
younger ages, which is<br />
a matter of concern, as<br />
they constitute the largest<br />
proportion of the fertile<br />
population among women<br />
in the state.<br />
Women’s nutrition<br />
The consumption of a varied and nutritious diet is<br />
crucial for the health of all people but particularly<br />
for women in the reproductive age. For a<br />
balanced diet adequate quantities of protein, fat,<br />
carbohydrates, minerals and vitamins are required<br />
and these are found in meat, fi sh, egg, milk, pulses,<br />
cereals, vegetables and fruit. NFHS-2 data on the<br />
consumption pattern among married women<br />
(Table 6.21) shows that a majority consume<br />
pulses and milk/curd at least once a week. More<br />
than 90 per cent eat vegetables once a week and<br />
about 54 per cent eat fruit at least once a week.<br />
Women in urban areas consume a greater variety<br />
of food items than rural women. The consumption<br />
of all food items is relatively low among SC and<br />
ST women. Women with a high standard of living<br />
inevitably have the highest consumption of all<br />
food items.<br />
The nutritional status of the ever married<br />
women is expressed through body mass index<br />
(BMI). The BMI is the product of weight in<br />
kilograms divided by squared height in metres<br />
and expressed as (kg/m 2 ). The cut-off point for<br />
height, below which a woman can be identifi ed<br />
as nutritionally at risk, is in the range of 140-150<br />
cm. The average height of women in <strong>Karnataka</strong><br />
is 152 centimetres (one cm taller than the<br />
all-India average). The mean height for women<br />
in <strong>Karnataka</strong> varies slightly among different<br />
groups and only about 10 per cent are under<br />
145 centimetres in height.<br />
The mean BMI for women in <strong>Karnataka</strong> is 20 and<br />
varies within a small margin of 19-23 in different<br />
groups. About 39 per cent of women have a<br />
BMI below 18.5 indicating a high prevalence<br />
of nutritional defi ciency. Nutritional defi ciency is<br />
higher among women who are from rural areas,<br />
illiterate, low income and among SCs and STs.<br />
(Table 6.22).<br />
The percentage of women with BMI below the<br />
norm is 38.8 in <strong>Karnataka</strong> as compared to 35.8<br />
per cent for all-India. A comparison with the<br />
southern states shows that <strong>Karnataka</strong> has the<br />
highest proportion of women with BMI below the<br />
norm (Table 6.23).<br />
Anaemia among women<br />
Given the inadequacy of their diet, iron defi ciency<br />
anaemia is widely prevalent among the ever<br />
married women in the age group 15-49. About<br />
42 per cent of women in the reproductive age are<br />
anaemic. All age groups are uniformly affected,<br />
with a slightly higher prevalence in younger ages,<br />
which is a matter of concern, as they constitute<br />
the largest proportion of the fertile population<br />
among women in the state. In order of severity,<br />
TABLE 6.21<br />
Women’s food consumption by background characteristics (at least once a week)<br />
Background characteristics<br />
Type of food<br />
Milk or curd Pulses or<br />
beans<br />
Green leafy<br />
vegetables<br />
Other<br />
vegetables<br />
Fruits Eggs Meat or chicken<br />
or fish<br />
Residence Urban 85.7 99.2 96.1 96.1 72.2 50.8 44.6<br />
Education<br />
Rural 70.1 98.3 91.7 89.5 43.8 34.0 28.2<br />
Illiterate 65.2 98.2 91.6 88.8 38.2 36.6 31.1<br />
Literate 88.0 99.0 95.2 95.6 71.6 44.3 38.0<br />
Caste SCs 55.7 97.9 92.2 91.0 39.8 49.4 44.5<br />
STs 62.7 98.1 90.2 86.6 38.1 37.2 26.6<br />
Low 57.6 98.0 90.2 86.9 33.3 35.3 29.9<br />
Standard of<br />
Medium 78.4 98.7 90.2 92.1 54.0 40.6 33.8<br />
living<br />
High 94.6 99.4 98.1 92.1 82.6 44.4 39.8<br />
Total 75.5 98.6 93.3 91.8 53.7 39.9 33.9<br />
Source: NFHS-2, <strong>Karnataka</strong> 1998-99.<br />
142
<strong>Karnataka</strong> <strong>Human</strong> <strong>Development</strong> <strong>Report</strong> <strong>2005</strong><br />
TABLE 6.22<br />
Nutritional status among ever married women in <strong>Karnataka</strong>: 1999<br />
Background characteristics Mean height (cm) Percentage below<br />
145 cm<br />
Weight mean body index<br />
(MBI)<br />
Percentage below BMI<br />
(18.5kg/m 2 )<br />
Residence<br />
Urban 151.8 11.4 22.3 23.8<br />
Rural 152.1 8.6 19.3 47.0<br />
Caste<br />
SCs 151.5 11.3 19.1 44.2<br />
STs 151.9 9.4 19.2 49.0<br />
Low 151.4 11.0 18.9 50.5<br />
Standard of living Medium 151.8 9.6 20.1 41.4<br />
High 153.3 7.5 23.1 16.5<br />
Total 152.0 9.6 20.4 38.8<br />
Source: NFHS-2, <strong>Karnataka</strong>, 1998-99.<br />
TABLE 6.23<br />
Body Mass Index: <strong>Karnataka</strong>, southern and other selected states<br />
State Mean height (cm) Percentage<br />
below 145 cm<br />
Mean body<br />
index (MBI)<br />
Percentage with BMI<br />
below 18.5kg/m 2<br />
Andhra Pradesh 151.2 12.7 20.3 37.4<br />
<strong>Karnataka</strong> 152.0 9.6 20.4 38.8<br />
Kerala 152.6 8.8 22.0 18.7<br />
Tamil Nadu 151.5 12.0 21.0 29.0<br />
India 151.2 13.2 20.3 35.8<br />
Punjab 154.5 4.1 23.0 16.9<br />
Orissa 150.5 14.9 19.2 48.0<br />
Source: NHFS-2, India, 1998-99.<br />
about 27 per cent are mildly anaemic, about 13<br />
per cent are moderately anaemic and a little over<br />
two per cent are severely anaemic. Women living<br />
in urban areas have signifi cantly lower levels of<br />
all grades of anaemia compared to women in<br />
rural areas. This may be an important pointer to<br />
the levels of poor hygienic and environmental<br />
sanitation in rural areas leading to a high<br />
prevalence of intestinal worm infection. Women<br />
from the SC and ST communities have a higher<br />
prevalence of anaemia.<br />
The proportion of anaemia among women in<br />
<strong>Karnataka</strong> (42.4) is lower than all-India. Andhra<br />
Pradesh and Tamil Nadu have a higher prevalence<br />
of anaemia than <strong>Karnataka</strong> (Table 6.25).<br />
Birth weight<br />
The weight of an infant at birth is an important<br />
measure of the nutritional status of the mother<br />
and an indicator of the child’s survival rate.<br />
An infant with birth weight less than 2,500<br />
grams is at high risk. It is also probable that<br />
mothers with poor nutritional status will deliver<br />
low-weight babies. The RCH survey data on<br />
birth weight observed that about 20 per cent of<br />
the infants were below 2,500 grams. In many<br />
districts more than one-fi fth of the infants were<br />
reportedly under-weight. The lowest proportion<br />
of under-weight babies was in Bangalore Urban<br />
(9 per cent) and the highest in Dharwad district<br />
(39 per cent). More than half of the districts had<br />
more than 20 per cent under weight babies,<br />
The weight of an infant<br />
at birth is an important<br />
measure of the nutritional<br />
status of the mother and<br />
an indicator of the child’s<br />
survival rate.<br />
143
Demography, Health and Nutrition<br />
TABLE 6.24<br />
Percentage of ever married women (15-49 years) with iron<br />
deficiency - <strong>Karnataka</strong>: 1999<br />
(Per cent)<br />
Background characteristics Any anaemia Mild Moderate Severe<br />
Age<br />
Residence<br />
Caste<br />
Standard of<br />
living<br />
15-19 50.7 26.8 22.4 1.5<br />
20-24 45.7 30.8 13.0 1.9<br />
25-29 40.0 26.1 11.2 2.6<br />
30-34 40.6 24.5 13.9 2.1<br />
35-39 40.7 24.8 12.2 2.7<br />
Urban 35.7 24.5 9.8 1.3<br />
Rural 46.0 27.8 15.4 2.8<br />
SCs 46.6 26.0 18.2 2.4<br />
STs 45.9 27.3 16.4 2.1<br />
Low 51.3 30.4 17.1 3.8<br />
Medium 41.2 26.4 13.1 1.7<br />
High 32.6 21.9 9.0 1.7<br />
Total 42.4 26.7 13.4 2.3<br />
Source: NFHS-2, <strong>Karnataka</strong>, 1998-99.<br />
TABLE 6.25<br />
Anaemia among women in states: 1999<br />
(Per cent)<br />
State Any anaemia Mild Moderate Severe<br />
Andhra Pradesh 49.8 32.5 14.9 2.4<br />
Assam 69.7 43.2 25.6 0.9<br />
<strong>Karnataka</strong> 42.4 26.7 13.4 2.3<br />
Kerala 22.7 19.5 2.7 0.5<br />
Maharashtra 48.5 31.5 14.7 2.9<br />
Tamil Nadu 56.5 36.7 15.9 3.9<br />
India 51.8 35.0 14.8 1.9<br />
Source: NFHS-2, India, 1998-99.<br />
which is a grim testimony to the incidence of<br />
female under nutrition.<br />
State interventions in nutrition<br />
The Centre-state co-fi nanced Integrated Child<br />
<strong>Development</strong> Scheme (ICDS) was launched in<br />
the country in 1975 on an experimental basis<br />
in 33 blocks, one of which was T. Narsipura of<br />
Mysore district (<strong>Karnataka</strong>). The scheme has<br />
multiple objectives of which the improvement<br />
of the nutrition and health of children (0-6<br />
years), pregnant women and nursing mothers<br />
is a signifi cant component. There are now 185<br />
ICDS projects in the state. Self-suffi ciency in<br />
food production in a country will not reduce<br />
malnutrition among the poor particularly among<br />
children and women unless food is available<br />
at affordable prices. The Public Distribution<br />
System (PDS) ensures that food grain procured<br />
and stocked by the Food Corporation of India is<br />
distributed to state governments for distribution<br />
through fair price shops. In 2004, the <strong>Karnataka</strong><br />
government introduced the distribution of 10<br />
kilograms of rice and wheat at Rs.3 per kg to<br />
each yellow cardholder. While this intervention<br />
will have a considerable impact on the diet of the<br />
poor, it must be matched by building nutrition<br />
awareness so that people can supplement their<br />
diets with nutritious, locally available, vegetables<br />
and fruits. Akshara Dasoha, the midday meals<br />
programme for school children, which was<br />
introduced in the seven educationally backward<br />
districts of north <strong>Karnataka</strong> in 2002-03,<br />
and was subsequently upscaled to cover the<br />
entire state in 2003-04, is a major initiative<br />
which will substantially enhance young children’s<br />
nutrition levels.<br />
Public expenditure on<br />
healthcare<br />
Despite the importance of public healthcare<br />
services to the poor who are its primary clients,<br />
expenditure on health and family welfare in<br />
<strong>Karnataka</strong> has not increased over the years and,<br />
in reality, it marginally declined from about one<br />
per cent of GSDP in 1990-91 to about 0.88<br />
per cent of GSDP in 2002-03. It is apparent<br />
that family welfare is not receiving adequate<br />
budgetary support: medical and public health<br />
expenditure grew by about 26 per cent, family<br />
welfare expenditure increased by only 10 per cent<br />
with two negative growth years during 1998-99<br />
and 2002-03.<br />
Within medical and public health, there has been<br />
an increase in the share of expenditure of urban<br />
health services, rural health services and medical<br />
education, training and research (Figure 6.1). The<br />
share of urban health services in medical and<br />
public health has increased from 38 per cent in<br />
1990-91 to 44 per cent in 2002-03. The share<br />
of rural health services in medical and public<br />
144
<strong>Karnataka</strong> <strong>Human</strong> <strong>Development</strong> <strong>Report</strong> <strong>2005</strong><br />
health increased from about one per cent to only<br />
about three per cent, which is low, given the<br />
gap between rural and urban health outcomes.<br />
Expenditure on medical education, training and<br />
research increased from about 11 per cent in<br />
1990-91 to 15 per cent in 2002-03. Overall,<br />
however, there has been a decline in expenditure<br />
on public health during the decade. The share of<br />
public health in the budget has declined from<br />
around nine per cent in 1990-91 to about six per<br />
cent in 2001-02 (Figure 6.1).<br />
While the expenditure on primary healthcare<br />
has remained stagnant, tertiary healthcare is<br />
increasingly getting a bigger share of resources.<br />
This trend is unfortunate since investment in<br />
primary healthcare represents better value for<br />
money than spending on secondary and tertiary<br />
facilities. Primary healthcare constitutes a social<br />
priority sector as it targets rural areas and the<br />
poor who cannot afford expensive private medical<br />
care. The overall status in primary healthcare<br />
expenditure is refl ected in the state’s performance<br />
with regard to several health indicators.<br />
The fi nancial statement of the Department of<br />
Health and Family Welfare (excluding Medical<br />
Education, Training and Research) provided in the<br />
‘Departmental Medium Term Fiscal Plan’ (DMTFP)<br />
shows that in 2001-02, about 69 per cent of the<br />
revenue expenditure was employee-related and<br />
towards transfer payments. Employee-related<br />
expenditure constituted about 31 per cent and<br />
transfer payments about 38 per cent of revenue<br />
expenditure in 2001-02 (Table 6.26). This<br />
classifi cation underestimates the expenditure<br />
related to employees because assistance to local<br />
bodies, a substantial part of which is salary, is<br />
included in transfer payments. As little as 19.55<br />
per cent was spent on supplies, services and<br />
maintenance all of which are important inputs<br />
for improving the quality of services and ensuring<br />
optimal outreach and effi cient delivery.<br />
In 2002-03, about 32 per cent of the total<br />
expenditure on medical and public health was<br />
spent through local bodies. Districts with poor<br />
health indicators such as Belgaum, Dharwad,<br />
Raichur and Koppal often receive less fi nancial<br />
FIGURE 6.1<br />
Components of medical and public health expenditure in <strong>Karnataka</strong>:<br />
1990-91 and 2002-03<br />
Per cent<br />
50<br />
40<br />
30<br />
20<br />
10<br />
0<br />
38<br />
44<br />
Urban Health<br />
Services<br />
1990-91 2002-03<br />
1 3<br />
Rural Health<br />
Services<br />
Medical<br />
education<br />
Training and<br />
Research<br />
BOX 6.3<br />
Yashaswini health insurance for farmers<br />
11<br />
15<br />
9<br />
6<br />
Public Health<br />
41<br />
32<br />
Others<br />
Yashaswini, a cooperative farmers’ healthcare scheme is a landmark initiative of the <strong>Karnataka</strong><br />
government. Launched in June 2003, the scheme has for the fi rst time, addressed the major<br />
health concerns of rural people who typically have no health insurance. A farmer who has been<br />
a member of a co-operative society for at least 6 months can avail of the benefi ts of the scheme<br />
by paying a nominal premium of Rs.60 per annum. The spouse and children are also eligible<br />
to get benefi ts if they pay a premium of Rs.60 per person.<br />
Benefi ciaries under this scheme can approach a pre-identifi ed network hospital for treatment.<br />
The network hospital extends free out-patient services and diagnostic tests at concessional<br />
rates. If surgery is required, then the network hospital takes necessary steps. The benefi ciary<br />
need not pay for surgery if the cost is below Rs.1.00 lakh for a single surgery and below<br />
Rs.2.00 lakh for multiple surgeries. The network hospital gets its fees from the Yashaswini<br />
Trust through the Family Health Plan Limited which is the implementing agency for this<br />
scheme.<br />
Under the scheme, so far over 1,600 surgical procedures costing up to Rs.1.00 lakh for a<br />
single surgery and Rs.2.00 lakh for multiple surgeries are free for members. In the fi rst phase,<br />
16.01 lakh farmers enrolled as members and over 20 lakh farmers enrolled in the second<br />
phase. 164 network hospitals have been identifi ed all over the state under this programme.<br />
About 1.10 lakh farmers have used the services provided under this scheme. About 86,000<br />
free out-patient consultations and 24,122 surgeries have been conducted during 2003-04 and<br />
2004-05. A payment of about Rs.28.56 crore has been made to network hospitals as fees for<br />
cost of treatment.<br />
145
Demography, Health and Nutrition<br />
TABLE 6.26<br />
Revenue expenditure in health and family welfare expenditure<br />
(excluding medical education, training and research): 2001-02<br />
Revenue Expenditure Head<br />
Revenue Expenditure<br />
(Rs. lakh)<br />
State<br />
Revenue Expenditure as per<br />
cent of total expenditure<br />
Employee related 22084.03 30.64<br />
Supplies and services 13335.17 18.50<br />
Maintenance 756.46 1.05<br />
Transfer payments 27333.3 37.93<br />
Others 8556.95 11.87<br />
Total revenue expenditure 72065.91 100.00<br />
Source: Departmental Medium Term Fiscal Plan: 2003-04 to 2006-07, Department of Health and Family Welfare<br />
Services, <strong>Karnataka</strong>.<br />
BOX 6.4<br />
Universal Health Insurance Scheme<br />
TABLE 6.27<br />
<strong>Karnataka</strong> and selected states:<br />
Per capita health expenditure<br />
Per capita health expenditure<br />
(Rs.)<br />
2001-02 2003-04<br />
All-India 184.97 214.62<br />
<strong>Karnataka</strong> 205.45 238.38<br />
Andhra Pradesh 179.45 208.22<br />
Kerala 237.45 275.51<br />
Tamil Nadu 195.44 226.77<br />
Maharashtra 189.39 219.75<br />
Punjab 253.83 294.52<br />
Source: Planning Commission, Mid Term Appraisal, <strong>2005</strong>.<br />
The Universal Health Insurance Scheme (UHIS) is a Government of India programme<br />
to provide health insurance cover to population below poverty line. Under this<br />
programme any individual or a family of 5 or 7 members belonging to below poverty line<br />
category can subscribe by paying an annual premium of Rs.365, Rs.548 and Rs.730<br />
which Govt. of India subsidises by Rs.200, Rs.300 and Rs.400 respectively. From<br />
<strong>2005</strong>-06, the Government of <strong>Karnataka</strong> will pay an additional subsidy of Rs.150, Rs.200 and<br />
Rs.250 under this programme. This reduces the premium payable to Rs.15, Rs.48 and Rs.80<br />
respectively. Initially the state government will cover 2.5 lakh SC/ST families who are members<br />
of Stree Shakti self-help groups.<br />
The benefi ciaries of this scheme will get an insurance cover of Rs.30,000 for the whole year<br />
for certain ailments excluding pre-existing diseases and delivery in case of expectant mothers.<br />
<strong>United</strong> Insurance Company is the nodal implementing agency of this scheme.<br />
assistance than districts with good indicators such<br />
as Chikmaglur, Kodagu and Uttara Kannada. This<br />
disparity indicates that equitable and consistent<br />
norms for allocating funds to Zilla Panchayats<br />
must form the basis of devolution of funds.<br />
Despite the decreasing trend in outlays for fi nancing<br />
healthcare, <strong>Karnataka</strong> ranks third among major<br />
states in its health expenditure (Table 6.27). This<br />
suggests that overall, most states do not provide<br />
adequately for health. A matter of concern is the<br />
fact that <strong>Karnataka</strong> has lower health indicators<br />
than some states that are spending less and the<br />
question of targeting expenditure to regions/<br />
districts and vulnerable sub-populations needs to<br />
be seriously addressed by government.<br />
Government health<br />
infrastructure<br />
Over time, <strong>Karnataka</strong> has seen considerable<br />
expansion in health infrastructure in terms of both<br />
trained professionals and institutions. Between<br />
1985 and 2003, the number of primary health<br />
centres (PHCs) increased from 365 to 1,696,<br />
sub-centres increased from 4,964 to 8,143 and<br />
community health centres (CHCs) from 27 to 253.<br />
However, this expansion was not evenly distributed<br />
across the state as is evident from the institution<br />
and population ratio. The rural population covered<br />
by a PHC is about 30,000 (20,000 in hilly and<br />
tribal areas) and by a sub-centre, about 5,000<br />
(3,000 in hilly and tribal areas). The region-wise<br />
distribution reveals that south <strong>Karnataka</strong> has a<br />
better ratio than either the Bombay <strong>Karnataka</strong> or<br />
Hyderabad <strong>Karnataka</strong> regions. This is also true of<br />
the bed–population ratio. Sub-centre population<br />
coverage in Hyderabad <strong>Karnataka</strong> is about 32<br />
per cent less than south <strong>Karnataka</strong> and 27 per cent<br />
below Bombay <strong>Karnataka</strong>. The corresponding<br />
fi gures in terms of the PHC population ratio are 26<br />
per cent and 16 per cent less than south <strong>Karnataka</strong><br />
and Bombay <strong>Karnataka</strong> respectively. With<br />
reference to the bed–population, infrastructure<br />
in Bombay <strong>Karnataka</strong> region is 37 per cent and<br />
in Hyderabad <strong>Karnataka</strong>, 30 per cent less than<br />
southern <strong>Karnataka</strong>. The doctor–population ratio<br />
is 1:3240 and doctor patient ratio is 1:2167<br />
showing an improvement over 1985 (Table 6.28).<br />
The expansion of coverage of health infrastructure<br />
146
<strong>Karnataka</strong> <strong>Human</strong> <strong>Development</strong> <strong>Report</strong> <strong>2005</strong><br />
facilities is an important step in the provisioning of<br />
an effi cient healthcare delivery system. It should<br />
be supported by providing adequate drugs and<br />
equipment, maintaining institutions, and ensuring<br />
that health personnel are accountable to the<br />
people they serve. A more equitable distribution<br />
of institutions is also very necessary to bridge<br />
regional disparities in health and nutrition levels.<br />
The bed–population ratio (public and private) is<br />
lowest in Kerala (382) followed by Tamil Nadu<br />
(1,120), <strong>Karnataka</strong> (1,209) and Andhra Pradesh<br />
(2,536). There are more than 35,000 sanctioned<br />
posts of doctors, technicians and para-medical<br />
staff of which about 25,500 have been fi lled. The<br />
government has taken steps since the early 1990s<br />
to ensure that all vacancies in the cadre of doctors<br />
and nurses are fi lled, even resorting to local<br />
contract appointments to ensure that vacancies in<br />
the northern and malnad districts are fi lled (Table<br />
6.29). Currently about 10.5 per cent of the posts<br />
of medical offi cers are vacant and districts with<br />
a high number of vacancies are Uttara Kannada<br />
(24 per cent), Kodagu (21 per cent), Raichur<br />
(20.7 per cent) and Chikmaglur (20.5 per cent).<br />
In most of the northern districts vacancies of<br />
doctors are above the state average. Doctors and<br />
other trained para-medical staff are reluctant to<br />
work in north <strong>Karnataka</strong> districts like Raichur and<br />
Gulbarga or in the malnad districts of Kodagu<br />
and Chikmaglur, preferring the more salubrious<br />
climate of Bangalore-Mysore. The number of<br />
vacancies in the cadre of female health assistants<br />
is also rather high. Coupled with absenteeism this<br />
leads to a scenario where institutions function at<br />
below capacity levels and are unable to fulfi l local<br />
needs. Institutional deliveries require that doctors<br />
and nurses be available at all times to deal with<br />
possible emergencies. Kodagu and Chikmaglur,<br />
which have good HDIs, for instance have an IMR<br />
above the state average, which can be partly<br />
attributed to lack of staff.<br />
Public–private participation<br />
<strong>Karnataka</strong> has initiated several measures to<br />
ensure greater community participation in the<br />
management of healthcare. The government<br />
has constituted Arogya Raksha Samithis in<br />
district and taluk hospitals to oversee hospital<br />
BOX 6.5<br />
Round-the-clock nursing services<br />
In a major move towards reducing infant and maternal mortality, <strong>Karnataka</strong> has decided to<br />
provide round the-clock nursing services at the primary health centre level. This service will<br />
ensure more institutional deliveries and improved care of newborn babies. Government has<br />
identifi ed 399 primary health centres in 39 most backward taluks of the state where this new<br />
programme will be piloted.<br />
TABLE 6.28<br />
Regions and selected ratios<br />
Indicators State/Region Rates<br />
<strong>Karnataka</strong> 4285<br />
Rural population covered by a sub-centre<br />
Bombay <strong>Karnataka</strong> 4875<br />
Hyderabad <strong>Karnataka</strong> 5061<br />
South <strong>Karnataka</strong> 3833<br />
<strong>Karnataka</strong> 20780<br />
Rural population covered by PHC<br />
Bombay <strong>Karnataka</strong> 22275<br />
Hyderabad <strong>Karnataka</strong> 24169<br />
South <strong>Karnataka</strong> 19133<br />
<strong>Karnataka</strong> 1221<br />
Population per bed<br />
Bombay <strong>Karnataka</strong> 1499<br />
Hyderabad <strong>Karnataka</strong> 1413<br />
South <strong>Karnataka</strong> 1089<br />
Doctor–population ratio (state) 1:3240<br />
Doctor–patient ratio (state) 1:2167<br />
ANM–population ratio (state) 1:3611<br />
Nurse-bed ratio (state) 1:9<br />
Source: Directorate of Health and Family Welfare Services, <strong>Karnataka</strong>.<br />
TABLE 6.29<br />
Vacancy position of medical officers and other paramedical staff<br />
Category<br />
Total<br />
sanctioned<br />
posts<br />
Currently<br />
working<br />
Vacant as on<br />
30/06/05<br />
Percentage of<br />
vacant to<br />
sanctioned posts<br />
Medical Offi cer 5069 4538 531 10.5<br />
Dental Surgeons 229 209 20 8.7<br />
Sr. Health Asst. (Male) 1302 837 465 35.7<br />
Sr. Health Asst. (Female) 1389 1148 241 17.4<br />
Jr. Health Asst. (Male) 5853 4594 1259 21.5<br />
Jr. Health Asst. (Female ANM) 10255 9382 873 8.5<br />
Pharmacist 2198 1791 407 18.5<br />
Staff Nurse 4717 4367 350 7.4<br />
Others 3361 2673 688 20.4<br />
Source: Directorate of Health and Family Welfare Services, <strong>Karnataka</strong>.<br />
147
Demography, Health and Nutrition<br />
BOX 6.6<br />
Public–private partnership<br />
Under the public–private initiative in the state, so far 80 primary health centres have been identifi ed and 28<br />
have been assigned to private medical colleges and NGOs for complete management and it is now proposed<br />
to assign another 100 primary health centres during the current year. Under this scheme NGOs and private<br />
medical colleges can appoint their own staff to run these centres. Internal evaluation of this arrangement has<br />
shown that there has been considerable improvement in the management of these primary health centres.<br />
maintenance and decide how to use the money<br />
collected as user charges. In another innovative<br />
step, the Health department has mobilised<br />
the support of self-help groups (such as<br />
Stree Shakti groups) to spread awareness about<br />
basic healthcare and to distribute medicines for<br />
common ailments. The management of 28 PHCs<br />
has been transferred to NGOs and private medical<br />
colleges and government provides 75 per cent of<br />
the total expenditure as fi nancial support. This<br />
is an important step towards promoting private<br />
participation in healthcare meant for the poor.<br />
The management of the Rajiv Gandhi super<br />
speciality hospital in Raichur has been entrusted<br />
to Apollo hospitals for 10 years. The <strong>Karnataka</strong><br />
Health Promotion Trust is funded by the Bill Gates<br />
Foundation for focused attention on the control of<br />
HIV/AIDS and rehabilitation of patients.<br />
Private sector and healthcare<br />
The healthcare services provided by the private and<br />
corporate sector are largely concentrated in urban<br />
areas. Despite this constraint, data (NSSO survey)<br />
shows that there is greater dependency on private<br />
healthcare services rather than on government for<br />
non-hospitalised treatment (i.e. outpatient care)<br />
in both rural and urban areas for all southern<br />
states and all-India. Among the southern states,<br />
rural Kerala has the highest proportion of cases<br />
treated in government hospitals followed by rural<br />
<strong>Karnataka</strong>. In urban areas, however, the number of<br />
cases treated in government healthcare facilities is<br />
the lowest in <strong>Karnataka</strong> across all southern states<br />
as well as all-India (Table 6.30).<br />
NFHS 2 data shows that utilisation of public health<br />
facilities and institutions for child delivery is highest<br />
(78.2 per cent) for women with low and middle<br />
standards of living. Utilisation of private healthcare<br />
facilities by SCs and STs is also very low. There<br />
cannot be a better indicator of the primacy of the<br />
state’s healthcare systems as the most favoured<br />
provider of healthcare for the poor.<br />
Private sector healthcare is a mixed scenario, with<br />
high-tech speciality hospitals coexisting with seedy<br />
State<br />
TABLE 6.30<br />
Proportion of persons receiving treatment for ailments and<br />
per capita public expenditure on health<br />
Percentage of ailments<br />
(non-hospitalised) treated<br />
Rural<br />
Urban<br />
Govt.<br />
Other<br />
sources<br />
Govt.<br />
Other<br />
sources<br />
No. treated in<br />
govt. hospital<br />
(per ’000)<br />
Rural<br />
Urban<br />
Population<br />
per<br />
hospital<br />
bed<br />
Per capita<br />
public<br />
expenditure<br />
on health<br />
(Rs.)<br />
<strong>Karnataka</strong> 26 51 17 74 458 298 1209 54<br />
Andhra Pradesh 22 53 19 68 225 362 2536 40<br />
Kerala 28 61 28 62 401 384 382 71<br />
Tamil Nadu 25 54 28 65 411 357 1120 77<br />
India 19 64 20 72 453 431 1412 70<br />
Source: NSS report – 1995-96 (No. 441).<br />
148
<strong>Karnataka</strong> <strong>Human</strong> <strong>Development</strong> <strong>Report</strong> <strong>2005</strong><br />
clinics run by quacks. The services available to the<br />
poor and marginal groups in private health facilities<br />
may not necessarily be superior to what public<br />
healthcare offers but it has certain advantages for<br />
users. Public healthcare is often associated with lack<br />
of staff, medicines and equipment. Above all, there<br />
is chronic absenteeism among providers and rent<br />
seeking. Private healthcare may end up sending the<br />
poor into debt, but its merit lies in being available<br />
when needed. Improved governance will certainly<br />
result in better utilisation of public health facilities<br />
by those for whom it was designed.<br />
Achieving the objectives of<br />
Vision 2020<br />
The foregoing analysis of population, health and<br />
nutrition provides a reasonably bright picture of<br />
achievements. The various strategies of the state<br />
have had a positive impact on health as refl ected in<br />
the fact that most of the health indicators are above<br />
the all-India average. Disparities between regions,<br />
men and women, and between social groups have<br />
also narrowed. Although the state must now focus on<br />
matching the performance of neighbours like Kerala,<br />
it can be said that <strong>Karnataka</strong> is moving in the right<br />
direction and the targeted level of achievements<br />
in the <strong>Karnataka</strong> Vision 2020 document is likely<br />
to be achieved if the tempo is enhanced through<br />
increased fi nancial outlays and sustained good<br />
governance. Lack of adequate budgetary support<br />
and a need to improve governance, especially at<br />
the cutting edge are factors that impact critically on<br />
health outcomes.<br />
One crucial path to achieving the goals set out in<br />
Vision 2020 lies in targeting disparities of region,<br />
caste and gender.<br />
The Hyderabad <strong>Karnataka</strong> region, which<br />
has poor health indicators compared with<br />
other regions, is underserved in terms of<br />
infrastructure and funding. Literacy rates<br />
are low, the percentage of agricultural wage<br />
labour is signifi cantly large, and there is a<br />
concentration of SC and ST populations.<br />
Similarly, there are certain districts like<br />
Bijapur in Bombay <strong>Karnataka</strong>, Chamrajnagar,<br />
Kolar and Tumkur in south <strong>Karnataka</strong>, which<br />
have levels of performance below their<br />
regional average. These areas will need<br />
BOX 6.7<br />
Tele-medicine project<br />
The <strong>Karnataka</strong> Tele-medicine Project is a joint venture of the Indian Space Research Organisation<br />
(ISRO) and the Government of <strong>Karnataka</strong> to provide expert medical services to rural and remote<br />
areas. Hospitals/health centres in remote areas are linked via INSAT satellites with super<br />
speciality hospitals thus providing patients in rural/remote places with access to specialist<br />
doctors for consultation and referral services.<br />
The tele-medicine system consists of customised medical software integrated with computer<br />
hardware, along with diagnostic instruments connected to VSAT at each location.<br />
The project was started on a pilot basis wherein Chamarajnagar district hospital and Vivekananda<br />
Memorial Hospital (an NGO-run rural health unit) at Saragur in H.D. Kote taluk, Mysore district<br />
were linked with Narayana Hrudayalaya, Bangalore.<br />
Tele-medicine is used for the following purposes:<br />
Remote consultation;<br />
Second opinion;<br />
Interpretation services;<br />
Continuing education and exchange of clinical information; and<br />
Home care.<br />
<strong>Karnataka</strong>’s tele-medicine project envisages linking of all district hospitals, hospitals run by trusts<br />
as well as a few taluk level hospitals with super speciality hospitals such as Narayana Hrudayala,<br />
Bangalore (Cardiology), Jayadeva Institute of Cardiology, Bangalore, St. John’s Medical College<br />
hospital, Bangalore (Paediatrics), NIMHANS, Bangalore (Neurology), JSS Institute of Medical<br />
Science, Mysore (Nephrology) and Samatvam Institute of Diabetology, Bangalore (Diabetics).<br />
The Government is extending this project to 13 more districts and the remaining districts will be<br />
covered in a phased manner. The government of <strong>Karnataka</strong> will provide the required personnel and<br />
space for the project while ISRO will provide VSAT connection and equipment.<br />
strategies tailored to address the specifi city<br />
of their defi ciency in health performance.<br />
Sub-populations such as the Scheduled Castes<br />
and Tribes have a very poor health profi le<br />
compared with the rest of the population.<br />
Their CBR, CDR and IMR are worse than the<br />
state average. Their utilisation of healthcare<br />
facilities is also poor. Maximising coverage of<br />
these vulnerable groups will have promising<br />
outcomes.<br />
Women should be a strong focus area<br />
because so many health issues arise from<br />
gender inequity and their lack of control over<br />
their reproduction. High MMR and IMR and<br />
insuffi cient nutrition point to the subordinate<br />
and marginal status of women.<br />
Enhancing health expenditure is critical to<br />
improvements in healthcare services. Health<br />
One crucial path to<br />
achieving the goals set<br />
out in Vision 2020 lies in<br />
targeting disparities of<br />
region, caste and gender.<br />
149
Demography, Health and Nutrition<br />
TABLE 6.31<br />
<strong>Karnataka</strong> Health Vision 2020: Targets<br />
Indicators Year of reference Status as on 2001 Targets for 2020<br />
Infant mortality rate SRS 1999 58 25<br />
Under-5 mortality rate NFHS-2 69 35<br />
Crude birth rate SRS 1999 22.3 13<br />
Crude death rate SRS 1999 7.7 6.5<br />
Maternal mortality rate SRS 1998 195 90<br />
Life expectancy at birth (years) 1996-2001<br />
Male 61.7<br />
Female 65.4 75<br />
Total fertility rate NFHS - 2 2.13 1.6<br />
Percentage of institutional deliveries 51.1% 75%<br />
Percentage of safe deliveries 59.2% >95%<br />
Percentage of low birth weight 1994 35% 10%<br />
Percentage of mothers who received ANC 2000 86.3% 100%<br />
Percentage of eligible couples protected 2000 59.7% 70 %<br />
Percentage of children fully immunised NFHS - 2 60 90%<br />
Anaemia among children (6–35 months) NFHS - 2 70.6 % 40 %<br />
Nutritional status of children<br />
Severe under-nutrition Gomez 1996 6.2 % 2 %<br />
Moderate under-nutrition 45.4 % 25 %<br />
Mild under-nutrition 39 % 43 %<br />
Normal 9.4 % 30 %<br />
Sex ratio 2001 965 975<br />
Sex ratio (0–6 years) 2001 946 970<br />
70<br />
Since more than 70<br />
per cent of total<br />
infant deaths occur<br />
at the neonatal stage,<br />
interventions must focus<br />
on several strategies to<br />
prevent neonatal deaths.<br />
expenditure actually declined from 1 per cent<br />
of GSDP in 1990-91 to 0.88 per cent in<br />
2002-03. Expenditure on rural healthcare<br />
must be stepped up since the most vulnerable<br />
segment of the population resides here.<br />
Expansion in medical and tertiary education<br />
must not occur at the expense of primary<br />
healthcare.<br />
Population growth will have to come down<br />
to about 1.0 per cent per year from the<br />
current 1.7 per cent. This can be achieved by<br />
reducing CBR to about 16 to begin with<br />
(the target is 13), through family planning<br />
and reducing CDR to less than 6 through<br />
improved health. This would stabilise the<br />
population.<br />
Since more than 70 per cent of total<br />
infant deaths occur at the neonatal<br />
<br />
stage, interventions must focus on several<br />
strategies to prevent neonatal deaths<br />
through encouraging spacing methods<br />
particularly in young couples and combining<br />
community healthcare with institutional<br />
facilities. The causes of neonatal deaths are<br />
both exogenous and endogenous. Many are<br />
preventable through early detection (e.g. low<br />
birth weight, obstructed labour, asphyxia)<br />
and immunisation, which is why full ANC of<br />
the target population should be 100 per cent.<br />
Filling up all vacancies of ANMs and medical<br />
offi cers, training, orientation, and supervision<br />
are essential.<br />
Complete immunisation among children<br />
below two years must be achieved in spite<br />
of substantial investment. High-risk districts<br />
such as Raichur, also have the least coverage<br />
150
<strong>Karnataka</strong> <strong>Human</strong> <strong>Development</strong> <strong>Report</strong> <strong>2005</strong><br />
and achievement of targets here will ensure<br />
universal immunisation in the state.<br />
High rates of MMR can be best minimised by<br />
ensuring total ANC and universal coverage<br />
by skilled birth assistants and institutional<br />
obstetric care for problematic cases. Here<br />
rural areas are most in need of attention<br />
with a high 61.5 per cent of deliveries taking<br />
place at home. More 24-hour facilities to<br />
deal with medical emergencies will have to<br />
be introduced.<br />
The magnitude of under-nutrition and iron<br />
defi ciency in <strong>Karnataka</strong>, as revealed by recent<br />
data squarely signals that nutrition is a major<br />
health issue in the state. The targets for 2007<br />
include reduction of severe malnutrition<br />
among children from 6.2 per cent to 3 per cent<br />
and moderate malnutrition from 45 per cent<br />
to 30 per cent, and reduction in newborn<br />
children with low birth weight from 35<br />
per cent to 10 per cent. This ambitious<br />
plan requires a proper strategy to promote<br />
low-cost, nutritious diets using locally<br />
available food to supplement food security<br />
through the PDS while poverty reduction<br />
programmes add to people’s income. The<br />
impact of the ICDS has been diluted by its<br />
inability to target high-risk cases.<br />
The quality of healthcare services seems<br />
to be on the decline as refl ected by the<br />
low ANC coverage and the fact that only<br />
50 per cent of deliveries are institutional<br />
deliveries. Public healthcare will have to<br />
improve quality by ensuring that all staff is<br />
in place especially in regions/districts with<br />
high IMR and MMR, maintaining buildings<br />
and equipment and ensuring an adequate<br />
supply of medicines.<br />
Good governance in health means that service<br />
providers will function in a transparent and<br />
responsible manner. Absenteeism and graft<br />
must be dealt with fi rmly.<br />
Public health programmes in the state<br />
have not yet managed to control diseases<br />
like malaria, tuberculosis, jaundice,<br />
gastroenteritis, and the incidence of some<br />
of these diseases has risen in recent times.<br />
Better sanitation and a protected source of<br />
drinking water are critical inputs.<br />
Data on morbidity is grossly defi cient and<br />
data on morbidity at all health facilities<br />
should be compiled at district level.<br />
District-wise data on MMR and IMR are not<br />
readily available.<br />
Gram panchayats should be involved in<br />
managing healthcare by developing a set of<br />
village level indicators that can be monitored<br />
regularly. Containing HIV/AIDs will require<br />
strenuous efforts from local bodies and<br />
communities.<br />
Promote low-cost,<br />
nutritious diets using<br />
locally available food<br />
to supplement food<br />
security through the PDS<br />
while poverty reduction<br />
programmes add to<br />
people’s income.<br />
Gram panchayats should<br />
be involved in managing<br />
healthcare by developing<br />
a set of village level<br />
indicators that can be<br />
monitored regularly.<br />
151
Housing, Water Supply and Sanitation
CHAPTER 7<br />
Housing, Water Supply and Sanitation<br />
Introduction<br />
Shelter is a basic need for human existence – for<br />
protection from the elements as well as to raise<br />
families. And, just as provision of shelter facilitates<br />
human existence, access to drinking water,<br />
sanitation and hygiene rank foremost among the<br />
basic services that affect human development.<br />
Access to safe drinking water and basic sanitation<br />
impacts not only poverty and health indicators,<br />
but also has critical gender implications in terms<br />
of women’s work and women’s health. This<br />
chapter deals with these three facets of human<br />
development in <strong>Karnataka</strong>.<br />
I. HOUSING<br />
While all human beings need shelter, for the poor,<br />
even the most basic shelter may be beyond reach<br />
because they do not own land or because the<br />
cost of building materials and construction is too<br />
high. Shelter is a basic human need. The National<br />
Housing and Habitat Policy, 1998 provides the<br />
framework for the implementation of shelter<br />
programmes in the country. The national agenda<br />
on housing envisages the creation of 2 million<br />
houses every year. The Habitat policy and the<br />
national agenda recognise housing activity as an<br />
engine for substantial employment generation in<br />
the country.<br />
The ‘Working Group on Housing’ for the preparation<br />
of the ‘Tenth Plan Approach Paper’ has observed<br />
that 90 per cent of the housing shortage relates<br />
to the poor and that there is need to increase the<br />
supply of affordable housing to low income groups<br />
through a proper process of allocation of land,<br />
extension of funding assistance and provision of<br />
support services. All the issues identifi ed by the<br />
Working Group relate to the sphere of activity<br />
and responsibility of state governments and local<br />
bodies, and therefore, the success of the National<br />
Housing Policy depends largely on the efforts of<br />
state governments.<br />
Providing better living conditions for people is now<br />
a global concern. The Millennium <strong>Development</strong><br />
Goals envisage achieving signifi cant improvements<br />
in the lives of at least 100 million slum dwellers<br />
by the year 2020. In this context, urban planning<br />
and governance structures have to be made more<br />
effective, and incorporate an explicitly pro-poor<br />
focus on land rights and affordable low-cost<br />
housing to meet the burgeoning demand for<br />
shelter in urban areas.<br />
The housing scenario<br />
In <strong>Karnataka</strong>, 54.9 per cent of households live in<br />
permanent houses, as compared with Kerala, which<br />
While all human beings<br />
need shelter, for the<br />
poor, even the most basic<br />
shelter may be beyond<br />
reach because they do not<br />
own land or because the<br />
cost of building materials<br />
and construction is too<br />
high.<br />
FIGURE 7.1<br />
Number of houses by type: <strong>Karnataka</strong> and India 2001<br />
<strong>Karnataka</strong> 2001 India 2001<br />
9.5<br />
54.9<br />
18.1<br />
51.8<br />
35.6<br />
30<br />
Permanent Semi-permanent Temporary Permanent Semi-permanent Temporary<br />
155
Housing, Water Supply and Sanitation<br />
BOX 7.1<br />
<strong>Karnataka</strong>’s Habitat Policy<br />
has the highest percentage of households (68.1<br />
per cent) living in permanent houses among the<br />
southern states. This is above the national average<br />
of 51.8 per cent. A high 35.6 per cent of households<br />
in <strong>Karnataka</strong> have semi-permanent houses, a<br />
high proportion among southern states, and<br />
above the national average of 30 per cent. Urban<br />
households perform better, with 77.9 per cent<br />
households living in permanent houses, as<br />
compared with only 42.6 per cent in rural areas.<br />
The scenario is reversed with regard to temporary<br />
houses. (Table 7.1)<br />
<strong>Karnataka</strong> (78.5 per cent) stands fourth among<br />
the southern states with regard to the number of<br />
households living in houses that they own. This is<br />
less than the national average of 86.66 per cent.<br />
<strong>Karnataka</strong>, with 18.7 per cent households living<br />
in rented houses, ranks just after Tamil Nadu (19.9<br />
The state’s millennium policy envisages:<br />
1. Construction of 2,00,000 houses each year and 10,00,000 houses during the period<br />
2000-05 through state government sponsored Ashraya and Ambedkar (the latter scheme<br />
is for Scheduled Castes and Scheduled Tribes) housing programmes as well as Centrally<br />
sponsored housing programmes for the poor;<br />
2. Preparation of a reliable database for implementing housing programmes for the poor in<br />
rural and urban areas;<br />
3. Ownership of the dwelling units shall be in the name of women except in the case of<br />
widowers, ex-servicemen, and the physically disabled;<br />
4. Quotas for the Scheduled Castes/Scheduled Tribes in allocation - in 2002-03, the quotas<br />
increased to 40 per cent for SCs from 30 per cent and for STs to 10 per cent from three<br />
per cent;<br />
5. Quotas for the physically disabled were enhanced from three per cent to fi ve per cent in<br />
2003 and for senior citizens without any income, it is two per cent;<br />
6. Establishing a Special Purpose Vehicle (SPV), the Rajiv Gandhi Rural Housing Corporation<br />
as the nodal agency to implement the housing programmes;<br />
7. Providing a subsidy at Rs.10,000 per unit to all (poor) benefi ciaries and an additional<br />
subsidy of Rs.10,000 for SCs/STs for houses constructed in rural areas;<br />
8. Procuring, preferably by direct purchase from landowners, lands required for housing in<br />
rural and urban areas;<br />
9. Providing house sites free of cost to eligible benefi ciaries in both rural and urban areas;<br />
10. Encouraging benefi ciary participation in construction;<br />
11. Providing guarantee for funds borrowed from HUDCO and other fi nancial institutions;<br />
12. Facilitating housing for certain socio-economic groups such as beedi workers, porters in<br />
agricultural market yards, weavers, artisans, leather artisans, safai karmacharis, fi sher<br />
people; and<br />
13. Benefi ciary selection through gram sabhas.<br />
per cent) among the southern states. However, the<br />
proportion of households owning houses in rural<br />
areas is quite high at 91.2 per cent (Table 7.1).<br />
Across districts, only 24 per cent households in<br />
Raichur district live in permanent houses and<br />
44.3 per cent are in semi-permanent houses, as<br />
compared with Bangalore Urban district, where<br />
89.7 per cent households live in permanent<br />
houses. The proportion of temporary houses is the<br />
highest in Koppal district (33.8 per cent) followed<br />
by Raichur (31.7 per cent), Gadag (28.1 per cent)<br />
and Bellary (24.5 per cent), all of which are in<br />
north <strong>Karnataka</strong> (Appendix Tables: Series 9).<br />
Bangalore Urban district tops the state in respect<br />
of households living in permanent houses in urban<br />
areas (92.1 per cent) while Bidar (a low HDI district)<br />
tops the state in respect rural households living in<br />
permanent houses (74.5 per cent). Raichur has<br />
the lowest percentage of rural households living in<br />
permanent houses (13.7 per cent) and Gadag has<br />
the lowest percentage of urban households (41.3<br />
per cent) living in permanent houses. Data indicates<br />
that Bangalore Urban has the least percentage of<br />
semi-permanent houses (6.4) in respect of urban<br />
areas (Appendix Tables: Series 9).<br />
Data on the tenure of households indicates that<br />
the lowest percentage of families (45.69) that<br />
own houses are to be found in Bangalore Urban,<br />
which is below the state average of 78.46 per cent.<br />
The highest percentage of households in<br />
Bangalore Urban lived in rented houses (50.73).<br />
The highest percentage (90.94) of households<br />
that own houses is in Chamarajnagar (a low HDI<br />
district) followed by Udupi (90.42) and Bidar<br />
(90.19). In Udupi, a high HDI district, we fi nd only<br />
7.37 per cent of households in rented houses. A<br />
low 68.3 per cent of rural households in Kodagu<br />
district own their houses, followed by Bangalore<br />
Urban (69.0 per cent) while 95.7 per cent of rural<br />
households who own houses are situated in a<br />
relatively underdeveloped district like Bidar. The<br />
urban scenario shows that in Bangalore Urban,<br />
only 43 per cent households own houses while 54<br />
per cent live in rented houses (Appendix Tables:<br />
Series 9).<br />
156
<strong>Karnataka</strong> <strong>Human</strong> <strong>Development</strong> <strong>Report</strong> <strong>2005</strong><br />
TABLE 7.1<br />
Distribution of households by tenure and type: <strong>Karnataka</strong> and selected states: 2001<br />
(’000s)<br />
State Area Tenure Status Type<br />
India<br />
<strong>Karnataka</strong><br />
Kerala<br />
Tamil Nadu<br />
Andhra<br />
Pradesh<br />
Maharashtra<br />
Gujarat<br />
Total Own Rented Any other Permanent Semi-permanent Temporary<br />
Total 191964 166353 20230 5380 99432 57664 34816<br />
% 100.0 86.66 10.53 2.80 51.8 30.0 18.1<br />
Rural 138272 130491 4913 2867 56829 49402 32010<br />
% 72.03 94.37 3.55 2.04 41.1 35.7 23.1<br />
Urban 53692 35862 15317 2513 42602 8262 2806<br />
% 27.97 66.79 28.53 4.68 79.3 15.4 5.2<br />
Total 10232 8028 1909 295 5613 3645 971<br />
% 100.0 78.5 18.7 2.8 54.9 35.6 9.5<br />
Rural 6675 6085 416 174 2843 3009 821<br />
% 65.24 91.2 6.2 2.6 42.6 45.1 12.3<br />
Urban 3557 1943 1493 121 2770 636 150<br />
% 34.76 54.6 42.0 3.4 77.9 17.9 4.2<br />
Total 6595 6110 332 154 4494 1424 673<br />
% 100.0 92.6 5.0 2.3 68.1 21.6 10.2<br />
Rural 4943 4663 163 116 3191 1185 564<br />
% 74.95 94.3 3.3 2.4 64.6 24.0 11.4<br />
Urban 1653 1447 169 37 1303 239 109<br />
% 25.05 87.5 10.2 2.3 78.8 14.5 6.6<br />
Total 14174 11007 2822 345 8295 2572 3304<br />
% 100.0 77.7 19.9 2.4 58.5 18.1 23.3<br />
Rural 8275 7554 556 165 3914 1672 2688<br />
% 58.38 91.3 6.7 2.0 47.3 20.2 32.5<br />
Urban 5899 3452 2266 180 4381 900 616<br />
% 41.62 58.5 38.4 3.0 74.3 15.3 10.4<br />
Total 16850 13795 2715 340 9221 3589 4034<br />
% 100.0 81.9 16.1 2.0 54.7 21.3 23.9<br />
Rural 12676 11457 1001 218 5962 3077 3633<br />
% 75.23 90.4 7.9 1.7 47.0 24.3 28.7<br />
Urban 4174 2337 1713 123 3259 512 401<br />
% 24.77 56.0 41.1 2.9 78.1 12.3 9.6<br />
Total 19063 15311 3020 732 11021 6553 1475<br />
% 100.0 80.3 15.8 3.8 57.8 34.4 7.7<br />
Rural 10994 9891 724 378 4434 5274 1281<br />
% 57.67 90.0 6.6 3.4 40.3 48.0 11.7<br />
Urban 8070 5419 2296 354 6587 1279 194<br />
% 42.33 67.2 28.5 4.4 81.6 15.9 2.4<br />
Total 9644 8207 1181 256 6300 2849 492<br />
% 100.0 85.1 12.2 2.7 65.3 29.5 5.1<br />
Rural 5886 5458 324 104 3000 2453 431<br />
% 61.03 92.7 5.5 1.8 51.0 41.7 7.3<br />
Urban 3758 2749 857 152 3300 395 62<br />
% 38.97 73.2 22.8 4.1 87.8 10.5 1.6<br />
Source: Registrar General of India, Census of India 2001, Housing Profi le, Tables H-4, H-5 and H-6.<br />
157
Housing, Water Supply and Sanitation<br />
House ownership is high<br />
in the predominantly<br />
agrarian north <strong>Karnataka</strong><br />
districts where land<br />
values are less likely<br />
to be affected by<br />
speculation consequent<br />
on urbanisation as in<br />
Bangalore Urban.<br />
There appears to be little correlation between the<br />
economic development of a district and house<br />
ownership patterns. House ownership is high in the<br />
predominantly agrarian north <strong>Karnataka</strong> districts<br />
where land values are less likely to be affected<br />
by speculation consequent on urbanisation as in<br />
Bangalore Urban. Migration to cities is a factor<br />
that pushes up the percentage of persons living<br />
in rented houses.<br />
Policy interventions<br />
Given the relatively low percentage of house<br />
ownership in the state, <strong>Karnataka</strong> has long<br />
recognised the signifi cance of housing as an<br />
important component of the Minimum Needs<br />
Programme. Indeed, <strong>Karnataka</strong> had launched a<br />
state-funded housing programme for the poor<br />
through the Ashraya and Ambedkar housing<br />
programmes in 1993-94, long before the National<br />
Habitat Policy was formulated. The state has one<br />
of the best housing programmes in the country.<br />
Housing schemes<br />
The Ashraya programme provides assistance of<br />
Rs.20,000 of which Rs.10,000 is a subsidy and<br />
the remaining Rs.10,000 is a loan. For SC/ST<br />
benefi ciaries in both Ashraya and Ambedkar<br />
programmes, the entire provision of Rs.20,000<br />
is a subsidy. In the urban Ashraya programme,<br />
the assistance is Rs.25,000 with a benefi ciary<br />
contribution of at least Rs.5,000.<br />
The state launched the ambitious ‘One Million<br />
Housing Programme’ in October 2000, which<br />
envisaged the construction of one million dwelling<br />
units in rural and urban areas during the period<br />
2000-05, i.e. 2,00,000 houses each year. Rural<br />
housing has been given primacy with an annual<br />
target of about 1,70,000-2,20,000 houses.<br />
The annual target for the urban programme is<br />
30,000. The cost of urban projects is usually very<br />
high.<br />
BOX 7.2<br />
Some innovative strategies<br />
Beneficiary participation<br />
Local bodies and SPVs have traditionally constructed housing projects with<br />
little input from benefi ciaries. Over the last fi ve years, however, benefi ciary<br />
construction has become the preferred mode of implementation, particularly<br />
in the districts of south <strong>Karnataka</strong>. This mode of construction is facilitated<br />
by the presence of reasonably skilled construction labour such as masons<br />
and underemployed farm labour, which doubles as semi-skilled or unskilled<br />
construction labour. At present, about 80 per cent of the construction of<br />
houses for the economically weaker sections (EWS) in rural areas is<br />
constructed by benefi ciaries. This has the advantage of ensuring that dwelling<br />
units address the social, cultural and occupational needs of the benefi ciaries<br />
far more effectively than agency-constructed core housing could hope to<br />
achieve. Benefi ciary participation takes the form of direct participation<br />
in construction, supervision of work, attending to simple, yet signifi cant,<br />
tasks such as curing cement blocks or masonry to provide additional funds<br />
for construction of the dwelling unit. The generation of local employment<br />
and use of locally available building materials is a crucial economic<br />
outcome of this approach. There is better accountability for the funds since<br />
these are made available to the benefi ciaries only when they attain the<br />
prescribed benchmarks. ‘Self-help’ housing does not, however, mean that<br />
benefi ciaries are deprived of technical inputs. Taluk panchayat engineering<br />
staff, Nirmithi Kendras and the <strong>Karnataka</strong> Land Army Corporation (KLAC)<br />
provide construction support to benefi ciaries who are unable to construct<br />
their own houses. In urban areas, ‘core’ housing is provided by agencies<br />
as a matter of policy to prevent speculation in land, since land markets are<br />
poorly organised and there is heavy demand for house sites, even by the<br />
non-poor and there is every likelihood that sites may be sold to speculators,<br />
thus defeating the purpose of the programme.<br />
Women’s empowerment<br />
The decision of the state to select only women benefi ciaries for assistance<br />
under the housing programmes (barring some exceptions) and give hakku<br />
patras (title deeds) for house sites and houses only in the names of the<br />
women of the household, has had a critical impact on ownership patterns in<br />
a society where land, houses and assets traditionally belong to men. It is a<br />
signifi cant step towards promoting gender equity.<br />
Community participation<br />
The selection of benefi ciaries was initially entrusted to the Ashraya<br />
Committee. Now gram panchayats identify and select benefi ciaries,<br />
and the very poor will hopefully now be in a position to articulate their<br />
demands. This is a signifi cant step towards governance through community<br />
participation.<br />
Social equity<br />
There is specifi c targeting of Scheduled Caste and Scheduled Tribe people<br />
through the Ambedkar (100.0 per cent) and Ashraya programmes<br />
(50.0 per cent).<br />
158
TABLE 7.2<br />
Houses constructed under State and Central schemes: 1999–2004<br />
<strong>Karnataka</strong> <strong>Human</strong> <strong>Development</strong> <strong>Report</strong> <strong>2005</strong><br />
Sector Area Scheme Years Total<br />
State<br />
Central<br />
Rural<br />
Urban<br />
1999-2000 2000-01 2001-02 2002-03 2003-04<br />
Ashraya 53630 71794 136886 115267 108747 486324<br />
Matsya Ashraya 1598 1851 1066 264 4779<br />
Ambedkar 22712 17619 26489 18415 16274 101509<br />
Ambedkar 2999 3058 1727 1121 8905<br />
Ashraya 7746 28702 34274 20020 17966 108708<br />
KSCB (Hudco) 2000 1985 2291 2080 8356<br />
KSCB (SC/ST) 1000 1080 1000 3080<br />
Total 86088 125697 205929 159575 144372 721661<br />
Urban KSCB (Vambay) 10312 7968 18280<br />
Indira Awas Yojana 36626 27785 29096 28910 24222 146639<br />
Rural (I.A.Y.)<br />
PMGY 2217 3360 4112 9689<br />
Total 36626 27785 31313 42582 36302 174608<br />
Grand Total 122714 153482 237242 202157 180674 893189<br />
Source: Rajiv Gandhi Rural Housing Corporation Limited, progress reports of various years.<br />
(Nos.)<br />
A village-wise demand survey was conducted by<br />
gram panchayats during May-June 2003 and it<br />
has been estimated that there are 12.26 lakh<br />
houseless people and 10.43 lakh people without<br />
house sites who have asked for assistance under<br />
the programme. Since 2001-02, a large number<br />
of new village settlements known as Navagramas<br />
has been created adjoining, and preferably<br />
abutting existing village settlements to decongest<br />
villages. So far 2,399 Navagramas have been<br />
created to provide better amenities.<br />
Table 7.2 gives details of houses constructed<br />
under the state and Central government sponsored<br />
housing programmes during 1999-2004. State<br />
sponsored schemes constitute 80 per cent of the<br />
rural housing programmes and 87.5 per cent of<br />
the urban housing programmes implemented in<br />
<strong>Karnataka</strong>. The state had invested over Rs.18,912<br />
million till March 2004 to create 8,96,269<br />
dwelling units.<br />
Recommendations<br />
<br />
It would be no exaggeration to state that the<br />
poor fi nd it diffi cult to borrow for housing.<br />
<br />
Commercial banks are unwilling to lend to<br />
the poor, and even if they are willing to do<br />
so, lending norms, guidelines and collateral<br />
security requirements mean that the most<br />
needy get excluded. Hence, in <strong>Karnataka</strong>,<br />
institutional lending is channelled through<br />
the state government. The concerns of banks<br />
can be met by organising an institutional<br />
partnership with local bodies and<br />
microfi nance structures that would ensure<br />
loan recoveries cost-effectively and also<br />
facilitate savings for home loans to meet<br />
credibility requirements. There is defi nitely<br />
a need for banks to have a fresh look at the<br />
lending norms for the poor to enable them<br />
to access funds for housing.<br />
Currently, provision of infrastructure facilities<br />
like water, electricity, sanitation, internal<br />
roads and drains is not being fi nanced under<br />
any housing programme. This has resulted in<br />
poor occupancy and a poor quality of life for<br />
occupants in the settlements. Infrastructure<br />
provision is extremely resource intensive and<br />
should not be left to cash-starved local bodies<br />
to provide; it should be funded by the state<br />
159
Housing, Water Supply and Sanitation<br />
Infrastructure provision<br />
is extremely resource<br />
intensive and should not<br />
be left to cash-starved<br />
local bodies to provide; it<br />
should be funded by the<br />
state since the ability of<br />
the poor to contribute is<br />
meagre.<br />
<br />
<br />
<br />
since the ability of the poor to contribute is<br />
meagre.<br />
In <strong>Karnataka</strong> the state survey reveals that<br />
14.31 lakh families are houseless and<br />
15.08 lakh families do not own house sites.<br />
The number of houseless families is the<br />
highest in Belgaum (1.07 lakh) followed<br />
by Gulbarga (1.02 lakh), Kolar (0.99 lakh),<br />
Mysore (0.96 lakh) and Tumkur (0.94). 1<br />
Public policy must focus on targeting<br />
resources to districts where the problem of<br />
houselessness is most acute.<br />
An evaluation-cum-audit of the gender<br />
sensitive initiative that mandates that house<br />
title deeds shall be in women’s names must<br />
be taken up to assess the impact of this step<br />
in changing gender relations and empowering<br />
women.<br />
The National Urban Renewal Mission (NURM)<br />
is expected to be the major vehicle for urban<br />
renewal in the country, providing substantial<br />
fi nancial assistance for urban infrastructure<br />
and provision of basic services for the urban<br />
poor. Accordingly, the city development<br />
plans and strategies must focus on enabling<br />
the poor to better access civic services.<br />
Those working in the urban informal sector,<br />
especially women, must be included in the<br />
agenda for urban regeneration.<br />
TABLE 7.3<br />
Distribution of households by location of drinking water:<br />
<strong>Karnataka</strong> 2001<br />
(’000s)<br />
Location Total Per cent Rural Per cent Urban Per cent<br />
Access within the premises 3248 31.7 1236 18.5 2011 56.5<br />
Access outside the<br />
premises 4749 46.4 3696 55.4 1054 29.6<br />
Access away from the<br />
premises 2235 21.8 1743 26.1 492 13.8<br />
Total no. of households 10232 100.0 6675 65.2 3557 34.8<br />
Source: Registrar General of India, Census 2001, Housing Profi le, <strong>Karnataka</strong>.<br />
II. DRINKING WATER AND<br />
SANITATION<br />
Among the basic services that affect human<br />
development are access to drinking water (defi ned<br />
in terms of availability, proximity and quality),<br />
sanitation and hygiene. Access to drinking water<br />
has implications not only for health status and<br />
human development parameters but also for<br />
opportunities depending upon the opportunity cost<br />
of time. This has special implications for women<br />
and children. The responsibility for fetching water,<br />
sometimes over long distances, for household<br />
needs is invariably assigned to women or girls,<br />
who drop out of school to attend to these chores.<br />
Hence, the ready availability of safe drinking water<br />
lays the foundation for improvement in literacy<br />
and health indicators in communities.<br />
According to the 2001 Census estimates, 31.7<br />
per cent of all households in <strong>Karnataka</strong> had access<br />
to drinking water within their premises, 46.4<br />
per cent outside the premises, and a substantially<br />
lower number (21.8 per cent) had access away<br />
from the premises. 2 Disaggregated data shows<br />
that urban <strong>Karnataka</strong> is doing better in terms of<br />
facilities; in rural <strong>Karnataka</strong>, only 18.5 per cent of<br />
households had access to drinking water within<br />
the premises compared with a high 56.5 per cent<br />
for urban <strong>Karnataka</strong>. However, the statistics<br />
are reversed with regard to access to drinking<br />
water outside the premises, with 55.4 per cent<br />
rural households having access to drinking water<br />
outside the premises as against 29.6 per cent for<br />
urban areas. This unequal pattern continues with<br />
reference to the percentage of households with<br />
access to drinking water away from the premises:<br />
it is 26.1 per cent for rural <strong>Karnataka</strong> and 13.8<br />
per cent for urban <strong>Karnataka</strong> (Table 7.3).<br />
However, this pattern holds good for other states<br />
as well: countrywide, access to drinking water<br />
is markedly better in urban areas than in rural<br />
areas. The principal sources of drinking water are<br />
taps, hand pumps, tube wells, wells, tanks, ponds,<br />
1<br />
Samanya Mahiti: District-wise statistics on Housing prepared by<br />
Rural <strong>Development</strong> and Panchayat Raj department based on the<br />
Census 2001 data.<br />
2<br />
Away from the premises is defi ned in the Census as a water<br />
source that is beyond 500 metres from the dwellings in rural<br />
areas and beyond 100 metres in urban areas.<br />
160
<strong>Karnataka</strong> <strong>Human</strong> <strong>Development</strong> <strong>Report</strong> <strong>2005</strong><br />
lakes, rivers, canals and springs, etc. Forty-eight<br />
per cent rural households and 78.4 per cent urban<br />
households access their drinking water from<br />
taps. In rural areas, however, 22.9 per cent of<br />
households rely on hand pumps and 15.6 per cent<br />
on wells while in urban areas; taps constitute the<br />
dominant source (Table 7.4).<br />
Some important indicators available for sanitation<br />
relate to access to bathroom and latrine facilities.<br />
Here, too, the rural–urban difference is marked.<br />
While 79.1 per cent urban households had a<br />
bathroom in the premises, the proportion for rural<br />
areas was 48.1 per cent. While a high 82.5 per cent<br />
of rural households had no latrines in the premises,<br />
only 24.7 per cent urban households did not<br />
have latrines. As many as 44.9 per cent urban<br />
households had water closets. Both urban and rural<br />
households were relatively on a par when it came<br />
to drain connectivity for waste water (rural: 31.1<br />
per cent; urban: 39.3 per cent), the real difference<br />
lies in the fact that 64.6 per cent rural households,<br />
by and large, did not have any kind of drainage<br />
connectivity whereas only 19 per cent urban<br />
dwellers lacked this facility (Table 7.5).<br />
Rural drinking water<br />
<strong>Karnataka</strong> has been giving high priority to rural<br />
drinking water over the last two decades. While<br />
the national norm stipulates provision of 40 litres<br />
per capita per day (lpcd) of safe drinking water<br />
within 500 metres of the place of residence,<br />
<strong>Karnataka</strong> has set a target of 55 lpcd.<br />
Since the beginning of the 1980s, bore-wells<br />
have been the main basis of water supply<br />
schemes in the state. The policy of the government<br />
is to provide bore-wells with hand pumps to<br />
habitations with a population of less than 500,<br />
mini water supply schemes to habitations with a<br />
population between 500 and 1,000, and piped<br />
water supply schemes to habitations with a<br />
population of more than 1,000. In the last few<br />
years, the groundwater level is being depleted<br />
very quickly in most districts, resulting in a large<br />
number of bore-wells drying up. Strategically,<br />
drilling new bore-wells is now seen to be less<br />
effi cient than deepening existing bore-wells to<br />
improve water yields. Surface water sources<br />
TABLE 7.4<br />
Distribution of households by source of drinking water:<br />
<strong>Karnataka</strong> 2001<br />
(’000s)<br />
Source of water Total Per cent Rural Per cent Urban Per cent<br />
Tap 6025 58.9 3236 48.5 2790 78.4<br />
Hand pump 1750 17.1 1530 22.9 220 6.2<br />
Tube well 876 8.6 609 9.1 267 7.5<br />
Well 1269 12.4 1038 15.6 230 6.5<br />
Tank, pond and lake 111 1.1 101 1.5 10 0.3<br />
River and canal 112 1.1 105 1.6 7 0.2<br />
Spring 31 0.3 28 0.4 2 0.1<br />
Any other 58 0.6 28 0.4 31 0.9<br />
Source: Registrar General of India, Census 2001, Housing Profi le, <strong>Karnataka</strong>.<br />
TABLE 7.5<br />
Number of households with bathroom, latrine and drainage facility:<br />
<strong>Karnataka</strong> 2001<br />
(’000s)<br />
Sl. No. Type of amenities Total % Rural % Urban %<br />
1<br />
2<br />
Total number of<br />
households 10232 6675 3556<br />
No. of households having<br />
bathroom within the<br />
premises 6023 58.9 3208 48.1 2815 79.1<br />
3<br />
Type of latrine within<br />
the premises<br />
A Pit latrine 1368 13.4 632 9.5 736 20.7<br />
B Water closet 1907 18.6 311 4.7 1595 44.9<br />
C Other latrine 561 5.5 217 3.3 343 9.7<br />
With latrine 3836 37.5 1160 17.5 2674 75.3<br />
No latrine 6395 62.5 5513 82.5 881 24.7<br />
Type of drainage<br />
4 connectivity for waste<br />
water outlet<br />
A Closed drainage 1766 17.3 285 4.3 1,481 41.6<br />
B Open drainage 3475 34.0 2076 31.1 1398 39.3<br />
With drainage 5241 51.3 2361 35.4 2879 80.9<br />
No drainage 4989 48.7 4312 64.6 677 19.0<br />
Source: Registrar General of India, Census 2001; Housing Profi le: <strong>Karnataka</strong> – Table H-10.<br />
are also being explored as an alternative to<br />
bore-wells. There has been considerable progress<br />
in the provision of rural drinking water in the<br />
last one and a half decades. Currently, there are<br />
1,90,716 bore-wells, 22,101 mini water supply<br />
161
Housing, Water Supply and Sanitation<br />
TABLE 7.6<br />
Distribution of households by location of drinking water: <strong>Karnataka</strong><br />
and selected states<br />
(’000s)<br />
State Area Total no. of<br />
households<br />
Within<br />
premises<br />
Outside<br />
premises<br />
Away<br />
Total 191964 74803 85112 32048<br />
% 39.0 44.3 16.7<br />
India<br />
Rural 138272 39699 71561 27012<br />
% 28.7 51.8 19.5<br />
Urban 53692 35105 13552 5036<br />
% 65.4 25.2 9.4<br />
Total 10232 3248 4749 2235<br />
% 31.7 46.4 21.8<br />
<strong>Karnataka</strong><br />
Rural 6675 1236 3696 1743<br />
% 18.5 55.4 26.1<br />
Urban 3557 2011 1054 492<br />
% 56.5 29.6 13.8<br />
Total 6595 4720 1085 790<br />
% 71.6 16.5 12.0<br />
Kerala<br />
Rural 4943 3416 860 667<br />
% 69.1 17.4 13.5<br />
Urban 1653 1304 225 123<br />
% 78.9 13.6 7.4<br />
Total 14174 3835 8620 1718<br />
% 27.1 60.8 12.1<br />
Tamil Nadu<br />
Rural 8275 989 6183 1103<br />
% 12.0 74.7 13.3<br />
Urban 5899 2846 2437 615<br />
% 48.2 41.3 10.4<br />
Total 16850 5272 8238 3340<br />
% 31.3 48.9 19.8<br />
Andhra Pradesh<br />
Rural 12676 2883 7016 2777<br />
% 22.7 55.3 21.9<br />
Urban 4174 2388 1222 563<br />
% 57.2 29.3 13.5<br />
Total 19063 10182 6530 2351<br />
% 53.4 34.3 12.3<br />
Maharashtra<br />
Rural 10994 4272 4828 1894<br />
% 38.9 43.9 17.2<br />
Urban 8070 5911 1702 457<br />
% 73.2 21.1 5.7<br />
Total 9644 4488 3689 1466<br />
% 46.5 38.3 15.2<br />
Gujarat<br />
Rural 5886 1724 2939 1223<br />
% 29.3 49.9 20.8<br />
Urban 3758 2764 750 244<br />
% 73.5 20.0 6.5<br />
Source: Registrar General of India, Census 2001, Housing Profi le – Table H-10.<br />
schemes and 17,170 piped water schemes<br />
(Annual <strong>Report</strong> 2004-05: Rural <strong>Development</strong><br />
and Panchayat Raj Department). Accordingly,<br />
the percentage of households with access to<br />
safe drinking water has increased from 67.3<br />
per cent in 1991 to 96.08 per cent in 2001<br />
and to 99.0 per cent in 2004. The water supply<br />
service level in terms of litres per capita per day<br />
(lpcd) has also improved since 1991. There were<br />
20,398 habitations with 40 lpcd and above<br />
in 1991, 38,701 habitations in 1999 and in<br />
2004 as many as 41,115 habitations had water<br />
availability of 40 lpcd and above.<br />
Access<br />
Accessibility of drinking water improved to over 80<br />
per cent in all districts in 2001. In rural <strong>Karnataka</strong>,<br />
18.5 per cent households had access to drinking<br />
water within the premises, as compared with 12.0<br />
per cent in Tamil Nadu, 22.7 per cent in Andhra<br />
Pradesh, 38.9 per cent in Maharashtra and 69.1<br />
per cent in Kerala. Except Kerala, most states,<br />
including <strong>Karnataka</strong>, have been able to provide<br />
drinking water outside the premises (Table 7.6).<br />
However, a high 26.1 per cent of rural households<br />
in the state access drinking water away from their<br />
premises. <strong>Karnataka</strong> is close to Andhra Pradesh’s<br />
21.9 per cent in this respect. There are still some<br />
habitations where drought conditions lead to<br />
water being transported in tankers or by train.<br />
Continuous drought conditions from 2001-02 to<br />
2003-04 led to water being transported to about<br />
500 villages in the state. Almost 48.5 per cent of<br />
rural households access their drinking water from<br />
taps compared with 60.5 per cent in Tamil Nadu.<br />
Rural areas primarily rely on hand pumps and<br />
wells while taps constitute the dominant source in<br />
urban areas (Table 7.7).<br />
Among districts, Udupi (56.0 per cent), Dakshina<br />
Kannada (54.0 per cent) and Uttara Kannada<br />
(42.0 per cent) have the highest percentage of<br />
rural households with access to drinking water<br />
within the premises. Raichur (9.0 per cent),<br />
Gulbarga and Bijapur (10.0 per cent) all in<br />
north <strong>Karnataka</strong> have the lowest percentage of<br />
rural households with access to drinking water<br />
within the premises. Districts with the highest<br />
percentage of rural households with access to<br />
162
<strong>Karnataka</strong> <strong>Human</strong> <strong>Development</strong> <strong>Report</strong> <strong>2005</strong><br />
drinking water away from the premises are<br />
Raichur (43.0), Gulbarga (41.0) and Bijapur<br />
(36.0). Districts with the lowest percentage of<br />
rural households with access to drinking water<br />
away from the premises are Mandya (14.0), and<br />
Dakshina Kannada (15.0). The arid, water-starved<br />
districts of north <strong>Karnataka</strong> have problems of<br />
access and sustainability while the coastal and<br />
malnad districts perform better in terms of access<br />
(Appendix Tables: Series 9).<br />
The data on the distribution of households by<br />
location of drinking water reveals that some<br />
districts are heavily dependant on wells, viz.<br />
Udupi (80.0), Dakshina Kannada (70.0) and<br />
Uttara Kannada (65.0) while Chamarajnagar<br />
(46.0), Bijapur (42.0), and, to a lesser extent,<br />
Tumkur (36.0) are primarily dependant on hand<br />
pumps. The remaining districts derive drinking<br />
water principally from taps (Appendix Tables:<br />
Series 9).<br />
Quality<br />
There are over 21,008 habitations with major<br />
quality issues: excess fl uoride: 5838; brackishness:<br />
4460; nitrate: 4077 and iron: 6633. The water<br />
in these villages is contaminated with fl uoride<br />
(>1.5 mg/litre), total dissolved salts (>1500<br />
mg/litre), nitrate (>100 mg/litre) and/or iron<br />
(1mg/litre). Under the Rajiv Gandhi National<br />
Drinking Water Mission, there is a sub-mission to<br />
deal with the problem of contaminated water. So<br />
far 47 projects have been implemented, covering<br />
628 fl uoride affected habitations. Defl uoridisation<br />
plants have been set up in 200 villages. Individual<br />
household fi lters are also being supplied at a<br />
subsidised cost in fl uoride affected villages.<br />
Ingestion of fl uoride contaminated water causes<br />
fl uorosis which causes staining and pitting of<br />
the teeth and, in more severe cases, skeletal<br />
abnormalities, leading to physical disability and<br />
weakness, a consequent fall in labour productivity<br />
and a decline in income levels.<br />
Sustainability<br />
The sustainability of water supply schemes is<br />
a major concern of the government. Over 95<br />
per cent of rural water supply schemes depend<br />
on ground water sources. Over-exploitation of<br />
TABLE 7.7<br />
Distribution of households by source of drinking water: <strong>Karnataka</strong> and<br />
selected states - 2001<br />
(’000s)<br />
State Area Total Tap Hand<br />
pump<br />
India<br />
<strong>Karnataka</strong><br />
Kerala<br />
Tamil Nadu<br />
Andhra<br />
Pradesh<br />
Maharashtra<br />
Gujarat<br />
Tube<br />
well<br />
Well<br />
Other<br />
Total 191964 70449 68456 10677 34873 7510<br />
% 36.7 35.7 5.6 18.2 3.9<br />
Rural 138272 33584 59737 7930 30733 6287<br />
% 24.3 43.2 5.7 22.2 4.5<br />
Urban 53692 36865 8720 2746 4140 1221<br />
% 68.7 16.2 5.1 7.7 2.3<br />
Total 10232 6025 1750 876 1269 312<br />
% 58.9 17.1 8.6 12.4 3.0<br />
Rural 6675 3236 1530 609 1038 263<br />
% 48.5 22.9 9.1 15.6 3.9<br />
Urban 3557 2790 220 267 231 50.0<br />
% 78.4 6.2 7.5 6.5 1.4<br />
Total 6595 1346 72.0 124 4739 313<br />
% 20.4 1.1 1.9 71.9 4.7<br />
Rural 4943 687 57.0 91.0 3814 293<br />
% 13.9 1.1 1.8 77.2 5.9<br />
Urban 1653 659 16.0 33.0 925 20.0<br />
% 39.9 1.0 2.0 56.0 1.2<br />
Total 14174 8863 2528 735 1505 543<br />
% 62.5 17.8 5.2 10.6 3.8<br />
Rural 8275 5005 1679 374 938 279<br />
% 60.5 20.3 4.5 11.3 3.4<br />
Urban 5899 3858 849 361 567 264<br />
% 65.4 14.4 6.1 9.6 4.5<br />
Total 16850 8106 4399 1000 2779 566<br />
% 48.1 26.1 5.9 16.5 3.4<br />
Rural 12676 5105 3911 727 2478 456<br />
% 40.3 30.9 5.7 19.6 3.6<br />
Urban 4174 3001 488 273 300 111<br />
% 71.9 11.7 6.5 7.2 2.7<br />
Total 19063 12203 2459 554 3390 457<br />
% 64.0 12.9 2.9 17.8 2.4<br />
Rural 10994 5007 2097 418 3129 343<br />
% 45.5 19.1 3.8 28.5 3.1<br />
Urban 8070 7197 362 136 261 113<br />
% 89.2 4.5 1.7 3.2 1.4<br />
Total 9644 6001 1606 494 1128 406<br />
% 62.3 16.7 5.1 11.7 4.2<br />
Rural 5886 2889 1340 296 1075 286<br />
% 49.1 22.8 5.0 18.3 4.9<br />
Urban 3758 3120 266 199 53.0 120<br />
% 83.0 7.1 5.3 1.4 3.2<br />
Source: Registrar General of India, Census 2001, Housing Profi le.<br />
163
Housing, Water Supply and Sanitation<br />
Over-exploitation of<br />
groundwater for irrigation<br />
has led to a progressive<br />
decline in the water table<br />
and drying up of aquifers.<br />
groundwater for irrigation has led to a progressive<br />
decline in the water table and drying up of<br />
aquifers. This has rendered many water supply<br />
schemes non-functional. While efforts are being<br />
made to rejuvenate these schemes by taking<br />
recourse to deepening and hydro fracturing<br />
bore-wells, a more sustainable strategy is the<br />
recharging of groundwater through watershed<br />
development. This strategy has been adopted in<br />
the implementation of the Drought Prone Area<br />
<strong>Development</strong> Programme, Desert <strong>Development</strong><br />
Programme, Integrated Wasteland <strong>Development</strong><br />
Programme, Western Ghat <strong>Development</strong><br />
Programme, etc. This has helped to recharge<br />
groundwater in these areas.<br />
Rural sanitation<br />
Compared to the progress in rural water supply<br />
in <strong>Karnataka</strong>, the progress in rural sanitation has<br />
not been very satisfactory. While there has been a<br />
sustained attempt to improve the provisioning of<br />
safe drinking water since the 1980s, no such parallel<br />
effort or investment was evident in rural sanitation.<br />
It was only in the 1990s that this area became<br />
the focus of policy interventions with the launch<br />
of special schemes to provide toilets and sanitary<br />
facilities in villages, viz. Nirmala Grama and Swasthi<br />
Grama. Another programme, Swachcha Grama,<br />
was launched in 2001 with an integrated focus<br />
aimed at providing fi ve facilities: (i) paving internal<br />
roads and streets in the village; (ii) construction<br />
of effi cient sullage and storm water drainage; (iii)<br />
providing community compost yards and removal of<br />
manure pits from the dwelling areas of the village;<br />
(iv) providing smokeless chulahs for all households;<br />
and (v) construction of household, community and<br />
school latrines in all villages. That these schemes<br />
still have to make an impact is clear from the data<br />
from the 2001 Census. A high 82.5 per cent of<br />
rural households had no latrine in the house but<br />
this is more or less on par with other neighbouring<br />
states except Kerala (18.7 per cent only). The<br />
percentage of rural households with bathrooms is<br />
48.1 per cent, which is higher than Maharashtra<br />
(46.1 per cent), Tamil Nadu (21.0 per cent)<br />
and Andhra Pradesh (27.1 per cent) except Kerala<br />
(56.5 per cent). Admittedly, 64.6 per cent of rural<br />
households had no drainage connectivity for the<br />
wastewater outlet, but this was still better than<br />
Gujarat (86.3 per cent), Kerala (84.0 per cent)<br />
and Tamil Nadu (72.6 per cent) (Table 7.8). Lack<br />
of drainage facilities and toilets results in a highly<br />
unsanitary environment, which is a precursor to<br />
high morbidity rates.<br />
District-wise data reveals that Udupi has the best<br />
coverage of latrines (49.9 per cent) followed by<br />
Kodagu (48.5 per cent), Dakshina Kannada (47.2<br />
per cent) and Bangalore Urban (41.0 per cent). A<br />
high 96.7 per cent of rural households in Bijapur<br />
do not have latrines, followed by Gulbarga (94.9<br />
per cent) and Bagalkot (94.6 per cent) (Appendix<br />
Tables: Series 9).<br />
Urban water supply and<br />
sanitation<br />
Urbanisation<br />
The urban population in <strong>Karnataka</strong> has grown<br />
from 16,40,000 in 1901 to 1,79,10,000 in<br />
2001. The proportion of urban population to total<br />
population of <strong>Karnataka</strong> is 33.98 per cent, higher<br />
than the average for the country, which is 27.78<br />
per cent. The state accounts for 6.28 per cent<br />
of the country’s urban population, lower than<br />
Maharashtra’s 14.37 per cent and Uttar Pradesh’s<br />
12.09 per cent. Among the 27 districts of the<br />
state, Bangalore Urban district has the highest<br />
concentration of urban population, with almost<br />
88.08 per cent of the district population residing<br />
in urban areas. The district accounts for over 32<br />
per cent of the urban population of the state. The<br />
next highest concentration of urban population is<br />
in Dharwad district (4.92 per cent) while Kodagu<br />
district has only 0.42 per cent of urban population,<br />
the lowest among all districts in the state. Haveri<br />
district has seen the highest decadal growth rate<br />
of urban population of 46.69 per cent between<br />
1991 and 2001.<br />
About half of the urban households in <strong>Karnataka</strong><br />
have access to drinking water within the<br />
premises, which is below the national average<br />
of 65.4 per cent. A third of households in<br />
<strong>Karnataka</strong> have access to drinking water outside<br />
the premises which is lower than 41.3 per cent<br />
in Tamil Nadu but higher than Kerala (13.6<br />
per cent), Gujarat (20.0 per cent) and Maharashtra<br />
164
<strong>Karnataka</strong> <strong>Human</strong> <strong>Development</strong> <strong>Report</strong> <strong>2005</strong><br />
(21.1 per cent). In <strong>Karnataka</strong> 13.8 per cent of<br />
households have access to drinking water away<br />
from the premises, which is the highest among<br />
the southern states (Table 7.6). The source-wise<br />
data reveals that taps constitute the major source<br />
of drinking water in urban <strong>Karnataka</strong> (78.4<br />
per cent), which is higher than the national<br />
average of 68.7 per cent. Maharashtra leads<br />
with 89.2 per cent followed by Gujarat (83.0<br />
per cent) (Table 7.7).<br />
Across districts, in Koppal only 27.0 per cent of<br />
households have access to drinking water within<br />
the premises followed by Raichur (33.0 per cent),<br />
Gadag (34.0 per cent), Bagalkot and Bellary<br />
(36.0 per cent). Certain districts such as Mysore<br />
(91.0), Gadag (89.0), Hassan and Bellary (88.0),<br />
Bangalore Urban, Chamarajnagar and Chitradurga<br />
(87.0), Tumkur and Kolar (86.0), perform better<br />
in terms of access to tap water than Bangalore<br />
Rural (80.0). Bidar performs poorly, with only<br />
59.0 per cent except for Udupi, Uttara Kannada<br />
and Dakshina Kannada where well water is the<br />
dominant source of drinking water. In both Bidar<br />
and Dharwad, 4.0 per cent of urban households<br />
depend on other sources like tanks, ponds, lakes,<br />
rivers, canals and springs (Appendix Tables:<br />
Series 9).<br />
Urban local bodies in <strong>Karnataka</strong> comprise<br />
six municipal corporations, 40 City Municipal<br />
Councils (CMCs), 91 Town Municipal Councils<br />
(TMCs) and 82 Town Panchayats. These bodies<br />
are entrusted with the duty of managing<br />
water supply and sanitation in urban areas. A<br />
persistent charge levelled against urban areas<br />
is that they appropriate the lion’s share of the<br />
state’s resources in water supply and sanitation.<br />
Certainly, urban households across the country,<br />
have better access to drinking water and<br />
sanitation facilities than their rural counterparts<br />
(Tables 7.6, 7.7 and Appendix Tables: Series 9).<br />
However, urban water supply and sanitation<br />
has its own constraints and inequities.<br />
Urban water supply<br />
Water is essential to life and a vital natural<br />
resource in economic activities, but lack of access<br />
to adequate, safe drinking water at an affordable<br />
TABLE 7.8<br />
Distribution of households by bathroom, latrine and drainage:<br />
<strong>Karnataka</strong> and selected states<br />
(’000s)<br />
State Area Bathroom within<br />
house<br />
India<br />
<strong>Karnataka</strong><br />
Andhra Pradesh<br />
Tamil Nadu<br />
Kerala<br />
Gujarat<br />
Maharashtra<br />
Latrine within<br />
house<br />
Overall drainage<br />
connectivity<br />
Total 69371 69884 89067<br />
% 36.1 36.4 46.4<br />
Rural 31569 30304 47259<br />
% 22.8 21.9 34.2<br />
Urban 37802 39580 41807<br />
% 70.4 73.7 77.9<br />
Total 6023 3836 5241<br />
% 58.9 37.5 51.3<br />
Rural 3208 1160 2361<br />
% 48.1 17.4 35.4<br />
Urban 2815 2674 2879<br />
% 79.1 75.3 80.9<br />
Total 6709 5559 8686<br />
% 39.8 32.9 51.6<br />
Rural 3434 2300 5252<br />
% 27.1 18.1 41.4<br />
Urban 3275 3258 3434<br />
% 78.5 78.1 82.3<br />
Total 5653 4910 6394<br />
% 39.9 35.1 45.1<br />
Rural 1735 1187 2263<br />
% 21.0 14.4 27.4<br />
Urban 3917 3794 4130<br />
% 66.4 64.3 70.1<br />
Total 4096 5540 1300<br />
% 62.1 84.1 19.7<br />
Rural 2792 4020 790<br />
% 56.5 81.3 16.0<br />
Urban 1304 1520 510<br />
% 78.9 92.1 30.9<br />
Total 4875 4301 3745<br />
% 50.6 44.6 38.8<br />
Rural 1845 1274 803<br />
% 31.4 21.7 13.7<br />
Urban 3029 3026 2942<br />
% 80.6 80.6 78.3<br />
Total 11651 6688 11592<br />
% 61.1 35.1 60.8<br />
Rural 5066 2001 4522<br />
% 46.1 18.2 41.1<br />
Urban 6584 4686 7067<br />
% 81.6 58.1 87.6<br />
Source: Registrar of India, Census 2001: Housing Profi le.<br />
165
Housing, Water Supply and Sanitation<br />
Urban water supply is<br />
inefficiently managed<br />
with massive investments<br />
being wasted. Most of<br />
water squandering takes<br />
place because of the<br />
under-pricing of water.<br />
In addition, excessive<br />
use of water also causes<br />
severe water pollution,<br />
groundwater depletion<br />
and soil degradation.<br />
price has been a problem for most urban local<br />
bodies (ULBs), especially its poorer residents.<br />
Urban water supply is ineffi ciently managed<br />
with massive investments being wasted. Most of<br />
water squandering takes place because of the<br />
under-pricing of water. In addition, excessive<br />
use of water also causes severe water pollution,<br />
groundwater depletion and soil degradation.<br />
Moreover, water is distributed very unevenly (with<br />
the southern parts of <strong>Karnataka</strong> at an advantage<br />
over the relatively drier northern counterparts) 3 in<br />
the state and many villages and towns currently<br />
face critical water shortages that undermine<br />
human health and economic development.<br />
Most ULBs receive water only for a few hours on<br />
alternate days. The reasons include limitations in<br />
source availability, ineffi cient distribution networks,<br />
erratic power supply and poor management<br />
practices. Losses through retail distribution, illegal<br />
connections and public fountains contribute to<br />
a high level of ‘unaccounted for water’ (UFW).<br />
Though accurate data is not available on UFW, the<br />
estimates vary between 30 and 70 per cent for<br />
most ULBs.<br />
Consumption is not metered, except in Bangalore<br />
Urban district, hence volumetric tariffs are not<br />
levied in the state. Since the rationalisation of<br />
tariffs, most ULBs charge a fl at tariff of Rs.45<br />
per household per month. The tariff structure<br />
also prescribes a separate debt-servicing levy,<br />
which is not implemented in practice. Compared<br />
to the O&M expenses of Rs.206 crore incurred<br />
in 2002-03, the revenue realisation from<br />
water tariffs (including connection charges)<br />
was Rs.4,600 lakh (about 22 per cent of O&M<br />
expenses). Additional revenue support is also<br />
available through apportionment of water cess<br />
3<br />
Compared to 84 per cent of towns in south <strong>Karnataka</strong>, 92<br />
per cent of towns in north <strong>Karnataka</strong> suffer from inadequate<br />
water supply (<strong>Report</strong> of High Power Committee for Redressal<br />
of Regional Imbalances, 2002). The inadequacy of source<br />
of water is also more acute in north <strong>Karnataka</strong>, given weak<br />
monsoon activity in the region, especially in summer. Places<br />
like Dharwad, Gulbarga, Bidar and Raichur actually are forced<br />
to rely on containerised supply of water from other places to<br />
meet their needs in summer. Coastal <strong>Karnataka</strong> and the Cauvery<br />
region have adequate sources availability and relatively better<br />
than other parts of the state.<br />
from property tax realisations. This amount was<br />
about Rs.1,000 lakh for 2002-03, resulting<br />
in a net operating defi cit of Rs.15,000 lakh.<br />
This defi cit is met through other revenue<br />
(non-water related) of ULBs like property tax,<br />
SFC devolutions and other grants/loans.<br />
Most ULBs did not/could not supply water in<br />
accordance with design norms as of year-end<br />
2001. Lpcd in individual ULBs vary over a wide<br />
range. Thus, even though the calculated lpcd of<br />
ULBs is high, the actual water availability is low.<br />
Most ULBs have water supply on alternate days<br />
and one or two hours per day.<br />
Piped water is also supplied through public<br />
fountains (PFs) for local communities, typically<br />
comprising the urban poor or where individual<br />
household connections cannot be provided,<br />
either for economic reasons or due to physical<br />
constraints. There are an estimated 73,000 public<br />
fountains in <strong>Karnataka</strong> (excluding Bangalore).<br />
Water supply through public fountains is erratic<br />
and is also contingent on availability of power.<br />
Typically, water is supplied two or three times<br />
a week for only a few hours. Water losses from<br />
PFs are high due to improper water management<br />
practices and faulty (leaking) taps and pipes. PFs<br />
have also become a source for unauthorised access<br />
to water for vendors, who exploit the potential for<br />
commercial gains from sale of such water.<br />
Urban sanitation<br />
Nearly 80 per cent of urban households in<br />
<strong>Karnataka</strong> have bathrooms within the premises,<br />
which is above the national average of 70.4<br />
per cent. Over 75 per cent of urban households<br />
have latrines within the premises in <strong>Karnataka</strong><br />
compared with 92.1 per cent in Kerala and 78.1<br />
per cent in Andhra Pradesh. In <strong>Karnataka</strong> overall<br />
drainage connectivity (80.9 per cent) is better than<br />
the national average of 77.9 per cent. A high 91.1<br />
per cent of households in Bangalore Urban district<br />
have latrines while 66.5 per cent of households in<br />
Gadag lack this facility (Appendix Tables: Series 9).<br />
Among the four mahanagara palikas in <strong>Karnataka</strong>,<br />
Bangalore city has the maximum households with<br />
latrines (91.1 per cent) followed by Mysore with<br />
89.7 per cent and Gulbarga has the least with<br />
166
<strong>Karnataka</strong> <strong>Human</strong> <strong>Development</strong> <strong>Report</strong> <strong>2005</strong><br />
57.2 per cent. By and large, the towns of north<br />
<strong>Karnataka</strong> have inadequate latrine facilities.<br />
Water supply and sanitation in urban<br />
slums<br />
Urban slums have high concentrations of poor<br />
people living in very basic conditions in the middle<br />
of affl uence. Table 7.9 gives the distribution of<br />
the main source of drinking water supply in<br />
notifi ed and non-notifi ed slums in <strong>Karnataka</strong>, in<br />
comparison with the all-India average.<br />
As this table indicates, <strong>Karnataka</strong>’s performance<br />
is better than the national average in terms of<br />
access to water from a relatively effi cient source<br />
namely taps. Further, only 28 per cent slums in<br />
<strong>Karnataka</strong> are water-logged during monsoon<br />
(in both notifi ed and non-notifi ed slums) as<br />
compared to the national average of 36 per<br />
cent for notifi ed slums and 54 per cent for nonnotifi<br />
ed slums. This, again, shows that <strong>Karnataka</strong><br />
performs better than the national average in<br />
terms of drainage facilities. However, 66 per cent<br />
of notifi ed slums in <strong>Karnataka</strong> have no latrines as<br />
against the national average of 17 per cent. The<br />
gap for non-notifi ed slums between <strong>Karnataka</strong><br />
and the national average appears to be less with<br />
<strong>Karnataka</strong> recording 53 per cent against the<br />
Indian average of 51 per cent. Similarly, only<br />
23 per cent of notifi ed slums in <strong>Karnataka</strong> have<br />
under ground drainage (UGD) facilities as against<br />
the national average of 30 per cent. However, 24<br />
per cent of non-notifi ed slums in <strong>Karnataka</strong> have<br />
UGD coverage as against the national average of<br />
15 per cent.<br />
Financing water and sanitation<br />
The plan and non-plan allocation by the government<br />
for water and sanitation 4 as a ratio of the state’s<br />
GDP is presented in Table 7.10.<br />
Financing patterns prescribed for category of urban<br />
local bodies (ULBs) comprise contributions from<br />
Government of <strong>Karnataka</strong>, ULBs and loans from<br />
funding agencies. Since the government guarantees<br />
the loans, loan service obligations are met out of<br />
4<br />
Includes allocation towards rural sector.<br />
TABLE 7.9<br />
Distribution of main source of drinking water in urban slums<br />
(Per cent)<br />
Notified slums<br />
Non-notified slums<br />
Tap Tube well Well Others Tap Tube well Well Others<br />
<strong>Karnataka</strong> 89 11 0 0 77 16 0 8<br />
All-India 84 10 2 0 71 22 2 5<br />
Source: NSS 58th round on ‘Conditions of Urban Slums – 2002’ Government of India, December 2003.<br />
funds released by government out of SFC grants.<br />
The low allocation to the urban sector and lack of<br />
timely availability of funds have partly contributed<br />
to the sub-optimal service delivery of water and<br />
sanitation services. The rural sector is slightly better<br />
served in terms of fund fl ows. The <strong>Karnataka</strong> Urban<br />
Water Supply and Drainage Board (KUWSDB)<br />
estimates that Rs.4,79,699 lakh (approximately<br />
US$ 1 billion) is required to enable ULBs to conform<br />
to minimum design standards. In sum, <strong>Karnataka</strong><br />
has done well in the rural sector as far as drinking<br />
water supply is concerned, but there are challenges<br />
in the path to reaching accepted norms across all<br />
districts. The biggest challenges are in the urban<br />
sector, where complex issues of tariffs have to be<br />
faced.<br />
Year<br />
The low allocation to the<br />
urban sector and lack<br />
of timely availability<br />
of funds have partly<br />
contributed to the suboptimal<br />
service delivery<br />
of water and sanitation<br />
services. The rural sector<br />
is slightly better served in<br />
terms of fund flows.<br />
TABLE 7.10<br />
Plan and non-plan allocation of funds for water sector<br />
Plan<br />
allocation*<br />
Non-plan<br />
allocation*<br />
Net State Domestic<br />
Product (SDP) #<br />
(Rs. lakh)<br />
Percentage of total<br />
allocation to SDP<br />
1996-97 23800 1600 4473655 0.56<br />
1997-98 30200 1400 4751682 0.66<br />
1998-99 26600 1600 5396093 0.52<br />
1999-2000 34600 1500 5654327 0.63<br />
2000-01 28200 600 6258100 0.46<br />
2001-02 28300 (RE) 793 (RE) 6298200 0.46<br />
2002-03 24100 (BE) 658 (BE) 6741800 0.37<br />
Sources:<br />
1. *: Finance Department, <strong>Karnataka</strong>.<br />
2. # Directorate of Economics and Statistics, <strong>Karnataka</strong>.<br />
Notes:<br />
RE: Revised Estimate.<br />
BE: Budget Estimate.<br />
QE: Quick Estimate.<br />
167
Housing, Water Supply and Sanitation<br />
Subsidies to drinking<br />
water end up favouring<br />
the rich disproportionably,<br />
since they have more<br />
ready access to public<br />
water supplies.<br />
Tariff setting: efficiency in governance<br />
The State Urban Drinking Water and Sanitation<br />
Sector Policy states ‘The longer term objective is to<br />
establish an appropriate cost recovery mechanism<br />
through adequate tariff to ensure that revenues<br />
cover operations and maintenance costs, debt<br />
service plus a reasonable return on capital…<br />
Tariff will be structured in a manner such as to<br />
disincentives excessive consumption and wastage<br />
of water, whilst ensuring at least a minimum “life<br />
line” supply to the poor.’<br />
There are typically two principal forms of water<br />
subsidisation — grants and low-interest loans<br />
— both found in <strong>Karnataka</strong>. With the estimated<br />
investments for the sector very likely to grow,<br />
since the unit costs of new water supplies will<br />
double, and in some cases, even triple, compared<br />
with the present systems, even before including<br />
environmental costs, there is an urgent need to<br />
effi ciently manage the fi nances. This is particularly<br />
critical as the real cost of water may soon be out<br />
of reach for the economically weaker sections.<br />
The initiatives in this regard include savings<br />
from regularising illegal connections, savings<br />
from improved effi ciencies, contributions from<br />
the users and higher charges, wherever feasible.<br />
Many believe that water subsidies are necessary<br />
for social purposes, in particular to support the<br />
poor. In fact, subsidies to drinking water end up<br />
favouring the rich disproportionably, since they<br />
have more ready access to public water supplies.<br />
The evidence reveals a vicious circle: when<br />
services are heavily subsidised, their quality is<br />
low and service expansion relatively slow because<br />
of lack of resources and their ineffi cient use. The<br />
consequences are that the rich benefi t while the<br />
poor still have relatively high water expenses.<br />
At the same time, the health of the poor suffers<br />
because of ineffi cient water services. Current<br />
subsidies do not always reach the target groups<br />
and require to be restructured.<br />
It could be inferred that low water prices generally<br />
do not benefi t the poor. However, this does not<br />
necessarily imply that water subsidies are bad<br />
and should always be avoided. Instead, they must<br />
target the (fi nancing) needs of the poor more<br />
cost-effectively. Governments may, for instance,<br />
choose to provide subsidies for micro-credit in<br />
order to ensure income access, or issue subsidised<br />
water stamps for the poor or apply ‘life line’<br />
water pricing (a low rate for a basic service level<br />
and an increasing rate above). When carefully<br />
implemented and targeted, such a reform of<br />
water subsidies may very well improve the lot of<br />
the poor.<br />
Proper water policies and action plans are<br />
needed to adequately address current and future<br />
problems of water misuse, increasing scarcity and<br />
pollution. It points to the need for demand-driven<br />
water policies to complement the traditional<br />
supply-oriented approach, to reallocate existing<br />
water supplies, to encourage a more effi cient use<br />
and to ensure an equitable access. A key priority<br />
is reallocation between various users. Reforms<br />
of current pricing and incentive measures,<br />
institutional changes, technical improvements<br />
and education and information are all needed<br />
to promote most sustainable forms of water<br />
development and use.<br />
168
Gender and <strong>Human</strong> <strong>Development</strong>
CHAPTER 8<br />
Gender and <strong>Human</strong> <strong>Development</strong><br />
Introduction<br />
The 1999 <strong>Karnataka</strong> <strong>Human</strong> <strong>Development</strong><br />
<strong>Report</strong> provided a range of data and analysis<br />
documenting widespread discrimination against<br />
girls and women in economic, political as well<br />
as social life. It pointed out that public policies<br />
to change this situation had not been completely<br />
effective because women had been viewed<br />
primarily as homemakers, rather than as full and<br />
equal citizens in a just society.<br />
This chapter examines the extent to which there<br />
has been a change in perspective in the intervening<br />
years between the fi rst and second <strong>Report</strong>s.<br />
Has a new and more unifi ed vision emerged,<br />
that acknowledges women as empowered and<br />
autonomous agents of social and human progress?<br />
To what extent have the government’s policies<br />
and programmes drawn from such a vision? How<br />
effective have they been in empowering women<br />
and transforming gender relations? How has<br />
women’s position in the economy and in politics<br />
changed? What insights does our analysis provide<br />
for the steps to be taken from here on?<br />
In looking at human development from a gendered<br />
perspective, three questions will be addressed<br />
initially: (i) In what ways is human development<br />
linked to gender discrimination in particular? (ii) Is<br />
poverty congruent with poor human development<br />
for women? (iii) How do we understand the<br />
concept of ‘empowerment’?<br />
may not always be matched by a correspondingly<br />
high GDI ranking. However, low performance<br />
on gender indicators almost always goes<br />
hand-in-hand with poor human development<br />
indicators overall. Unequal gender relations,<br />
exacerbated by disparities of income and caste, can<br />
contribute signifi cantly to a lowering of the overall<br />
HDI, simply because women constitute almost half<br />
the population. Systemic gender biases mean that,<br />
where human development is poor, the burdens fall<br />
disproportionately on women. When government<br />
and other programmes for improving schooling,<br />
nutrition, health or a range of other services such<br />
as safe drinking water, sanitation, housing, do not<br />
reach people effectively, this lack of reach affects<br />
women and girls most adversely. Latent gender<br />
biases within families, communities and service<br />
providers themselves mean that women, who are<br />
most in need of public services, are often excluded<br />
from their purview. In <strong>Karnataka</strong>, as in many<br />
states, gender disparities are also linked to regional<br />
disparities in human development.<br />
BOX 8.1<br />
What is gender analysis?<br />
‘Sex’ identifi es the biological differences between women and men. ‘Gender’ is the culturally<br />
specifi c set of characteristics that identifi es the social behaviour of women and men and the<br />
relationship between them. Gender, therefore, refers not simply to women or men, but to the<br />
relationship between them, and the way it is socially constructed. Because it is a relational term,<br />
gender must include women and men. Like the concepts of class, race and ethnicity, gender is an<br />
analytical tool for understanding social processes.<br />
Gender as a lens for human<br />
development<br />
The place of gender analysis in policies and<br />
programmes that are intended to balance the<br />
pressures for economic growth with the needs of<br />
human development has been recognised, almost<br />
from the inception of the U.N. <strong>Human</strong> <strong>Development</strong><br />
<strong>Report</strong>s. The development of specifi c indices such<br />
as the gender development index (GDI) and the<br />
gender empowerment measure (GEM) mark this<br />
recognition. It is well known that a high HDI ranking<br />
Gender analysis is a process that assesses the differential impact of proposed and/or existing<br />
policies, programmes and legislation on women and men. It makes it possible for policy to<br />
be undertaken with an appreciation of gender differences, of the nature of relationships<br />
between women and men and of their different social realities, life expectations and economic<br />
circumstances. It is a tool for understanding social processes and for responding with informed<br />
and equitable options.<br />
It compares how and why women and men are affected by policy issues. Gender analysis<br />
challenges the assumption that everyone is affected by policies, programmes and legislation in<br />
the same way regardless of gender, a notion often referred to as ‘gender-neutral policy’.<br />
Source: Status of Women, Canada.<br />
171
Gender and <strong>Human</strong> <strong>Development</strong><br />
Despite the strong<br />
correlation between poor<br />
human development<br />
indicators and gender<br />
disparity, there are<br />
other kinds of gender<br />
discrimination, which,<br />
perversely, are worse in<br />
places where traditional<br />
human development<br />
indicators are good.<br />
Nowhere is this more<br />
apparent than in the<br />
aversion to daughters,<br />
known otherwise as ‘son<br />
preference’.<br />
Table 8.1 reveals the sharp distinctions among the<br />
districts and the regions of the state overall. While<br />
the districts of south <strong>Karnataka</strong> are generally at<br />
the top of the composite index (with the exception<br />
of Davangere), followed by the districts of Bombay<br />
<strong>Karnataka</strong>, the districts of Hyderabad <strong>Karnataka</strong><br />
are near the bottom of the composite index. These<br />
district-and region-wise indicators are forerunners<br />
of a scenario that is played out along a range of<br />
other dimensions having to do with work and<br />
income as well. 1<br />
Is gender congruent with poverty?<br />
Despite the strong correlation between poor human<br />
development indicators and gender disparity,<br />
there are other kinds of gender discrimination,<br />
which, perversely, are worse in places where<br />
traditional human development indicators are<br />
good. Nowhere is this more apparent than in the<br />
aversion to daughters, known otherwise as ‘son<br />
preference’. The intensity of such forms of gender<br />
discrimination, as evidenced by worsening sex<br />
ratios, oddly enough, is not correlated with poor<br />
human development indicators. Violence against<br />
women is not always associated with regions of low<br />
economic growth and poor human development<br />
indicators. These phenomena suggest that gender<br />
violence is assuming new forms as the economy<br />
grows. An improvement in human development,<br />
which does not always mean a commensurate<br />
improvement in all forms of gender equity, can<br />
scarcely be regarded as a process that truly<br />
enlarges people’s choices.<br />
Empowerment<br />
‘Empowerment’ has emerged as a key concept in<br />
policy discussions on gender over the last decade<br />
and a half. The concept, in recent times, has<br />
become so elastic that it has lost the dimensions,<br />
1<br />
An important caveat at the start of this discussion is the major<br />
changes in the delineation of district boundaries. In 1989,<br />
Bangalore Rural district was split from Bangalore. In 1997,<br />
Bagalkot district was split from Bijapur, Chamarajnagar district<br />
from Mysore, Gadag district from Dharwad, Haveri district from<br />
Dharwad, Koppal district from Raichur, Udupi district from<br />
Dakshina Kannada; and Davangere district was created from<br />
parts of Bellary, Chitradurga and Shimoga. This carving out of<br />
new districts has meant that our analysis of changes over time<br />
has been limited to using those sources that provide comparable<br />
district-wise fi gures.<br />
which originally gave it strength and shape.<br />
Empowerment, conceptually, has certain key<br />
components: (i) it radically shifted from the old<br />
top–down ‘welfare’ approach of treating women<br />
as a disadvantaged group in need of handouts,<br />
towards a recognition of the structural roots of<br />
gender bias; (ii) it addressed the issue of power<br />
and powerlessness that goes with gender and<br />
other forms of inequality; (iii) most signifi cant is<br />
the recognition that a change in power relations<br />
requires not only a change in control over external<br />
resources such as land and income but also a<br />
change in the person’s sense of self-worth and<br />
confi dence; (iv) it emphasised the importance of<br />
group processes and solidarity as a way of breaking<br />
the cycle of hopelessness and helplessness that<br />
unequal gender relations perpetuate.<br />
As has happened with many other concepts,<br />
‘empowerment’ has been so overused and<br />
misused that it has lost its core meaning. One<br />
often fi nds a programme being described as a<br />
programme for women’s empowerment without<br />
any clarity as to how it will actually change<br />
existing power relations. Rescuing the concept of<br />
empowerment so that it can have more analytical<br />
content for policies requires us to examine<br />
whether there has, in actual fact, been a change in<br />
mindsets, i.e. a paradigm shift away from the old<br />
‘welfare’ approach and whether there has been a<br />
corresponding change in policies and institutions<br />
supported by a key ingredient of systemic change,<br />
namely investment or is it ‘business as usual’, with<br />
some tinkering? Some of these issues (fi nancing<br />
and gender audit) are addressed in chapter 3,<br />
Part III.<br />
<strong>Human</strong> development: Gender<br />
dimensions and differentials<br />
For any patriarchal society to move towards<br />
greater gender equality, as part of a process of<br />
human development, requires change at many<br />
levels – in values and norms, in structures and<br />
institutions, and in behaviour and practices. This<br />
can happen if women are empowered in economic,<br />
political and socio-cultural terms. They need more<br />
access to resources, greater political voice and<br />
social transformations that lead to their exercising<br />
greater agency and autonomy in the decisions<br />
172
Sl.<br />
No.<br />
Districts<br />
Female<br />
literacy<br />
TABLE 8.1<br />
District-wise selected key indicators of <strong>Karnataka</strong><br />
Girls<br />
married<br />
< 18 yrs.<br />
Current<br />
users of FP<br />
method<br />
Birth order<br />
3 & above<br />
Safe<br />
delivery<br />
Complete<br />
immunisation<br />
<strong>Karnataka</strong> <strong>Human</strong> <strong>Development</strong> <strong>Report</strong> <strong>2005</strong><br />
Decadal<br />
growth<br />
rate of<br />
population<br />
Composite<br />
index<br />
(Per cent)<br />
Regions<br />
I Districts with good performance<br />
1 Hassan 59.0 15.20 75.10 19.70 69.70 92.80 9.66 81.55 Malnad (SK)<br />
2 Shimoga 66.9 16.50 69.30 22.80 83.00 92.90 12.90 80.37 Malnad (SK)<br />
3 Kodagu 72.3 22.00 70.60 18.80 79.40 94.80 11.64 80.06 Malnad (SK)<br />
4 Dakshina Kannada 77.2 4.50 63.70 32.00 91.50 86.00 14.51 78.77 Coastal (SK)<br />
5 Uttara Kannada 68.5 15.00 66.00 27.20 86.10 89.90 10.90 76.11 Coastal (BK)<br />
6 Udupi 75.2 4.50 63.70 32.00 91.50 86.00 6.88 75.97 Coastal (SK)<br />
II Districts with average performance<br />
7 Mandya 51.5 37.00 71.70 26.10 61.90 88.00 7.14 75.86 SK<br />
8 Mysore 55.8 47.90 65.40 23.90 69.70 92.70 15.04 75.70 SK<br />
9 Bangalore Rural 55.0 21.05 63.00 16.40 79.10 83.70 34.80 75.34 SK<br />
10 Bangalore Urban 77.5 37.00 60.10 26.10 90.60 77.00 34.80 75.19 SK<br />
11 Chitradurga 53.8 30.05 59.90 34.40 53.80 88.40 15.05 73.98 SK<br />
12 Tumkur 56.9 27.10 61.30 27.30 63.50 88.00 11.87 73.97 SK<br />
13 Dharwad 61.9 36.50 61.20 37.40 65.30 74.80 16.65 73.03 BK<br />
14 Chamarajnagar 42.5 47.90 65.40 23.90 69.70 92.70 9.16 72.18 SK<br />
15 Chikmaglur 64.0 37.00 71.40 26.10 78.00 83.50 11.98 72.13 Malnad (SK)<br />
16 Kolar 52.2 33.50 57.10 29.70 59.20 90.60 13.83 71.92 SK<br />
17 Gadag 52.5 36.50 61.20 37.40 65.30 74.80 13.14 69.72 BK<br />
18 Belgaum 52.3 55.80 61.80 36.70 68.60 64.80 17.40 68.75 BK<br />
19 Haveri 57.4 36.50 61.20 37.40 65.30 74.80 13.29 65.66 BK<br />
III Districts with poor performance<br />
20 Bellary 45.3 44.20 50.40 48.60 54.00 52.60 22.30 65.54 HK<br />
21 Davangere 58.0 35.50 59.90 34.40 53.80 53.80 14.78 65.43 SK<br />
22 Bijapur 43.5 64.80 47.10 43.00 50.10 53.20 17.63 62.86 BK<br />
23 Bidar 48.8 67.60 50.60 52.90 52.50 50.30 19.56 60.55 HK<br />
24 Raichur 35.9 57.10 45.40 52.80 48.00 37.20 21.93 58.34 HK<br />
25 Gulbarga 37.9 47.70 39.20 53.70 47.70 25.30 21.02 58.31 HK<br />
26 Bagalkot 43.6 64.80 47.10 43.00 50.10 53.20 18.84 54.71 BK<br />
27 Koppal 39.6 57.10 45.40 52.80 48.00 37.20 24.57 53.09 HK<br />
Note: BK: Bombay <strong>Karnataka</strong>; HK: Hyderabad <strong>Karnataka</strong>; and SK: South <strong>Karnataka</strong>.<br />
Sources:<br />
1. <strong>Karnataka</strong> State Integrated Health Policy, page 10.<br />
2. Registrar General of India, Census 2001.<br />
3. National Commission on Population: District-wise indicators, Table 12 (b).<br />
173
Gender and <strong>Human</strong> <strong>Development</strong><br />
BOX 8.2<br />
What is empowerment?<br />
The question is both complex and complicated. Women members of self-help groups fi nanced<br />
under two government programmes gave a variety of answers to this question. They offer several<br />
defi nitions all of which may justifi ably be described as facets of a process of empowerment. In<br />
the context of the SHG programme, and in the larger context of poverty, women put the ability<br />
to improve their economic status on top followed by an improvement in their status in their<br />
families in terms of both greater respect and, more concretely, enhanced participation in family<br />
decision-making. If gender justice comes low on the priority list then clearly the programme<br />
must do more by way of conscientisation.<br />
Issues<br />
Percentage<br />
Ability to borrow and repay 86.5<br />
Increase in income 83.0<br />
Enhanced status in family 74.9<br />
Greater role in family decisions 63.0<br />
Equality with men 58.4<br />
Larger role in village/community matters 44.0<br />
Source: SHG Survey, Directorate of Economics and Statistics, <strong>Karnataka</strong>, 2004B.<br />
The role of the state<br />
lies in preventing harm<br />
and protecting girls<br />
and women on the one<br />
hand, and promoting<br />
women’s empowerment,<br />
gender equality and male<br />
transformation on the<br />
other.<br />
that affect their own lives and society in general.<br />
However, focusing on women alone cannot make<br />
such changes happen. Such transformations in<br />
consciousness take time and require open public<br />
debate and discussion, and efforts through the<br />
educational system, and through communications<br />
and the media. Men must change their entrenched<br />
patriarchal discourse in favour of one that is<br />
inclusive and gender-friendly.<br />
The role of the state lies in preventing harm and<br />
protecting girls and women on the one hand,<br />
and promoting women’s empowerment, gender<br />
equality and male transformation on the other. In<br />
order to play this role effectively, the state must<br />
do at least four things: support changes in social<br />
norms and practices; promote key legal/political<br />
changes; create strong institutions at multiple<br />
levels from the village to the highest levels; and<br />
provide resources and make investments. How the<br />
state brings about changes in gender relations,<br />
and with what strategic vision during a period of<br />
signifi cant socio-economic change brought on by<br />
economic liberalisation, will provide the touchstone<br />
for whether any real movement towards gender<br />
equality will occur in the coming decade.<br />
The following sections analyse some of the<br />
macro-trends in the available data on key elements<br />
of gender dimensions and differentials in order to<br />
explicate critical changes in the environment for<br />
state action. Of the three elements that constitute<br />
the <strong>Human</strong> <strong>Development</strong> Index, education and<br />
healthcare and the ways they impact gender are<br />
explored in chapters 5 and 6 respectively, hence,<br />
this chapter will analyse the third component,<br />
work and income. To this, two additional sets of<br />
indicators have been added – the sex ratio, and<br />
women’s autonomy. The focus is on highlighting<br />
differentials wherever possible, in order to point<br />
to the varying life experiences of women and<br />
men, and the skewed life chances that young girls<br />
face.<br />
Work participation and worker<br />
distribution: Feminisation of poverty<br />
Work participation provides key insights into the<br />
core issues of women’s economic dependence and<br />
their ability to control incomes and expenditures,<br />
exercise some degree of personal autonomy and<br />
share in decision-making.<br />
While examining the work participation data from<br />
1991 to 2001 it must be borne in mind that the<br />
1990s were a period of signifi cant growth in new<br />
industries in <strong>Karnataka</strong>, fuelled by, but not limited<br />
to, the boom in the information technology sector.<br />
The assumption is that work participation, the<br />
share of workers who are main workers, and the<br />
number, which is not dependent on agriculture,<br />
would increase during the period.<br />
Table 8.2 shows that except Kerala, the work<br />
participation rates (WPR) for both men and<br />
women in <strong>Karnataka</strong> were similar to the other<br />
southern states in 2001. There was only a small<br />
increase (2.5 percentage points) over 1991 in<br />
WPR for women and men.<br />
Table 8.3 reveals that WPR for men increased<br />
by 4.7 per cent while for women it went up by<br />
8.8 per cent. This increase in WPR was not evenly<br />
distributed. Barring Davangere and Chikmaglur<br />
that showed negative rates of change for women,<br />
the remaining districts of south <strong>Karnataka</strong> saw<br />
signifi cant increases in female WPR.<br />
174
<strong>Karnataka</strong> <strong>Human</strong> <strong>Development</strong> <strong>Report</strong> <strong>2005</strong><br />
TABLE 8.2<br />
Work participation rates: Southern states and India<br />
(Per cent)<br />
Year State Working population rates Main workers Marginal workers<br />
Male Female Male Female Male Female<br />
India 51.68 25.63 87.32 57.27 12.68 42.73<br />
<strong>Karnataka</strong> 56.09 31.09 91.21 65.88 8.79 34.12<br />
2001 Tamil Nadu 57.64 31.54 90.07 76.24 9.93 23.76<br />
Kerala 50.20 15.38 83.20 70.54 16.80 29.46<br />
Andhra Pradesh 56.23 35.11 89.81 72.44 10.19 27.56<br />
1991 <strong>Karnataka</strong> 54.01 29.04 98.96 77.35 1.04 22.65<br />
Percentage point difference<br />
between 2001 and 1991 for<br />
<strong>Karnataka</strong><br />
2.55 2.59 -7.75 -11.47 7.75 11.47<br />
Source: Registrar General of India, Census 2001, Primary Census Abstract: T 00-007: Distribution of Population: workers and nonworkers<br />
by sex and T 00-008: number of total workers, main and marginal workers by sex.<br />
Male-female differences in WPR continued<br />
with only a marginal change in the differential.<br />
What is interesting is that the male WPRs are<br />
less widely dispersed across the districts than<br />
the corresponding female rates. For example,<br />
Bombay <strong>Karnataka</strong>, with an average increase<br />
for women of 6.4 per cent, included both<br />
-10.7 per cent for Bijapur and +14.4 per cent<br />
for Dharwad. It is clear that the rates of change<br />
in WPR for women are much more widely<br />
dispersed across the districts and regions. This<br />
probably points to greater volatility in both<br />
the demand and supply of female labour, as<br />
also their marginal character. If women’s work<br />
participation is more marginal, then the rates are<br />
likely to be more variable over time and across<br />
space as well.<br />
Turning to the distribution between main and<br />
marginal workers, Table 8.4 shows that <strong>Karnataka</strong><br />
in 2001 had the highest percentage of marginal<br />
workers among women (34.12 per cent), and the<br />
lowest percentage of marginal workers among<br />
men (8.79 per cent) in the four southern states.<br />
Between 1991 and 2001, the share of main<br />
workers has declined for both men and women<br />
and while the share of marginal workers has<br />
gone up for men (by 7.75 percentage points);<br />
the increase is even more signifi cant for women<br />
(11.47 percentage points).<br />
However, while the percentage for men is still<br />
under 10 per cent of the total, the percentage for<br />
women has increased from less than one-fourth<br />
to over one-third. The percentage point increases<br />
are also much higher for women. Most striking<br />
is the fact that in the districts of Hyderabad<br />
<strong>Karnataka</strong>, the share of marginal workers among<br />
women went from 14 per cent to an astonishing<br />
39 per cent. Bombay <strong>Karnataka</strong> districts also saw<br />
a signifi cant increase in the proportion of marginal<br />
workers among women.<br />
Analysing the data on work participation along<br />
with the fi ndings on main versus marginal<br />
workers presents a disturbing picture of the<br />
geographical context of female poverty. Work<br />
participation rates either fell or were stagnant<br />
in the Hyderabad <strong>Karnataka</strong> region and saw<br />
modest increases in the Bombay <strong>Karnataka</strong><br />
region. The share of marginal workers (male<br />
and female) has also shown the most dramatic<br />
increase in Hyderabad <strong>Karnataka</strong>, followed by<br />
Bombay <strong>Karnataka</strong>. And the outcomes of this<br />
development are much worse for women. An<br />
examination of the data on the distribution of<br />
workers by category further substantiates this<br />
downward trend for women and work.<br />
Table 8.5 shows that the distribution of workers<br />
among cultivators, agricultural labourers,<br />
Between 1991 and 2001,<br />
the share of main workers<br />
has declined for both men<br />
and women and while the<br />
share of marginal workers<br />
has gone up for men (by<br />
7.75 percentage points);<br />
the increase is even more<br />
significant for women<br />
(11.47 percentage points).<br />
175
Gender and <strong>Human</strong> <strong>Development</strong><br />
TABLE 8.3<br />
Working population: Districts<br />
(Per cent)<br />
Region 1991 2001 Percentage<br />
change<br />
District Male Female Male Female Male Female<br />
Bangalore Rural 56.1 29.2 59.6 34.7 6.2 18.8<br />
Bangalore Urban 53.3 13.2 58 18.7 8.8 41.7<br />
Chitradurga 54.4 34.6 57 37.7 4.8 9.0<br />
Davangere 54.0 30.2 56.7 30.1 5.0 -0.3<br />
Kolar 55.0 31.4 58.1 39.0 5.6 24.2<br />
Shimoga 55.1 24.4 58.7 28.0 6.5 14.8<br />
Tumkur 56.9 38.1 60.2 41.3 5.8 8.4<br />
South<br />
<strong>Karnataka</strong><br />
Chamarajnagar 59.7 27.3 61.4 31.1 2.8 13.9<br />
Chikmaglur 57.5 32.1 59.4 30.9 3.3 -3.7<br />
Dakshina Kannada 53.1 37.6 58.2 41.7 9.6 10.9<br />
Hassan 56.1 32.4 60.8 39.7 8.4 22.5<br />
Kodagu 58.7 35.3 60.9 36.2 3.7 2.5<br />
Mandya 57.5 31.0 61.2 33.9 6.4 9.4<br />
Mysore 55.9 20.8 58.2 25.3 4.1 21.6<br />
Udupi 49.4 31.3 55.1 33.9 11.5 8.3<br />
South <strong>Karnataka</strong> 55.1 27.6 58.7 31.4 6.5 13.8<br />
Bagalkot 52.0 32.2 53.7 33.3 3.3 3.4<br />
Belgaum 54.4 29.7 55.9 32.7 2.8 10.1<br />
Bijapur 49.9 31.9 50.5 28.5 1.2 -10.7<br />
Bombay<br />
<strong>Karnataka</strong><br />
Dharwad 52.2 25.0 56.0 28.6 7.3 14.4<br />
Gadag 53.1 36.3 56.2 37.7 5.8 3.9<br />
Haveri 55.0 31.6 58.2 33.7 5.8 6.6<br />
Uttara Kannada 53.3 23.7 57.6 27.8 8.1 17.3<br />
Bombay <strong>Karnataka</strong> 53.1 29.8 55.3 31.7 4.1 6.4<br />
Bellary 53.6 35.5 54.6 35.9 1.9 1.1<br />
Bidar 48.8 30.5 47.5 26.2 -2.7 -14.1<br />
Hyderabad<br />
<strong>Karnataka</strong><br />
Gulbarga 51.2 34.6 51.1 34.9 -0.2 0.9<br />
Koppal 54.1 38.5 53.7 38.9 -0.7 1.0<br />
Raichur 53.3 32.6 52.9 34.7 -0.8 6.4<br />
Hyderabad <strong>Karnataka</strong> 52.1 34.5 51.9 34.2 -0.4 -0.9<br />
<strong>Karnataka</strong> 54.01 29.04 56.09 31.09 4.7 8.8<br />
Source: Registrar General of India, Census 1991 and 2001.<br />
household industry and other workers in<br />
<strong>Karnataka</strong> is nearer the all-India average than the<br />
other southern states. However, a closer analysis<br />
of the data on the distribution of workers by<br />
category reveals even more disturbing trends for<br />
women’s work. Between 1991 and 2001, while<br />
male dependence on agricultural work, either as<br />
cultivators or as labourers, declined sharply from<br />
58 to 49 per cent, their share of the category ‘other<br />
workers’ which includes work in industry and the<br />
service sectors went up from 40 to 48 per cent.<br />
The scenario has been reversed for women. True,<br />
their presence in the agriculture sector is much<br />
more visible: the percentage of women cultivators<br />
went up by 4.82 per cent but, unfortunately,<br />
the percentage of women agricultural labourers<br />
also showed an upward trend by 5.02 per cent.<br />
Women’s share in the category ‘other workers’<br />
fell precipitously by 14.9 per cent. However,<br />
their share in household industry registered an<br />
increase.<br />
The district and region-wise picture for the<br />
distribution of workers across categories is<br />
presented in Table 8.6. Female dependence on<br />
agriculture is higher than male, across all districts<br />
and it is particularly high in north <strong>Karnataka</strong>.<br />
The maximum number of female household<br />
industry workers is found in two districts,<br />
Dakshina Kannada (46.15 per cent) and Udupi<br />
(26.12 per cent) primarily due to beedi and<br />
agarbathi that are home-based activities.<br />
Although the percentage of female ‘other workers’<br />
is only half of the male work force, Bangalore<br />
Urban district has a fairly equitable distribution of<br />
male and female workers followed by Kodagu. The<br />
percentage of female ‘other workers’ is the highest<br />
in Haveri (46.16 per cent) in north <strong>Karnataka</strong>.<br />
Overall, the decade has not been favourable to poor<br />
women. The trends point, instead, to a feminisation<br />
of poverty which is an all-India phenomenon<br />
and not unique to <strong>Karnataka</strong>. The increasing<br />
casualisation of female labour represented by<br />
the increase in the number of women marginal<br />
workers suggests that the economy is unable to<br />
generate full time employment for women. Their<br />
increasing dependence on agriculture and, more<br />
specifi cally, on agricultural labour, coupled with<br />
176
<strong>Karnataka</strong> <strong>Human</strong> <strong>Development</strong> <strong>Report</strong> <strong>2005</strong><br />
TABLE 8.4<br />
Distribution of main and marginal workers by region for <strong>Karnataka</strong><br />
(Per cent)<br />
Year Region Main workers Marginal workers<br />
Male Female Male Female<br />
Bombay <strong>Karnataka</strong> 91.39 61.67 8.61 38.33<br />
2001<br />
Hyderabad <strong>Karnataka</strong> 88.76 60.73 11.24 39.27<br />
South <strong>Karnataka</strong> 91.82 69.48 8.18 30.52<br />
Total <strong>Karnataka</strong> 91.21 65.88 8.79 34.12<br />
Bombay <strong>Karnataka</strong> 98.93 74.10 1.07 25.90<br />
1991<br />
Hyderabad <strong>Karnataka</strong> 99.39 85.93 0.61 14.07<br />
South <strong>Karnataka</strong> 98.86 75.52 1.14 24.48<br />
Total <strong>Karnataka</strong> 98.96 77.35 1.04 22.65<br />
Bombay <strong>Karnataka</strong> -7.54 -12.43 7.54 12.43<br />
Percentage<br />
Hyderabad <strong>Karnataka</strong> -10.63 -25.2 10.63 25.2<br />
point<br />
South <strong>Karnataka</strong> -7.04 -6.04 7.04 6.04<br />
difference<br />
Total <strong>Karnataka</strong> -7.75 -11.47 7.75 11.47<br />
Source: Registrar General of India, Census 1991 and 2001.<br />
TABLE 8.5<br />
Workers by category in southern states<br />
Year Area Cultivators Agricultural<br />
labourers<br />
Household<br />
industry workers<br />
(Per cent)<br />
Other workers<br />
State Male Female Male Female Male Female Male Female<br />
India 31.06 32.93 20.85 38.87 3.18 6.46 44.92 21.75<br />
<strong>Karnataka</strong> 31.72 24.71 17.20 43.45 2.66 6.68 48.42 25.16<br />
2001<br />
Tamil Nadu 18.02 18.96 23.52 44.81 3.58 8.71 54.88 27.53<br />
Kerala 7.75 4.85 13.89 21.54 2.47 7.07 75.89 66.54<br />
Andhra 24.01 20.09 29.79 55.76 3.28 7.04 42.92 17.11<br />
Pradesh<br />
1991 <strong>Karnataka</strong> 37.57 19.89 20.24 38.43 1.75 1.62 40.44 40.06<br />
Percentage<br />
point<br />
difference<br />
<strong>Karnataka</strong> -5.85 4.82 -3.04 5.02 0.91 5.06 7.98 -14.9<br />
Source: Registrar General of India, Census 2001, Primary Census Abstract: T 00-009: Distribution of workers by category 2001.<br />
a declining presence in the category of ‘other<br />
workers’ is directly related to a reverse trend in<br />
the male work force. It could mean that men are<br />
migrating from the rural sector due to various<br />
factors or that the informal sector has grown<br />
faster than the agricultural sector. It could have<br />
been an opportunity for women, but the sad<br />
reality is that women get jobs traditionally held<br />
by men only when men leave those jobs, because<br />
they have ceased to be remunerative. And once<br />
jobs held by women become remunerative, then<br />
men take over. Overall, the fruits of the state’s<br />
economic boom of the 1990s do not appear to<br />
have trickled down to the northern districts and<br />
it has not benefi ted women workers, especially<br />
those from the poorer regions. The last piece of<br />
177
Gender and <strong>Human</strong> <strong>Development</strong><br />
TABLE 8.6<br />
Category-wise workers in districts: 2001<br />
Region District Cultivators Agricultural labourers Household industry<br />
workers<br />
South <strong>Karnataka</strong><br />
Bombay<br />
<strong>Karnataka</strong><br />
Hyderabad<br />
<strong>Karnataka</strong><br />
Other workers<br />
(per cent)<br />
(Per cent)<br />
Male Female Male Female Male Female Male Female<br />
Bangalore Rural 43.82 37.52 13.56 33.03 3.96 6.22 38.66 23.23<br />
Bangalore Urban 3.20 3.53 1.63 5.38 1.65 5.16 93.52 85.92<br />
Chitradurga 44.31 29.83 21.24 52.71 2.79 3.95 31.66 13.51<br />
Davangere 36.90 19.51 23.31 57.10 2.48 6.19 37.31 17.19<br />
Kolar 38.45 34.83 18.67 40.45 2.52 4.18 40.37 20.55<br />
Shimoga 33.83 24.13 21.54 52.60 2.07 3.29 42.55 19.98<br />
Tumkur 49.40 40.67 14.62 37.73 2.99 7.04 32.99 14.56<br />
Chamarajnagar 34.43 15.64 34.63 59.94 2.93 7.02 28.01 17.39<br />
Chikmaglur 34.96 17.07 14.51 33.90 1.91 2.53 48.62 46.50<br />
Dakshina Kannada 6.52 3.48 5.11 3.51 2.80 46.15 85.58 46.87<br />
Hassan 55.76 53.98 8.45 24.46 1.53 1.66 34.27 19.90<br />
Kodagu 8.73 5.58 3.48 5.35 0.76 1.24 87.02 87.33<br />
Mandya 53.91 40.79 16.71 38.70 1.40 3.03 27.98 17.48<br />
Mysore 37.27 33.71 16.11 38.26 1.04 3.84 45.58 24.19<br />
Udupi 18.46 21.95 12.88 25.19 3.26 26.12 65.40 26.74<br />
Bagalkot 33.56 17.46 23.28 61.70 7.48 7.59 35.69 13.25<br />
Belgaum 40.28 33.53 20.19 50.89 3.41 3.53 36.12 12.05<br />
Bijapur 37.21 18.46 25.95 66.51 2.69 2.23 34.15 12.80<br />
Dharwad 26.78 25.14 16.18 49.79 2.51 3.47 54.53 21.60<br />
Gadag 35.76 23.06 24.35 61.85 3.52 3.69 36.37 11.41<br />
Haveri 37.88 17.86 30.73 67.37 3.23 5.72 28.16 9.05<br />
Uttara Kannada 23.95 26.44 9.46 25.31 2.27 2.09 64.32 46.16<br />
Bellary 32.28 20.60 25.30 60.90 2.25 3.44 40.17 15.07<br />
Bidar 27.90 19.84 25.96 59.33 2.10 2.82 44.04 18.01<br />
Gulbarga 34.88 15.91 23.35 65.19 2.22 2.76 39.55 16.14<br />
Koppal 39.21 19.09 26.55 63.96 3.33 3.36 30.91 13.59<br />
Raichur 37.49 14.17 28.07 71.31 1.94 1.86 32.51 12.66<br />
<strong>Karnataka</strong> 31.72 24.71 17.20 43.45 2.66 6.68 48.42 25.16<br />
India 31.06 32.93 20.85 38.87 3.18 6.46 44.92 21.75<br />
Source: Registrar General of India, Census 2001.<br />
178
TABLE 8.7<br />
Agricultural wages of rural labourers in <strong>Karnataka</strong> by districts<br />
Region District Agricultural wages of rural labourers<br />
South <strong>Karnataka</strong><br />
Bombay<br />
<strong>Karnataka</strong><br />
Hyderabad<br />
<strong>Karnataka</strong><br />
Male Female M-F<br />
difference<br />
1991 2001<br />
Percentage<br />
difference<br />
<strong>Karnataka</strong> <strong>Human</strong> <strong>Development</strong> <strong>Report</strong> <strong>2005</strong><br />
Male Female M-F<br />
difference<br />
(Rupees)<br />
Percentage<br />
difference<br />
Bangalore Rural 19.32 16.26 3.06 18.82 62.85 37.25 25.6 68.72<br />
Bangalore Urban 21.80 18.00 3.80 21.11 57.45 44.31 13.14 29.65<br />
Chitradurga 17.22 12.56 4.66 37.10 39.26 27.47 11.79 42.92<br />
Davangere 17.22 12.56 4.66 37.10 42.84 29.88 12.96 43.37<br />
Kolar 24.32 18.25 6.07 33.26 53.75 35.83 17.92 50.01<br />
Shimoga 15.01 14.05 0.96 6.83 54.06 42.90 11.16 26.01<br />
Tumkur 15.27 13.12 2.15 16.39 51.48 30.74 20.74 67.47<br />
Chamarajnagar 19.40 13.45 5.95 44.24 54.28 29.83 24.45 81.96<br />
Chikmaglur 21.88 16.97 4.91 28.93 55.69 42.31 13.38 31.62<br />
Dakshina Kannada 26.77 16.72 10.05 60.11 80.00 55.00 25.00 45.45<br />
Hassan 14.82 13.04 1.78 13.65 37.35 26.64 10.71 40.20<br />
Kodagu 27.27 25.25 2.02 8.00 60.00 46.67 13.33 28.56<br />
Mandya 25.92 16.97 8.95 52.74 61.07 35.48 25.59 72.13<br />
Mysore 19.40 13.45 5.95 44.24 56.75 30.87 25.88 83.84<br />
Udupi 26.77 16.72 10.05 60.11 70.00 44.33 25.67 57.91<br />
Bagalkot 16.99 11.01 5.98 54.31 48.27 26.57 21.70 81.67<br />
Belgaum 16.93 11.92 5.01 42.03 46.74 31.59 15.15 47.96<br />
Bijapur 16.99 11.01 5.98 54.31 68.05 44.20 23.85 53.96<br />
Dharwad 10.25 7.68 2.57 33.46 52.96 35.49 17.47 49.23<br />
Gadag 10.25 7.68 2.57 33.46 39.95 31.93 8.02 25.12<br />
Haveri 10.25 7.68 2.57 33.46 42.98 37.35 5.63 15.07<br />
Uttara Kannada 21.37 16.15 5.22 32.32 63.61 47.92 15.69 32.74<br />
Bellary 12.91 10.65 2.26 21.22 41.82 28.56 13.26 46.43<br />
Bidar 17.30 14.83 2.47 16.66 61.68 27.05 34.63 128.02<br />
Gulbarga 19.51 12.96 6.55 50.54 57.62 26.15 31.47 120.34<br />
Koppal 11.95 8.32 3.63 43.63 52.57 23.81 28.76 120.79<br />
Raichur 11.95 8.32 3.63 43.63 46.79 28.93 17.86 61.74<br />
<strong>Karnataka</strong> 18.11 13.54 4.57 33.75 54.07 35.15 18.92 53.83<br />
Note: The percentage difference column refers to the difference between male and female wages as a percentage of the female wage for that district.<br />
Source: Department of Economics and Statistics, <strong>Karnataka</strong>.<br />
179
Gender and <strong>Human</strong> <strong>Development</strong><br />
In both absolute and<br />
relative terms, the<br />
female-male wage<br />
gap went up sharply,<br />
providing one more<br />
reason to conclude that<br />
female workers have<br />
fared worse than their<br />
male counterparts during<br />
the decade.<br />
As public healthcare<br />
for women and girls<br />
improved, the female<br />
sex ratio also registered<br />
a modest improvement.<br />
Unfortunately, a new<br />
and ugly form of sex<br />
discrimination has now<br />
become visible – one that<br />
is strongly correlated with<br />
prosperity and daughter<br />
aversion.<br />
corroborating evidence regarding the feminisation<br />
of poverty is from the data on differentials and<br />
trends in agricultural wages.<br />
As in the rest of the country, male wages are higher<br />
than female wages. This is one manifestation of<br />
gender discrimination that refuses to disappear,<br />
arising as it does, from an inequitable gender<br />
division of labour. Agricultural wages also show<br />
the same range – a fact that has signifi cant<br />
implications, considering that agricultural labourers<br />
are, typically, among the poorest and have high<br />
proportions of Dalit and tribal population. Table<br />
8.7 shows that the absolute difference between<br />
male and female wages increased from Rs.4.57<br />
in 1991 to Rs.18.92 in 2001. As a percentage<br />
of the female agricultural wage rate, the gap<br />
went up from 33.75 per cent to 53.83 per cent.<br />
In both absolute and relative terms, the<br />
female–male wage gap went up sharply, providing<br />
one more reason to conclude that female workers<br />
have fared worse than their male counterparts<br />
during the decade. The difference was particularly<br />
stark in Bidar, Gulbarga and Koppal districts<br />
with male agricultural wages being more than<br />
double the female wage. Districts with the least<br />
differences in male-female wages are Haveri,<br />
Gadag and Shimoga.<br />
Sex ratio<br />
The sex ratio in <strong>Karnataka</strong> started in 1901 as the<br />
lowest among the southern states, and the gap<br />
has increased by 2001, in relation to both Kerala<br />
and Andhra Pradesh, although not Tamil Nadu<br />
(Table 8.8). Between 1991 and 2001, the ratio<br />
improved marginally in all four states. However,<br />
the southern states have performed well overall.<br />
Haryana has the lowest sex ratio (861) in the<br />
country and Kerala the highest (1,058). There<br />
were only four districts in the state in which the<br />
sex ratio improved over the course of the century<br />
(Table 8.9). Ten districts are below the state norm<br />
and of these, Bangalore Urban district, which ranks<br />
fi rst in the district HDI, has the dubious distinction<br />
of coming last with a female sex ratio of 906,<br />
comparable to Nagaland (909). Udupi (1,127),<br />
Dakshina Kannada (1,023) and Hassan (1,005)<br />
compare favourably with Kerala, although Udupi,<br />
unfortunately, has regressed from 1,134 in 1991.<br />
In the four districts (Shimoga, Uttara Kannada,<br />
Chikmaglur and Kodagu) where the sex ratio<br />
improved over the course of the century, the ratio<br />
was still signifi cantly below average at the start<br />
of the century. The bulk of the decline for most<br />
districts occurred in the period between 1901 and<br />
1981, i.e. prior to the period when sex selection<br />
began to be practised in a signifi cant way.<br />
These declines in the female sex ratio undoubtedly<br />
were caused by poor reproductive healthcare and<br />
gender biases, which ensured that women and<br />
girls did not have access to adequate nutrition and<br />
healthcare. Hence, as public healthcare for women<br />
and girls improved, the female sex ratio also<br />
registered a modest improvement. Unfortunately,<br />
a new and ugly form of sex discrimination has now<br />
become visible – one that is strongly correlated<br />
with prosperity and daughter aversion.<br />
Child sex ratio<br />
The child sex ratio (CSR) signals the onset of a<br />
scary scenario where women could vanish and<br />
society would have just one gender. At the<br />
all-India level, the CSR in 1991 was 945 and<br />
regressed to 927 in 2001. The sharpest decline<br />
was noticed in the economically developed<br />
states of Himachal Pradesh, Haryana, Gujarat,<br />
Uttaranchal, Punjab, Maharashtra and the Union<br />
Territory of Chandigarh. All three southern<br />
states other than Kerala also experienced<br />
a signifi cant decline (Table 8.10), although<br />
lower than the all-India fi gure. This alarming<br />
trend has its roots in the Indian aversion to<br />
daughters and preference for sons, a notion<br />
that has strong economic and cultural roots. A<br />
son is viewed as an economic asset whereas a<br />
daughter is insensitively perceived as a drain<br />
on the family’s resources. When this perception<br />
interconnects with the low status that society<br />
and culture traditionally accord women, then<br />
some sections of society conclude that modern<br />
technology, through pre-birth sex selection and<br />
female foeticide, offers the ‘perfect’ solution to<br />
reducing the female population. An overview of<br />
region-wise and district-wise differences<br />
is presented in Table 8.11. The Hyderabad<br />
<strong>Karnataka</strong> and Bombay <strong>Karnataka</strong> regions, to a<br />
lesser extent, experienced smaller improvements<br />
180
<strong>Karnataka</strong> <strong>Human</strong> <strong>Development</strong> <strong>Report</strong> <strong>2005</strong><br />
TABLE 8.8<br />
Sex ratios for southern states: 1901–2001<br />
State Sex ratio (number of females per 1000 males) Rate of change<br />
1901 1911 1921 1931 1941 1951 1961 1971 1981 1991 2001 1901-<br />
2001<br />
India 972 964 955 950 945 946 841 930 933 927 933 -4.01 0.00 0.65<br />
<strong>Karnataka</strong> 983 981 969 965 960 966 959 957 963 960 965 -1.93 0.10 0.42<br />
Tamil Nadu 1044 1042 1029 1027 1012 1007 992 978 977 974 986 -5.56 0.92 1.23<br />
Kerala 1004 1008 1011 1022 1027 1028 1022 1016 1032 1036 1058 5.38 2.52 2.12<br />
Andhra Pradesh 985 992 993 987 980 986 981 977 975 972 978 -0.71 0.31 0.62<br />
Source: Registrar General of India, Census 2001.<br />
TABLE 8.9<br />
Sex ratio by districts in <strong>Karnataka</strong> with rates of change over the century<br />
Districts Sex ratio (number of females per 1000 males) Rate of change<br />
1901 1911 1921 1931 1941 1951 1961 1971 1981 1991 2001 (2001-<br />
1991)/<br />
1901<br />
(1991-<br />
1981)/<br />
1901<br />
1981-<br />
2001<br />
(1981-<br />
1901)/<br />
1901<br />
1991-<br />
2001<br />
(2001-<br />
1901)/<br />
1901<br />
India 972 964 955 950 945 946 841 930 933 927 933 0.62 -0.62 -4.01 -4.01<br />
<strong>Karnataka</strong> 983 981 969 965 960 966 959 957 963 960 965 0.51 -0.31 -2.03 -1.83<br />
Bangalore Rural 996 990 972 970 964 970 960 954 955 945 953 0.80 -1.00 -4.12 -4.32<br />
Bangalore Urban 982 958 931 928 922 895 890 886 900 903 906 0.31 0.31 -8.35 -7.74<br />
Chitradurga 967 968 947 952 937 942 942 946 952 951 955 0.41 -0.10 -1.55 -1.24<br />
Davangere 971 977 957 949 952 956 948 947 944 942 951 0.93 -0.21 -2.78 -2.06<br />
Kolar 968 968 957 955 949 973 968 961 971 965 970 0.52 -0.62 0.31 0.21<br />
Shimoga 894 897 892 860 869 878 879 919 944 964 977 1.45 2.24 5.59 9.28<br />
Tumkur 985 977 958 962 951 958 956 957 961 959 966 0.71 -0.20 -2.44 -1.93<br />
Bagalkot 999 995 974 984 977 997 987 987 997 982 977 -0.50 -1.50 -0.20 -2.2<br />
Belgaum 980 967 957 952 947 956 952 947 957 954 959 0.51 -0.31 -2.35 -2.14<br />
Bijapur 996 986 957 962 951 963 967 963 970 948 948 0.00 -2.21 -2.61 -4.82<br />
Dharwad 983 970 956 939 936 858 941 928 938 935 948 1.32 -0.31 -4.58 -3.56<br />
Gadag 995 976 993 981 973 987 981 983 981 969 968 -0.10 -1.21 -1.41 -2.71<br />
Haveri 973 973 942 945 944 938 939 938 937 936 942 0.62 -0.10 -3.70 -3.19<br />
Uttara Kannada 925 956 968 952 965 967 946 957 958 966 970 0.43 0.86 3.57 4.86<br />
Bellary 968 975 967 970 970 956 960 966 975 966 969 0.31 -0.93 0.72 0.1<br />
Bidar 990 979 968 959 949 980 971 963 968 952 948 -0.40 -1.62 -2.22 -4.24<br />
Gulbarga 974 975 973 970 960 993 989 981 981 962 964 0.21 -1.95 0.72 -1.03<br />
Koppal NA NA NA NA NA 968 973 979 989 981 982 NA NA NA NA<br />
Raichur NA NA NA NA NA 1004 994 982 988 978 980 NA NA NA NA<br />
Chamarajnagar 1024 1015 1007 998 975 978 968 955 956 953 968 1.46 -0.29 -6.64 -5.47<br />
Chikmaglur 907 911 910 886 892 896 903 937 953 977 984 0.77 2.65 5.07 8.49<br />
Dakshina Kannada 1029 1041 1030 1042 1049 1048 1027 1006 1015 1020 1023 0.29 0.49 -1.36 -0.58<br />
Hassan 1010 1019 998 985 977 970 969 974 987 999 1005 0.59 1.19 -2.28 -0.5<br />
Kodagu 801 799 931 803 827 830 862 910 933 979 996 2.12 5.74 16.48 24.34<br />
Mandya 1032 1028 999 995 982 990 967 960 960 963 985 2.13 0.29 -6.98 -4.55<br />
Mysore 1009 1007 989 976 961 966 942 936 948 953 965 1.19 0.50 -6.05 -4.36<br />
Udupi 1125 1112 1099 1120 1123 1150 1165 1140 1130 1134 1127 -0.62 0.36 0.44 0.18<br />
Source: Directorate of Census Operations, <strong>Karnataka</strong>, Table 3, Sex ratio for state and districts.<br />
Note: NA - Not Available.<br />
181
Gender and <strong>Human</strong> <strong>Development</strong><br />
TABLE 8.10<br />
Sex ratio and child sex ratio: A comparison with southern states<br />
State Overall Age group 0-6 Rate of change 1991-2001<br />
1991 2001 1991 2001 Overall Age group 0-6<br />
India 927 933 945 927 0.65 -1.90<br />
<strong>Karnataka</strong> 960 965 960 946 0.42 -1.15<br />
Tamil Nadu 974 986 948 939 1.23 -0.95<br />
Kerala 1036 1058 958 963 2.12 0.52<br />
Andhra Pradesh 972 978 975 964 0.62 -1.13<br />
Source: Registrar General of India, Census 2001.<br />
High education levels do<br />
not necessarily translate<br />
into gender sensitivity.<br />
in the overall sex ratio between 1991 and 2001<br />
than south <strong>Karnataka</strong>. However, the extent<br />
of the decline in the child sex ratio (with the<br />
exception of Belgaum and Gulbarga districts)<br />
is also lower in the two poorer regions than in<br />
south <strong>Karnataka</strong>. The district with the highest<br />
decline in CSR is Mandya, which is a relatively<br />
high-income district. Here, unwillingness to<br />
fragment property through either inheritance or<br />
dowry has led to a desire for one or two children,<br />
preferably only sons. It is unfortunate that<br />
Dakshina Kannada has also registered a decline<br />
in CSR. Some districts show an improvement<br />
and, except Kodagu, these districts do not have<br />
high levels of literacy or economic development.<br />
Hence, high education levels do not necessarily<br />
translate into gender sensitivity. High incomes<br />
mean that people have access to, and can afford<br />
to pay for, the technology for sex selection. The<br />
skewed child sex ratio is a manifestation of a<br />
covert form of gender violence with enormous<br />
social implications. As regions experience<br />
economic growth and poverty reduction, as long<br />
as gender bias persists and is refl ected in the<br />
spread and increase of dowry and other practices,<br />
the possibility of more people undertaking sex<br />
selection also increases. Without systematic<br />
efforts to address this problem, increases<br />
in economic growth, consumerism, and<br />
improvements in health and education may<br />
well translate into stronger daughter aversion.<br />
The stakeholders are many: parents, husbands,<br />
doctors, nurses, and the manufacturers of<br />
equipment used for sex selection who aggressively<br />
market the latest technology. Women also opt<br />
for sex selection for a variety of reasons such<br />
as domestic violence, harassment and lack of<br />
awareness. Enforcement of laws prohibiting<br />
the use of technology for sex selection and<br />
awareness building by government, NGOs and<br />
activist groups can reduce the growth of this<br />
heinous practice.<br />
With the exception of only 8 out of 27 districts,<br />
the child sex ratio is worse in urban than in rural<br />
areas (Table 8.12).<br />
Women’s autonomy<br />
Along three dimensions, household decisions,<br />
freedom of movement, and access to money,<br />
the picture for women in <strong>Karnataka</strong> relative to<br />
the rest of India is mixed. Women in <strong>Karnataka</strong><br />
have greater physical mobility and access to<br />
money, but less say in decisions about their<br />
own healthcare and other household decisions<br />
(Table 8.13).<br />
Violence against women<br />
The UN Declaration on the Elimination of<br />
Violence against Women (1993) defi nes ‘violence<br />
against women’ as any act of gender-based<br />
violence that results in, or is likely to result in<br />
physical, sexual or mental harm and suffering<br />
to women whether occurring in public or private<br />
life. This defi nition encapsulates a wide range<br />
of offences ranging from dowry deaths, spousal<br />
abuse, rape, traffi cking in women, sexual<br />
harassment, sex selection etc. Bringing ‘domestic’<br />
violence within the domain of violence against<br />
women means that what was traditionally<br />
hidden as a ‘family’ or ‘personal’ matter such as<br />
wife battering or dowry-related harassment is<br />
182
<strong>Karnataka</strong> <strong>Human</strong> <strong>Development</strong> <strong>Report</strong> <strong>2005</strong><br />
TABLE 8.11<br />
Sex ratio and child sex ratio by districts in <strong>Karnataka</strong><br />
State/Region Districts Sex ratio Age group 0-6 1991-2001<br />
(Percentage<br />
change)<br />
1991 2001 1991 2001 Overall 0 to 6<br />
India 927 933 945 927 0.65 -1.90<br />
<strong>Karnataka</strong> 960 965 960 946 0.42 -1.15<br />
South <strong>Karnataka</strong><br />
Bombay<br />
<strong>Karnataka</strong><br />
Hyderabad<br />
<strong>Karnataka</strong><br />
Bangalore Rural 945 953 950 940 0.85 -1.05<br />
Bangalore Urban 903 906 957 941 0.33 -1.67<br />
Chitradurga 951 955 960 946 0.42 -1.46<br />
Davangere 942 951 NA 949 0.96 NA<br />
Kolar 965 970 971 976 0.52 0.51<br />
Shimoga 964 977 961 959 1.35 -0.21<br />
Tumkur 959 966 970 952 0.73 -1.86<br />
Chamarajnagar 953 968 NA 957 1.57 NA<br />
Chikmaglur 977 984 978 964 0.72 -1.43<br />
Dakshina Kannada 1020 1023 966 952 0.29 -1.45<br />
Hassan 999 1005 967 964 0.60 -0.31<br />
Kodagu 979 996 957 977 1.74 2.09<br />
Mandya 963 985 959 937 2.28 -2.29<br />
Mysore 953 965 966 970 1.26 0.41<br />
Udupi 1134 1127 NA 955 -0.62 NA<br />
Bagalkot 982 977 NA 939 -0.51 NA<br />
Belgaum 954 959 955 924 0.52 -3.25<br />
Bijapur 948 948 956 971 0.00 1.57<br />
Dharwad 935 948 952 944 1.39 -0.84<br />
Gadag 969 968 NA 951 -0.10 NA<br />
Haveri 936 942 NA 961 0.64 NA<br />
Uttara Kannada 966 970 949 946 0.41 -0.32<br />
Bellary 966 969 957 949 0.31 -0.84<br />
Bidar 952 948 962 967 -0.42 0.52<br />
Gulbarga 962 964 959 937 0.21 -2.29<br />
Koppal 981 982 NA 938 0.10 NA<br />
Raichur 978 980 965 962 0.20 -0.31<br />
Count of negatives (districts) 4 15<br />
Note: NA - Not Available.<br />
Sources:<br />
1. Registrar General of India, Census 2001, Table 2: Sex ratio and population density in 1991 and 2001.<br />
2. Child Sex Ratio from Dept. of Health and Family Welfare, <strong>Karnataka</strong> ‘Integrated Health, Nutrition and Family Welfare Services<br />
<strong>Development</strong> Project’ proposal document.<br />
183
Gender and <strong>Human</strong> <strong>Development</strong><br />
<strong>Human</strong> development<br />
cannot occur in an<br />
environment that is<br />
vitiated by violence.<br />
Women, who are caught<br />
up in an environment<br />
of violence, or even the<br />
threat of violence, find it<br />
constrains their mobility,<br />
their autonomy and sense<br />
of self.<br />
TABLE 8.12<br />
District-wise child sex ratio 2001: Rural and urban<br />
Regions Districts Total Rural Urban<br />
<strong>Karnataka</strong> 946 954 939<br />
South <strong>Karnataka</strong><br />
Bombay <strong>Karnataka</strong><br />
Hyderabad <strong>Karnataka</strong><br />
Source: Registrar General of India, Census 2001.<br />
now an offence on par with violence perpetrated<br />
against women in the public domain. Violence<br />
against women has its roots in men’s economic<br />
and social domination and their control of<br />
female sexuality and reproduction. It is also<br />
an instrument in the domination and control of<br />
the poor by upper castes. <strong>Human</strong> development<br />
cannot occur in an environment that is vitiated<br />
by violence. Women, who are caught up in an<br />
environment of violence, or even the threat of<br />
Bangalore Rural 940 945 928<br />
Bangalore Urban 941 957 937<br />
Chitradurga 946 945 949<br />
Davangere 949 953 940<br />
Kolar 976 983 953<br />
Shimoga 959 958 961<br />
Tumkur 952 953 949<br />
Chamarajnagar 957 958 952<br />
Chikmaglur 964 966 956<br />
Dakshina Kannada 952 949 958<br />
Hassan 964 969 937<br />
Kodagu 977 976 986<br />
Mandya 937 931 968<br />
Mysore 970 976 958<br />
Udupi 955 953 964<br />
Bagalkot 939 949 910<br />
Belgaum 924 924 921<br />
Bijapur 971 986 914<br />
Dharwad 944 945 943<br />
Gadag 951 948 957<br />
Haveri 961 966 942<br />
Uttara Kannada 946 947 943<br />
Bellary 949 954 937<br />
Bidar 967 980 923<br />
Gulbarga 937 943 920<br />
Koppal 938 934 963<br />
Raichur 962 967 946<br />
violence, fi nd it constrains their mobility, their<br />
autonomy and sense of self.<br />
The incidence of physical abuse of women in<br />
<strong>Karnataka</strong> is 21.5 per cent, which is slightly higher<br />
than the all-India average. Women in the southern<br />
states, except Kerala, receive the same degree of<br />
mistreatment as their sisters in the rest of the<br />
country. However, women in <strong>Karnataka</strong> receive<br />
less physical mistreatment than their counterparts<br />
184
<strong>Karnataka</strong> <strong>Human</strong> <strong>Development</strong> <strong>Report</strong> <strong>2005</strong><br />
TABLE 8.13<br />
Percentage of ever married women involved in household decision-making,<br />
freedom of movement and access to money: Southern states<br />
State<br />
Not<br />
involved<br />
in any<br />
decisionmaking<br />
What<br />
to cook<br />
Involved in decision-making on: Who do not need<br />
permission for<br />
Own<br />
health<br />
care<br />
Purchasing<br />
jewellery<br />
etc.<br />
Staying<br />
with her<br />
parents/<br />
siblings<br />
Going<br />
to the<br />
market<br />
Visiting<br />
friends/<br />
relatives<br />
Access<br />
to money<br />
India 9.4 85.1 51.6 52.6 48.1 31.6 24.4 59.6<br />
Andhra Pradesh 7.4 86.2 56.1 61.4 57.7 20.1 14.6 57.7<br />
<strong>Karnataka</strong> 8.1 88.4 49.3 47.3 44.5 43.0 34.3 67.0<br />
Kerala 7.2 80.9 72.6 63.4 59.7 47.7 37.9 66.2<br />
Tamil Nadu 2.4 92.1 61.1 67.4 62.4 78.5 55.9 79.0<br />
Source: NFHS-2 India (1998-99): Table 3.12, page 70.<br />
State<br />
TABLE 8.14<br />
Percentage of ever married women who have been physically abused:<br />
Southern states<br />
Beaten or<br />
physically<br />
mistreated<br />
since age 15<br />
Percentage beaten or physically<br />
mistreated since age 15 by<br />
Husbands In-laws Other persons<br />
Beaten or physically<br />
mistreated in the<br />
past 12 months<br />
India 21 18.8 1.8 3.1 11<br />
Andhra Pradesh 23.2 21.2 2.8 2 12.8<br />
<strong>Karnataka</strong> 21.5 19.7 1.1 2.2 9.9<br />
Kerala 10.2 7.5 0.2 3.2 3.5<br />
Tamil Nadu 40.4 36 0.5 9 16.1<br />
Source: NFHS-2 India (1998-99): Table 3.16, page 79.<br />
in Tamil Nadu and Andhra Pradesh – if this can<br />
count as a positive trend (Table 8.14).<br />
Data on crimes against women (Table 8.15)<br />
indicates there is little correlation between the<br />
number of registered crimes in police records<br />
and the widespread nature of violence against<br />
women across social institutions. The fact that<br />
crimes against women are under-represented in<br />
offi cial records points to the diffi culties women<br />
experience in reporting crimes and the resistance<br />
of public authorities to taking legal cognisance of<br />
offences against women. However, one category<br />
of crimes i.e. a category of deaths exclusively of<br />
women – mainly young, newly married women<br />
– has emerged in the public consciousness due to<br />
the efforts of women’s groups and NGOs. In police<br />
records, they are classifi ed under three specifi c<br />
categories, which invoke different sections of the<br />
law. These are ‘dowry murders’ (committed by the<br />
woman's husband or members of his family for<br />
additional dowry or non-payment of promised<br />
dowry); ‘suicides’ (forced or voluntary, but in most<br />
cases related to dowry demands); and ‘accidents’<br />
(a majority classifi ed under ‘stove burst’ or ‘kitchen<br />
accident’). Deaths under these three categories<br />
add up to an alarming fi gure (Vimochana, 1999).<br />
Also, in the early phase of the study, as it collated<br />
police statistics, Vimochana, an NGO, noted a major<br />
anomaly between its fi gures and those of the police.<br />
The fact that crimes<br />
against women are<br />
under-represented in<br />
official records points to<br />
the difficulties women<br />
experience in reporting<br />
crimes and the resistance<br />
of public authorities to<br />
taking legal cognisance of<br />
offences against women.<br />
185
Gender and <strong>Human</strong> <strong>Development</strong><br />
TABLE 8.15<br />
Crimes against women: <strong>Karnataka</strong><br />
(Nos.)<br />
Sl. No. Heads of crime 1999 2000 2001 2002 2003<br />
1 Rape (sec. 376 IPC)<br />
1.1 Custodial rape 10 6 12 8 9<br />
1.2 Gang rape 291 275 281 284 312<br />
Total (1.1 + 1.2) 301 281 293 292 321<br />
2 Outraging modesty (molestation) 1501 1568 1665 1648 1585<br />
3 Kidnapping and abduction of women<br />
3.1 For prostitution 10 2 3 3 2<br />
3.2 For other purposes 386 334 272 362 256<br />
Total (3.1 + 3.2) 396 336 275 365 258<br />
4 Insulting modesty (eve-teasing) 147 76 81 100 84<br />
5 Murder for dowry-by burning 10 15 13 18 10<br />
6 Murder for dowry-by other means 31 34 16 27 26<br />
7 Murder for other reasons 334 395 387 376 349<br />
8 Attempt to commit murder for dowry by 10 5 11 13 5<br />
burning<br />
9 Attempt to commit murder for dowry by 9 13 8 19 25<br />
other means<br />
10 Attempt to commit murder for other 16 38 40 30 44<br />
reasons<br />
11 Dowry death by burning 61 46 35 36 32<br />
12 Dowry death by other means 156 167 185 197 162<br />
13 Attempt to commit suicide for dowry by 0 4 9 11 0<br />
burning<br />
14 Attempt to commit suicide by other 3 3 4 2 0<br />
means<br />
15 Cruelty by husband or relative of 1560 1688 1755 1826 1704<br />
husband<br />
16 Abetment to suicide 198 234 207 198 232<br />
17 Importing of girls (upto 21 years) 0 0 0 0 0<br />
18 Sati Prevention Act 0 0 0 0 0<br />
19 Immoral Traffi c (Prevention) Act 1226 1337 1356 1388 1361<br />
20 Indecent Representation of Women 0 0 0 0 0<br />
(Prohibition) Act 1986<br />
21 Other crimes against women 494 601 406 443 360<br />
Total 6453 6841 6746 6989 6558<br />
Source: State Crime Record Bureau, <strong>Karnataka</strong>.<br />
It found that a large number of deaths were being<br />
classifi ed in police records as ‘accidents’ under ‘UDR’<br />
(Unnatural Death Register). The category of ‘dowry<br />
deaths’ in a technical sense only included those<br />
cases that had been booked by the police under<br />
the relevant sections of the law. The ‘accident’ cases<br />
that were closed for want of evidence, however,<br />
were largely due to ‘stove bursts’ or ‘kitchen<br />
accidents’. Investigations revealed that a large<br />
number of murders and suicides, punishable under<br />
law, were being made to look like ‘accidents’ by the<br />
husband and/or members of his family. These cases<br />
were closed by the investigating police offi cers for<br />
want of hard evidence of a crime. In Bangalore city<br />
alone, 1,133 women died in murders, suicides and<br />
accidents in 1997, 1,248 in 1998, and 618 till<br />
mid-July 1999 (Menon, 1999).<br />
If offi cial fi gures on dowry-related crimes, including<br />
murder and attempt to murder (under Sections<br />
302, 307 and 304-B IPC) are added to fi gures<br />
on cruelty by husband and relatives of husband<br />
(Section 498-A IPC), (Table 8.15), it is more than<br />
evident that for large numbers of married women,<br />
the right to live in safety, even within their own<br />
homes (ironically, the one place an individual<br />
expects to feel secure), and in a climate free from<br />
intimidation and violence, is not available. Thirty<br />
per cent of all crimes against women in 2003<br />
were registered under these sections. Another 29<br />
per cent constitute rape and molestation cases an<br />
indicator of the threat women face to their bodily<br />
integrity within and outside the home.<br />
State strategies and policies<br />
The stagnation in women’s work participation<br />
in the poorer districts, the narrowing of their<br />
work and income opportunities, growing wage<br />
differentials between men and women and the<br />
huge and apparently increasing disparities among<br />
the higher and lower income regions of the state,<br />
when combined with rising aspirations as refl ected<br />
in women’s growing educational involvement,<br />
pose a major challenge to the policies, strategies<br />
and programmes of the government.<br />
During the last decade, state actions to support<br />
women have occurred, both through and<br />
outside the Department of Women and Child<br />
186
<strong>Karnataka</strong> <strong>Human</strong> <strong>Development</strong> <strong>Report</strong> <strong>2005</strong><br />
<strong>Development</strong> (DWCD). Major strategies outside<br />
DWCD include the allotment and provision<br />
of housing title deeds (hakku patras) for<br />
women only under government sponsored, low<br />
income-housing programmes and a 30 per cent<br />
job reservation for women in all direct recruitments<br />
by the government and PSUs after 1996. Over<br />
8,00,000 women are now sole home-owners<br />
under the government fi nanced Ashraya and<br />
Ambedkar housing programmes. In a patriarchal<br />
society, few women own or inherit assets such as<br />
land and houses, hence the government’s policy,<br />
which has enabled a large class of poor women to<br />
become homeowners, is truly remarkable. About 50<br />
per cent are Scheduled Caste and Scheduled Tribe<br />
women. With reference to recruitment, out of the<br />
45,018 sanctioned posts in 85 departments and<br />
72 Boards and Corporations, 13,204 posts have<br />
been reserved for women and the quota has been<br />
slightly over-fulfi lled, which is commendable.<br />
In the next section, we will look at policy<br />
approaches to strengthening women’s economic<br />
capabilities and political participation, as well as<br />
addressing violence against women.<br />
Enabling economic development<br />
Four broad features distinguish the approach<br />
taken by the state government during the last<br />
decade or so to strengthen women’s access to<br />
income and economic resources. These include<br />
(i) a strong emphasis on the self-help group<br />
(SHG) model; (ii) a clear focus on poor, Dalit and<br />
tribal women as those most in need, along with<br />
women with disabilities or victims of violence;<br />
(iii) a recognition that women in the districts of<br />
Hyderabad <strong>Karnataka</strong> and Bombay <strong>Karnataka</strong><br />
need special attention; and (iv) the use of the<br />
language of empowerment.<br />
The Women and Child <strong>Development</strong> department’s<br />
(DWCD) fl agship scheme, Stree Shakti, was<br />
launched during 2000-01. Under this scheme,<br />
1,00,000 self-help groups based on thrift and credit<br />
principles were formed at the village level through<br />
a network of 40,300 anganwadi workers. Group<br />
members are: (i) women living below the poverty<br />
line; (ii) women landless agricultural labourers;<br />
(iii) women from the Scheduled Castes and Tribes;<br />
TABLE 8.16<br />
Total crimes committed against women in <strong>Karnataka</strong>: 1999–2003<br />
(Nos.)<br />
Divisions Area 1999 2000 2001 2002 2003<br />
State 6453 6841 6746 6989 6558<br />
Bangalore city 1075 1142 1125 1231 1135<br />
Mysore city 280 305 523 586 446<br />
Hubli 217 152 138 172 147<br />
Kolar Gold Fields 51 63 58 44 58<br />
<strong>Karnataka</strong> Railways 8 7 4 8 15<br />
Districts<br />
Bangalore 234 232 289 335 321<br />
Chitradurga 141 164 133 131 146<br />
Bangalore<br />
Davangere 182 179 250 233 192<br />
Kolar 250 251 167 168 158<br />
Shimoga 210 240 264 294 267<br />
Tumkur 201 235 172 166 184<br />
Bagalkot 210 202 180 177 206<br />
Belgaum 383 408 346 305 309<br />
Bijapur 291 206 222 232 228<br />
Belgaum Dharwad 63 78 37 67 37<br />
Gadag 36 49 40 38 39<br />
Haveri 82 85 122 75 83<br />
Uttara Kannada 71 81 83 95 84<br />
Bellary 194 225 262 264 203<br />
Bidar 142 194 196 220 160<br />
Gulbarga Gulbarga 404 370 408 352 378<br />
Koppal 91 116 95 121 78<br />
Raichur 143 136 162 192 189<br />
Chamarajnagar 68 68 81 70 85<br />
Chikmaglur 139 142 215 213 213<br />
Dakshina Kannada 210 344 37 139 178<br />
Mysore<br />
Hassan 262 354 269 222 205<br />
Kodagu 80 80 77 96 100<br />
Mandya 387 450 421 449 450<br />
Mysore 285 221 214 220 173<br />
Udupi 63 62 48 74 91<br />
Source: State Crime Record Bureau, <strong>Karnataka</strong>.<br />
187
Gender and <strong>Human</strong> <strong>Development</strong><br />
It is undeniable that<br />
schemes that attack<br />
poverty, through credit<br />
to women, augment the<br />
income of the household,<br />
impacting household<br />
consumption directly.<br />
But how far do these<br />
interventions go in<br />
altering intra-household<br />
power dynamics – roles,<br />
dependencies, and<br />
authority?<br />
and (iv) women from families with alcoholics, drug<br />
addicts or physically disabled persons. As of March<br />
2004, DWCD has formed 1,00,000 groups with a<br />
total of 14,79,794 members, of whom 3,10,358 are<br />
Scheduled Castes, 1,18,359 are Scheduled Tribes,<br />
and 99,779 are from the minority communities.<br />
The DWCD is also responsible for Swayam Sidha, a<br />
centrally sponsored scheme (formerly Indira Mahila<br />
Yojana) to form SHGs through the facilitation of the<br />
anganwadi workers. The <strong>Karnataka</strong> State Women’s<br />
<strong>Development</strong> Corporation (KSWDC) promotes<br />
income generation, giving priority to single women<br />
and households eligible for Swarna Jayanthi Shahari<br />
Rozgar Yojana loans. KSWDC provides support by<br />
identifying entrepreneurs, providing technical help to<br />
identify viable projects, facilitating credit, promoting<br />
marketing, training, and strengthening women’s<br />
cooperatives. The KSWDC is responsible for different<br />
state sponsored schemes such as Udyogini (for<br />
credit to women entrepreneurs), the urban<br />
Stree Shakti scheme, and a devadasi rehabilitation<br />
programme (economic and social programmes in<br />
nine northern districts). In addition, KSWDC has<br />
also run the World Bank-IFAD sponsored Swashakti<br />
scheme to form SHGs through NGOs in 7 districts<br />
– Kolar, Tumkur, Chitradurga, Bellary, Koppal,<br />
Raichur and Gulbarga. Thirty-six NGOs have been<br />
contracted to work in 979 project villages, and<br />
have formed 2,100 SHGs with 38,508 members.<br />
Almost 50 per cent of these women are illiterate,<br />
60 per cent are landless or have less than one acre,<br />
and about 59 per cent are SC/STs.<br />
It is clear that the current approaches seek to link<br />
gender with poverty, using development delivery<br />
as a platform for targeting women as benefi ciaries<br />
and mobilising them for social empowerment.<br />
Swashakti, for instance, conceives of the self-help<br />
group strategy as a means to build women’s ‘self<br />
reliance and self confi dence, to provide greater<br />
access to and control over resources, sensitise<br />
and strengthen the institutional capacity of<br />
support agencies to proactively address women’s<br />
needs, increase incomes of poor women through<br />
involvement in income-generating activities,<br />
develop linkages between SHGs and lending<br />
institutions to ensure access to credit fi nancing,<br />
and improve access to better healthcare,<br />
education and drudgery reduction facilities. ’ This<br />
is also true for micro-enterprise-oriented schemes<br />
like Mane Belaku and Udyogini. Similarly, a<br />
regional emphasis is discernible in programmes<br />
like Swashakti that unequivocally target<br />
backward districts. An explicit strategy underlying<br />
programme delivery is the promotion of linkages.<br />
Stree Shakti has established convergence with the<br />
SGSY of the Rural <strong>Development</strong> and Panchayat<br />
Raj department, the National Backward Class<br />
<strong>Development</strong> Corporation, the department of<br />
Animal Husbandry, and the Ashraya and Ambedkar<br />
housing schemes. (For an analysis of Stree Shakti<br />
and Swashakti groups, see Box 8.5).<br />
It is undeniable that schemes that attack poverty,<br />
through credit to women, augment the income of<br />
the household, impacting household consumption<br />
directly. But how far do these interventions go in<br />
altering intra-household power dynamics – roles,<br />
dependencies, and authority? The evaluation of<br />
Udyogini and Mane Belaku throws up interesting<br />
insights. The income from the activity pursued<br />
from the Mane Belaku loan has been spent on food<br />
expenses of the household in 70 per cent of cases,<br />
implying the direct relevance of these to household<br />
consumption. But the loan and subsidy have not<br />
always contributed to supporting or building the<br />
entrepreneurial potential of women. In many cases,<br />
the money is channelled to an existing enterprise<br />
run by the men of the household. While this may<br />
bode well for the woman’s value to the household,<br />
it falls short of the goal of women’s economic<br />
empowerment. The survey (DES: 2004B) of<br />
Stree Shakti and Swashakti groups however<br />
reveals that about 45 per cent of the loans were<br />
taken for economic activities and the remaining for<br />
house construction, festivals/functions, healthcare<br />
and children’s education.<br />
In other instances, the mobilisation of women<br />
into SHGs for micro-credit has also led to their<br />
social empowerment. Stree Shakti groups as also<br />
other SHGs have demonstrated their capacities<br />
to use women’s agency in tackling gender<br />
issues by protesting against arrack, gutka, child<br />
marriage and other social issues. The domain<br />
of the home however, remains an impregnable<br />
bastion and poor women who may acquire an<br />
ability to contest gender issues in the public<br />
188
domain may still be unable to take up issues<br />
of domestic violence. Studies have documented<br />
how sangha women from Mahila Samakhya (a<br />
GoI programme) sometimes endure violence<br />
because they participate in sangha activities<br />
(Krishnamurthy and Dave 2000). However, this<br />
in itself must not be construed as a measure of<br />
failure of an empowerment approach; rather, it<br />
connotes the ways in which relations of power<br />
are sought to be renegotiated, and the tradeoffs<br />
involved in doing so. In another context, the<br />
majority of the women surveyed in the DES<br />
2004 survey said they did not meet with<br />
resistance from either the spouse or family when<br />
they participated in group meetings, visited the<br />
bank or attended training. About one-fourth<br />
actually saw a signifi cant reduction in familybased<br />
violence after they joined the SHG.<br />
Additionally, building the capacities of poor<br />
women to understand markets, mobilising<br />
them into groups, federating these groups so<br />
women can more effectively deal with other<br />
actors in the market, creation of new innovative<br />
fi nancial instruments, and provision of marketing<br />
infrastructure are the most important components<br />
needed to facilitate access to markets of the poor<br />
and of women (Purushothaman, M.S. Subhas and<br />
Nagrecha, 2004).<br />
Addressing violence against women<br />
Studies by the National Law School of India<br />
(Centre for Women and Law, National Law<br />
School of India University, 1999) and Hengasara<br />
Hakkina Sangha (HHS), an NGO in <strong>Karnataka</strong>,<br />
(Rao et al., 1999) point to the weakness of the<br />
formal justice system in redressing violence<br />
against women. NGOs like Vimochana have held<br />
public hearings to bring to light the severity of<br />
the problem of ‘dowry deaths’. The low conviction<br />
rate of perpetrators of crimes against women<br />
reveals the need to improve various aspects of<br />
the criminal justice system.<br />
Women, who are victims of various atrocities<br />
such as dowry, rape, sexual harassment, domestic<br />
violence, etc. are subjected to physical and mental<br />
torture besides having to face social and fi nancial<br />
problems. DWCD’s Santhwana (2001-02)<br />
scheme provides legal assistance, fi nancial<br />
relief, temporary shelter, and protection to such<br />
victims, and helps them to become self-reliant<br />
by providing training. The Santhwana centres<br />
are run through NGOs, with preference given to<br />
NGOs that are running short-stay homes. Family<br />
Counselling Centres are actively working in the<br />
fi eld of women’s welfare. Santhwana is being<br />
implemented in all the 27 district headquarters<br />
and 18 selected taluks. There are 46 Santhwana<br />
centres in the state. The assistance provided to<br />
these women ranges from immediate relief, to<br />
rehabilitation. Services include toll-free women’s<br />
help line, short-stay homes, counselling services,<br />
legal assistance; as well as space in working<br />
women’s hostels, fi nancial assistance, and<br />
training for income generation. A review of the 19<br />
Santhwana centres run through Mahila Samakhya<br />
<strong>Karnataka</strong> (Mathrani 2004) points out that the<br />
scheme has failed to make real choices available<br />
to women in need. Opting out of violent situations<br />
translates into various needs – referral services,<br />
legal help, medical help, livelihood/vocational<br />
help, temporary stay, and child care to name a<br />
few. The Santhwana centres are so under-funded<br />
as to be only partially effective.<br />
However, poor funding is not the only concern.<br />
While government initiatives including<br />
Santhwana, all women police stations (AWPS),<br />
and family counselling cells have attempted to<br />
address gender-based crimes including domestic<br />
violence, rape, sexual abuse, and dowry<br />
harassment, efforts are severely constrained<br />
by several factors in addition to the fact that<br />
funds are short and real choices are seldom<br />
made available to women. A research study<br />
undertaken to study responses to domestic<br />
violence in Gujarat and <strong>Karnataka</strong> (SNDT<br />
Women’s University 1999) covered case studies<br />
of AWPS. The fi ndings reveal poor quality<br />
services and low rates of utilisation. Reasons<br />
include the long distances that women have to<br />
travel to reach the stations, and an emphasis on<br />
family reconciliation, regardless of the severity of<br />
the case. Sometimes even female offi cers often<br />
perceive domestic violence as a ‘private’ matter<br />
and ignore prescribed investigative procedures.<br />
The research by HHS found that counsellors in<br />
<strong>Karnataka</strong> <strong>Human</strong> <strong>Development</strong> <strong>Report</strong> <strong>2005</strong><br />
Opting out of violent<br />
situations translates into<br />
various needs – referral<br />
services, legal help,<br />
medical help, livelihood/<br />
vocational help,<br />
temporary stay, and child<br />
care to name a few.<br />
189
Gender and <strong>Human</strong> <strong>Development</strong><br />
The reservation for<br />
women in local bodies<br />
and the increased<br />
presence of women<br />
in public life and in<br />
leadership roles has<br />
reshaped gender roles.<br />
family counselling cells typically do not get the<br />
required capacity building to offer meaningful<br />
support and solutions to victims; instead, many<br />
continue to emphasise the primacy of the<br />
family over the survival needs of the woman.<br />
The fundamental problem is that of lack of real<br />
options to marriage, hence, the emphasis is often<br />
on ‘saving the family’, even though that may not<br />
be in the interest of the woman victim since the<br />
family is the source of the problem.<br />
There is a need for interventions that can offer<br />
more meaningful options to women who seek<br />
help. Vocational training options need to be<br />
increased, especially since most of the traditional<br />
ones – embroidery, tailoring, doll making, etc.<br />
– do not provide the economic independence<br />
required to meet women’s livelihood needs.<br />
For women victims of violence, shelters and<br />
short-stay homes that can provide child care<br />
assistance, training, comprehensive counselling<br />
and assistance for housing and employment are<br />
vital.<br />
Political participation at the grassroots<br />
The representation of elected women<br />
representatives (EWRs) in the panchayat tiers<br />
is the highest in <strong>Karnataka</strong> as compared to the<br />
rest of the country (Table 8.17). Women occupy<br />
one-third of the decision-making positions in all<br />
three tiers (Table 8.18).<br />
The presence of a critical mass of women in<br />
the political sphere changes the way society<br />
perceives women (from homemaker to leader).<br />
Second, as women in Panchayat Raj Institutions<br />
(PRIs) reduce their political dependence on male<br />
patrons and are backed by women’s groups at<br />
the grassroots, a gradual shift towards a politics<br />
based on women’s constituency emerges. The<br />
reservation for women in local bodies and the<br />
increased presence of women in public life and<br />
in leadership roles has reshaped gender roles.<br />
Shifts in gender roles within the households of<br />
EWRs, as well as the interactions of EWRs with<br />
government and other agencies are important<br />
components in this transformation. A study of<br />
women in local self-governance in <strong>Karnataka</strong><br />
(Stephen and Raja Sekaran 2001), notes that<br />
35.6 per cent of women EWRs achieved a<br />
moderate level of economic empowerment<br />
after becoming gram panchayat members while<br />
there was a distinct increase in the level of self<br />
confi dence in almost 97 per cent. According to<br />
them, being gram panchayat (GP) members<br />
had a positive impact on their personal abilities<br />
such as communication skills and the capacity to<br />
get things done. Their fear of contacting offi cials<br />
and interacting with other villagers diminished.<br />
At the community level, 31.5 per cent showed<br />
a high degree of transformation. These women<br />
gained the confi dence to participate in public<br />
functions, take up social issues like alcoholism<br />
and work for improvement of their villages.<br />
Their level of political awareness and knowledge<br />
about programmes also increased. Research<br />
studies also indicate that at least some EWRs do<br />
grow into assuming leadership roles within the<br />
community that challenge traditional patriarchal<br />
leadership constructs. Changing role defi nitions<br />
even triggers a process of ‘a redefi nition and<br />
engendering of leadership notions’, which is<br />
‘radically different from the traditional view of<br />
leaders being charismatic public speakers and<br />
being overtly strong’ (Purushothaman, Anil<br />
Kumar, and Purohit, 1999). Changes in gender<br />
role perceptions also seem to be gradually getting<br />
institutionalised. While fi eld level government<br />
offi cials with whom the EWRs interact often<br />
resent having to deal with women, it has been<br />
observed that over time, such interactions gender<br />
sensitise government machinery at the fi eld level<br />
(Jain, 2001).<br />
Several fi rst-term women are either proxies<br />
for male relatives and/or entrenched political<br />
powers. Under these circumstances, it is natural<br />
that most EWRs only represent the existing<br />
dominant power structures, and not the interests<br />
of women as a political constituency. In fact, most<br />
fi rst term EWRs are so apologetic about their<br />
newly acquired position that they go out of the<br />
way to insist that they owe their positions to their<br />
male relatives, or some powerful groups in the<br />
community. Such ‘humility’ can be understood as<br />
a typical response when women assume a public<br />
role not sanctioned by prevailing gender and<br />
caste norms. Additionally, EWRs, like their sisters<br />
190
<strong>Karnataka</strong> <strong>Human</strong> <strong>Development</strong> <strong>Report</strong> <strong>2005</strong><br />
TABLE 8.17<br />
Elected women members in Panchayat Raj institutions: Selected states<br />
Sl. No. State PRI Total elected<br />
representatives<br />
1 Andhra Pradesh<br />
2 Arunachal Pradesh<br />
3 Assam<br />
4 Goa<br />
5 Gujarat<br />
6 Haryana**<br />
7 Himachal Pradesh<br />
8 <strong>Karnataka</strong><br />
9 Kerala<br />
10 Madhya Pradesh #<br />
11 Maharashtra<br />
12 Manipur<br />
13 Orissa<br />
Elected women<br />
representatives<br />
GP 230529 78000(33.8)<br />
PS 14644 5420(37.0)<br />
ZP 363(33.2)<br />
GP 5733 86(1.5)<br />
PS 1205 39(3.2)<br />
ZP 77 * NA<br />
GP 30360 5469(18.0)<br />
PS 2584 669(25.8)<br />
ZP 845 NA<br />
GP 1281 468(36.5)<br />
PS - -<br />
ZP 35 NA<br />
GP 123470 41180(33.3)<br />
PS 3814 1274(33.4)<br />
ZP 761 254(33.3)<br />
GP 54159 17928(33.1)<br />
PS 2718 807(33.3)<br />
ZP 303 101(33.3)<br />
GP 18258 6013(32.9)<br />
PS 1661 558(33.5)<br />
ZP 252 84(33.3)<br />
GP 80627 35305(43.7)<br />
PS 3340 1.343(40.2)<br />
ZP 919 335(36.4)<br />
GP 10270 3883(37.8)<br />
PS 1547 563(36.3)<br />
ZP 300 104(34.6)<br />
GP 314847 106410(33.8)<br />
PS 6456 2159(33.4)<br />
ZP 734 248(33.8)<br />
GP 303545 100182(33.0)<br />
PS 3524 1174(33.3)<br />
ZP 1762 587(33.3)<br />
GP 1556 576(37.0)<br />
PS - -<br />
ZP 61 22(36.0)<br />
GP 81077 28595(35.2)<br />
PS 5260 1870(35.5)<br />
ZP 854 294(34.4)<br />
(Table 8.17 Contd...)<br />
191
Gender and <strong>Human</strong> <strong>Development</strong><br />
(Table 8.17 Contd...)<br />
Sl. No. State PRI Total elected<br />
representatives<br />
14 Punjab<br />
15 Rajasthan<br />
16 Tamil Nadu<br />
17 Tripura<br />
18 Uttar Pradesh<br />
19 West Bengal<br />
Elected women<br />
representatives<br />
GP 87842 31053(35.3)<br />
PS 2441 326(13.3)<br />
ZP 274 89(32.4)<br />
GP 119419 38791(32.4)<br />
PS 5257 1740(33.1)<br />
ZP 997 331(33.2)<br />
GP 97398 32795(33.6)<br />
PS 6499 2295(35.3)<br />
ZP 648 225(34.7)<br />
GP 5685 1895(33.3)<br />
PS 299 105(35.1)<br />
ZP 82 28(34.1)<br />
GP 682670 174410(25.5)<br />
PS 58165 14002(24.0)<br />
ZP 2551 648(25.4)<br />
GP 50345 17907(35.5)<br />
PS 8579 3015(35.1)<br />
ZP 723 246(34.0)<br />
Notes:<br />
GP: Gram Panchayat; PS: Panchayat Samiti; ZP: Zilla Panchayat.<br />
*: Scheduled Tribes (ST);<br />
**: Revised Figures; NA: Not Available;<br />
#: Figures are for the new Madhya Pradesh as of 1st November 2000 and fi gures in parenthesis are the percentages to the totals.<br />
Sources:<br />
1. G. Mathew, ed., 2000. Status of Panchayat Raj in the States and Union Territories of India, 2000, New Delhi: Institute of Social<br />
Sciences, Concept Publication.<br />
2. R.C. Choudhury, and S.P. Jain, 1998, India: Rural <strong>Development</strong> <strong>Report</strong>. Hyderabad: NIRD, cited in Vasanthi Raman, 2002, ‘The<br />
Implementation of Quotas for Women: The Indian Experience.’<br />
TABLE 8.18<br />
Women in decision-making positions in PRIs<br />
(Per cent)<br />
State<br />
Women as GP<br />
chairpersons<br />
Women as PS<br />
chairpersons<br />
Women as ZP<br />
chairpersons<br />
Andhra Pradesh - 33.76 30.00<br />
Himachal Pradesh 36.62 31.94 33.33<br />
<strong>Karnataka</strong> 33.33 33.71 35.00<br />
Madhya Pradesh 38.66 26.80 37.78<br />
Manipur 33.13 - 50.00<br />
Uttar Pradesh 33.81 41.29 30.26<br />
West Bengal 4.62 3.00 0.00<br />
India 40.10 33.75 32.28<br />
Note: GP: Gram Panchayat; PS: Panchayat Samiti; and ZP: Zilla Panchayat.<br />
Source: Government of India, cited in Vasanthi Raman, 2002, ‘The Implementation of Quotas for Women: The Indian<br />
Experience’ in the Implementation of Quotas: Asian Experiences, Quota Workshop <strong>Report</strong> Series.<br />
elsewhere, often have to face harassment, verbal<br />
and physical. Women activists are often concerned<br />
about a lack of gender sensitivity among EWRs<br />
who represent known dominant concerns of the<br />
caste/community and do not seem to show any<br />
extra ordinary concern in this phase for specifi c<br />
gender-related issues.<br />
The fact that initially new EWRs strongly identify<br />
and align with and represent dominant concerns,<br />
and adopt postures that do not challenge<br />
entrenched power structures can be attributed in<br />
part to an attempt to negotiate their transition into<br />
new situations and roles. Interviews with EWRs<br />
also highlight women’s growing enchantment<br />
with newly acquired positions of power: ‘True<br />
192
we came through our men the fi rst time and are<br />
often proxies for them, but we now know what<br />
it is about and will come on our own the next<br />
time’ (Singamma Sreenivasan Foundation,<br />
2003).<br />
A different scenario awaited second-term EWRs.<br />
This time the government and NGOs were geared<br />
and ready for them with training in the functioning<br />
of the PRIs, education, health, environment,<br />
greater gender sensitisation and legal literacy.<br />
Capacity building initiatives have strengthened<br />
EWRs’ ability to come into their own, as political<br />
persons. Training has been an important aid in<br />
enabling women to build confi dence and move<br />
towards greater independence. The government<br />
has taken a lead in providing training and<br />
communication support to elected women<br />
members of Panchayat Raj institutions through<br />
a range of methods – satellite-based training<br />
programme, district level training programme<br />
through departmental functionaries and NGOs,<br />
and the distribution of hand books and video<br />
cassettes on the Panchayat Raj Act.<br />
The greatest opportunity in the emergence of<br />
EWRs in such large numbers, however, lies in the<br />
development of women as a political constituency,<br />
and in the EWRs orienting themselves to this<br />
constituency. However, even at its best, this<br />
political axis based on gender, will only work in<br />
relation to the dominant axes of caste and political<br />
groupings.<br />
Women’s activism, therefore, has developed new<br />
forms in the new institutional space of PRIs.<br />
Networking among EWRs and the formation of<br />
federations has enabled greater effectiveness,<br />
and provided a platform for sharing information,<br />
strategies and experiences. Known as ‘okkutta’<br />
these panchayat women's associations in<br />
<strong>Karnataka</strong> are becoming pressure groups for<br />
joint action for women’s empowerment where<br />
earlier individual EWRs had found themselves<br />
unable to make a dent. This phenomenon has<br />
been accompanied by the growing spread<br />
of women’s self-help groups and sanghas<br />
supported by government/donor programmes.<br />
These community based organisations (CBOs)<br />
are emerging as key nodes of women’s<br />
empowerment in rural <strong>Karnataka</strong>. SHGs or<br />
sanghas are important breeding grounds for<br />
effective EWRs. Many sanghas are supporting<br />
and even putting up candidates for PRIs, as is<br />
borne out in the experience of Mahila Samakhya,<br />
<strong>Karnataka</strong>. Surely, these candidates, unlike those<br />
propped up by male relatives, will have their<br />
political constituency specifi cally among women.<br />
Supported through training, and federated for<br />
strength and reach, these EWRs oriented to the<br />
women’s constituency could lead to real political<br />
empowerment of women in rural <strong>Karnataka</strong>.<br />
Conversely, active EWRs have also been setting<br />
up women’s sanghas in their villages, taking<br />
further the process of social, economic and<br />
political empowerment of women.<br />
<strong>Karnataka</strong> <strong>Human</strong> <strong>Development</strong> <strong>Report</strong> <strong>2005</strong><br />
Women’s activism has<br />
developed new forms<br />
in the new institutional<br />
space of PRIs.<br />
BOX 8.3<br />
The <strong>Karnataka</strong> Women’s Information and Resource Centre Project<br />
The <strong>Karnataka</strong> Women’s Information and Resource Centre – an NGO project- has set up federations of EWRs<br />
in 6 districts of <strong>Karnataka</strong> – Bellary, Bidar, Bijapur, Gulbarga, Koppal and Raichur. The purpose is to use the<br />
federations as:<br />
• A support system for EWRs that would facilitate learning through mutual sharing;<br />
• A space for EWRs to share women’s issues which are common across party and other lines;<br />
• A platform for local women politicians to make their collective voice heard right up to the state and<br />
national levels; and<br />
• A medium for associations of EWRs to eventually become a part of the larger women’s movement and get<br />
linked to other coalitions such as the National Alliance for People’s Movements.<br />
Sources:<br />
1. Badari, Bhat, Kolhar and Sharma, 2003.<br />
2. Singamma Sreenivasan Foundation.<br />
193
Gender and <strong>Human</strong> <strong>Development</strong><br />
Assessment<br />
This chapter has examined the recent trends in<br />
<strong>Karnataka</strong> and its major regions in areas that are<br />
key to the question of gender equality in human<br />
development – work and wages, the sex ratio,<br />
women’s autonomy (including violence against<br />
women) and political participation.<br />
Overall, the scene reads:<br />
• Two signifi cant successful policy interventions<br />
comprise giving women housing title deeds<br />
TABLE 8.19<br />
Percentage of women GP members by issues they took up in the<br />
panchayat: Selected districts<br />
Issues Raichur Tumkur Dharwad Hassan Total<br />
Taking up of women’s issues 6.28 5.72 18.46 3.48 8.49<br />
Importance to health and education 26.17 13.02 28.20 15.65 20.76<br />
Providing street lights and water supply 52.87 23.43 40.51 27.83 27.44<br />
Implementation of programmes 53.40 31.25 37.94 49.56 43.03<br />
Drainage construction 27.22 20.83 10.76 2.61 15.35<br />
Others, if any 10.99 2.60 20.00 5.22 9.70<br />
Note: Percentages are based on a total sample size of 804 women GP members.<br />
Source: Sheep and Lambs – An Empirical Study of Women in Local Self Governance in <strong>Karnataka</strong> by F. Stephen and N.<br />
Rajasekaran, 2001.<br />
TABLE 8.20<br />
Percentage of women GP members by their performance across<br />
caste groups<br />
Caste groups<br />
Contacted<br />
officials<br />
Attended<br />
meetings<br />
Participation<br />
level<br />
Level of<br />
awareness<br />
Total<br />
Trained<br />
Scheduled Caste 60.4 88.3 54.0 31.6 137<br />
Scheduled Tribe 74.3 88.9 54.5 23.8 99<br />
Backward Castes 58.8 83.1 57.3 26.6 178<br />
General Category 74.5 94.9 62.2 51.7 255<br />
Total 259 (38.7) 255 (38.1) 259 (38.7) 259 (38.7) 669<br />
Untrained<br />
Scheduled Caste 33.3 61.5 37.0 3.7 26<br />
Scheduled Tribe 33.3 75.0 29.2 8.3 24<br />
Backward Castes 30.2 76.7 37.2 4.7 43<br />
General Category 43.3 82.1 40.0 16.7 28<br />
Total 30 (24.8) 28 (23.1) 30 (24.8) 30 (24.8) 121<br />
Note: Totals are in absolute numbers and cover women GP members who were part of the sample.<br />
Source: Sheep and Lambs – An Empirical Study of Women in Local Self Governance in <strong>Karnataka</strong>’ by F. Stephen and N.<br />
Rajasekaran, 2001.<br />
and providing reservation in recruitment for<br />
government jobs.<br />
• While there has been some improvement<br />
in girls’ access to education, progress is still<br />
slow and large differentials remain.<br />
• The economic position of women in terms<br />
of work participation, the proportion of<br />
marginal workers, the dependence on<br />
agricultural work, the share of agricultural<br />
wage labour, and the differential in<br />
agricultural wages, all point to a signifi cant<br />
worsening in women’s position in the<br />
Hyderabad <strong>Karnataka</strong> region and to a<br />
somewhat lesser extent in the Bombay<br />
<strong>Karnataka</strong> region. The fruits of <strong>Karnataka</strong>’s<br />
economic IT-led boom have defi nitely not<br />
reached women in these regions and their<br />
positions are worse than before.<br />
• Health indicators point to some improvements<br />
but there is a serious situation developing<br />
with respect to HIV incidence among women<br />
in poor, rural areas where the public health<br />
system is already weak.<br />
• The child sex ratio has worsened especially<br />
in the better-off districts, pointing to the<br />
dissonance between overall economic<br />
improvement and human development<br />
and lack of reduction in the aversion to<br />
daughters.<br />
• Violence against women due to the spread<br />
and intensity of dowry demands among<br />
other reasons threatens the lives of women<br />
in all socio-economic groups and regions.<br />
• Elected women’s representatives oriented<br />
to the women’s constituency could lead to<br />
real political empowerment of women in<br />
rural <strong>Karnataka</strong>. Active EWRs have also been<br />
setting up women’s sanghas in their villages,<br />
taking further the process of social, economic<br />
and political empowerment of women.<br />
The assessment also points to some gaps and<br />
limitations. The analytical framework identifi ed<br />
four sets of actions that the government must<br />
undertake in order to protect girls and women<br />
from harm, and promote gender equality as a core<br />
element of human development. The government<br />
should support changes in social norms and<br />
practices; promote key legal/political changes;<br />
194
<strong>Karnataka</strong> <strong>Human</strong> <strong>Development</strong> <strong>Report</strong> <strong>2005</strong><br />
create strong institutions at multiple levels from<br />
the village to the highest levels; and provide<br />
resources and make investments.<br />
The conclusions are that signifi cant changes have<br />
happened in the political sphere, largely due to<br />
the growing involvement of women as EWRs.<br />
Here, <strong>Karnataka</strong> is a pioneer in devolving powers<br />
to PRIs and introducing reservation for women.<br />
Another major area in which change appears<br />
to have occurred is in the proliferation of selfhelp<br />
groups as the prime vehicle for women’s<br />
economic empowerment. The picture here is more<br />
mixed as many groups exist only on paper, and<br />
others are weak in terms of resources, capacity<br />
building, or other support. The conclusion here is<br />
that the potential certainly exists and there are<br />
surprisingly good outcomes, as the survey shows.<br />
This has to be set-off against the results of the<br />
analysis of the trends in the area of work and<br />
wages that point to growing impoverishment of<br />
women and inequality between the regions, and<br />
therefore, greater economic need.<br />
The score card on most other areas of potential<br />
government action shows the need for<br />
improvement. Much more needs to be done to<br />
change social norms and values, or strengthen<br />
the gender sensitivity of the criminal justice<br />
system. Where institutions are concerned, the<br />
key department for the development of women,<br />
children and the disabled is poorly funded, and<br />
weak in terms of staffi ng and capacity. It also<br />
tends to be viewed as marginal and refl ects the<br />
overall perspective of the government, which is<br />
still ‘welfarist’ in its view of women. There is need<br />
for a strategic vision towards gender equality in<br />
which different elements of governmental action<br />
can fi t.<br />
When introduced, the <strong>Karnataka</strong> Mahila<br />
Abhivrudhi Yojane or KMAY (for an analysis,<br />
see chapter 3 Part III) held out the potential<br />
for a truly pioneering effort. But its effects<br />
have been reduced, over time, to a mechanical<br />
counting exercise rather than any real attempt<br />
to mainstream gender into the functioning of<br />
key departments. Perhaps most signifi cant of all<br />
for the theme of this report, the gender audit of<br />
BOX 8.4<br />
Some recommendations of the <strong>Karnataka</strong> Task Force on Women’s<br />
Empowerment<br />
In March 2000, on International Women’s Day, a task force was established to study programmes<br />
and policies for the overall development of women in <strong>Karnataka</strong>. The Task Force on Women<br />
Empowerment submitted its report in September 2002. Some of the important recommendations<br />
made by this task force are:<br />
• A centre for women’s empowerment, which will evaluate the impact of policy and programme<br />
interventions to be established;<br />
• An appropriate mechanism for tracking expenditure of funds earmarked for women to be<br />
set up;<br />
• Reservation for women in all commissions and boards/councils that the government sets<br />
up;<br />
• 50 per cent reservation for the development of women and girl children in the area<br />
development fund of legislators;<br />
• A Women’s Protection Cell to be set up at every village;<br />
• A women’s university to be established in <strong>Karnataka</strong>;<br />
• Special centres that provide training for competitive exams for the IAS and KAS need to be<br />
set up for girls;<br />
• The government should sanction additional funds for girls’ education for the next three<br />
years;<br />
• All committees constituted at the local level for development programmes and schemes<br />
must have 50 per cent reservation for women;<br />
• Part-time employment for women should be encouraged through policy intervention,<br />
especially in the private sector;<br />
• The Stree Shakti scheme must be expanded, and Stree Shakti groups need to be linked<br />
with creches, with food preparation for anganwadis, stitching uniforms and bags for school<br />
students, running PDS shops, and with NABARD; and<br />
• Information about laws and legal redressal must be compiled in a comprehensive publication<br />
and made available to all government agencies.<br />
budgets and fi nancing points to insuffi ciency in<br />
the availability of resources for women.<br />
Recommendations<br />
<br />
First, it is critical to ensure there is an effective<br />
and well-resourced lead institution to<br />
spearhead action. Experience the world over<br />
indicates that women’s departments, ministries<br />
and bureaus remain weak, poorly resourced<br />
and marginal in their impact unless they are<br />
effectively placed within the government.<br />
Currently, the triple responsibility of DWCD for<br />
women, children and disabled people means<br />
there is inadequate focus on gender. Women<br />
number almost half of the people of the state<br />
and a separate focus is essential if their current<br />
marginalisation is to change. This department<br />
195
Gender and <strong>Human</strong> <strong>Development</strong><br />
needs to be adequately resourced, which is<br />
very far from being the case at present.<br />
Second, the department should be renamed<br />
the department for Women’s Empowerment<br />
and Gender Equality. <strong>Karnataka</strong> would be<br />
the fi rst to do this.<br />
The department must develop a strategic<br />
plan with clear timelines, achievable short<br />
and long-term goals, and clear actions<br />
to meet those goals. In developing the<br />
strategy (including a vision and mission),<br />
the department should interact closely<br />
with people’s representatives, civil society,<br />
academics and NGOs.<br />
The effort at mainstreaming through KMAY<br />
must be given greater direction and focus so<br />
that the departments involved can have their<br />
capacity for doing work for gender equality<br />
signifi cantly improved.<br />
Top priority should be given to improving<br />
women’s economic situation in the Hyderabad<br />
and Bombay <strong>Karnataka</strong> regions.<br />
There is urgent need to increase girls’<br />
enrolment in secondary education throughout<br />
the state and especially in the northern<br />
districts.<br />
Improvements in the healthcare system<br />
especially in the Hyderabad <strong>Karnataka</strong> region,<br />
and with special attention to the feminisation<br />
of HIV/AIDS are of critical importance to<br />
preventing a major health disaster.<br />
The department should develop a major public<br />
education campaign against sex selection,<br />
dowry, and violence against women. This<br />
needs to be coordinated with the police and<br />
legal system where gender sensitisation and<br />
accountability need strengthening.<br />
Improvements are required in the data<br />
and information systems that will allow<br />
the effective monitoring and review of<br />
programmes for gender equality.<br />
These changes can provide the strategic focus and<br />
direction that is missing at present. They constitute<br />
the next step towards fulfi lling the promise of full<br />
and equal citizenship that the Constitution of<br />
India makes towards the women of the state and<br />
the country.<br />
196
<strong>Karnataka</strong> <strong>Human</strong> <strong>Development</strong> <strong>Report</strong> <strong>2005</strong><br />
BOX 8.5<br />
Stree Shakti and Swashakti women’s self-help groups: A Survey<br />
Introduction<br />
There are over 1,95,585 self-help groups<br />
(SHGs) in <strong>Karnataka</strong> under various departmental<br />
programmes, the majority of which are WSHGs or<br />
women’s self-help groups, a strategy which has<br />
emerged world wide as the single most signifi cant<br />
economic development programme for women.<br />
An SHG is a small (12-20) group of poor people<br />
who voluntarily come together to address their<br />
poverty and other social issues. The core activity is<br />
mobilisation of small savings from group members<br />
and group lending from accumulated savings<br />
as well as bank loans. It is for this reason that<br />
SHGs are also known as microfi nance or microcredit<br />
institutions. Poor people who are viewed<br />
as security risks by the formal banking system<br />
are, thus, enabled to access small loans for both<br />
income generation and consumption purposes.<br />
The SHG also offers its members a much-needed<br />
space for dealing with economic, social and family<br />
problems in a group environment. This process,<br />
can contribute considerably to the ‘empowerment’<br />
of SHG members though the actual effects of<br />
such empowerment may often be transitory or<br />
insubstantial if the programme design fails to<br />
support empowerment enhancing in a concrete<br />
manner.<br />
As some writers 2 have observed, both<br />
governments and donor agencies are promoting<br />
microfi nance programmes as a blueprint for<br />
simultaneously dealing with both poverty<br />
alleviation and women’s empowerment.<br />
Identifi ed improvements include not merely<br />
an increase in women’s income levels but also<br />
control over their income; greater appreciation<br />
of women’s contribution to the family income<br />
leading to a perceptibly stronger role in<br />
household decision-making about expenditure,<br />
children’s education, marriage of daughters and<br />
overall family welfare, and an enhancement<br />
2<br />
Linda Mayoux,1997.<br />
of women’s participation in community<br />
decision-making resulting in more political space<br />
for women.<br />
In <strong>Karnataka</strong>, conveying services to poor<br />
women through self-help groups has emerged<br />
as the dominant strategy for combating female<br />
poverty. The state has several programmes<br />
running SHGs and two of the most signifi cant<br />
schemes in terms of funding and outreach are<br />
Stree Shakti and Swashakti, both of which are<br />
implemented by the Department of Women and<br />
Child <strong>Development</strong>. In terms of magnitude,<br />
Stree Shakti is amazing: on July 1, <strong>2005</strong>, the<br />
programme had 1,00,000 groups with an<br />
accumulated savings of Rs.2,88,55,99,002;<br />
62,281 groups have taken loans of<br />
Rs.2,69,30,68,612 from lending institutions<br />
and disbursed loans of Rs.7,30,40,29,967;<br />
Rs.5,11,30,55,592 has been repaid to SHGs and<br />
a sum of Rs.1,94,81,32,653 has been repaid to<br />
banks. Swashakti was a smaller programme, cofi<br />
nanced by IFAD-IDA and it closed in June <strong>2005</strong>.<br />
The <strong>Karnataka</strong> State Women’s <strong>Development</strong><br />
Corporation (KSWDC) managed the Swashakti<br />
scheme to form SHGs through NGOs in 7<br />
districts – Kolar, Tumkur, Chitradurga, Bellary,<br />
Koppal, Raichur and Gulbarga. Thirty-six NGOs<br />
had been contracted to work in 979 project<br />
villages, and they formed 2,100 SHGs with<br />
38,508 members.<br />
Objectives of the study<br />
The single largest government sponsored<br />
economic development programme for women<br />
employs the SHG strategy but, with self-help<br />
groups having their origins in NGO-driven projects,<br />
there is some scepticism about the government’s<br />
capacity to manage such programmes, more<br />
specifi cally when they have been upscaled very<br />
rapidly as with Stree Shakti. The objectives<br />
of the study were to assess the performance<br />
and measure the impact of the SHGs formed<br />
under two government sponsored programmes,<br />
In <strong>Karnataka</strong>, conveying<br />
services to poor women<br />
through self-help<br />
groups has emerged as<br />
the dominant strategy<br />
for combating female<br />
poverty.<br />
197
Gender and <strong>Human</strong> <strong>Development</strong><br />
Scheduled Caste women<br />
form more than half of the<br />
membership of the<br />
SHGs surveyed, with<br />
Scheduled Tribes,<br />
minorities and backward<br />
classes constituting<br />
another sizable<br />
26 per cent of<br />
the members. The<br />
composition of the groups<br />
therefore is well weighted<br />
in favour of the more<br />
vulnerable socio-economic<br />
sub-groups.<br />
Stree Shakti and Swashakti, with reference to:<br />
• The functioning of SHGs as micro-credit<br />
institutions;<br />
• Their effectiveness in reducing poverty;<br />
• Their effectiveness as gender empowerment<br />
catalysts;<br />
• Their role in effecting changes, if any,<br />
in women’s status in the family and the<br />
community;<br />
• Their effectiveness as agents of socioeconomic<br />
change; and<br />
• The adequacy of inputs provided to SHGs by<br />
government.<br />
Methodology<br />
The survey was conducted along with a sample<br />
survey of the Scheduled Castes and Tribes (SCs<br />
and STs) by the Department of Economics and<br />
Statistics (DES 2004B) although the two studies<br />
are separate and distinct. However, SHGs formed<br />
from 2000-01 onwards, under Stree Shakti and<br />
Swashakti, have been selected primarily from<br />
the very same villages sampled for the SC/ST<br />
survey. One distinct advantage of conducting<br />
this study along with the study on SCs and STs<br />
is that the sample gives fair representation to SC<br />
and ST women who are among the most socioeconomically<br />
underprivileged people in their<br />
villages. Out of the 411 selected SHGs, 373 are<br />
Stree Shakti SHGs and 38 are Swashakti groups.<br />
After the selection of an SHG, a maximum number<br />
of 10 group members was selected randomly and<br />
schedules canvassed.<br />
Profile of SHGs<br />
Of the 2,753 self-help groups in the selected (for<br />
the Sample Survey) villages and SC/ST habitations<br />
with a gross membership of 38,330, a high 91<br />
per cent (2,513) were functional on the date of<br />
survey (November 2004). The non-functioning of<br />
some groups was attributed to great poverty (87<br />
per cent of the membership was below the poverty<br />
line) and low literacy levels of the members (37<br />
per cent) as well as lack of motivation and capacity.<br />
The average membership per SHG was about 14.<br />
The formation of 77 per cent (315) of the surveyed<br />
groups (411) was facilitated by anganwadi workers<br />
(AWs), 8 per cent (32) by NGOs, 7 per cent (31)<br />
by government agencies/offi cials, 2 per cent (8) by<br />
banks, 3 per cent (12) by gram panchayats and 3<br />
per cent (13) by others.<br />
As Table 8.5.1 reveals, Scheduled Caste women<br />
form more than half of the membership of the<br />
SHGs surveyed, with Scheduled Tribes, minorities<br />
and backward classes constituting another sizable<br />
26 per cent of the members. The composition of<br />
the groups therefore is well weighted in favour of<br />
the more vulnerable socio-economic sub-groups.<br />
There is also homogeneity among members in<br />
Division 3<br />
TABLE 8.5.1<br />
Distribution of SHG members by social groups<br />
No. of<br />
SHGs<br />
Number of members<br />
SCs STs Minorities Backward<br />
classes<br />
Others<br />
Bangalore 137 1221 (52) 241 (10) 90 (4) 279 (12) 525 (22) 2356<br />
Mysore 97 1030 (58) 199 (11) 19 (1) 158 (9) 380 (21) 1786<br />
Gulbarga 95 1033 (50) 418 (20) 50 (2) 206 (10) 372 (18) 2079<br />
Belgaum 82 684 (53) 177 (14) 43 (3) 70 (5) 327 (25) 1301<br />
State total 411 3968 (53) 1035 (14) 202 (3) 713 (9) 1604 (21) 7522<br />
Note: Figures in parenthesis are the percentages to total number of SHGs.<br />
Total<br />
3<br />
The erstwhile revenue divisions are: Bangalore (comprising Bangalore Urban and Rural, Tumkur, Kolar, Shimoga, Chitradurga and<br />
Davangere districts), Mysore (Mysore, Chamarajnagar, Mandya, Kodagu,, Hassan, Chikmaglur, Udupi and Dakshina Kannada districts),<br />
Belgaum (Belgaum, Dharwad, Gadag, Haveri, Bijapur, Bagalkot and Uttara Kannada districts) and Gulbarga (Gulbarga, Bidar, Bellary,<br />
Koppal and Raichur districts).<br />
198
<strong>Karnataka</strong> <strong>Human</strong> <strong>Development</strong> <strong>Report</strong> <strong>2005</strong><br />
FIGURE 8.5.1<br />
Distribution of SHG members by social groups<br />
70<br />
60<br />
50<br />
52<br />
58<br />
50<br />
53<br />
53<br />
Per cent<br />
40<br />
30<br />
20<br />
10<br />
0<br />
22<br />
10 12<br />
4<br />
Bangalore<br />
12 11<br />
21 20<br />
18<br />
9<br />
10<br />
2<br />
5<br />
1<br />
2<br />
4 5<br />
3<br />
Mysore Gulbarga Belgaum State Total<br />
14<br />
25<br />
14<br />
3<br />
9<br />
21<br />
SCs STs Minorities Backward Classes Others<br />
terms of geographic location (88 per cent) and a<br />
shared socio-economic background (75 per cent).<br />
This is a critical element in facilitating harmonious<br />
and cooperative group dynamics since disparities<br />
of caste, class or even location can be formidable<br />
barriers to ensuring the formation of a cohesive<br />
WSHG.<br />
Chairpersons<br />
The literacy rate among the chairpersons<br />
(60 per cent) of the groups is higher than the state<br />
female literacy rate (57 per cent). Of the literate<br />
women, 25 per cent had studied up to class VII<br />
16 per cent had studied from classes VIII to X<br />
(but failed the SSLC), 14 per cent (59) had passed<br />
the SSLC, and 6 per cent (23) had studied up<br />
to PUC (class XII). The majority of chairpersons<br />
(46 per cent) are between 21 and 34 years<br />
of age, and 37 per cent are in the age group<br />
35–54 years and a sizable number, 14 per cent are<br />
very young women, below 21 years. The relative<br />
youthfulness of the chairpersons is an interesting<br />
trend. The economic profi le of the chairpersons<br />
shows that 87 per cent are below the poverty<br />
line (BPL). Half of them are either casual workers<br />
or daily wage earners, 15 per cent are from the<br />
farming community, 16 per cent work at home,<br />
9 per cent are from the salaried class, and 4 per<br />
cent operate micro businesses. Nearly two-third of<br />
the chairpersons are SCs, 14 per cent are STs, 5<br />
per cent are from the minorities, 7 per cent from<br />
the backward classes and 13 per cent are from<br />
other communities.<br />
Office bearers<br />
The educational qualifi cations of the offi ce bearers<br />
of the SHGs also indicate a relatively high level of<br />
literacy (54 per cent). Overall, chairpersons have<br />
better educational attainments than offi ce bearers.<br />
Close to one-third had studied up to class VII,<br />
12 per cent between class VIII and X, 7 per cent<br />
had passed the SSLC, and 2 per cent had passed<br />
PUC and 1 per cent were graduates. Age-wise,<br />
offi ce bearers are a youthful lot, with over half in<br />
the age group 21-34 years, 32 per cent in the age<br />
group 35-54 years, and 12 per cent of the offi ce<br />
bearers were very young, less than 21 years.<br />
A high 88 per cent of the offi ce bearers are BPL.<br />
Nearly two out of three of the offi ce bearers are<br />
either daily wage or casual workers, 8 per cent are<br />
from the salaried class and a mere 2 per cent are<br />
from petty/small trade, 10 per cent work at home<br />
performing house work.<br />
The data clearly indicates that (i) there is<br />
homogeneity in the composition of the SHG in<br />
terms of age and socio-economic characteristics<br />
while educational attainments show considerable<br />
variation and (ii) the chairpersons and offi ce<br />
bearers share the main characteristics of group<br />
members and, in that sense, are eminently<br />
suitable representatives. Neighbourhood based<br />
groups with a homogeneity of interests and a<br />
decentralised style of functioning ideally perform<br />
better as platforms for women’s participation than<br />
heterogeneous groups with disparities between<br />
members.<br />
199
Gender and <strong>Human</strong> <strong>Development</strong><br />
FIGURE 8.5.2<br />
Category-wise distribution of SHG members by economic status<br />
90<br />
87<br />
80<br />
70<br />
Per cent<br />
60<br />
50<br />
40<br />
30<br />
20<br />
10<br />
0<br />
57<br />
SCs<br />
13<br />
STs<br />
2<br />
Minority<br />
5<br />
Backward<br />
10<br />
Others<br />
Total<br />
7<br />
SC<br />
1 1 1 3<br />
ST<br />
Minority<br />
Backward<br />
Others<br />
13<br />
Total<br />
Below Poverty Line<br />
Above Poverty Line<br />
If success were to be<br />
measured by attendance<br />
then the SHGs show<br />
a high degree of<br />
performance with regular<br />
member participation<br />
touching 84 per cent and<br />
only 13 per cent attending<br />
meetings occasionally.<br />
As many as 92.4 per cent<br />
reported participating<br />
in discussions and<br />
81.4 per cent in<br />
decision-making.<br />
If success were to be measured by attendance<br />
then the SHGs show a high degree of performance<br />
with regular member participation touching 84<br />
per cent and only 13 per cent attending meetings<br />
occasionally. As many as 92.4 per cent reported<br />
participating in discussions and 81.4 per cent in<br />
decision-making.<br />
Programme inputs<br />
Training<br />
A short training in book keeping, some capacity<br />
building and vocational training is offered<br />
under Stree Shakti. There is a consensus among<br />
members that training is both necessary and<br />
useful but less than half (49 per cent) expressed<br />
FIGURE 8.5.3<br />
Educational status among office<br />
bearers of SHGs<br />
SSLC<br />
7%<br />
PUC<br />
2%<br />
Graduate<br />
1%<br />
satisfaction with the training on offer and<br />
27 per cent observed it was not conducted in<br />
time. Under Swashakti, group members received<br />
training in programme objectives (banking, group<br />
dynamics, and accounts) as well as gender, health<br />
and legal literacy. This was followed, in the second<br />
year of the project, by training to improve their<br />
vocational base in farm and non-farm activities.<br />
Revolving funds<br />
Each Stree Shakti group is eligible for revolving<br />
funds of Rs.5,000 sanctioned by Government<br />
to jump start savings/lending. Of the 291 Stree<br />
Shakti SHGs that were eligible for revolving funds,<br />
as many as 93 per cent had received the grants.<br />
Incentives<br />
Under Stree Shakti, if an SHG saves between<br />
Rs.75,000 and Rs. 1,00,000, the government<br />
gives an incentive of Rs.15,000 and Rs.20,000<br />
if savings are more than Rs.1 lakh. None of the<br />
SHGs surveyed had savings above Rs.25,000.<br />
Microfinance<br />
Std. VIII-X<br />
12%<br />
Std. VII<br />
32%<br />
Illiterate<br />
46%<br />
Savings accounts<br />
In 361 SHGs or 87 per cent, every member had<br />
opened a savings account in a bank.<br />
Linkages with lending institutions<br />
SHGs have several sources of working capital,<br />
i.e. members’ savings, revolving funds from<br />
200
the government and credit from fi nancial<br />
institutions that lend to SHGs in the ratio of 1:10.<br />
Grameen banks contributed a third of the credit<br />
leveraged by groups from fi nancial institutions<br />
with Scheduled banks coming second with<br />
26.8 per cent, cooperative banks contributed<br />
17.3 per cent and 5.4 per cent came from NABARD.<br />
Seventy three per cent of the SHGs repaid loan<br />
instalments regularly. In the remaining cases,<br />
a high 66 per cent said that they had defaulted<br />
on repayments because their members were not<br />
repaying loans in time and 21 per cent admitted<br />
to not having control over their members so they<br />
could not enforce repayment.<br />
SHGs received loans at fairly stiff rates of interest: in<br />
47.2 per cent of SHGs, the interest was 10 per cent,<br />
in 28 per cent of the SHGs, the interest charged<br />
was over 15 per cent and in 10 per cent of the<br />
cases, interest ranged between 10 and 12 per cent.<br />
This in turn, led to SHGs charging their members<br />
a fairly high rate of interest: 54.7 per cent of the<br />
groups charged 15 per cent on loans to members<br />
and 42.1 per cent charged less than 10 per cent.<br />
Micro-credit does not come cheaply.<br />
Lending profile<br />
A sum of Rs. 114.25 lakh has been disbursed<br />
as loans to 63 per cent of SHG members. Of the<br />
members who received credit, about 47 per cent<br />
are BPL. About 5 per cent found it diffi cult to<br />
get loans for various reasons such as not having<br />
repaid an earlier loan and because they sought<br />
frequent loans. A very high 73.4 per cent had<br />
taken one loan, 21.2 per cent had taken two loans,<br />
3.7 per cent had taken three loans and 1.8<br />
per cent had taken four loans. Loan amounts were<br />
for small sums, ranging from less than Rs.1,000 to<br />
over Rs.10,000. The largest number of loans was<br />
for amounts in the range of Rs.1,000-2,500 (44.4<br />
per cent) and Rs.2,500-5,000 (18.5 per cent).<br />
The region-wise break up of BPL members who<br />
accessed credit is as follows: Bombay <strong>Karnataka</strong>:<br />
65 per cent, Hyderabad <strong>Karnataka</strong>: 30.8 per cent<br />
and south <strong>Karnataka</strong>: 53.19 per cent.<br />
This raises a very crucial issue from the perspective<br />
of the effectiveness of these programmes as a<br />
poverty reduction strategy. These SHGs have a BPL<br />
membership of 87 per cent, yet only 47 per cent of<br />
the loans were disbursed to BPL women, indicating<br />
that the most economically vulnerable women are<br />
not accessing credit. Since loans are given based<br />
on individual member’s savings, it would seem BPL<br />
members could not leverage loans because they did<br />
not save enough. The absorption with repayment<br />
also means that SHGs may exclude those likely to<br />
have diffi culties in repaying loans, i.e. the poorest.<br />
Purpose for which loans were taken<br />
About 45 per cent of the loans were taken for<br />
economic activities: income generation activities<br />
(24.70), on-farm activities (13.3), and business<br />
(7.2). The remaining could be classifi ed as<br />
consumption loans: house construction (11.1 per<br />
cent), festivals/functions (10.7), healthcare (9.2)<br />
and children’s education (8).<br />
Loan repayment by members<br />
Repayment of loans shows 86.6 per cent<br />
compliance. Apparently, in countries as diverse as<br />
Bangladesh, Benin, the Philippines and Dominica,<br />
IFAD reports that repayment is as high as<br />
96-97 per cent. The main reasons members<br />
cited for non-payment of loan instalments were<br />
fi nancial constraints and pressure from the spouse<br />
or the family to defer repayment.<br />
How important is the micro-credit function of the<br />
SHG to its members? Very important, since other<br />
sources of credit were insignifi cant: friends and<br />
relatives helped 12.2 per cent of the members<br />
while another six per cent turned to moneylenders.<br />
Sixteen per cent of the members still owed<br />
money on loans ranging from less than Rs.1,000<br />
(19 per cent) and over Rs.10,000 (17 per cent).<br />
Impact<br />
The impact of microfi nance goes beyond income<br />
generation, as discussed earlier. The impact on<br />
women’s social, community and gender roles has<br />
also been studied in the survey. Impacts can vary<br />
within schemes and between women. There are<br />
differences between women engaged in different<br />
productive activities. Sometimes those who are<br />
better-off are able to access credit to the detriment<br />
of the poorer members. Then there are individual<br />
<strong>Karnataka</strong> <strong>Human</strong> <strong>Development</strong> <strong>Report</strong> <strong>2005</strong><br />
Grameen banks<br />
contributed a third of the<br />
credit leveraged by groups<br />
from financial institutions.<br />
SHGs have a BPL<br />
membership of<br />
87 per cent, yet only<br />
47 per cent of the loans<br />
were disbursed to BPL<br />
women, indicating that<br />
the most economically<br />
vulnerable women are not<br />
accessing credit. Since<br />
loans are given based<br />
on individual member’s<br />
savings, it would seem<br />
BPL members could not<br />
leverage loans because<br />
they did not save enough.<br />
201
Gender and <strong>Human</strong> <strong>Development</strong><br />
differences between women engaged in similar<br />
activities. One may be a good entrepreneur and<br />
another may lack initiative (Mayoux, 1997). 4<br />
Hence, it is diffi cult to expect identical outcomes<br />
from all microfi nancing SHGs.<br />
Economic benefits<br />
Often, a microfi nance scheme is judged purely<br />
in terms of mobilisation of savings, lending and<br />
repayment. The larger issue of reducing women’s<br />
economic exploitation by either the market or her<br />
family is not factored when preparing report cards<br />
even while organisers loudly proclaim the scheme<br />
is emancipating. Emancipation, however, does not<br />
just happen as a by-product of microfi nance.<br />
Members reported an improvement in incomes<br />
and the percentage of BPL members went<br />
down from 87 per cent to 77.2 per cent while<br />
the percentage of members above the poverty<br />
line (APL) increased from 13 per cent to 22.8<br />
per cent. As Table 8.22 reveals, the number of<br />
women with a monthly income below Rs.1,000<br />
declined by 18 per cent while the numbers in<br />
all other income categories increased, i.e. by<br />
12 per cent in categories two and three, and by as<br />
much as 26 per cent in category four.<br />
After such improvements, husbands’ contributions<br />
to family income have sometimes come down but<br />
here an overwhelming 90 per cent said it did not<br />
happen.<br />
Linkages with other government<br />
programmes<br />
SHGs are encouraged to avail of benefi ts<br />
under various government programmes, the<br />
assumption being that they are now more<br />
articulate and aware of what they can access<br />
under government schemes and have the ability<br />
to get resources from departments. This is not<br />
always the case. Only a quarter had participated<br />
in mass literacy campaigns, health campaigns,<br />
and the midday meal scheme (Akshara Dasoha)<br />
respectively, 15 per cent were involved with<br />
the public distribution system (PDS), and less<br />
than 10 per cent in watershed development,<br />
desilting tanks, SGSY and other employmentgeneration<br />
activities. Overall, the level of<br />
linkages and interface with existing programmes<br />
is low.<br />
Control over money<br />
For concrete economic empowerment to take<br />
place, women should ideally have autonomy over<br />
their own incomes. The survey looked at economic<br />
autonomy from two perspectives: freedom to<br />
spend and control over savings. In each category,<br />
the number of women reporting full autonomy<br />
went up considerably (Table 8.5.3).<br />
Members’ autonomy in family decision-making<br />
increased most remarkably with reference to<br />
construction/repair of their houses where the<br />
percentage of members making the decision<br />
on their own shot up from 3.3 to 80.2 per<br />
cent. Consultation with family before buying<br />
household articles decreased only marginally from<br />
71.3 to 68.2 per cent and actually increased,<br />
from 72.5 to 83.7 per cent when buying durable<br />
goods. Overall, members’ dependence on ‘others’<br />
came down thereby pushing up the percentage of<br />
members who made decisions on their own from<br />
14.5 to 25.7 per cent regarding buying household<br />
No. of SHG<br />
Members<br />
TABLE 8.5.2<br />
SHG members reporting an improvement in monthly income after<br />
joining the group<br />
Category 1:<br />
< Rs.1,000<br />
Category 2:<br />
Rs.1,000-1,500<br />
Category 3:<br />
Rs.1,500-2,500<br />
Category 4:<br />
Rs.2,500 and above<br />
Before After Before After Before After Before After<br />
Numbers 1846 1505 894 1004 896 1009 448 566<br />
Percentage 45.20 36.90 21.90 24.60 22.00 24.70 11.00 13.90<br />
4<br />
Linda Mayoux, 1997, ‘The Magic Ingredient? Microfi nance and Women’s Empowerment’ http://www.gdrc.org/icm/wind/magic.html.<br />
202
<strong>Karnataka</strong> <strong>Human</strong> <strong>Development</strong> <strong>Report</strong> <strong>2005</strong><br />
TABLE 8.5.3<br />
Autonomy levels of SHG members<br />
Extent of<br />
freedom<br />
Freedom to<br />
spend<br />
Control over<br />
savings<br />
Before After Before After<br />
Full 35.0 54.4 36.5 58.3<br />
Partly 36.4 34.5 36.4 32.0<br />
None 28.5 11.1 27.2 9.8<br />
goods and buying durable goods (from 10.8 to<br />
14.3 per cent). Disappointingly, the spillover into<br />
other critical areas such as sending children to<br />
school and medical expenditure was minimal.<br />
There has been little signifi cant improvement in<br />
women’s autonomy here.<br />
Decision to take loans<br />
Before joining the SHG, 66.8 per cent of the<br />
women reported consulting the family before<br />
taking a loan and 19.4 per cent decided on their<br />
own. After joining the SHG, dependence on the<br />
family declined to about 61 per cent while the<br />
percentage of members making decisions on<br />
their own increased to 33.5 per cent.<br />
Problems encountered<br />
A signifi cant majority did not encounter resistance<br />
from spouses or older family members while they<br />
dealt with the process of group membership. The<br />
majority faced no objections regarding the training<br />
programme (89 per cent), dealing with banks and<br />
offi ces (62.2), and spending time on committee<br />
work (56.6) and dealing with other members’<br />
family problems (53.0).<br />
Women’s definition of programme<br />
objectives<br />
Over 96 per cent agreed that encouraging<br />
savings was the principal objective, followed by<br />
improving access to credit (86.6), and income<br />
generation (86.1). Improving women’s status in<br />
the family (82.0) and in the community (75.4)<br />
was also perceived as an important objective of<br />
the programme. Developing group action (74.4),<br />
improving vocational skills (71.4) and enabling<br />
access to markets (63.4) which are the core<br />
objectives of SHGs, have obviously not made a<br />
strong impact on women’s consciousness.<br />
Why did they become members?<br />
A high percentage (65.9) joined SHGs because<br />
they encouraged savings, 17.3 per cent saw it as<br />
a way of enhancing their social status and only<br />
14.9 per cent had wanted to avail of credit.<br />
What did they gain?<br />
Clearly, members perceive that belonging to a<br />
sangha enhances their social status and leads<br />
to a sense of self-worth. An impressive 79.3<br />
per cent saw their status in the family improving<br />
signifi cantly and 71.2 per cent saw this<br />
translating into an improvement in their status<br />
in the community. There was an increase in social<br />
networking (66.3) and greater participation in<br />
social, cultural and political activities.<br />
Changes in family relations<br />
A third of the women noted that their spouses<br />
and/or other family members had altered habits<br />
such as smoking, drinking and using tobacco/pan<br />
masala but another third had seen no changes.<br />
Did women see any changes in their lives in the<br />
context of violence meted out to them by spouses<br />
and other family members? Of the 4,084 women<br />
canvassed only a quarter chose to respond. This,<br />
itself is signifi cant since domestic violence is not a<br />
subject many women like to acknowledge. Those<br />
who responded saw a more than 50 per cent<br />
reduction in physical violence arising out of issues<br />
such as dowry, childlessness, no son, quarrels over<br />
property with the spouse and in-laws.<br />
Improvement in knowledge/skills/<br />
awareness<br />
Programme goals in both Stree Shakti<br />
and Swashakti include increasing women’s<br />
knowledge and awareness on a number of<br />
levels ranging from managing an SHG, soft skills<br />
such as leadership and communication skills, to<br />
sensitisation about gender, health, education<br />
etc. Ideally, participation in SHGs, by providing<br />
women with access to markets and enabling an<br />
interface with institutions such as banks and<br />
government agencies, promotes the accumulation<br />
of skills and knowledge in participants. More than<br />
half the women surveyed said they were aware<br />
of issues relating to children’s education, health<br />
and sanitation and family planning. The role of<br />
Programme goals in<br />
both Stree Shakti and<br />
Swashakt include<br />
increasing women’s<br />
knowledge and<br />
awareness on a number<br />
of levels ranging from<br />
managing an SHG, soft<br />
skills such as leadership<br />
and communication<br />
skills, to sensitisation<br />
about gender, health and<br />
education.<br />
203
Gender and <strong>Human</strong> <strong>Development</strong><br />
FIGURE 8.5.4<br />
Women reporting changes in status after becoming SHG members<br />
Per cent<br />
90<br />
80<br />
70<br />
60<br />
50<br />
40<br />
30<br />
20<br />
10<br />
0<br />
79<br />
Status improved<br />
in the family<br />
SHGs had satisfactorily<br />
mediated property issues,<br />
ill treatment by spouses,<br />
family quarrels about<br />
money, marital problems<br />
and advising members<br />
about addictive habits like<br />
smoking, using pan and<br />
tobacco.<br />
71<br />
Status improved<br />
in the community/<br />
society<br />
59<br />
Representation in the<br />
social/cultural/political<br />
activities increased<br />
the anganwadi worker in imparting information<br />
about healthcare, nutrition and pre-school<br />
education is an important aspect of the ICDS or<br />
Integrated Child <strong>Development</strong> Scheme. Since the<br />
anganwadi worker is also the facilitator for the<br />
Stree Shakti groups, it is clear that she uses the<br />
group as a forum for imparting information about<br />
health and education quite successfully. Over 40<br />
per cent claim to have derived improved levels of<br />
knowledge, skills and awareness in many other<br />
areas including gender equality (Table 8.5.4).<br />
Community participation<br />
Participation in gram sabhas or village assemblies,<br />
which are statutory bodies constituted under<br />
the <strong>Karnataka</strong> Panchayat Raj Act 1993 where<br />
many decisions are made regarding selection of<br />
works or benefi ciaries under various schemes,<br />
is a crucial fi rst step into both community and<br />
political space for women and other marginal<br />
sub-populations. As many as 83 per cent had<br />
attended gram sabhas, with 38.4 per cent attending<br />
6–10 gram sabhas and 24.8 per cent attending<br />
two to fi ve meetings. This level of participation in a<br />
scenario where many villagers do not attend gram<br />
sabhas regularly is very good. A small number<br />
(11.4 per cent) had been elected to local bodies and<br />
18.0 per cent were members of political parties.<br />
Community and social activism<br />
The performance of SHGs in dealing with<br />
community and social issues is disappointing.<br />
66<br />
Family social<br />
contacts increased<br />
About 30 per cent of the members had dealt<br />
with anti-child marriage issues. Anti-dowry<br />
(8), domestic violence (4.9), girls’ education<br />
(3.6), village sanitation (5.3), interacting<br />
with local offi cials for improved services (3.6)<br />
barely fi gure.<br />
SHGs did better when it came to helping<br />
members sort out personal problems. SHGs<br />
had satisfactorily mediated property issues (78<br />
per cent), ill treatment by spouses (76), family<br />
quarrels about money (53), marital problems<br />
(33) and advising members about addictive<br />
habits like smoking, using pan and tobacco (21).<br />
This indicates that women’s collectivism can and<br />
does provide counselling services followed by<br />
interventions where necessary.<br />
How can the programme improve?<br />
Women responded that must-haves are capacity<br />
building in gender issues (62 per cent), legal<br />
literacy classes (62.2 per cent) and training in<br />
health issues (54.6 per cent). Some of the core<br />
inputs were found wanting either because they<br />
were insubstantial or because they were not<br />
provided in time or both. Over 54 per cent found<br />
the government subsidy inadequate and 27 per<br />
cent said they did not get it in time. Over 51 per<br />
cent were not satisfi ed with the training in book<br />
keeping imparted to them and 21.9 per cent<br />
said it was not conducted in a timely manner.<br />
Bank lending was described as inadequate by<br />
50.8 per cent and 23 per cent said it was not<br />
given in time. Training in vocational skills needed<br />
improvements according to 41.8 per cent<br />
while 24.3 per cent noted it was not available<br />
at all. Only 9.8 per cent said it was available.<br />
Marketing support was another area which<br />
needed improvement (47.4) and only 9.6 per<br />
cent said it was available. A high 52.6 per cent<br />
wanted improvements in literacy classes and 19<br />
per cent said this facility was not available.<br />
Clearly, SHG members are in a position to identify<br />
areas where programme inputs must improve as<br />
well as the knowledge and/or skills they need<br />
to upscale incomes and enhance their capacity<br />
as gender-class. Moreover, the household and<br />
their status therein are critically important for<br />
204
<strong>Karnataka</strong> <strong>Human</strong> <strong>Development</strong> <strong>Report</strong> <strong>2005</strong><br />
these women and constitute the fi rst critical step<br />
towards enlarging their choices.<br />
Critical issues<br />
At state level, only 62 per cent of the one lakh<br />
SHGs formed under Stree Shakti have taken<br />
loans from banks. The average saving per group<br />
is Rs.28,856. Repayment to SHGs by members<br />
is about 70 per cent which clearly needs to<br />
improve. The Swashakti model was implemented<br />
in 5 states including <strong>Karnataka</strong>. A baseline<br />
survey was undertaken at the start of the project<br />
and the World Bank claims that all-India data<br />
indicates: (i) incomes of women increased from<br />
Rs.4,300 to Rs.8,766; (ii) illiteracy among SCs<br />
and STs declined from 74.3 to 30.9 per cent<br />
and 78 to 55.7 per cent respectively; (iii) about<br />
90 per cent of the women claimed access to and<br />
control over their resources and 96 per cent had a<br />
say in sending their daughter to school compared<br />
with 21 per cent at baseline.<br />
The difference between the two projects is that<br />
Stree Shakti, which is bigger and has greater<br />
coverage, has a more limited objective but<br />
attempts to do a great many things on a tight<br />
budget.<br />
TABLE 8.5.4<br />
Improvement in members’ levels of awareness and knowledge<br />
Level of awareness and knowledge Yes Partly No<br />
Communication skills 49.7 37.3 13.0<br />
Banking knowledge 44.3 34.8 20.9<br />
Leadership qualities 41.9 36.5 21.6<br />
Income generating programmes 47.7 35.1 17.1<br />
Records maintenance 27.0 33.2 39.8<br />
Gender equality 43.1 34.3 22.6<br />
Health and sanitation 52.4 35.1 12.6<br />
Children’s education 67.2 25.3 7.4<br />
Family planning 65.4 24.4 10.1<br />
Common property management 28.4 36.0 35.7<br />
Government programmes 30.6 41.0 28.4<br />
97%<br />
FIGURE 8.5.5<br />
Women’s perceptions of programme objectives<br />
87% 86%<br />
71%<br />
63%<br />
74%<br />
82%<br />
75%<br />
The survey points to the risks associated with<br />
rapidly upscaling a project, as has happened<br />
with Stree Shakti, without providing matching<br />
budgetary support for programme inputs such as<br />
training and revolving funds. It is also a matter<br />
of concern that the poorest are unable to get<br />
credit for various reasons. The poorest women are<br />
the constituency the programme is supposed to<br />
address. Since the main objective is to give credit<br />
to the very poor and enhance their incomes, the<br />
programme falls short here and more analysis is<br />
needed so that this shortcoming is redressed.<br />
The groups surveyed comprise primarily SC, ST<br />
and backward class women, 87 per cent of whom<br />
are below the poverty line. While group savings<br />
and lending is small scale, group lending reached<br />
the majority of the members. Repayment is higher<br />
than the state average. Since some members<br />
reported a decline in poverty from 87 to 77.2<br />
per cent, the programme could be said to have<br />
Encourages<br />
savings<br />
Improves<br />
access to<br />
credit<br />
Helps in<br />
income<br />
generation<br />
Improves<br />
vocational<br />
skills<br />
impacted rural poverty in a limited way. While<br />
gender equity and empowerment in a larger<br />
sense were not part of the Stree Shakti game<br />
plan, the results in terms of an improvement in<br />
women’s sense of self and self-worth are evident.<br />
Enhancement of women’s status in the family and<br />
the community was a spin-off that women rated<br />
highly. If the groups have not been successful in<br />
working as gender empowerment catalysts then it<br />
is because the programme does not provide for it<br />
by way of capacity building of either groups or the<br />
facilitators. As agents of socio-economic change,<br />
the groups were able to bring about changes<br />
within families especially with regard to domestic<br />
Access to<br />
markets<br />
Develops<br />
collective<br />
group<br />
movement<br />
Improves<br />
women’s<br />
status in<br />
the family<br />
Improves<br />
status in the<br />
community<br />
205
Gender and <strong>Human</strong> <strong>Development</strong><br />
violence, which came down by 50 per cent. At<br />
community and societal levels, the groups were<br />
less visible. Participation in gram sabhas improved<br />
and this is a signifi cant step towards enlarging<br />
women’s community participation.<br />
The majority of the members wanted more<br />
loans, more revolving funds and more capacity<br />
building in book keeping, vocational skills,<br />
marketing, health education and gender issues.<br />
The importance of providing inputs in time was<br />
repeatedly emphasised by groups. The best way of<br />
ensuring that the programme shapes up to their<br />
expectations is to build a strong participatory<br />
element. The department must use these inputs to<br />
improve the programme’s services.<br />
Recommendations<br />
Given the fact that SHGs are the preferred<br />
anti-poverty strategy for women, it can be concluded<br />
that the strategy has met with some success since<br />
groups have reduced poverty, reached out to very<br />
poor women and raised their awareness levels<br />
quite signifi cantly. An important caveat is that the<br />
programmes have not reached the poorest women<br />
who are not in a position to save and who are<br />
poor credit risks. What Stree Shakti must now do<br />
is to focus on the poorest women (BPL) who are<br />
not getting credit for various reasons and ensure<br />
their needs are met by linking them with local<br />
rural wage employment programmes to build a<br />
sustainable base for micro-credit. A second set of<br />
actions must focus on strengthening/diversifying<br />
the vocational base and developing marketing<br />
linkages. Ensuring that services are provided in<br />
time and effi ciently speaks of the need for better<br />
governance. Gender sensitisation, literacy, health<br />
and nutrition awareness would be the third set of<br />
actions. All actions must be complementary, not<br />
sequential.<br />
206
Status of Scheduled Castes in <strong>Karnataka</strong>
CHAPTER 9<br />
Status of Scheduled Castes in <strong>Karnataka</strong><br />
Introduction<br />
The history of categorising some castes<br />
as Scheduled Castes commenced with the<br />
Government of India Act, 1935. This step, on the<br />
part of the then British Government, was meant<br />
to treat the most oppressed and exploited castes<br />
with a degree of special political dispensation.<br />
Most of these castes were known as ‘untouchable’<br />
in the context of the Hindu social structure. Thus,<br />
the ‘Scheduled Caste’ category initially comprised<br />
castes that were isolated and disadvantaged<br />
by their ‘untouchability’, i.e. their low status<br />
in the traditional Hindu caste hierarchy,<br />
which exposed them to an oppressive life,<br />
characterised by a blatant deprivation of<br />
opportunities.<br />
In <strong>Karnataka</strong> the Scheduled Castes (SCs) form<br />
a sizeable part of the state’s population. Not<br />
all SCs are former untouchables. Some of the<br />
castes and sub-castes, classifi ed as ‘Scheduled<br />
Castes’ during the 1970s and 1980s, were nonuntouchables<br />
who did, however, have a history<br />
of deprivation. Scheduled Castes are known by<br />
different names in different parts of the state and<br />
comprise many sub-castes and communities. At<br />
present, there are about 101 sub-castes that<br />
have been recognised as Scheduled Castes in<br />
<strong>Karnataka</strong>. The majority of these castes are small<br />
in number. While the Scheduled Castes are the<br />
largest single group in <strong>Karnataka</strong>, they are also<br />
the weakest in terms of political, economic, social<br />
and cultural resources.<br />
<strong>Human</strong> development, as a concept, will have little<br />
value or signifi cance until the human development<br />
levels of disadvantaged people, particularly of the<br />
Scheduled Castes and Scheduled Tribes, are raised<br />
to the levels of those of the dominant classes.<br />
Both the Central and the state governments<br />
have implemented policies directed at the<br />
socio-economic empowerment of the Scheduled<br />
Castes and Scheduled Tribes (STs). This chapter<br />
will assess the status of the Scheduled Castes<br />
in <strong>Karnataka</strong> with a special focus on livelihoods,<br />
education and health; examine whether<br />
government policies have been effective in<br />
improving the human development indicators<br />
of the Scheduled Castes; and suggest future<br />
interventions to ensure that they enjoy equal<br />
rights and equal access to goods and services in<br />
society.<br />
Demographic features<br />
Overview<br />
The population of SCs in <strong>Karnataka</strong> has increased<br />
from 3.12 million in 1961 to 8.56 million in<br />
2001, registering an increase of 174.3 per cent<br />
as compared to an increase of 158.5 per cent in<br />
the SC population at the national level. The share<br />
of the SC population in the total population, which<br />
was 13.22 per cent in 1961, declined to 13.14 in<br />
1971, then increased to 15.07 per cent in 1981,<br />
and to 16.38 per cent in 1991, and thereafter,<br />
fell to 16.21 per cent in 2001. The share of the<br />
SC population to the total population of India in<br />
2001 is about 16.26 per cent, which is almost<br />
equal to that of <strong>Karnataka</strong>. In terms of decadal<br />
growth, there was a quantum jump (45.33<br />
per cent) in the SC population during 1971–81,<br />
followed by a 31.70 per cent increase in the next<br />
decade (1981–91). It fell to 16.21 per cent in the<br />
following decade, 1991–2001. The high growth<br />
recorded during 1971–81 and 1981–91 was<br />
not only due to increased fertility rates, but also<br />
because of the addition of new castes to the SC<br />
category (Figures 9.1 and 9.2).<br />
District-wise distribution<br />
According to the 2001 Census, Bangalore Urban<br />
district has the highest SC population in the state<br />
(8,51,047) followed by Gulbarga (7,17,595) and<br />
Kolar (6,71,692). Districts with the lowest SC<br />
population are Kodagu (67,422), Udupi (67,689)<br />
and Uttara Kannada (1,01,896). In terms of<br />
the percentage of the SC population to the total<br />
population of a district however, Kolar (26.6<br />
<strong>Human</strong> development, as<br />
a concept, will have little<br />
value or significance until<br />
the human development<br />
levels of disadvantaged<br />
people, particularly of<br />
the Scheduled Castes<br />
and Scheduled Tribes,<br />
are raised to the levels<br />
of those of the dominant<br />
classes.<br />
211
Status of Scheduled Castes in <strong>Karnataka</strong><br />
Percentage<br />
100<br />
90<br />
80<br />
70<br />
60<br />
50<br />
40<br />
30<br />
20<br />
10<br />
0<br />
FIGURE 9.1<br />
Percentage share of SCs/STs and Others to total<br />
population in <strong>Karnataka</strong><br />
13.22<br />
13.14<br />
15.07<br />
16.38<br />
16.21<br />
Source: Registrar General of India, Census 1961-2001.<br />
0.48<br />
0.79<br />
4.91<br />
4.26<br />
6.55<br />
86.31<br />
86.07<br />
80.02<br />
79.36<br />
77.24<br />
SCs STs Others<br />
1961<br />
1971<br />
1981<br />
1991<br />
2001<br />
per cent) takes fi rst place, followed by<br />
Chamarajnagar (24.6 per cent) and Gulbarga<br />
(23.01 per cent). The lowest percentage is in<br />
Udupi, (6.1), followed by Dakshina Kannada<br />
(6.9) and Uttara Kannada (7.5) (Appendix Tables:<br />
Series 10).<br />
Rural and urban distribution<br />
The majority of the SC population resides in rural<br />
areas, but its share of the rural population has<br />
been declining from census to census. Out of an<br />
8.56 million SC population (in 2001), about 75<br />
per cent live in rural areas. The proportion of the<br />
rural SC population is lower than that of STs, but<br />
it is higher than the total population. The trends in<br />
rural and urban population for SCs from 1991 to<br />
2001 are shown in Table 9.1.<br />
Percentage<br />
FIGURE 9.2<br />
Decadal growth rate for SCs, STs, Others, and all population in<br />
<strong>Karnataka</strong><br />
800<br />
700<br />
600<br />
500<br />
400<br />
300<br />
200<br />
100<br />
0<br />
23.51<br />
106.34<br />
23.87<br />
24.22<br />
45.33<br />
689.19<br />
1961-71 1971-81 1981-91 1991-2001<br />
Decades<br />
Source: Registrar General of India, Census 1961-2001.<br />
17.84<br />
26.75<br />
31.70<br />
4.96<br />
20.11<br />
21.12<br />
SCs STs Others All<br />
16.21<br />
80.82<br />
14.37<br />
17.51<br />
TABLE 9.1<br />
Distribution of SC/ST population in <strong>Karnataka</strong>: Rural and urban<br />
(Per cent)<br />
Area Scheduled Castes Scheduled Tribes Others Total<br />
1991 2001 1991 2001 1991 2001 1991 2001<br />
Rural 76.60 74.93 85.06 84.72 66.67 62.56 69.08 66.01<br />
Urban 23.40 25.07 14.94 15.28 33.33 37.44 30.92 33.99<br />
State 100.00 100.00 100.00 100.00 100.00 100.00 100.00 100.00<br />
Source: Registrar General of India, Census 1991 and 2001.<br />
Population by castes and sub-castes<br />
The Scheduled Castes comprise 101 castes and<br />
sub-castes, the majority of whom were formerly<br />
classifi ed as ‘untouchables’ and generally lived<br />
in a segregated area or separate colony on the<br />
outskirts of villages, a practice that is outlawed<br />
in the present day. The predominant castes<br />
among the SCs are Adi <strong>Karnataka</strong>, Holeya,<br />
Chalavadi, Mahar, Mala, Madiga, Mang, Mochi,<br />
Adi Dravida, Samagara, Dhor, Banjara and Bhovi.<br />
The Adi <strong>Karnataka</strong>s form the largest segment,<br />
(34.13 per cent) followed by Banjaras (11.85<br />
per cent), Bhovis (10.04 per cent) and Adi Dravidas<br />
(6.98 per cent).<br />
The spread of the SC population by caste/sub-caste<br />
is not uniform throughout the state. Some castes<br />
are clustered only in a few districts and are sparse<br />
in other districts. The Adi Dravidas are clustered<br />
in only three districts, namely, Bangalore Urban<br />
(37 per cent), Kolar (20 per cent) and Tumkur<br />
(10 per cent), accounting for two-thirds of the<br />
Adi Dravida population in the state. Again, about<br />
90 per cent of the Holaya, Holer and Holeya<br />
population in the state is concentrated in four<br />
districts of north <strong>Karnataka</strong>, i.e. Gulbarga (37 per<br />
cent), Bijapur (20 per cent), Belgaum (20 per cent)<br />
and Bidar (17 per cent). District-wise distribution<br />
of population according to the major Scheduled<br />
Castes based on the 1991 Census for 20 districts<br />
is shown in Table 9.2 (2001 Census data was not<br />
212
Sl.<br />
No.<br />
Districts<br />
<strong>Karnataka</strong> <strong>Human</strong> <strong>Development</strong> <strong>Report</strong> <strong>2005</strong><br />
Table 9.2<br />
District-wise percentage of SC sub-caste population to total SC population in <strong>Karnataka</strong>: 1991<br />
Adi<br />
Dravida<br />
Adi<br />
<strong>Karnataka</strong><br />
Banjara,<br />
Lambani<br />
Bhambi,<br />
Bhambhi,<br />
Asadaru,<br />
Asodi, Chamadia<br />
Bhovi<br />
Chalavadi,<br />
Chalvadi,<br />
Channayya<br />
Holaya,<br />
Holer,<br />
Holeya<br />
Korama Madiga Others Total<br />
1 Bangalore Urban 37.01 12.83 0.57 0.39 9.25 0.20 0.39 8.48 0.98 5.66 9.66<br />
2 Bangalore Rural 6.04 8.28 2.06 0.05 5.04 0.02 0.27 4.38 0.76 1.34 4.43<br />
3 Belgaum 0.03 0.12 2.32 19.93 2.95 6.95 19.91 9.77 5.66 12.34 5.52<br />
4 Bellary 1.69 5.50 9.18 0.78 6.13 13.04 0.07 3.23 2.15 5.97 4.96<br />
5 Bidar 0.01 0.00 4.48 1.09 1.22 0.01 16.67 1.01 13.23 7.07 3.53<br />
6 Bijapur 0.02 0.06 15.42 27.46 4.58 9.44 20.04 14.23 1.90 7.54 6.92<br />
7 Chikmaglur 1.93 3.91 3.70 0.35 2.92 1.22 0.18 4.12 0.13 2.27 2.66<br />
8 Chitradurga 3.92 8.76 7.95 0.34 10.70 1.62 0.00 4.59 0.07 2.82 5.87<br />
9 Dakshina Kannada 5.91 0.08 0.05 0.12 0.33 0.04 4.96 0.10 0.08 10.71 2.38<br />
10 Dharwad 0.42 0.06 9.25 26.91 7.60 28.48 0.26 11.74 4.41 7.70 5.57<br />
11 Gulbarga 0.25 0.02 20.22 5.25 4.34 0.91 35.75 4.94 32.26 6.79 8.29<br />
12 Hassan 3.14 7.76 1.90 0.10 2.71 0.18 0.10 2.82 0.20 1.61 3.71<br />
13 Kodagu 0.42 1.17 0.02 0.06 0.16 0.01 0.34 0.24 0.15 2.30 0.80<br />
14 Kolar 20.38 11.79 0.86 0.04 12.95 0.05 0.07 1.33 0.33 2.96 7.74<br />
15 Mandya 2.01 6.48 0.12 0.18 2.18 0.01 0.09 3.84 2.06 2.00 3.08<br />
16 Mysore 3.55 19.36 0.93 0.42 3.63 0.04 0.05 5.88 4.55 2.73 8.11<br />
17 Raichur 0.29 0.02 6.72 13.18 5.30 25.09 0.15 6.54 30.12 8.67 5.40<br />
18 Shimoga 2.76 4.28 10.07 1.06 9.82 5.04 0.09 6.52 0.39 3.12 4.59<br />
19 Tumkur 10.13 9.49 3.47 0.18 6.81 0.29 0.30 5.62 0.30 1.21 5.54<br />
20 Uttara Kannada 0.09 0.02 0.71 2.11 1.40 7.37 0.29 0.62 0.26 5.20 1.25<br />
<strong>Karnataka</strong> 100.00 100.00 100.00 100.00 100.00 100.00 100.00 100.00 100.00 100.00 100.00<br />
Source: Registrar General of India, Census 1991.<br />
available at the time of writing this <strong>Report</strong>). The<br />
caste-wise population distribution provides useful<br />
inputs for strategies aimed at reducing intra-caste<br />
disparities.<br />
Sex ratio<br />
The sex ratio of the SC population (973) is better<br />
than that of the STs (972) and much better than<br />
that of the total population (965). It is also<br />
higher than the sex ratio of SCs at the all-India<br />
level (936).<br />
In the last decade, the sex ratio of the SCs in<br />
the state has shown a marked improvement,<br />
increasing from 962 in 1991 to 973 in 2001,<br />
as compared to a lower increase in the sex ratio<br />
of the total population from 960 to 965 in the<br />
same period. This trend assumes considerable<br />
signifi cance, especially when it is juxtaposed with<br />
the fact that the literacy level of SCs, particularly<br />
women, is much lower than the general population.<br />
It suggests that son preference is less vigorously<br />
pursued as a desirable objective among the SCs<br />
and that they are less constrained by patriarchal<br />
impulses. An unfortunate trend is the low<br />
urban sex ratio (961) while the rural sex ratio is<br />
a high 977.<br />
Across districts, Udupi, Bagalkot, Kodagu and<br />
Hassan have high female sex ratios and as many<br />
as 14 districts, Belgaum, Bellary, Chikmaglur,<br />
Dakshina Kannada, Kolar, Koppal, Mandya,<br />
Raichur, Shimoga and Uttara Kannada, have<br />
female sex ratios that are higher than the state<br />
average (973) (Appendix Tables: Series 10).<br />
In 2004, the Department of Economics and<br />
Statistics (DES), <strong>Karnataka</strong> conducted a<br />
The sex ratio of the<br />
Scheduled Castes<br />
has shown a marked<br />
improvement, increasing<br />
from 962 in 1991 to 973<br />
in 2001.<br />
213
Status of Scheduled Castes in <strong>Karnataka</strong><br />
In <strong>Karnataka</strong>, as in other<br />
parts of the country, the<br />
Scheduled Castes are<br />
largely concentrated in<br />
the rural parts of the<br />
state. Almost 75 per cent<br />
live in villages and depend<br />
upon agricultural labour<br />
or agriculture-related<br />
activities for subsistence.<br />
Those who have migrated<br />
to cities have taken<br />
up occupations such<br />
as construction work,<br />
street sweeping and<br />
other manual labour,<br />
which again are not very<br />
remunerative. Only a few<br />
are engaged in trade and<br />
commerce.<br />
sample survey of 5000 SC and ST households<br />
across 374 villages with a high population<br />
concentration of SCs and 127 villages with a high<br />
population concentration of STs. The objective<br />
of the survey was an assessment of the human<br />
development status of SCs and STs in the state.<br />
The key demographic indicators are presented in<br />
Table 9.3.<br />
The Sample Survey (DES: 2004A) found that the<br />
birth rate and death rates of the SC population<br />
are marginally higher than those of the general<br />
population. The infant mortality rate (IMR) of SCs<br />
is almost equal to that of STs and higher than<br />
the general population. Life expectancy at birth<br />
for SCs is almost equal to that of the STs but lower<br />
than that of the general population.<br />
Land, employment and income<br />
In most parts of India, there is a correlation<br />
between economic status and the structural<br />
position of castes. The reason is that, historically,<br />
higher castes had better access to occupations,<br />
income and assets than lower castes. In Hindu<br />
society, occupation was one of the defi ning<br />
features of the caste hierarchy, with socially<br />
valued occupations bestowing high socioeconomic<br />
status on caste members. In the<br />
modern context, there has been a loosening<br />
of the caste – occupation linkage. A dynamic<br />
occupational shift has not occurred however<br />
and high-end jobs continue to be the preserve<br />
of the ‘upper’ castes and, now, increasingly,<br />
high-income classes. Government policies have<br />
ensured that there has been a signifi cant degree<br />
of occupational diversity among the SCs but a<br />
large percentage of the SC population, especially<br />
the ex-untouchable castes among the Scheduled<br />
Castes, still constitutes a sizable chunk of<br />
TABLE 9.3<br />
Key demographic indicators<br />
Sl. No. Indicators Scheduled Castes Scheduled Tribes<br />
1 Birth rate 21.82 22.79<br />
2 Death rate 9.12 8.50<br />
3 Infant mortality rate 64.74 64.37<br />
4 Life expectancy at birth 62.00 61.80<br />
Source: Sample Survey, Directorate of Economics and Statistics, <strong>Karnataka</strong>, 2004A.<br />
the low income population with poor human<br />
development indicators.<br />
In <strong>Karnataka</strong>, as in other parts of the country, the<br />
Scheduled Castes are largely concentrated in the<br />
rural parts of the state. Almost 75 per cent live<br />
in villages and depend upon agricultural labour<br />
or agriculture related activities for subsistence.<br />
Those who have migrated to cities have taken<br />
up occupations such as construction work, street<br />
sweeping and other manual labour, which again<br />
are not very remunerative. Only a few are engaged<br />
in trade and commerce. The reservation policy has<br />
ensured that many SCs entered government service<br />
and reached the higher echelons of the power<br />
structure, but they comprise only a fraction of their<br />
population in the state. The majority languishes in<br />
low-end jobs, on the fringe of the poverty line.<br />
Land ownership patterns<br />
Scheduled Caste ownership of agricultural land is<br />
minimal and the majority of landholders have small<br />
and unviable holdings. Progressive policies such as<br />
the <strong>Karnataka</strong> Land Reforms Act 1961 and various<br />
administrative measures of the government under<br />
this Act and Rules, have made it possible for many<br />
SC tenant cultivators to become owners of land.<br />
Under the land distribution scheme, out of the<br />
surplus land identifi ed by the government, only<br />
18,361 SC agricultural labourers and marginal<br />
landholders were allotted about 69,893 acres of<br />
agricultural land in the 1990s.<br />
The 2001 Census reveals that out of a total<br />
70.79 lakh operational holdings, 8.23 lakh<br />
(11.65 per cent) are owned by SCs. The total<br />
area cultivated by SCs is 10.71 lakh hectare<br />
out of a total operated area of 123.07 lakh<br />
hectare, accounting for 8.7 per cent. Since SCs<br />
comprise 16.21 per cent of the total population<br />
of the state, it is clear that their ownership of<br />
agricultural land holdings is not commensurate<br />
with their share of the population.<br />
The 2001 Agricultural Census, reported that 52<br />
per cent of marginal (less than one hectare) and<br />
30 per cent of small (1–2 hectare) operational<br />
holdings were held by SCs while non-SCs held<br />
about 45 per cent and 26 per cent of marginal<br />
214
<strong>Karnataka</strong> <strong>Human</strong> <strong>Development</strong> <strong>Report</strong> <strong>2005</strong><br />
and small holdings respectively. It is evident that<br />
the share of operational holdings decreases as the<br />
size of holdings increases for SCs as well as for all<br />
groups. An important feature is that the marginal<br />
and small operational holdings of the SCs which<br />
form about 82 per cent of total SC holdings account<br />
for a little more than half (53 per cent) of the total<br />
operated area belonging to SCs. As against this,<br />
72 per cent of the marginal and small holdings<br />
of non-SCs and non-STs, account for about 32.4<br />
per cent of the total operated area (Table 9.4).<br />
The majority of SC cultivators own marginal and<br />
small holdings, which are not viable and drive<br />
them towards indebtedness and poverty. It could<br />
be argued that, for a majority of SC cultivators<br />
owning agricultural land has become a symbol of<br />
security rather than a major source of income.<br />
TABLE 9.4<br />
Distribution of operational holdings and operated areas by major size<br />
class for different social groups in <strong>Karnataka</strong>: 2001<br />
(Per cent)<br />
Size Class<br />
Scheduled<br />
Castes<br />
No. of<br />
holdings<br />
Area<br />
Scheduled Tribes Others Total<br />
No. of<br />
holdings<br />
Area<br />
No. of<br />
holdings<br />
Area<br />
No. of<br />
holdings<br />
Area<br />
Marginal 52.13 19.70 40.84 12.00 45.41 11.40 45.94 12.20<br />
Small 30.13 33.10 30.89 25.30 26.28 21.10 26.98 22.40<br />
Semi medium 13.73 27.70 19.37 29.60 18.26 27.90 17.79 28.00<br />
Medium 3.65 16.00 7.85 25.30 8.65 28.30 8.03 27.00<br />
Large 0.36 3.50 1.05 7.70 1.40 11.40 1.26 10.50<br />
All sizes 100.00 100.00 100.00 100.00 100.00 100.00 100.00 100.00<br />
Source: Agricultural Census 2001, Directorate of Economics and Statistics, <strong>Karnataka</strong>, 2003.<br />
Land ownership does not necessarily mean an<br />
increase in income for two reasons: SC holdings<br />
are small and unviable and the land they own is<br />
not irrigated (Table 9.5).<br />
Employment<br />
Since data on employment in the primary, secondary<br />
and tertiary sectors for the 2001 census is not yet<br />
available, the following analysis is based on the<br />
1991 Census data. Scheduled Caste workers are<br />
heavily concentrated in low paying agricultural<br />
activities and other occupational positions. They<br />
are yet to create space for themselves in high-end<br />
occupations. This situation is applicable not only to<br />
the SCs in <strong>Karnataka</strong> but also to the SCs of other<br />
states with only a difference of degree. Among the<br />
three major sectors — primary, secondary and<br />
tertiary — representing agriculture, manufacturing<br />
and services, the distribution of SC main workers<br />
in <strong>Karnataka</strong> was 78.83 per cent, 10.43 per cent<br />
and 10.74 per cent for each sector respectively.<br />
The distribution of non-SC main workers in the<br />
state, in these respective sectors, during the same<br />
year, was 64.91 per cent, 13.77 per cent and<br />
21.32 per cent. The SCs are under represented in<br />
the manufacturing and service sectors. The sample<br />
survey (DES: 2004A) provides fresh insights<br />
(Table 9.6).<br />
The proportion of cultivators and landless<br />
agricultural labourers among SCs was 23.48 per<br />
TABLE 9.5<br />
Ownership of agricultural land<br />
Type of agricultural land Percentage<br />
Rural SC households owning land 48.40<br />
Irrigated 11.34<br />
Un-irrigated 83.25<br />
Partly irrigated 5.41<br />
Source: Sample Survey, Directorate of Economics and Statistics,<br />
<strong>Karnataka</strong>, 2004A.<br />
TABLE 9.6<br />
Occupational distribution<br />
Type of occupation Percentage<br />
Cultivator 5.74<br />
Agricultural labour 19.59<br />
Other labour 10.50<br />
Private enterprises 1.52<br />
Government service 1.31<br />
Private service 1.18<br />
Artisans 0.56<br />
Household work 10.84<br />
Students 30.31<br />
Others 18.45<br />
Source: Sample Survey, Directorate of Economics and Statistics,<br />
<strong>Karnataka</strong>, 2004A.<br />
Among the three major<br />
sectors – primary,<br />
secondary and tertiary<br />
– representing agriculture,<br />
manufacturing and<br />
services, the distribution<br />
of SC main workers<br />
in <strong>Karnataka</strong> was<br />
78.83 per cent,<br />
10.43 per cent and<br />
10.74 per cent for each<br />
sector respectively.<br />
215
Status of Scheduled Castes in <strong>Karnataka</strong><br />
Not only do the Scheduled<br />
Castes suffer from a<br />
lack of social resources,<br />
they have also been<br />
denied access to both<br />
material and cultural<br />
resources. They have<br />
experienced, in addition<br />
to material deprivation,<br />
social exclusion, which<br />
is manifested in their<br />
poor access to human<br />
development.<br />
cent and 49.87 per cent, whereas among non-SCs<br />
it was 36.69 per cent and 24.43 per cent in 1991.<br />
In 2001 about 20.54 per cent and 43.41 per cent<br />
of Scheduled Caste workers are reported to be<br />
cultivators and agricultural labourers respectively.<br />
Only 2.53 per cent are accounted as household<br />
workers while 33.12 per cent are ‘other workers’.<br />
It is evident that there has been a decline in the<br />
proportion of cultivators by about 3 per cent and a<br />
decline in agricultural labourers by about 6.5 per<br />
cent over the decade 1991-2001.<br />
Income and expenditure<br />
Although poverty is linked to the income and asset<br />
position of people, many other social and cultural<br />
factors shape the state of poverty in a particular<br />
society. All poor people cannot be viewed as a<br />
homogeneous class since the forms of deprivation<br />
they encounter are infl uenced by differentiated<br />
forms of inequity arising from caste, gender<br />
or even geography. Not only do the Scheduled<br />
Castes suffer from a lack of social resources, they<br />
have also been denied access to both material<br />
and cultural resources. They have experienced, in<br />
addition to material deprivation, social exclusion,<br />
which is manifested in their poor access to human<br />
development.<br />
Household and per capita income determines the<br />
standards of life. Income levels determine the<br />
individual’s capacity to access goods and services<br />
and they are decisive factors in determining the<br />
living standards of households. The income status<br />
of the Scheduled Castes in <strong>Karnataka</strong> is very<br />
weak compared to the rest of the population. In<br />
<strong>Karnataka</strong> the majority of the Scheduled Castes<br />
earn their livelihood from less remunerative<br />
sources. Their proportionate share of income from<br />
each source is also very low and unequal.<br />
Source of income<br />
Scheduled Caste households are only 15.4 per<br />
cent of the total number of households reporting<br />
income from cultivation in rural <strong>Karnataka</strong> (NSS<br />
55th round, 1999-2000). This is less than the<br />
proportion of the other backward classes or OBCs<br />
(40.6 per cent) and other households (36.3<br />
per cent). Scheduled Caste households that earned<br />
their income from fi shing and other agricultural<br />
enterprises in rural areas constituted 14 per cent,<br />
which is also less than half of OBCs (40 per cent)<br />
and other households (38.6 per cent). Among<br />
the households engaged in non-agricultural<br />
enterprises, SC households constituted a mere<br />
10.9 per cent which is not a happy situation,<br />
compared to the proportion of OBCs (47.5 per<br />
cent) and other households (38.8 per cent)<br />
engaged in non-agricultural work. Good sources<br />
of income for rural SC households are wages<br />
and salaried employment (26.8 per cent) and<br />
pensions (27 per cent) with the latter comprising<br />
the single largest source of income for SCs who<br />
are also the single largest group of benefi ciaries.<br />
The term ‘pension’ includes many social security<br />
measures such as old age pensions, widow’s<br />
pension, and pension for the disabled and so on.<br />
Disparities also exist in urban <strong>Karnataka</strong> between<br />
SC households and others. While SC households<br />
in urban areas constitute only 7.4 per cent of<br />
households earning income from cultivation, OBCs<br />
and other households constitute 31 and 55.5 per<br />
cent respectively. The general population has more<br />
diversifi ed sources of income than SCs.<br />
Across other southern states, the income of SCs<br />
in Kerala has more diverse sources. In Tamil Nadu<br />
(38.2 per cent) and Andhra Pradesh (33.3 per<br />
cent) the dependence on agriculture is higher<br />
than in <strong>Karnataka</strong> (29.4 per cent). In both states,<br />
however, wages/salaried employment, were bigger<br />
sources of income than in <strong>Karnataka</strong>. In Tamil<br />
Nadu it was a high 35.7 per cent compared with<br />
26.8 per cent in <strong>Karnataka</strong>. The analysis makes it<br />
clear that the SCs in <strong>Karnataka</strong> do not have equal<br />
access to sources that yield high income and are<br />
clustered in low-paying professions.<br />
The NCAER <strong>Report</strong> (1999) notes that rural<br />
Scheduled Caste households get 53.6 per cent<br />
of their income from agriculture and allied<br />
activities, 24 per cent from agricultural wages<br />
and 8.5 per cent from non-agricultural wages.<br />
At the national level, the pattern is different: SC<br />
households derive 37.7 per cent of their income<br />
from agriculture and allied activities and 19.7<br />
per cent (13.1 per cent) from agricultural wages<br />
(non-agricultural wages). Hindu and Muslim<br />
households derive more income from agriculture<br />
216
and allied activities and less from agricultural<br />
wages and non-agricultural wages.<br />
The percentage of income (8.10 per cent) that SCs<br />
derive from salaried income is more or less equal<br />
to that of Hindus (8.60 per cent) though slightly<br />
less than that of Muslims (13.30 per cent). At the<br />
all-India level, 15.20 per cent of income is derived<br />
by SCs from salaried employment, which is slightly<br />
less than Hindus (16.40 per cent) and more than<br />
Muslims (14.70 per cent). Income from professional<br />
occupations is non-existent for SCs in <strong>Karnataka</strong><br />
but the income of SC households (0.50 per cent) at<br />
the national level from this source is equal to that<br />
of Hindus (0.50 per cent) and Muslims (0.50 per<br />
cent). At the national level SC households derive<br />
15.70 per cent of their income from the category<br />
‘artisan and industrial work’ but the corresponding<br />
fi gure for <strong>Karnataka</strong> is a low 3.10 per cent. A<br />
comparison with other southern states shows<br />
that the percentage of households dependent on<br />
salaried employment is a high 20.30 per cent in<br />
Tamil Nadu and 10.70 per cent in Andhra Pradesh,<br />
as compared to 8.10 per cent in <strong>Karnataka</strong>.<br />
However, a higher percentage of households in the<br />
other southern states depends on agricultural (and<br />
non-agricultural) wage for income: Tamil Nadu:<br />
39.70 (16.30) per cent, Andhra Pradesh: 39.70<br />
(10.70) per cent, Kerala: 37.30 (32.90) per cent.<br />
From the perspective of income from all wages, the<br />
SCs in <strong>Karnataka</strong> derive less income than the SCs<br />
in other southern states: <strong>Karnataka</strong> SCs derive 29.6<br />
per cent of their income from all wages compared<br />
with 45.8 per cent in Andhra Pradesh, 34.9 per<br />
cent in Tamil Nadu and 63.8 per cent in Kerala.<br />
Overall, SCs depend on the primary sector for their<br />
livelihood, whereas non-SCs derive their income<br />
from more diverse sources.<br />
If we look at the distribution pattern of SC<br />
households across different income groups and<br />
compare it with the pattern of other households,<br />
the inequities become very visible. At the all-India<br />
level, about 72 per cent of SC households and<br />
70.50 per cent of ST households have an annual<br />
income of less than Rs.20,000. In <strong>Karnataka</strong> SC<br />
and ST households, which fall into the income<br />
group of Rs.20,000 to Rs.40,000 per annum,<br />
constitute 21.30 per cent and 19.50 per cent of all<br />
households respectively. Only 0.70 per cent of the<br />
SC households and 1.10 per cent of ST households<br />
have an income that is above Rs.86,000 per annum.<br />
Among Muslims, Christians and other minorities,<br />
this class of households constitutes two per cent,<br />
4.60 per cent and 5.60 per cent respectively.<br />
According to the NSS 55th round in 1999-2000,<br />
the monthly per capita expenditure (MPCE) among<br />
SCs in rural <strong>Karnataka</strong> was Rs.419, which was much<br />
lower than the OBCs (Rs.507), others (Rs.560)<br />
and a little higher than STs (Rs.404). The average<br />
MPCE was Rs.500 for all rural groups in <strong>Karnataka</strong>.<br />
The average MPCE of SCs at all-India (rural) was<br />
also Rs.419. In urban <strong>Karnataka</strong> the average MPCE<br />
of SCs was Rs.593 and for STs it was Rs.634. The<br />
average MPCE of OBCs in urban <strong>Karnataka</strong> was<br />
Rs.829 and for others Rs.1,044. For all groups in<br />
urban <strong>Karnataka</strong> the average MPCE was Rs.911.<br />
At all-India (urban) level the average MPCE among<br />
SCs was Rs.609 and for all groups it was Rs.855.<br />
This means that among all social groups, the MPCE<br />
of the SCs was the lowest in urban areas and the<br />
second lowest in the rural parts of the state.<br />
Income and expenditure patterns<br />
Analysis of the income levels of SCs reveals a wide<br />
gap among those living in urban areas compared<br />
to their counterparts in rural areas. The annual<br />
per capita income of rural SCs was Rs.5,000 as<br />
against Rs.12,778 of urban SCs. The percentage<br />
of BPL families in the rural SC population was 37<br />
and 25 in the urban SC population.<br />
There is also a disparity in the pattern of spending<br />
in the SC population in view of the fact that<br />
the rural and urban SCs’ monthly per capita<br />
expenditure was in the ratio 1:2. Data indicates<br />
that the monthly per capita expenditure of rural<br />
SCs was Rs.398 and Rs.790 for urban SCs.<br />
The percentage of families below the poverty line<br />
in rural areas was 50 per cent more than in urban<br />
area.<br />
Literacy and education<br />
Literacy<br />
Education plays a crucial role in empowering the<br />
poor and the marginalised everywhere. Literacy<br />
<strong>Karnataka</strong> <strong>Human</strong> <strong>Development</strong> <strong>Report</strong> <strong>2005</strong><br />
In 1999-2000, the<br />
monthly per capita<br />
expenditure among SCs<br />
in rural <strong>Karnataka</strong> was<br />
Rs.419 which was much<br />
lower than the OBCs<br />
(Rs.507), others (Rs.560)<br />
and a little higher than<br />
STs (Rs.404).<br />
217
Status of Scheduled Castes in <strong>Karnataka</strong><br />
<strong>Karnataka</strong><br />
TABLE 9.7<br />
Area-wise distribution of households by source of income and social groups: <strong>Karnataka</strong> and India 1999-2000<br />
(Per cent)<br />
Social<br />
groups<br />
Cultivation<br />
Fishing/other<br />
agricultural<br />
enterprises<br />
Wages/<br />
salaried<br />
employment<br />
Nonagricultural<br />
enterprises<br />
Pension Rent Remittances Interest<br />
and<br />
dividends<br />
SCs 15.40 14.00 26.80 10.90 27.00 6.60 13.70 2.40 21.60 20.70<br />
STs 7.70 6.70 9.70 2.70 7.100 12.80 4.60 0.00 9.70 7.90<br />
OBCs 40.60 40.70 38.30 47.50 21.30 17.50 33.50 21.70 35.20 38.60<br />
Others 36.30 38.60 25.30 38.80 44.60 63.00 48.10 75.90 33.50 32.80<br />
All groups 100.00 100.00 100.00 100.00 100.00 100.00 100.00 100.00 100.00 100.00<br />
SCs 15.80 15.90 27.60 18.90 15.60 15.50 14.70 8.00 20.80 21.30<br />
STs 12.70 12.20 12.90 5.20 4.10 3.20 5.40 3.80 13.20 10.90<br />
OBCs 38.30 37.40 35.10 41.50 31.00 40.10 40.80 31.60 35.90 37.10<br />
Others 33.20 34.50 24.10 34.40 49.30 41.20 39.10 56.60 30.10 30.70<br />
All groups 100.00 100.00 100.00 100.00 100.00 100.00 100.00 100.00 100.00 100.00<br />
SCs 7.40 15.40 12.00 5.80 7.00 4.00 7.90 5.10 18.60 10.20<br />
STs 6.10 3.60 4.60 3.00 2.30 3.70 7.40 2.80 8.90 4.50<br />
OBCs 31.00 37.80 29.60 31.90 29.40 33.30 32.80 25.20 38.50 29.70<br />
Others 55.50 43.20 53.80 59.40 61.30 58.90 51.90 66.80 34.00 55.70<br />
All groups 100.00 100.00 100.00 100.00 100.00 100.00 100.00 100.00 100.00 100.00<br />
SCs 10.60 14.60 16.10 11.30 9.70 8.00 11.60 6.60 15.60 13.90<br />
STs 4.70 2.80 4.00 2.00 3.10 2.60 3.90 2.30 6.00 3.50<br />
OBCs 38.00 45.30 29.60 32.00 22.20 36.10 31.60 20.90 29.20 30.10<br />
Others 46.70 37.40 50.30 54.60 65.10 53.30 52.80 70.20 49.20 52.50<br />
All groups 100.00 100.00 100.00 100.00 100.00 100.00 100.00 100.00 100.00 100.00<br />
Source: <strong>Report</strong> No.463, Sources of household income in India, NSS 55th round, July 1999 – June 2000.<br />
All-India<br />
<strong>Karnataka</strong><br />
All-India<br />
Others<br />
All<br />
and higher levels of educational attainment are<br />
associated with an improvement in demographic<br />
and health indicators. Access to education enables<br />
people to exercise their constitutional and legal<br />
rights in a judicious manner. Gender inequality<br />
has been known to decline as women’s access to<br />
education is enhanced. The liberating dimensions<br />
of education assume special signifi cance in the<br />
context of people who have been denied access to<br />
learning and, through learning, economic mobility<br />
by oppressive socio-cultural ideologies.<br />
The Scheduled Castes in <strong>Karnataka</strong> have a long<br />
history of receiving strong support from the state,<br />
commencing with the benevolent policies of the<br />
princely state of Mysore where, in 1919 the Scheduled<br />
Castes (known as ‘Punchamas’) got admission in all<br />
schools despite protests from the upper castes. By<br />
the 1920s a small but signifi cant number of SCs had<br />
entered government service and statistics showed<br />
that there were 165 Dalits among a total of 4,234<br />
employees in 1918 (about 3.8 per cent).<br />
After Independence and since its formation in<br />
1956, <strong>Karnataka</strong> has pursued policies that have<br />
encouraged SCs to enter the education mainstream.<br />
Despite these pro-active interventions, the<br />
performance of SCs is nowhere on par with the<br />
general population.<br />
The literacy rate of SCs has been consistently<br />
lower than that of the general population.<br />
The literacy rate among the Scheduled Castes<br />
was 27.62 per cent in 1981; it increased to<br />
218
<strong>Karnataka</strong> <strong>Human</strong> <strong>Development</strong> <strong>Report</strong> <strong>2005</strong><br />
TABLE 9.8<br />
Source-wise distribution of household income in rural areas for different social and religious groups<br />
(Per cent)<br />
Source of Income <strong>Karnataka</strong> India<br />
SCs Hindus Muslims SCs STs Hindus Muslims Christians Other<br />
Minorities<br />
Agriculture and allied activities 53.60 72.10 43.80 37.70 55.60 56.10 44.10 46.30 60.30<br />
Artisan/industry work 3.10 3.50 9.30 5.70 2.70 4.30 8.30 2.90 3.10<br />
Petty trade and small business 1.70 2.10 11.10 5.10 3.20 4.60 9.90 4.10 3.70<br />
Organisation and business 0.20 0.60 2.90 1.00 1.50 1.80 2.90 1.90 0.60<br />
Salaried employment 8.10 8.60 13.30 15.20 14.80 16.40 14.70 23.50 17.60<br />
Qualifi ed profession 0.00 0.20 0.20 0.50 0.80 0.50 0.80 0.40 0.80<br />
Rent/interest dividend 0.10 0.30 0.60 0.50 0.50 0.60 0.50 0.50 1.90<br />
Agricultural wage 24.00 8.90 8.30 19.70 11.70 8.00 7.70 9.40 5.20<br />
Non-agricultural wage 8.50 3.10 7.70 13.10 8.00 6.20 7.40 7.80 5.00<br />
Other sources 0.60 0.70 2.80 1.50 1.00 1.50 3.80 3.10 1.70<br />
All sources<br />
(Actual per household value)<br />
Income (Rs. per year)<br />
16579<br />
(100)<br />
27800<br />
(100)<br />
23661<br />
(100)<br />
Per capita 3094 4897 3681 3237 3504 4514 3678 5920 5427<br />
Sources:<br />
1. South India <strong>Human</strong> <strong>Development</strong> <strong>Report</strong> (Survey report for <strong>Karnataka</strong>), NCAER, 1999.<br />
2. India <strong>Human</strong> <strong>Development</strong> <strong>Report</strong> (Survey report for India) NCAER, 2001.<br />
17465<br />
(100)<br />
19556<br />
(100)<br />
25713<br />
(100)<br />
22807<br />
(100)<br />
28860<br />
(100)<br />
30330<br />
(100)<br />
38.10 per cent in 1991 and further increased<br />
to 52.87 per cent in 2001. The literacy<br />
rate for the total population was 46.21<br />
per cent (1981), 56.04 per cent (1991) and 66.64<br />
per cent (2001). The gap between the literacy rate<br />
of the general population and the SC literacy rate<br />
is being bridged but not as rapidly as envisaged.<br />
The gap in 1981 was 19.59 percentage points,<br />
which fell to 17.98 in 1991 and declined further<br />
to 13.83 in 2001. Scheduled Caste literacy rates<br />
have been increasing at a faster pace: between<br />
1981 and 1991 the SC literacy rate increased by<br />
10.48 percentage points and by 14.77 in 1991-<br />
2001. The increase in literacy for the rest of the<br />
population was 9.83 per cent in 1981-1991 and<br />
10.6 per cent in 1991-2001. The literacy rate of<br />
urban SCs in 2001 is 69.27 per cent, which is<br />
above the state average.<br />
The female literacy rate among SCs in 1981 was<br />
15.48 per cent, which increased to 26 per cent<br />
in 1991 and 41.72 per cent in 2001. The female<br />
Region<br />
Annual per capita<br />
income<br />
TABLE 9.9<br />
Income and expenditure<br />
Monthly per capita<br />
expenditure<br />
Percentage of BPL<br />
families<br />
Rural 5000 398 37<br />
Urban 12778 790 25<br />
Total 6945 496 34<br />
Source: Sample Survey, Directorate of Economics and Statistics, <strong>Karnataka</strong>, 2004A.<br />
literacy rate for total population in 2001 was<br />
56.87 per cent (Table 9.10). The gap between<br />
the SC male and female literacy rates hovered<br />
at about 23 percentage points (1981 and 1991)<br />
before declining marginally to 22 percentage<br />
points in 2001. The gap between the male and<br />
female literacy rates in the general population<br />
declined slightly from 22.92 in 1991 to 19.23<br />
percentage points in 2001. The gap between the<br />
SC female literacy rate and the female literacy rate<br />
for all hovered at 18 percentage points (1981 and<br />
1991) and then fell to 15.15 percentage points in<br />
219
Status of Scheduled Castes in <strong>Karnataka</strong><br />
Scheduled Castes<br />
TABLE 9.10<br />
Literacy rate among SCs and general population in <strong>Karnataka</strong><br />
Male Female Total<br />
1981 31.83 9.24 20.67<br />
Rural 1991 43.21 19.23 31.42<br />
2001 58.71 35.56 47.25<br />
1981 65.39 37.82 52.03<br />
Urban 1991 70.05 47.64 59.18<br />
2001 78.32 59.88 69.27<br />
1981 39.38 15.48 27.62<br />
Total 1991 49.69 25.95 38.10<br />
2001 63.75 41.72 52.87<br />
1981 51.11 23.84 37.63<br />
Rural 1991 60.30 34.76 47.69<br />
2001 70.45 48.01 59.33<br />
1981 76.54 56.41 66.91<br />
Urban 1991 82.04 65.74 74.20<br />
2001 86.66 74.12 80.55<br />
1981 58.73 33.17 46.21<br />
Total 1991 67.26 44.34 56.04<br />
2001 76.10 56.87 66.64<br />
Note: Literacy rate calculated for the population in the age groups 7+.<br />
Source: Registrar General of India, Census 1981, 1991 and 2001.<br />
General population<br />
2001. The literacy rate of SC women is abysmally<br />
low in rural areas.<br />
The literacy level of SCs in <strong>Karnataka</strong> was higher<br />
than the all-India SC literacy level with reference<br />
to both female and general literacy in 1991. In<br />
2001, the SC literacy rate was found to be lower<br />
than the all-India literacy rates for SC male, female<br />
and ‘all’, which is a matter of great concern.<br />
District-wise literacy levels<br />
Across districts, Bangalore Urban district (70.23<br />
per cent) has the highest literacy rate followed<br />
by Udupi (70.13 per cent), Dakshina Kannada<br />
(66.14 per cent) Uttara Kannada (65.45<br />
per cent), Kodagu (64.93 per cent), Dharwad<br />
(61.19 per cent), Shimoga (56.78 per cent),<br />
Mandya (55.92 per cent), Belgaum (55.57<br />
per cent) and Bangalore Rural (55.35 per cent).<br />
Except Belgaum and Bangalore Rural where the<br />
percentage of SCs to the total population is fairly<br />
high, districts such as Udupi, Uttara Kannada and<br />
Kodagu have very low SC populations. Districts<br />
which have a relatively high percentage of SC<br />
population also have low literacy rates: Raichur has<br />
the lowest SC literacy rate (38.76 per cent), followed<br />
by Koppal (38.78 per cent), Gulbarga (39.05<br />
per cent), Bellary (42.31 per cent) Bagalkot<br />
(42.44 per cent), and Bijapur (47.16 per cent). In<br />
Hassan (53.61 per cent), Tumkur (54.33 per cent)<br />
and Chikmaglur (54.58 per cent), the literacy<br />
rate is slightly above the state average (Appendix<br />
Tables: Series 10).<br />
While the literacy rate of the Scheduled Castes<br />
has improved perceptibly in the decade<br />
1991-2001, they still have to catch up with the<br />
rest of the population. The SC literacy rate in<br />
2001 (52.87) is lower than the literacy rate of the<br />
total population in 1991 (56.04) placing them a<br />
decade behind in literacy levels. The literacy rate<br />
of SC women continues to be a matter of concern.<br />
Districts with the lowest SC female literacy rates<br />
are Koppal (25.6), Raichur (26), Gulbarga (27) and<br />
Bagalkot (28.7), followed closely by Bellary (29),<br />
Bijapur (31.9), Haveri (36.9), Davangere (38.2),<br />
Chitradurga (40.92) and Belgaum (41.6), which<br />
are below the state average. All these districts<br />
except Davangere and Chitradurga are located<br />
in north <strong>Karnataka</strong>. The remaining districts have<br />
marginally higher fi gures. This data uncovers what<br />
happens to women located at the intersection<br />
of caste, gender and region. The outcomes for<br />
women from the poorest, most vulnerable sections<br />
of society are indeed cruel if they happen to<br />
reside in underdeveloped areas. Bangalore<br />
Urban with 70.23 per cent, Udupi with 70.13<br />
per cent, Dakshina Kannada with 66.14<br />
per cent, and Uttara Kannada with 65.45<br />
per cent literacy rates are high performing districts<br />
but they are also districts where the overall literacy<br />
rate is high.<br />
Education<br />
Access<br />
The gross enrolment ratio (GER) of the state<br />
(classes I to VIII) has increased from 92 in<br />
1996-97 (KHDR 1999) to 99 in 2000-01. The<br />
GER for SCs was a high 104.57 in the same year.<br />
In fact there has been a great improvement in the<br />
220
<strong>Karnataka</strong> <strong>Human</strong> <strong>Development</strong> <strong>Report</strong> <strong>2005</strong><br />
GER of the SCs, which has overtaken the GER of<br />
the general population. Among districts, Udupi<br />
led with a GER of 323.27, followed by Shimoga<br />
(154.65) and Bangalore Urban (137). Districts<br />
with a low GER were Raichur (78.97), Bellary<br />
(84.87) and Koppal (87.89) all in Hyderabad<br />
<strong>Karnataka</strong> where SC literacy levels are very low.<br />
There is little difference between SC children and<br />
the rest of the population with regard to mean<br />
years of schooling (Table 9.11).<br />
Out-of-school children<br />
According to the Children’s Census conducted by<br />
the Department of Public Instruction in <strong>2005</strong>, the<br />
percentage of out-of-school children in the age<br />
group 7–14 is highest among STs (2.42) followed<br />
by SCs (2.22). These two social classes also have<br />
the highest percentage of out-of-school girls.<br />
Dropout rate<br />
School dropout is another important indicator<br />
of educational status. The Sample Survey (DES:<br />
2004A) canvassed persons aged between nine<br />
and 35 years and found that fi ve per cent of SC<br />
persons in that age group had dropped out at<br />
primary school level and 17.12 per cent at higher<br />
primary/high school level. The dropout rate for SC<br />
females was marginally less than SC males.<br />
The reasons offered for dropping out offer<br />
insights into the biases that SC females<br />
experience: 36 per cent mentioned the inability<br />
of parents to pay for their education and 32<br />
per cent discontinued their education to work<br />
at home. Scheduled Caste males dropped out<br />
to do family work (26 per cent) or because the<br />
school was at some distance from the residence<br />
(24 per cent) – a factor which does not seem<br />
to have discouraged SC women. The opportunity<br />
costs of education are very high for SC girls. They<br />
are pulled out of school to attend to domestic<br />
chores and sibling care, thus enabling their<br />
mothers to work as agricultural or casual labour.<br />
In secondary education, in 2000-01, the GER for<br />
SC boys (97.63) and girls (90.77) is higher than<br />
for all boys (92.86) and girls (86.89) for classes<br />
I to X, but there is a decline at the plus 2 stage<br />
for SC boys (86.94) while SC girls (80.99) have<br />
a GER similar to all students (80.28) in Classes<br />
X–XII. Raichur district had the lowest GER<br />
(Appendix Tables: Series 4 and 10).<br />
Outcomes<br />
In terms of outcomes such as performance in<br />
the Class VII examinations, there is very little<br />
difference across castes. In 2002, for example, SCs<br />
and STs outperformed non-SC/ST students. The<br />
pass percentage for SCs was 87.87, for STs 88.25<br />
and for others it was 87.31. Scheduled Caste<br />
girls, like girls in all social groups, outperformed<br />
their male counterparts. When this data is viewed<br />
in the context of high dropout rates and the<br />
persistence of low literacy rates among SC females,<br />
it becomes apparent that if SC girls are enabled<br />
to remain in school, then their performance will<br />
be exemplary. Unfortunately, despite having the<br />
capacity to benefi t from education, SC women are<br />
not in a position to truly enlarge their choices.<br />
The scenario alters somewhat in class X (SSLC)<br />
examinations where testing is clearly more<br />
rigorous. Among all social groups, SCs have<br />
the lowest outcomes in terms of percentage<br />
of students clearing the examination from<br />
TABLE 9.11<br />
Mean years of schooling<br />
Category<br />
No. of years<br />
All children 4.003<br />
Scheduled Caste children 4.235<br />
Scheduled Tribe children 4.166<br />
Non-SC/ST children 4.458<br />
Source: Sample Survey, Directorate of Economics and Statistics,<br />
<strong>Karnataka</strong>, 2004A.<br />
If SC girls are enabled<br />
to remain in school, then<br />
their performance will be<br />
exemplary. Unfortunately,<br />
despite having the<br />
capacity to benefit from<br />
education, SC women are<br />
not in a position to truly<br />
enlarge their choices.<br />
TABLE 9.12<br />
Percentage of children who are out of school in the age group 7-14<br />
Sl. Category<br />
Percentage of out-of-school children<br />
No.<br />
Boys Girls Total<br />
1 All 1.47 1.62 1.54<br />
2 SCs 1.99 2.47 2.22<br />
3 STs 2.11 2.67 2.42<br />
4 Muslims 1.3 1.24 1.27<br />
Source: Children’s Census, Department of Public Instruction, <strong>Karnataka</strong>, <strong>2005</strong>.<br />
221
Status of Scheduled Castes in <strong>Karnataka</strong><br />
2001 to <strong>2005</strong> except in 2001, when SC girls<br />
performed better than SC boys. The gap in<br />
performance between all students and SC<br />
students was 6.04 percentage points in 2001 and<br />
it increased to 13.8 in <strong>2005</strong>. This increase is a<br />
cause for concern.<br />
Higher education<br />
At the tertiary level, more SC students enrol<br />
in degree classes in government colleges than<br />
in aided colleges. In 2003-04, SC students<br />
constituted 15.7 per cent and 8.8 per cent of<br />
all students enrolled in government and aided<br />
colleges respectively. State-run colleges provide<br />
TABLE 9.13<br />
Percentage of students who passed the SSLC examination 2001-05<br />
Year All SCs STs<br />
Girls Boys Girls Boys Girls Boys<br />
2001 52.44 40.22 38.09 39.05 40.47 38.24<br />
2002 53.76 48.54 37.74 35.96 39.47 34.91<br />
2003 58.54 52.19 41.15 39.06 43.47 39.84<br />
2004 68.06 61.74 53.30 50.41 55.80 54.01<br />
<strong>2005</strong> 66.10 59.30 50.31 47.29 55.18 49.55<br />
Source: <strong>Karnataka</strong> State Secondary Education Board.<br />
TABLE 9.14<br />
Percentage distribution of SC population aged 7+ years by<br />
level of education<br />
Level of Education Male Female Total<br />
Not literate 43.69 54.73 49.08<br />
Literate without formal education 2.12 1.42 1.78<br />
Literate below primary 16.89 16.88 16.89<br />
Primary 12.33 11.27 11.81<br />
Higher primary 10.81 8.71 9.78<br />
High School 8.45 5.40 6.96<br />
PUC 3.45 1.10 2.30<br />
Diploma 0.35 0.13 0.25<br />
Graduate 1.47 0.22 0.86<br />
Post-graduate 0.21 0.04 0.13<br />
Technical graduate 0.12 0.02 0.07<br />
Technical Post-graduate 0.04 0.01 0.03<br />
Handicrafts (skills) 0.05 0.07 0.07<br />
Source: Sample Survey, Directorate of Economics and Statistics, <strong>Karnataka</strong>, 2004A.<br />
access to higher education to precisely those<br />
social groups who have been excluded from higher<br />
education by social and cultural biases. Aided<br />
colleges far outnumber government colleges but<br />
their performance in the enrolment of SC students<br />
needs to improve. Performance-wise, in 2003-04,<br />
out of 17,163 students who enrolled, only 5,475<br />
(31 per cent) completed their courses of study<br />
and graduated, as against the 43,007 (49.44<br />
per cent) who graduated out of 86,961 enrolled<br />
general students. The attrition rate is very high for<br />
all social groups, which is a commentary on the<br />
quality of instruction and lack of infrastructure in<br />
government colleges, which is further attenuated<br />
by the low-income status of the majority of its<br />
users. In technical education, SC enrolment in the<br />
year 2002-03 was 6.8 per cent in degree courses<br />
and a low 0.8 per cent in diploma courses. This is<br />
a matter of concern because high-end jobs in the<br />
state tend to cluster in technology-driven sectors,<br />
and SCs are, therefore, under-represented here.<br />
The Sample Survey (DES: 2004A) reveals that the<br />
dropout rate in the SC population increases with<br />
levels of education. In the 51 per cent surveyed<br />
who were literates, the highest proportion had a<br />
literacy level below primary followed by primary<br />
and higher primary. Over 45 per cent did not<br />
reach high school, confi rming the poor levels of<br />
education among the SCs. There were just 0.22 per<br />
cent SC female graduates in the sample as against<br />
1.47 per cent SC male graduates. A meagre 0.04<br />
per cent of SC females were post-graduates. The<br />
details are furnished in Table 9.14.<br />
Housing<br />
In the 1991 Census terms such as ‘pucca’ and<br />
‘kutcha’ were used to describe the quality of<br />
housing. The 2001 Census replaced these terms<br />
with ‘permanent’, ‘semi-permanent’ and<br />
‘temporary’ to describe the quality of houses.<br />
NCAER’s survey data (1994) states that about<br />
85.5 per cent of the SCs in <strong>Karnataka</strong> had kutcha<br />
houses while Hindus and Muslims who owned<br />
kutcha houses accounted for 74.3 per cent and<br />
73.9 per cent respectively. About 54 per cent of<br />
SC houses had separate kitchens compared with<br />
about 67.3 per cent for Hindus and 57.6 per cent<br />
for Muslims. The 2001 Census reports that 51.09<br />
222
<strong>Karnataka</strong> <strong>Human</strong> <strong>Development</strong> <strong>Report</strong> <strong>2005</strong><br />
per cent of SC households live in permanent<br />
houses, 36.65 per cent in semi-permanent<br />
houses and 12.22 per cent in temporary houses.<br />
Comparable fi gures for the total population show<br />
that 54.94 per cent live in permanent houses,<br />
35.52 per cent in semi-permanent houses and<br />
9.5 per cent in temporary houses. The above<br />
data establishes clearly that overall the housing<br />
conditions of SCs have improved considerably,<br />
primarily because of the massive efforts of the<br />
Government in providing houses through various<br />
housing programmes such as Ashraya, Ambedkar<br />
Housing Programme, Indira Awas Yojana, Neralina<br />
Bhagya, etc. over the last 25 years.<br />
Drinking water<br />
In terms of safe drinking water, the Scheduled<br />
Caste population seems to be better placed than<br />
the non-SCs, not only in <strong>Karnataka</strong>, but in other<br />
southern states as well, based on data in the 1991<br />
and 2001 Censuses. This holds good for rural,<br />
urban and combined areas, the exception being<br />
Andhra Pradesh for urban areas (Table 9.15).<br />
Districts where the percentage of SC households<br />
with access to safe drinking water below the state<br />
average are Belgaum, Bidar, Bijapur, Chikmaglur,<br />
Dakshina Kannada, Dharwad, Gulbarga, Kodagu,<br />
Shimoga, Udupi and Uttara Kannada. Access of<br />
households to safe drinking water is relatively low<br />
in the coastal, malnad and Hyderabad <strong>Karnataka</strong><br />
districts (Appendix Tables: Series 10).<br />
Ninety per cent of the villages surveyed had<br />
a drinking water facility within SC colonies/<br />
villages and the principal sources were<br />
bore-wells with hand pumps, mini water supply<br />
and piped water supply schemes. As many as<br />
73.80 per cent of villages or three out of four<br />
had adequate drinking water supply in all<br />
seasons (DES: 2004A).<br />
Sanitation<br />
Sanitation in <strong>Karnataka</strong> did not receive much policy<br />
attention for many decades, and therefore, its<br />
status for several indicators is not as good as in the<br />
neighbouring states. The 1991 Census showed that<br />
a mere 9.24 per cent SC households in <strong>Karnataka</strong><br />
had latrine facilities, compared with 26.97<br />
Area<br />
TABLE 9.15<br />
Percentage of households with safe drinking water<br />
States General SCs Non-SCs<br />
1991 2001 1991 2001 1991 2001<br />
Andhra Pradesh 49.0 76.9 54.4 80.7 47.8 75.9<br />
<strong>Karnataka</strong> 67.3 80.5 76.8 88.4 65.2 78.6<br />
Kerala 12.2 16.9 19.7 23.2 11.4 16.0<br />
Tamil Nadu 64.3 85.3 70.1 90.6 62.5 83.4<br />
Andhra Pradesh 73.8 90.2 75.9 89.6 73.6 90.2<br />
<strong>Karnataka</strong> 81.4 92.1 85.7 94.6 80.9 91.8<br />
Kerala 38.7 42.8 41.9 46.3 38.5 42.6<br />
Tamil Nadu 74.2 85.9 74.1 86.2 74.2 85.9<br />
Andhra Pradesh 55.1 80.1 57.6 82.2 54.6 79.7<br />
<strong>Karnataka</strong> 71.7 84.6 78.6 90.0 70.4 83.5<br />
Kerala 18.9 23.4 23.5 27.2 18.4 22.9<br />
Tamil Nadu 67.4 85.6 70.9 89.3 66.5 84.5<br />
Source: Registrar General of India, Census 1991 and 2001.<br />
Rural<br />
Urban<br />
Combined<br />
per cent non-SC households. During 2001, 21.18<br />
per cent SC households had latrines compared<br />
with 40.80 per cent non-SC households that<br />
had latrines. Household sanitation has registered<br />
an improvement insofar as SC households are<br />
concerned, but a wide gap still exists between<br />
SC and non-SC households. The rural–urban<br />
disparity is quite high in SC households. In 2001,<br />
only 10 per cent of rural households had latrines,<br />
but the scenario was better for urban households<br />
(54 per cent).<br />
Only 17.20 per cent of SC colonies/villages<br />
had community toilets, 43.69 per cent of SC<br />
households had no drainage facility, only 2.10<br />
per cent households had underground drainage,<br />
whereas 49.07 per cent had an open drainage<br />
system. Storm water drainage was available in<br />
only 44 per cent of SC colonies/villages (Sample<br />
Survey DES: 2004A). Among southern states,<br />
<strong>Karnataka</strong> lags behind Kerala, but is slightly better<br />
off than Andhra Pradesh and Tamil Nadu.<br />
The 2001 Census data reveals that, in <strong>Karnataka</strong>,<br />
about 79 per cent of SC households do not have<br />
access to latrine facilities and 60 per cent do not<br />
have any kind of drainage facilities. Of those who<br />
have access to latrines, households with pit latrine<br />
Overall the housing<br />
conditions of SCs have<br />
improved considerably,<br />
primarily because of the<br />
massive efforts of the<br />
Government in providing<br />
houses through various<br />
housing programmes such<br />
as Ashraya, Ambedkar<br />
Housing Programme,<br />
Indira Awas Yojana,<br />
Neralina Bhagya, etc. over<br />
the last 25 years.<br />
223
Status of Scheduled Castes in <strong>Karnataka</strong><br />
The fact that the infant<br />
and child mortality<br />
rates for children of SC<br />
mothers are high can be<br />
correlated with the high<br />
levels of illiteracy among<br />
SC women. It is also an<br />
indicator that the nutrition<br />
intake of Scheduled Caste<br />
children and their mothers<br />
is very inadequate during<br />
pregnancy, delivery and<br />
post-delivery.<br />
account for 9.2 per cent, water closets are found<br />
in 8.2 per cent households and ‘others’ comprise<br />
about 3.8 per cent. In households with access<br />
to drainage facilities, open drainage accounts<br />
for about 33.4 per cent and closed drainage for<br />
8.7 per cent.<br />
Districts where the percentage of households<br />
with latrines is below the state average (21.18)<br />
are Bagalkot, Bangalore Rural, Belgaum, Bellary,<br />
Bidar, Bijapur, Chamarajnagar, Chitradurga,<br />
Davangere, Gadag, Gulbarga, Hassan, Haveri,<br />
Kolar, Koppal, Mandya, Raichur and Tumkur<br />
(Census 2001).<br />
Electricity<br />
<strong>Karnataka</strong> has performed well in the provisioning<br />
of electricity to SC households. It is the fi rst<br />
among the southern states to do so, and this is an<br />
outcome of some very pro-active interventions to<br />
provide free electrical connectivity to SC and ST<br />
households.<br />
Districts with a percentage of households below<br />
the state percentage (68.51 per cent) are Bellary,<br />
Bidar, Bijapur, Chamarajnagar, Chikmaglur,<br />
Chitradurga, Dakshina Kannada, Davangere,<br />
Gadag, Gulbarga, Haveri, Kodagu, Koppal, Mysore,<br />
Raichur, Shimoga, Tumkur and Udupi (Appendix<br />
Tables: Series 10).<br />
Healthcare<br />
Several indicators are used to evaluate the quality<br />
of health of people. Unfortunately, data on many<br />
health indicators is not available on a regular<br />
periodical basis for SCs, except for NFHS surveys.<br />
The sample size of SRS (Sample Registration<br />
System) or RCH survey (Reproductive and Child<br />
Health) in the state and country should be<br />
enlarged to allow for estimation of key indicators<br />
for SCs and STs.<br />
Infant and child mortality<br />
Infant and child mortality rates depend upon several<br />
factors such as the mothers’ age at child-birth, their<br />
nutritional levels and the medical care they receive<br />
during pregnancy, delivery and in the postpartum<br />
period. Women’s low educational levels can also<br />
contribute to the high incidence of infant and child<br />
mortality. The NFHS survey 1992-93 notes that<br />
‘infant and child mortality rates are lower for children<br />
of mothers with higher education. For instance, infant<br />
mortality rate for children of illiterate mothers is<br />
90 per 1,000 births, compared with 37 for children<br />
of mothers with at least a high school education.<br />
The risk of dying between birth and age fi ve is more<br />
than three times higher for children born to illiterate<br />
mothers than those born to mothers with a high<br />
school education.’ The fact that the infant and child<br />
mortality rates for children of SC mothers are high<br />
can be correlated with the high levels of illiteracy<br />
among SC women. It is also an indicator that the<br />
nutrition intake of Scheduled Caste children and<br />
their mothers is very inadequate during pregnancy,<br />
delivery and post delivery. During 1992-93,<br />
the neonatal mortality rate for children of SCs<br />
(63.80) was higher than for others (46.70). The<br />
post-neonatal mortality rate was also higher among<br />
SC children (34.60) compared to others (23.90).<br />
Moreover, while infant mortality for SC children, for<br />
the same year, was a high 98.40, for other children<br />
it was 70.60. The child mortality (under fi ve<br />
mortality) for SC children and others was 38.70<br />
(126.00) and 28.60 and (97.10) respectively.<br />
Five years later, the NFHS survey, conducted<br />
in 1998-99, indicated that the situation had<br />
improved considerably: the neonatal mortality<br />
declined to 46.90 for SC children and for others<br />
it went down to 39.60. Post-neonatal mortality<br />
for both SC children (others) also registered a<br />
downward trend with 23.00 (16.80). The infant<br />
mortality rate for SC children came down to<br />
69.90, and the decline for other children was<br />
56.40. Both child mortality and under-fi ve<br />
mortality rates for SC (other) children, showed a<br />
progressive decline of 37.40 and (104.60) and<br />
14.20 and (69.80).<br />
The 2004 DES survey has computed the IMR<br />
for SCs as 65 and it is 52 for the state’s total<br />
population. The female infant mortality rate<br />
(79.66) is much higher than the male infant<br />
mortality rate (49.10). Fever (30.23 per cent) and<br />
respiratory disorders (29.17 per cent) were the<br />
principal causes of mortality. Poverty and illiteracy<br />
are contributory factors in this scenario of multiple<br />
disabilities.<br />
224
<strong>Karnataka</strong> <strong>Human</strong> <strong>Development</strong> <strong>Report</strong> <strong>2005</strong><br />
TABLE 9.16<br />
Distribution of households by availability of electricity, latrine and bathroom facilities in southern states: 2001<br />
(Per cent)<br />
Rural<br />
States General SCs Non-SCs<br />
Electricity Latrine Bathroom<br />
within<br />
house<br />
Electricity Latrine Bathroom<br />
within<br />
house<br />
Electricity Latrine Bathroom<br />
within<br />
house<br />
Andhra Pradesh 59.65 18.15 27.09 43.42 10.15 14.20 63.57 20.08 30.20<br />
<strong>Karnataka</strong> 72.16 17.40 48.07 64.47 9.99 32.77 74.00 19.17 51.72<br />
Kerala 65.53 81.33 56.50 49.77 66.38 30.62 67.66 83.35 59.99<br />
Tamil Nadu 71.18 14.36 20.97 63.42 10.19 11.89 73.91 15.82 24.17<br />
Andhra Pradesh 89.99 78.07 78.48 79.35 62.78 63.20 91.46 80.18 80.59<br />
<strong>Karnataka</strong> 90.53 75.23 79.15 80.51 54.46 62.36 91.92 78.11 81.48<br />
Kerala 84.34 92.02 78.91 67.13 79.45 52.84 85.71 93.02 80.99<br />
Tamil Nadu 88.00 64.33 66.42 70.80 38.37 45.43 91.17 69.12 70.29<br />
Andhra Pradesh 67.17 32.99 39.82 49.54 19.12 22.55 70.94 35.96 43.52<br />
<strong>Karnataka</strong> 78.55 37.50 58.87 68.51 21.18 40.21 80.58 40.80 62.64<br />
Kerala 70.24 84.01 62.12 52.76 68.63 34.44 72.35 85.87 65.45<br />
Tamil Nadu 78.18 35.16 39.89 65.63 18.62 21.92 81.66 39.73 44.86<br />
Source: Registrar General of India, Census 2001.<br />
Urban<br />
Combined<br />
Antenatal care<br />
The NFHS 1992-93 report observes that the<br />
antenatal care (ANC) that mothers receive during<br />
pregnancy ‘can contribute signifi cantly to the<br />
reduction of maternal morbidity and mortality<br />
because it includes advice on correct diet and the<br />
provision of iron and folic acid tablets to pregnant<br />
women. Improved nutritional status, coupled with<br />
antenatal care, can help reduce the incidence of<br />
low birth weight babies and thus reduce perinatal<br />
neonatal and infant mortality’ (NFHS 1992-93).<br />
However, disparities have been reported between<br />
women of different social groups in terms of access<br />
to medical care. According to the NFHS 1992-93<br />
report, ANC coverage of SC women is marginally<br />
lower than for others (Table 9.18).<br />
The NFHS survey in 1998-99 indicates that<br />
there have been improvements in antenatal<br />
services to pregnant women since the previous<br />
survey in 1993-94. The proportion of SC<br />
mothers who received two or more tetanus<br />
toxoid injections during their pregnancies went<br />
up from 62.8 per cent to 68.8 per cent and the<br />
percentage of women who did not receive any<br />
care has come down from 28.4 per cent to 23.5<br />
per cent. However, there was no increase in the<br />
percentage of SC pregnant women who received<br />
iron and folic tablets.<br />
The Sample Survey (DES: 2004A) reveals that the<br />
most reproductive age group is 20-29 years in<br />
which almost 69 per cent of deliveries occurred<br />
(Table 9.19).<br />
It is a good trend that a not insignifi cant<br />
41 per cent of deliveries took place in<br />
PHCs/hospitals and another 26.65 per cent<br />
were attended to by doctors or nurses/ANMs<br />
(Table 9.20). NFHS-2, observes that institutional<br />
deliveries accounted for 45.54 per cent, by<br />
health staff 26.28 per cent and another 24.59<br />
per cent by trained dais.<br />
Family planning<br />
About 47 per cent of SC (married) males and<br />
44.04 per cent of SC (married) females are aware<br />
of birth control methods and 28.07 per cent of<br />
SC (married) females have opted for permanent<br />
birth control. By contrast, only 2.31 per cent of<br />
The antenatal care that<br />
mothers receive during<br />
pregnancy can contribute<br />
significantly to the<br />
reduction of maternal<br />
morbidity and mortality.<br />
It is a good trend that<br />
a not insignificant<br />
41 per cent of deliveries<br />
took place in PHCs/<br />
hospitals and another<br />
26.65 per cent were<br />
attended to by doctors or<br />
nurses/ANMs.<br />
225
Status of Scheduled Castes in <strong>Karnataka</strong><br />
<strong>Karnataka</strong><br />
Year<br />
1993-94<br />
NFHS-1<br />
TABLE 9.17<br />
Infant and child mortality by social groups<br />
Social<br />
groups<br />
Neonatal<br />
mortality<br />
Postneonatal<br />
mortality<br />
Infant<br />
mortality<br />
Child<br />
mortality<br />
Underfive<br />
mortality<br />
SC 63.80 34.60 98.40 38.70 126.00<br />
ST 67.60 18.00 85.60 38.00 120.30<br />
OBC - - - - -<br />
Others 46.70 23.90 70.60 28.60 97.10<br />
SC 46.90 23.00 69.90 37.40 104.60<br />
ST 63.20 21.90 85.00 38.90 120.60<br />
OBC 44.70 15.00 60.60 18.70 78.20<br />
Others 39.60 16.80 56.40 14.20 69.80<br />
SC 63.1 44.2 107.3 46.9 149.1<br />
ST 54.6 35.9 90.5 49.1 135.2<br />
OBC - - - - -<br />
Others 50.6 31.6 82.2 32.0 111.5<br />
SC 53.2 29.8 83.0 39.5 119.3<br />
ST 53.3 30.9 84.2 46.3 126.6<br />
OBC 50.8 25.2 76.0 29.3 103.1<br />
Others 40.7 21.1 61.8 22.2 82.6<br />
Note: Rates given above are for the 10-year period preceding the survey.<br />
All-India<br />
1998-99<br />
NFHS-2<br />
1993-94<br />
NFHS-1<br />
1998-99<br />
NFHS-2<br />
Sources:<br />
1. NFHS-1 1993-94 <strong>Karnataka</strong>, IIPS: Bombay 1995.<br />
2. NFHS-1 1993-94 India, IIPS: Bombay 1995.<br />
3. NFHS-2 1998-99 <strong>Karnataka</strong>, IIPS: Bombay 2001.<br />
4. NFHS-2 1998-99 India, IIPS: Bombay 2000.<br />
SC (married) males have undergone vasectomy.<br />
SC women bear a disproportionate share of the<br />
responsibility for birth control as in the rest of the<br />
population. Overall, awareness and adoption of<br />
birth control is lower among SCs than the total<br />
population (DES: 2004A).<br />
TABLE 9.18<br />
Percentage of tetanus toxoid vaccinations: 1998-99<br />
Category Tetanus Toxoid Injections Iron/folic acid<br />
None One dose Two doses<br />
or more<br />
Don’t know/<br />
missing<br />
Total<br />
per cent<br />
tablets given<br />
SC 23.5 6.8 68.8 0.8 100.0 78.2<br />
ST 33.4 11.0 55.7 0.0 100.0 63.3<br />
Others 14.1 6.2 78.8 0.8 100.0 78.2<br />
Total 23.5 6.6 69.8 0.1 100.0 74.9<br />
Source: NFHS-2, 1998-99, <strong>Karnataka</strong>, IIPS, Mumbai, 2001.<br />
Nutritional status of women and<br />
children<br />
People’s health depends greatly on the adequacy<br />
of their levels of consumption. Substantial<br />
differentials in food consumption patterns by<br />
background characteristics have been reported<br />
(NFHS: 1998-99). Illiterate women have access<br />
to less nutritious and varied diets than literate<br />
women. Women in urban areas are more likely to<br />
include various kinds of nutritious food such as<br />
fruits, eggs, milk/curd, meat, and fi sh in their diets<br />
than their counterparts in rural areas. Hence, the<br />
nutritional status of Scheduled Caste women is<br />
likely to be very inadequate since most of them<br />
are below the poverty line, live in rural areas and<br />
have high levels of illiteracy.<br />
The food consumption patterns of SC women<br />
indicate that only 55.7 per cent of SC women<br />
consume milk or curd compared with 78 per<br />
cent of OBCs and 83.1 per cent of other women.<br />
Consumption of fruit is also poor (39.8 per cent)<br />
compared with 62.2 per cent for other women.<br />
SC women also show low levels of consumption<br />
of other food items such as pulses and beans and<br />
green leafy vegetables.<br />
Substantial differentials become visible in the<br />
food consumption pattern of women by their<br />
background characteristics. This is manifested in<br />
terms of mean height and weight-for-height or<br />
body mass index (BMI). About 11.3 per cent of<br />
SC women were reported to be below the mean<br />
height as against 9.2 per cent of OBC women and<br />
9.4 per cent of other women. About 44.2 per cent<br />
of SC women were below the BMI as against 40.1<br />
per cent of the OBC women and 32.8 per cent of<br />
other women (Table 9.21).<br />
Since the nutritional status of children is strongly<br />
associated with the nutritional status of their<br />
mothers, most SC children are under-nourished<br />
and their nutritional status is considerably below<br />
that of other social groups.<br />
The effects of inadequate nutrition resulting<br />
in a low BMI is very problematic for Scheduled<br />
Caste women who constitute a large segment of<br />
agricultural wage labour. Poor nutritional status,<br />
226
<strong>Karnataka</strong> <strong>Human</strong> <strong>Development</strong> <strong>Report</strong> <strong>2005</strong><br />
caused by poverty, creates a downward spiral into<br />
further poverty as SC women struggle with the<br />
effects of nutrition on their productivity, resulting<br />
in low wages.<br />
State policies<br />
As seen in the preceding paragraphs, state<br />
programmes in provisioning housing and electricity<br />
to SC households have resulted in a visible<br />
improvement in living conditions. The Department<br />
of Social Welfare has a large number of schemes,<br />
which can broadly be categorised as ‘Employment<br />
Generation Programmes’ and ‘Minimum Needs<br />
Programmes’. Despite the multiplicity of schemes,<br />
many of which have small outlays, the bulk of the<br />
expenditure on programmes goes to payment of<br />
scholarships, construction and maintenance of<br />
hostels and residential schools and training for<br />
employment.<br />
The budget of the department was Rs.17,100.00<br />
lakh in the Eighth Plan. It increased by 66 per<br />
cent in the Ninth Plan (Rs. 42,850.00 lakh) and<br />
will increase by 111 per cent in the Tenth Plan<br />
(Rs.60,218.27 lakh). Nevertheless, this is still not<br />
suffi cient to meet expenditure on scholarships<br />
and maintenance of government and grant-in-aid<br />
hostels. The latter has led to cost cutting and the<br />
fi rst casualty is the nutrition of hostel residents.<br />
TABLE 9.19<br />
Percentage distribution of deliveries<br />
by SC women by age group<br />
Age group Percentage of deliveries<br />
< 15 0.00<br />
15-19 11.88<br />
20-24 38.16<br />
25-29 31.03<br />
30-34 12.00<br />
35-39 5.67<br />
40-44 1.05<br />
45 + 0.22<br />
Source: Sample Survey, Directorate of Economics and Statistics,<br />
<strong>Karnataka</strong>, 2004A.<br />
TABLE 9.20<br />
Percentage distribution of type of<br />
assistance at delivery<br />
Type<br />
Percentage<br />
At PHC/hospital 41.28<br />
By Doctor/nurse/ANMs 26.65<br />
Trained dais 17.13<br />
Others 14.95<br />
Source: Sample Survey, Directorate of Economics and Statistics,<br />
<strong>Karnataka</strong>, 2004A.<br />
TABLE 9.21<br />
Nutritional status of women by social groups: 1998-99<br />
Year Category Height Weight-for-Height<br />
1998-99<br />
NFHS-2<br />
1998-99<br />
NFHS-2<br />
<strong>Karnataka</strong><br />
India<br />
Mean<br />
height<br />
(cm)<br />
Per cent<br />
below<br />
145 cm<br />
No. of<br />
women<br />
for height<br />
Mean body<br />
mass index<br />
(BMI)<br />
Per cent with<br />
BMI below<br />
18.5 kg/m²<br />
No. of<br />
women<br />
for BMI<br />
SCs 151.5 11.3 683 19.7 44.2 637<br />
STs 151.9 9.4 236 18.9 49.0 226<br />
OBC 152.2 9.2 1738 20.2 40.1 1657<br />
Others 152.0 9.4 1495 21.2 32.8 1422<br />
SCs 150.3 17 15234 19.5 42.1 14040<br />
STs 150.8 13.5 7175 19.1 46.3 6590<br />
OBC 151 13.5 27295 20.5 35.8 25474<br />
Others 152 10.9 32334 21 30.5 30345<br />
Sources:<br />
1. National Family Health Survey-2 <strong>Karnataka</strong> 1998-99, IIPS, Mumbai, November 2001, p. 156.<br />
2. National Family Health Survey-2 India 1998-99, IIPS, Mumbai, 2000.<br />
227
Status of Scheduled Castes in <strong>Karnataka</strong><br />
TABLE 9.22<br />
Scheduled Castes in <strong>Karnataka</strong>: Key indicators<br />
Sl. No. Type of occupation Units Results<br />
I. General<br />
1 Population ** Lakh 85.64<br />
2 Percentage to total state population ** per cent 16.23<br />
3 Percentage to total Hindu population ** per cent 19.32<br />
II. Education and Literacy<br />
4 Literacy rate ** per cent 52.87<br />
5 Literacy rate * per cent 50.91<br />
6 Levels of education<br />
a. High School * per cent 6.96<br />
b. PUC * per cent 2.30<br />
c. Graduation * per cent 0.86<br />
d. Post-graduation * per cent 0.13<br />
7 Out-of-school children (7-14 Age group) *** per cent 2.22<br />
8 Dropout rates<br />
a. Primary level (7-14 Age group) * per cent 5.03<br />
b. Higher Primary/High School level * per cent 17.12<br />
III. Health Status<br />
9 Sex ratio ** per 1000 males 973<br />
10 Estimated birth rate * per 1000 males 21.82<br />
11 Estimated death rate * per 1000 males 9.12<br />
12 Estimated infant mortality rate * per 1000 live births 64.74<br />
13 Life expectancy at birth * Years 62<br />
14 Type of birth assistance<br />
a. Institutional * per cent 41.28<br />
b. Health staff * per cent 26.65<br />
c. Trained dais * per cent 17.13<br />
15 Access to nutrition programmes<br />
a. Boys * per cent 86.73<br />
b. Girls * per cent 80.99<br />
c. Pregnant women * per cent 68.67<br />
d. Nursing mothers * per cent 58.84<br />
IV. Housing Profile<br />
16 Households by ownership<br />
a. Owned ** per cent 86.2<br />
b. Rented ** per cent 10.6<br />
c. Any other ** per cent 3.2<br />
17 Households by type of structure<br />
a. Permanent ** per cent 51.1<br />
b. Semi-permanent ** per cent 36.6<br />
c. Temporary ** per cent 12.2<br />
18 Toilet facility<br />
a. Within house premises * per cent 6.94<br />
b. Outside house premises * per cent 15.61<br />
c. Public latrine * per cent 5.45<br />
d. Pit latrine ** per cent 9.2<br />
e. Water closet ** per cent 8.2<br />
f. Other latrine ** per cent 3.8<br />
g. No latrine ** per cent 78.8<br />
(Table 9.22 Contd...)<br />
228
<strong>Karnataka</strong> <strong>Human</strong> <strong>Development</strong> <strong>Report</strong> <strong>2005</strong><br />
(Table 9.22 Contd...)<br />
Sl. No. Type of occupation Units Results<br />
19 Type of fuel used for cooking<br />
a. Firewood ** per cent 78.7<br />
b. Cow dung ** per cent 0.2<br />
c. Kerosene ** per cent 7.8<br />
d. LPG ** per cent 5.6<br />
20 Lighting<br />
a. Access to electricity ** per cent 68.5<br />
b. Kerosene ** per cent 30.6<br />
c. Any other ** per cent 0.4<br />
d. No lighting ** per cent 0.5<br />
21 Access to drinking water * per cent 89.60<br />
V. Economic Scenario<br />
22 Type of occupation<br />
a. Cultivator * per cent 5.74<br />
b. Agricultural labour * per cent 19.59<br />
c. Other labour * per cent 10.50<br />
d. Government services * per cent 1.31<br />
23 Per capita income * Rupees 6945<br />
24 Per capita expenditure * Rupees 496<br />
25 Proportion of BPL households * per cent 34<br />
Sources:<br />
1. * Sample Survey, Directorate of Economics and Statistics, <strong>Karnataka</strong>, 2004A.<br />
2. ** Registrar General of India, Census 2001.<br />
3. *** Children’s Census, Department of Public Instruction, <strong>2005</strong>.<br />
TABLE 9.23<br />
Funds pooled under the Special Component Plan<br />
Component 2001-02 2002-03 2003-04 2004-05 <strong>2005</strong>-06<br />
State plan<br />
outlay<br />
Divisible<br />
outlay<br />
State<br />
sector<br />
District<br />
sector<br />
Total<br />
State<br />
sector<br />
District<br />
sector<br />
Total<br />
State<br />
sector<br />
District<br />
sector<br />
Total<br />
State<br />
sector<br />
District<br />
sector<br />
Total<br />
State<br />
sector<br />
District<br />
sector<br />
(Rs. lakh)<br />
750508 108320 858828 794253 66808 861061 909159 68841 978000 1138321 93971 1232292 1155211 200289 1355500<br />
208729 91942 300671 232657 66808 299465 256874 68841 325715 336847 93971 430818 114416 167359 281775<br />
SCP outlay 43183 17475 60658 55573 11167 66740 52164 12387 64551 19073 17627 36700 31136 31744 62880<br />
Pooled SCP<br />
funds<br />
9070 8310 8315 5688 8020<br />
Percentage of<br />
SCP to state 5.75 16.13 7.06 7.00 16.72 7.75 5.74 17.99 6.60 1.68 18.76 2.98 2.70 15.85 4.64<br />
plan outlay<br />
Percentage<br />
of SCP to<br />
divisible<br />
20.69 19.01 20.17 23.89 16.72 22.29 20.31 17.99 19.82 5.66 18.76 8.52 27.21 18.97 22.32<br />
outlay<br />
Percentage<br />
of pooled<br />
funds to state<br />
21.00 14.95 15.94 29.82 25.76<br />
sector SCP<br />
Source: Department of Social Welfare, <strong>Karnataka</strong>.<br />
Total<br />
229
Status of Scheduled Castes in <strong>Karnataka</strong><br />
The greatest single issue<br />
that comes into focus is<br />
the wide gap between<br />
the Scheduled Castes and<br />
the general population<br />
along almost all human<br />
development indicators.<br />
Special Component Plan<br />
The objectives of the Special Component<br />
Plan (SCP) are to ensure that all government<br />
departments earmark 15 per cent of their budget<br />
for the development of the Scheduled Castes, so<br />
that there is a concerted and inter-sectoral focus<br />
on the improvement of the status of the SCs.<br />
During 2004-05, a sum of Rs.367 crore was<br />
earmarked under SCP. The SCP fl uctuates each<br />
year, depending on the quantum of funds available<br />
in the divisible part of the plan. This limits the size<br />
of the SCP.<br />
Pooling SCP funds<br />
Conceptually, a Special Component Plan can ensure<br />
that goods and services under various government<br />
programmes will reach the SC population through<br />
focused targeting. In practice, with the exception<br />
of departments such as Education, Health,<br />
Women and Child <strong>Development</strong>, Housing, Rural<br />
<strong>Development</strong>, the services conveyed to SCs often<br />
did not address their specifi c needs or they were too<br />
sporadically distributed to have a real impact. SCP<br />
funds were fi rst pooled in 1991. In pooling, funds<br />
earmarked under SCP are partially or completely<br />
withdrawn from the government department<br />
concerned and ‘pooled’ to create a large corpus,<br />
which is then strategically deployed to address the<br />
needs of the SCs in three critical sectors: housing,<br />
education (construction of hostels, scholarships)<br />
and irrigation (fi nancing irrigation wells and<br />
pump sets). The focus on irrigation is appropriate<br />
in a context where SC ownership of irrigated land<br />
is very low.<br />
TABLE 9.24<br />
Disposal of cases under P.C.R. and P.A.<br />
Acts: 2003<br />
Details P.C.R Act P.A. Act<br />
Cases reported 69 1293<br />
Cases pending trial 35 602<br />
Under investigation 29 591<br />
Otherwise disposed 2 15<br />
Cases acquitted 0 0<br />
‘B’ <strong>Report</strong>s 3 84<br />
Undetected 0 1<br />
Source: Annual <strong>Report</strong>, Police Department, <strong>Karnataka</strong>, 2003.<br />
Civil rights<br />
The Home Department has a Civil Rights<br />
Enforcement directorate headed by an Additional<br />
Director General of Police to monitor registration<br />
and investigation of cases registered under the<br />
Protection of Civil Rights Act (P.C.R. Act) and<br />
Prevention of Atrocities Act 1989. Details of cases<br />
for 2003 are in Table 9.24.<br />
Issues and Concerns<br />
The greatest single issue that comes into focus<br />
is the wide gap between the Scheduled Castes<br />
and the general population along almost all<br />
human development indicators. Economically,<br />
the SC population is highly concentrated in rural<br />
<strong>Karnataka</strong>. They are dependent on agriculture,<br />
but since they own only 11.65 per cent of<br />
operational holdings, 83.25 per cent of which<br />
is un-irrigated, they derive only 15.4 per cent<br />
of their income from cultivation. A high 52<br />
per cent of marginal holdings are held by SCs.<br />
They crowd the primary sector (78.83 per cent)<br />
where remuneration is low and their share of<br />
the secondary and tertiary sectors is insuffi cient,<br />
probably because of high levels of illiteracy and<br />
a poor vocational skill base. The monthly per<br />
capita expenditure of SCs is the second lowest in<br />
the state at Rs.419 for rural and the lowest for<br />
urban, at Rs.593.<br />
There is a perceptible gap between the state<br />
literacy rate (66.64 per cent) and that of<br />
the Scheduled Castes (52.87). While it is<br />
true that the gap is being bridged more<br />
quickly than in previous decades, it still<br />
means that SCs have a lot of catching up to<br />
do. Their dropout rate in primary schools is<br />
higher than that of the non-SC population.<br />
The academic performance of SC students,<br />
like their non-SC counterparts, starts<br />
declining as they move up from class VII<br />
to class X and then to tertiary education.<br />
The pass percentage of SC students is lower<br />
than that of STs and others in the SSLC<br />
examinations.<br />
The Crude Birth Rate of 21.8 for the state is<br />
equivalent to the estimated birth rate (21.8)<br />
for SCs. The Crude Death Rate is 7.2 for<br />
<strong>Karnataka</strong> and the estimated death rate for<br />
SCs is 9.12 (Sample Survey: DES 2004A).<br />
230
<strong>Karnataka</strong> <strong>Human</strong> <strong>Development</strong> <strong>Report</strong> <strong>2005</strong><br />
<br />
<br />
The infant mortality rate for SC children<br />
is estimated to be 64.74 per 1,000 live<br />
births while it is 52 for the state. The gap<br />
is high. In many ways, SC women share<br />
the characteristics of their gender class and<br />
caste so that two sources of exclusion shape<br />
their performance along several parameters.<br />
They lag behind their male counterparts<br />
in literacy and access to employment. In<br />
this, they share the characteristics of their<br />
gender class. Like other girl students, they<br />
have no diffi culty outperforming their male<br />
counterparts at every stage of the education<br />
stream, provided of course they are not<br />
pulled out of school to do housework or<br />
because the opportunity costs of education<br />
are high. Their health and nutrition profi le is<br />
worse than that of almost all social groups<br />
except STs. This affects their mean height<br />
and body mass index and results in high<br />
IMR, MMR and morbidity. This is one of<br />
the unfortunate outcomes of being located<br />
at the intersection of gender and caste. A<br />
remarkable feature is that the sex ratio of<br />
the SCs is 973 in 2001, which is better than<br />
the state average of 965.<br />
There are some spheres where the status of<br />
the Scheduled Castes is good, if not better<br />
than the general population. The number of<br />
SC houses with access to safe drinking water<br />
is higher than non-SC households. In 1991,<br />
about 52.47 per cent of the total households<br />
in the state had electricity and it increased to<br />
78.55 in 2001. Overall, however, as noted<br />
in chapter 2, the Scheduled Castes are a<br />
decade behind the rest of the population in<br />
human development.<br />
Recommendations<br />
Poverty reduction programmes must focus<br />
on social empowerment instead of being<br />
stand-alone programmes. The SHG strategy,<br />
which has begun to emerge as the main<br />
vehicle of socio-economic development for<br />
women, offers multiple inputs and not just<br />
wages: communication skills, vocational<br />
training, awareness about literacy and<br />
health, participation in community and<br />
political processes, all these are inputs that<br />
the SCs need as they are poor, marginalised<br />
and voiceless. In addition, poverty reduction<br />
programmes must target the SCs because so<br />
many other deprivations arise out of income<br />
<br />
<br />
poverty.<br />
While education under Sarva Shiksha<br />
Abhiyan is poised to increase enrolment and<br />
reduce dropouts in a signifi cant way, many<br />
schemes intended for SCs obviously do not<br />
have the desired outcomes. A school level<br />
tracking system of dropouts, in collaboration<br />
with gram panchayats and CBOs followed<br />
up with counselling is advisable. The low<br />
enrolment of SCs in tertiary and professional<br />
education is a matter of concern. Residential<br />
schools such as the ‘Morarji Desai Residential<br />
Schools’ have been successful in creating high<br />
achievers among poor, rural children and their<br />
role should be extended and strengthened.<br />
In health, poor nutrition is a function of<br />
poverty. The high IMR and MMR of SCs<br />
should be tracked separately to ensure that<br />
policy interventions focus on this vulnerable<br />
group. Pooled funds can be deployed more<br />
intensively in interventions designed to reach<br />
these populations.<br />
Poverty reduction<br />
programmes must focus<br />
on social empowerment<br />
instead of being<br />
stand-alone programmes.<br />
The low enrolment of<br />
SCs in tertiary and<br />
professional education is<br />
a matter of concern.<br />
231
Status of Scheduled Tribes in <strong>Karnataka</strong>
CHAPTER 10<br />
Status of Scheduled Tribes in <strong>Karnataka</strong><br />
Introduction<br />
The Scheduled Tribes are tribes notifi ed under<br />
Article 342 of the Constitution, which makes<br />
special provision for ‘tribes, tribal communities,<br />
parts of, or groups within which the President<br />
may so notify’. There is no defi nition of a tribe<br />
in the Constitution but one may distinguish<br />
some characteristics that are generally accepted:<br />
self-identifi cation, language, distinctive social<br />
and cultural organisation, economic underdevelopment,<br />
geographic location and initially,<br />
isolation, which has been steadily, and in some<br />
cases, traumatically, eroded. Many tribes still live<br />
in hilly and/or forested areas, somewhat remote<br />
from settlements.<br />
Many stereotypes fl ourish about the tribal persona<br />
and tribal society. Many of the tribal people are<br />
undeniably economically under-developed, and<br />
the process of their marginalisation can be traced<br />
to the intrusion of British colonialism, which<br />
quickly detected in the forest that was home<br />
to tribals, great potential for appropriation of<br />
resources. Exploitation of forest-lands by both the<br />
British and the zamindars resulted in the clearing<br />
of huge tracts for commercial crops such as tea,<br />
coffee and rubber and allowing contractors to fell<br />
trees in the very heart of the forest. These actions<br />
deprived the tribal people of their livelihoods<br />
because many of them were hunters and gatherers<br />
of forest produce. The interaction with the outside<br />
world brought the tribal people face to face with<br />
problems they were not equipped to cope with,<br />
such as alcoholism and sexually transmitted<br />
diseases. In the post-Independence period,<br />
while the Constitution protected the rights of the<br />
Scheduled Tribes and accorded them reservation<br />
in the legislature, educational institutions and<br />
government jobs, other ‘development’ activities,<br />
such as the construction of large dams or the<br />
sale of timber, led to the further marginalisation<br />
of some tribes. The scenario is therefore a mixed<br />
one. It may be necessary to use natural resources<br />
to improve the living conditions of the people of<br />
the state, but it must be done in a manner that<br />
is sensitive to ensuring the protection of the<br />
environment, which provides a livelihood to tribal<br />
people.<br />
Apart from the Scheduled Tribes, there are 75<br />
indigenous groups in India known as ‘Primitive<br />
Tribal Groups’. The Tenth Plan of the Central<br />
Government observes that these vulnerable<br />
communities have experienced a ‘decline in their<br />
sustenance base and the resultant food insecurity,<br />
malnutrition and ill-health has forced them to live<br />
in the most fragile living conditions and some of<br />
them are even under the threat of getting extinct’.<br />
In <strong>Karnataka</strong>, the Koragas of Dakshina Kannada<br />
district and the Jenu Kurubas who are concentrated<br />
in the districts of Mysore, Chamarajnagar and<br />
Kodagu are classifi ed as ‘primitive tribes’.<br />
Population<br />
The tribal population of <strong>Karnataka</strong> increased to<br />
34.64 lakh in 2001 from 19.16 lakh in 1991. The<br />
decadal growth rate during this period is a high<br />
80.8 per cent, caused not by a spurt in fertility<br />
rates but by the addition of several new tribes to<br />
the Scheduled Tribes (ST) category. The decadal<br />
growth rate is higher for females (81.9 per cent)<br />
than for males (79.8 per cent). The highest decadal<br />
growth rate occurred in Mysore district (around<br />
328.0 per cent), Bagalkot (261.6 per cent),<br />
Dharwad (201.1 per cent) and Belgaum (193.0<br />
per cent). The decadal growth rate is negative in<br />
Dakshina Kannada (-2.9 per cent).<br />
Raichur (18.1 per cent) has the highest<br />
percentage of ST population followed by Bellary<br />
(18.0 per cent), while Chitradurga (17.5 per<br />
cent), which had the highest percentage of ST<br />
population in 1991 came down to third place in<br />
2001 on account of its bifurcation. The reverse is<br />
true of Raichur. Bellary has the highest population<br />
of Scheduled Tribes as a percentage of the ST<br />
population in the state (10.6) (Appendix Tables:<br />
Series 10).<br />
The tribal population<br />
of <strong>Karnataka</strong> increased<br />
to 34.64 lakh in 2001<br />
from 19.16 lakh in 1991.<br />
The decadal growth rate<br />
during this period is a<br />
high 80.8 per cent, caused<br />
not by a spurt in fertility<br />
rates but by the addition<br />
of several new tribes<br />
to the Scheduled Tribes<br />
category.<br />
235
Status of Scheduled Tribes in <strong>Karnataka</strong><br />
The literacy rate of STs<br />
in <strong>Karnataka</strong> is a cause<br />
for concern, as it has<br />
consistently been lower<br />
than that of the total<br />
population.<br />
Sex ratio<br />
The sex ratio for Scheduled Tribes (972) is higher<br />
than the all-India average (964) for STs as well<br />
as the state average (965) according to the 2001<br />
census. There has been a perceptible improvement<br />
in the sex ratio of STs since 1991 when it was 961.<br />
Among the southern states, Kerala performs well<br />
with 1,021 followed by Tamil Nadu (980). Andhra<br />
Pradesh is below <strong>Karnataka</strong> with 971. The child sex<br />
ratio for the 0–6 age group is also higher (960)<br />
than the state average of 946. Culturally, there is<br />
greater gender equity among the Scheduled Tribes<br />
compared with the general population, which is<br />
largely shaped and driven by a male-dominated<br />
discourse that prioritises son preference.<br />
Across districts, one impressive fi nding is that<br />
Udupi (1023) has a sex ratio higher than Kerala’s<br />
followed by Kodagu and Bagalkot (996) while<br />
Bangalore Urban, typically, has the lowest sex<br />
ratio (913) followed by Haveri (941), Dharwad<br />
and Bijapur (944) and Bidar (950). In Bellary,<br />
which has the highest proportion of ST population<br />
to the state’s ST population, the sex ratio is 985<br />
while Raichur, which has the highest percentage of<br />
ST population to the total population, is in fourth<br />
place with 993 (Appendix Tables: Series 10).<br />
Literacy<br />
It is a well-accepted fact that access to knowledge<br />
is crucial to improving the human development<br />
status of people. Improvements in literacy levels<br />
have positive spin-off effects, such as better health<br />
indicators and an increase in productivity, which<br />
can increase the income levels of poor people<br />
signifi cantly.<br />
The literacy rate of STs in <strong>Karnataka</strong> is a cause<br />
for concern, as it has consistently been lower<br />
than that of the total population. The literacy rate<br />
among Scheduled Tribes, which was 36.0 per cent<br />
in 1991, increased to 48.3 per cent in 2001,<br />
while the state average moved up from 56.04 to<br />
66.64 per cent. The gap between the literacy rate<br />
of the total population and the ST population is<br />
very wide, although there has been a marginal<br />
decline of about 1.6 percentage points in the<br />
last decade. The decennial literacy rate of the ST<br />
population has increased at a faster pace (12.3<br />
per cent) than the rate for the total population<br />
(10.6 per cent). The literacy rate of urban STs<br />
(64.6 per cent) is higher than the overall literacy<br />
rate of STs and compares quite favourably with<br />
the state average.<br />
The female literacy rate among STs in 1991 was<br />
23.6 per cent and it increased to 36.6 per cent in<br />
2001. While it has increased at a faster pace than<br />
the male literacy rate (the increase during the<br />
decade was 13.0 percentage points for females<br />
and 11.8 percentage points for males) the gap<br />
between the ST male and female literacy rate<br />
declined only marginally, from 24.3 in 1991 to<br />
23.1 in 2001, which is slightly higher than the<br />
gap between the male and female literacy rates for<br />
the total population (22.92 in 1991 and 19.22 in<br />
2001). The literacy rate for ST women is the lowest<br />
in the state in comparison with all women as well<br />
as Scheduled Caste women. The literacy rate for<br />
rural ST women is a low 33.3 per cent compared<br />
with 56.9 per cent for men (Table 10.1).<br />
Overall, the Scheduled Tribes in the state have<br />
markedly lower literacy rates than other groups.<br />
The fact that they are above the all-India average<br />
in respect of men and women is, of course, an<br />
indicator that <strong>Karnataka</strong> has performed better<br />
than many other states in this respect. However,<br />
the literacy status of the STs in <strong>Karnataka</strong>, which is<br />
in marked contrast to the improvements in literacy<br />
of other social groups, is a matter of concern and<br />
needs strong policy initiatives to push up literacy<br />
levels signifi cantly.<br />
Dakshina Kannada district (72.95 per cent) has<br />
the highest literacy rate followed by Bangalore<br />
Urban (72.83 per cent), Udupi (69.62 per cent),<br />
Uttara Kannada (62.74 per cent), Shimoga<br />
(62.11 per cent), Tumkur (59.69 per cent) and<br />
Chikmaglur (58.84 per cent). The literacy rate is<br />
the lowest in Raichur (29.01 per cent), followed<br />
by Gulbarga (32.40 per cent) and Kodagu (40.37<br />
per cent).<br />
While the literacy rate of Scheduled Tribes has<br />
improved in the decade 1991-2001, they still<br />
have a long way to go before they catch up with<br />
the rest of the population. The ST literacy rate in<br />
236
<strong>Karnataka</strong> <strong>Human</strong> <strong>Development</strong> <strong>Report</strong> <strong>2005</strong><br />
State/<br />
Country<br />
India<br />
<strong>Karnataka</strong><br />
TABLE 10.1<br />
Scheduled Tribes’ literacy rates by sex and region: 1991 and 2001<br />
(Per cent)<br />
Area 1991 2001<br />
Total<br />
Rural<br />
Urban<br />
Total<br />
Rural<br />
Urban<br />
Source: Registrar General of India, Census 1991 and 2001.<br />
Persons Male Female Persons Male Female<br />
29.6 40.6 18.2 47.1<br />
45.0<br />
69.1<br />
36.0 47.9 23.6 48.3<br />
45.3<br />
64.6<br />
59.2<br />
57.4<br />
77.8<br />
59.7<br />
56.9<br />
74.4<br />
34.8<br />
32.4<br />
59.9<br />
36.6<br />
33.3<br />
54.3<br />
2001 (48.3 per cent) was even lower than the<br />
literacy rate of the total population in 1991 (56.04<br />
per cent), placing them more than a decade<br />
behind in literacy levels. Though the literacy rate<br />
for women has increased at a faster pace than<br />
for males, it is still problematic because it is so<br />
much lower than the literacy rate for all women<br />
in 2001. Districts that have high literacy rates<br />
have also done well with regard to STs with the<br />
exception of Kodagu. This is clear when we look<br />
at the statistics of districts with low literacy rates,<br />
such as Raichur (48.81) and Gulbarga (50.01),<br />
where the literacy for STs is also poor (29.01 and<br />
32.40 respectively).<br />
The low literacy level suggests that the<br />
programmes of the Education Department have<br />
not had the desired effect on this very vulnerable<br />
sub-population. More concerted efforts are<br />
required to bring STs’ literacy on par with the<br />
state average, at the very least. Culture-specifi c<br />
curricula would be a step in the right direction.<br />
Since illiteracy and poverty are factors that play<br />
off one another to create a cycle of deprivation,<br />
ensuring greater cohesion at the gram panchayat<br />
level between anti-poverty programmes and<br />
school enrolment/retention drives would provide<br />
the poor with viable ways to access education.<br />
Education<br />
Low literacy rates are matched by less than<br />
satisfactory educational attainments across<br />
all levels of primary, secondary and tertiary<br />
education. Many schools in tribal areas suffer<br />
from high dropout rates. Children either never<br />
enrol or attend for the fi rst three to four years of<br />
primary school, only to lapse into illiteracy later.<br />
The attrition rate is quite strong at various levels<br />
of the educational system thereafter. The fi rst<br />
step in the education ladder is enrolment, where<br />
performance is high for most social groups,<br />
except STs. For instance, the gross enrolment<br />
ratio (GER) in 2001, for STs for Classes I–VIII<br />
(90.12) was signifi cantly lower than the GER<br />
for all students (98.81) and SCs (104.57). This<br />
inequality is heightened even more by the gap<br />
between the GER for south <strong>Karnataka</strong> (110.62)<br />
and north <strong>Karnataka</strong> (74.21). The GER for girls<br />
(103.64) is also much better in the southern<br />
districts than in north <strong>Karnataka</strong> (70.22). In that<br />
respect, the GER of the Scheduled Tribes in south<br />
<strong>Karnataka</strong> more closely approximates the overall<br />
GER of other social groups. The northern districts<br />
are caught up in a cycle of deprivation: they have<br />
the highest levels of ST population and also have<br />
poor human development indicators.<br />
Among districts, Bangalore Urban (319.10) and<br />
Bijapur (270.65) had high GERs, but then, the<br />
proportion of ST population in these districts<br />
is not signifi cantly high. Districts with high<br />
ST populations did not perform well: Bellary<br />
(76.47), Raichur (58.21) and Bidar (48.76) are<br />
well below the state average. Kodagu has the<br />
lowest (73.41) GER in south <strong>Karnataka</strong>, followed<br />
by Davangere (76.23), Chamarajnagar (86.02)<br />
and Chitradurga (87.03). It is noteworthy that<br />
the ST population of Chitradurga and Davangere<br />
forms a signifi cant percentage of the state’s total<br />
ST population.<br />
Since illiteracy and<br />
poverty are factors that<br />
play off one another<br />
to create a cycle of<br />
deprivation, ensuring<br />
greater cohesion at the<br />
gram panchayat level<br />
between anti-poverty<br />
programmes and school<br />
enrolment/retention<br />
drives would provide the<br />
poor with viable ways to<br />
access education.<br />
237
Status of Scheduled Tribes in <strong>Karnataka</strong><br />
Unequal access to<br />
schooling is further<br />
exacerbated by the fact<br />
that ST children stay<br />
in school for the least<br />
amount of time, as<br />
indicated by the mean<br />
years of schooling.<br />
Unequal access to schooling is further exacerbated<br />
by the fact that ST children stay in school for the least<br />
amount of time, as indicated by the mean years of<br />
schooling. Scheduled Tribe children have the lowest<br />
levels of achievement (4.166 years) compared with<br />
SC (4.235 years) and non-SC/ST (4.458 years)<br />
children. Not surprisingly, in this context, then, ST<br />
children also constitute the highest percentage of<br />
out-of-school children (2.42), compared with the<br />
state average of 1.54 per cent. The percentage of<br />
out-of-school ST girls (2.67) is the highest across<br />
all categories (Table 10.2).<br />
The Sample Survey of ST households conducted by<br />
the Department of Economics and Statistics in 2004,<br />
which elicited responses from persons in the age<br />
group 9–35 years, found that the principal reasons<br />
for females dropping out of school were (i) to work<br />
at home and (ii) their parents could not afford to<br />
pay for their education. The reasons are identical<br />
to the ones adduced to SC girls and indicate that<br />
the poor cannot afford the high opportunity costs<br />
of education. Girls are the fi rst to be pulled out of<br />
school to work at home and take care of siblings<br />
to enable their mothers to work. In such cases,<br />
families do not fi nd the many incentives offered by<br />
the government such as free uniforms, text books<br />
and even scholarships, an adequate compensation<br />
for lost wages. For boys, family work is the main<br />
reason for dropping out. Akshara Dasoha, the<br />
recently introduced midday meals programme for<br />
school children, will have a more sustained impact<br />
on ensuring enrolment and retention hereafter.<br />
Enrolment in secondary education is lower than<br />
in primary education. This is part of a pattern of<br />
attrition, which increases with levels of education<br />
TABLE 10.2<br />
Percentage of out-of-school children in<br />
the age group 7–14<br />
Category Boys Girls Total<br />
All 1.47 1.62 1.54<br />
SCs 1.99 2.47 2.22<br />
STs 2.11 2.67 2.42<br />
Muslims 1.30 1.24 1.27<br />
Source: Children’s Census, Department of Public Instruction,<br />
<strong>Karnataka</strong>, <strong>2005</strong>.<br />
and occurs across all social groups. The GER, in<br />
Classes I–X, in 2000-01, was 81.17, which was<br />
considerably lower than the GER for SCs (94.31)<br />
and all students (89.95). The differential between<br />
boys (85.59) and girls (76.51) was also higher<br />
than for SCs and all students. As with primary<br />
education, there is a marked disparity between<br />
the GER for south <strong>Karnataka</strong> (100.10) and north<br />
<strong>Karnataka</strong> (66.03). While a similar regional trend<br />
exists for all students and SCs, the disparity is not<br />
as high as it is with STs; Gulbarga (32.86), Bidar<br />
(43.06) and Chitradurga (77.93) were all below<br />
the state average. GER for Bellary and Raichur<br />
(61.89 and 43.89), which have the highest<br />
proportion of ST population, is very poor.<br />
What are the outcomes for students who overcome<br />
the barriers of poverty and gender and stay the<br />
course? Surprisingly good, if performance in school<br />
examinations is taken as an indicator of educational<br />
attainment. Scheduled Tribe students performed<br />
well in the Class VII examinations in 2002, with a<br />
pass percentage of 88.25, which was higher than<br />
the pass percentage of all students (87.31) and SC<br />
students (87.87). Girls (89.41) had an edge over<br />
boys (87.39) as in all social groups. The inference is<br />
that girls will perform well academically, if they are<br />
enabled to overcome the socio-economic constraints<br />
that keep them out of school. This is apparent when<br />
we look at the percentage of students who passed<br />
the S.S.L.C examinations from 2001–<strong>2005</strong> where<br />
ST girls have outperformed ST boys, SC boys and<br />
SC girls (Table 10.3).<br />
In <strong>2005</strong>, ST girls had a pass percentage of 55.18,<br />
which is higher than the percentage of ST and<br />
SC boys and SC girls. This outcome only serves to<br />
support the earlier fi nding that the performance<br />
of girl students in general, and ST girl students in<br />
particular, is exemplary, once they make it past the<br />
roadblocks. As the Sample Survey (DES: 2004A)<br />
found, the dropout rate increased with levels of<br />
education. In the sample surveyed, there were<br />
only 0.18 per cent women graduates and 1.40<br />
per cent male graduates, and only 0.02 per cent<br />
ST women were post-graduates.<br />
Scheduled Tribe students, in general tertiary<br />
education, cluster primarily in government<br />
238
<strong>Karnataka</strong> <strong>Human</strong> <strong>Development</strong> <strong>Report</strong> <strong>2005</strong><br />
colleges. In 2003-04, STs constituted 4.46 per<br />
cent of students in government colleges and<br />
2.80 per cent in private aided colleges. There<br />
is a marked disparity in the enrolment of boys<br />
(3,209) and girls (1,652). This gap in male and<br />
female enrolment in general degree courses<br />
is uniform across government and private<br />
aided colleges. The percentage of ST students<br />
in engineering colleges averaged 0.1 per cent<br />
from 1996 to 2000 and went up to 1.7 per<br />
cent in 2002-03. Scheduled Tribes enrolment in<br />
engineering diploma courses is a minimal 0.2<br />
per cent (Annual <strong>Report</strong>s, DTE; Annual <strong>Report</strong><br />
VTU 2002-03). This places young ST graduates<br />
in a disadvantageous position when they seek<br />
jobs in a market that wants trained technical<br />
professionals. They are ill-equipped to take<br />
advantage of the IT-fuelled boom in jobs in<br />
<strong>Karnataka</strong>.<br />
Economic status<br />
Historically, the tribal economy was based on<br />
subsistence agriculture and/or hunting and<br />
gathering. However, since the tribal people treated<br />
land as a common resource, they rarely had land<br />
titles, and thus, lost their lands to outsiders when<br />
exploitation of forest resources began to take place<br />
on a signifi cant scale. This ensured that a majority<br />
ended up as small and marginal landholders.<br />
The 2001 Census data reveals that around half the<br />
ST population is in the workforce. Women constitute<br />
about 41.7 per cent of the workforce. More than<br />
85 per cent of the working population is in rural<br />
areas. The distribution of main workers (76.4<br />
per cent) is concentrated in the rural parts of the<br />
state where a high 51.5 per cent work. Bellary has<br />
the highest percentage of main workers (11.5 per<br />
cent) followed by Raichur (7.8 per cent). The highest<br />
percentage of ST marginal workers lives in Raichur<br />
(11.7), which also has the highest proportion of<br />
the ST population to the total population, clearly<br />
indicating their highly precarious livelihood status.<br />
Land holdings<br />
The data analysed in this section shows that STs<br />
largely own low-productivity assets: the principal<br />
asset being their own labour. This scenario is<br />
exacerbated by their low literacy and lack of<br />
TABLE 10.3<br />
Percentage of students who passed the SSLC examinations: 2001-05<br />
Year All SCs STs<br />
Girls Boys Girls Boys Girls Boys<br />
2001 52.44 40.22 38.09 39.05 40.47 38.24<br />
2002 53.76 48.54 37.74 35.96 39.47 34.91<br />
2003 58.54 52.19 41.15 39.06 43.47 39.84<br />
2004 68.06 61.74 53.30 50.41 55.80 54.01<br />
<strong>2005</strong> 66.10 59.30 50.31 47.29 55.18 49.55<br />
Source: <strong>Karnataka</strong> State Secondary Education Board, Bangalore.<br />
TABLE 10.4<br />
Percentage distribution of ST population aged 7+ years<br />
by levels of education<br />
Level of Education Male Female ST literacy levels SC literacy levels<br />
Not literate 48.19 55.30 51.61 49.07<br />
Literate without formal education 1.68 0.72 1.22 1.78<br />
Literate below primary 17.01 18.43 17.69 16.89<br />
Primary 10.70 11.68 11.17 11.81<br />
Higher primary 10.53 7.32 8.99 9.78<br />
High school 7.29 5.27 6.32 6.96<br />
PUC 2.36 0.66 1.54 2.30<br />
Diploma 0.34 0.12 0.23 0.25<br />
Graduate 1.40 0.18 0.81 0.86<br />
Post-graduate 0.15 0.02 0.09 0.13<br />
Technical graduate 0.06 0.00 0.03 0.07<br />
Technical post-graduate 0.05 0.00 0.03 0.03<br />
Handicrafts (skills) 0.23 0.30 0.27 0.07<br />
Source: Sample Survey, Directorate of Economics and Statistics, <strong>Karnataka</strong>, 2004A.<br />
vocational skills, which pushes them into jobs<br />
with poor remuneration, where men, women<br />
and children, between them, earn insuffi cient<br />
wages, as represented by their monthly per capita<br />
expenditure. Urban STs are slightly better placed<br />
than their rural counterparts. According to the<br />
2001 Census, 7.65 per cent of STs are cultivators,<br />
11.86 per cent are agricultural labourers and 4.70<br />
are in household industry. The largest percentages<br />
of ST women are in household industries (58.80)<br />
and agricultural labour (57.90). Only 29.89 per<br />
cent of ST cultivators are women.<br />
239
Status of Scheduled Tribes in <strong>Karnataka</strong><br />
TABLE 10.5<br />
Category-wise working population of Scheduled<br />
Tribes in <strong>Karnataka</strong>: 2001<br />
(Per cent)<br />
Category Total Rural Urban<br />
Persons Male Female Persons Male Female Persons Male Female<br />
Workers 49.4 58.3 41.7 51.5 57.6 45.3 37.6 52.6 21.9<br />
Non-workers 50.6 41.7 58.3 48.5 42.4 54.7 62.4 47.4 78.1<br />
Main workers 77.9 87.9 63.8 76.4 87.2 62.3 89.1 92.4 81.1<br />
Marginal<br />
workers<br />
22.1 12.1 36.2 23.6 12.8 37.7 10.9 7.6 18.9<br />
Note: Percentages are estimated.<br />
Source: Registrar General of India, Census 2001.<br />
Rural Scheduled Tribes<br />
had the lowest monthly<br />
per capita expenditure<br />
of Rs.404, compared<br />
with Rs.419 for all social<br />
groups and much lower<br />
than the average MPCE<br />
of Rs.500 for all rural<br />
groups.<br />
TABLE 10.6<br />
Ownership of agricultural land<br />
Type of agricultural land Percentage<br />
Rural ST households possessing land 57.39<br />
Irrigated 17.05<br />
Un-irrigated 74.35<br />
Partially irrigated 8.60<br />
Source: Sample Survey, Directorate of Economics and Statistics,<br />
<strong>Karnataka</strong>, 2004A.<br />
The Sample Survey shows that while 57.39 per<br />
cent of rural ST households owned agricultural<br />
land, a high 74.35 per cent of it was not irrigated.<br />
The percentage of total area irrigated in the<br />
state to gross area sown was 21 per cent<br />
(2002-03).<br />
The <strong>Karnataka</strong> Agricultural Census 2001<br />
established that STs hold 30.9 per cent of small<br />
and 19.4 per cent of semi-medium holdings.<br />
There is not much difference between STs and<br />
others here, but ST ownership of medium and large<br />
holdings is a low 7.9 and 1.0 per cent respectively<br />
(Table 10.7).<br />
The majority of STs have small units with low<br />
productivity, which are so economically unviable<br />
that landholders are compelled to work as wage<br />
labour to survive.<br />
Sources of income<br />
The NSS (1999-2000) data shows that the<br />
largest percentage of rural ST households (12.8)<br />
reported rent as a source of income, followed by<br />
wages/salaried employment (9.7), cultivation<br />
(7.7), fi shing and other agricultural enterprises<br />
(6.7). In Andhra Pradesh, which has a signifi cant<br />
tribal population, 11.4 per cent derived income<br />
from fi shing and other agricultural activities and<br />
8.9 per cent from cultivation. An analysis of the<br />
income levels of STs in the Sample Survey (DES:<br />
2004A) reveals a wide gap of more than 100 per<br />
cent between STs in urban areas and their rural<br />
counterparts. The annual per capita income of rural<br />
STs is Rs.4,768, as compared with Rs.10,987 for<br />
urban STs. The percentage of families below the<br />
poverty line in the rural ST population is 40 while<br />
it is 25 for the urban ST population.<br />
Rural Scheduled Tribes had the lowest monthly per<br />
capita expenditure (MPCE) of Rs.404, compared<br />
with Rs.419 for all social groups and much lower<br />
than the average MPCE of Rs.500 for all rural<br />
groups. In urban <strong>Karnataka</strong>, the MPCE for STs<br />
was Rs.634, which was again below the state<br />
average MPCE of Rs.911. Not surprisingly, the<br />
MPCE of STs is the lowest in rural areas given their<br />
concentration in rural areas and their dependence<br />
TABLE 10.7<br />
Ownership of land holdings by size<br />
Class size Scheduled Tribes Others<br />
No. of holdings Area<br />
(lakh hectare)<br />
No. of holdings Area<br />
(lakh hectare)<br />
Small 30.9 25.3 26.3 21.0<br />
Semi-medium 19.4 29.7 18.3 27.9<br />
Medium 7.9 25.3 8.6 28.3<br />
Large 1.0 7.7 1.4 11.4<br />
Source: Agricultural Census 2001, Directorate of Economics and Statistics, <strong>Karnataka</strong>, 2003.<br />
240
<strong>Karnataka</strong> <strong>Human</strong> <strong>Development</strong> <strong>Report</strong> <strong>2005</strong><br />
on subsistence agriculture and agricultural labour<br />
(NSSO 55th round, 1999-2000). Table 10.8<br />
shows the MPCE for the southern states and<br />
Madhya Pradesh, which has a signifi cant tribal<br />
population.<br />
Table 10.9 shows an increase in the MPCE of<br />
urban households but a perceptible decline in the<br />
expenditure of rural households since 1999-2000.<br />
The decline in rural expenditure is disturbing and<br />
could be the effect of the increasing casualisation<br />
of labour.<br />
Healthcare<br />
Data on health, except for NFHS surveys, does not<br />
contain information disaggregated by social groups<br />
on a regular basis. Lack of data is a constraint<br />
when it comes to tracking the health indicators of<br />
the ST population. This section uses data from the<br />
NFHS surveys and the Sample Survey to develop<br />
a profi le of the health and nutritional status of STs<br />
in the state.<br />
The Sample Survey estimated the crude birth rate<br />
(CBR) at 22.79, which is marginally higher than<br />
the state average of 21.8. The crude death rate<br />
(CDR) is estimated at 8.50 which is again higher<br />
than 7.50 for the general population. The CDR is<br />
lower for STs than SCs (9.12) in the state. Most<br />
of the health indicators show deterioration in the<br />
health of women and children. The health status<br />
of the tribal population is not on par with the<br />
rest of the state’s population. The infant mortality<br />
rate (IMR) of STs (64.37) is much higher than<br />
the state average (52.0); the IMR for STs is<br />
marginally lower than the IMR for SCs (64.74)<br />
and there is a marked difference between male<br />
(75.84) and female IMR (54.48). The Sample<br />
Survey found that the principal causes of death<br />
among infants are diseases of the circulatory<br />
system (49.06 per cent) and respiratory system<br />
(23.45). Disturbingly enough, NFHS data for<br />
1992-93 and 1998-99 shows regressive trends<br />
with the total fertility rate increasing to 2.38 from<br />
2.15, the post-neonatal mortality rates to 21.9<br />
from 18.0, the child mortality rate to 38.9 from<br />
38.0 and the under-fi ve mortality rate to 120.6<br />
from 120.3. Only the neonatal mortality rate fell<br />
to 63.2 from 67.6 (Table 10.10). These fi gures<br />
present a grim picture of the health status of ST<br />
women and children.<br />
There are many reasons for infant and maternal<br />
deaths: the mother’s age at the time of delivery,<br />
her nutritional status, access to antenatal<br />
care (ANC) and postpartum healthcare are all<br />
signifi cant factors that determine whether women<br />
and their infants will survive the challenges posed<br />
by pregnancy and childbirth. The Sample Survey<br />
reveals that the most reproductive age group<br />
among STs in <strong>Karnataka</strong> is 20–29 years, which<br />
accounts for about 71.0 per cent of births. Given<br />
this data, the age of the mother is probably a<br />
TABLE 10.8<br />
MPCE: <strong>Karnataka</strong> and selected states<br />
State Rural Urban<br />
Andhra Pradesh 383 635<br />
<strong>Karnataka</strong> 404 634<br />
Kerala 674 994<br />
Madhya Pradesh 325 567<br />
Tamil Nadu 384 1076<br />
Source: National Sample Survey Organisation, 55th round:<br />
1999-2000.<br />
Region<br />
TABLE 10.9<br />
Income and expenditure: 2004<br />
Annual<br />
per capita<br />
income<br />
(Rs.)<br />
Monthly<br />
per capita<br />
expenditure<br />
(Rs.)<br />
Percentage<br />
of BPL<br />
families<br />
Rural 4768 386 40<br />
Urban 10987 735 25<br />
Total 5713 439 38<br />
Source: Sample Survey, Directorate of Economics and Statistics,<br />
<strong>Karnataka</strong>, 2004A.<br />
Year<br />
Data on health, except<br />
for NFHS surveys, does<br />
not contain information<br />
disaggregated by social<br />
groups on a regular<br />
basis. Lack of data is a<br />
constraint when it comes<br />
to tracking the health<br />
indicators of the ST<br />
population.<br />
TABLE 10.10<br />
Total fertility rate and child mortality: Some indicators<br />
Total<br />
fertility rate<br />
Neonatal<br />
mortality<br />
rate<br />
Post-neonatal<br />
mortality rate<br />
Child<br />
mortality rate<br />
Under-5<br />
mortality rate<br />
1992-93 2.15 67.6 18 38 120.3<br />
1998-99 2.38 63.2 21.9 38.9 120.6<br />
Sources:<br />
1. National Family Health Survey-1 <strong>Karnataka</strong> 1992-93, IIPS, Mumbai, February 1995.<br />
2. National Family Health Survey-2 <strong>Karnataka</strong> 1998-99, IIPS, Mumbai, November 2001.<br />
241
Status of Scheduled Tribes in <strong>Karnataka</strong><br />
TABLE 10.11<br />
Antenatal care during pregnancy<br />
(Per cent)<br />
Year Source Total No ANC<br />
At home by health<br />
worker<br />
Doctors Other health<br />
professionals<br />
1992-93 20.5 53.6 4.5 78.6 21.4<br />
1998-99 9.9 48.5 13.4 71.8 28.2<br />
Sources:<br />
1. National Family Health Survey-1 <strong>Karnataka</strong> 1992-93, IIPS, Mumbai, February 1995.<br />
2. National Family Health Survey-2 <strong>Karnataka</strong> 1998-99, IIPS, Mumbai, November 2001.<br />
Ensuring that women<br />
receive professional care<br />
during childbirth and in<br />
the postpartum period<br />
will greatly reduce infant<br />
and maternal deaths<br />
caused by prolonged<br />
or complicated labour,<br />
eclampsia, haemorrhage<br />
and infections.<br />
lesser contributory factor than undernutrition and<br />
lack of access to healthcare services.<br />
Antenatal care<br />
Here too, women’s access to antenatal care<br />
has either worsened or remained static. The<br />
percentage of tribal women receiving no antenatal<br />
care has increased to 28.2 per cent from 21.4 per<br />
cent during the period 1993-98. Pregnant women<br />
receiving antenatal care from registered medical<br />
practitioners also showed a decline from 53.6 per<br />
cent to 48.5 per cent during the same period.<br />
While the percentage of women not getting<br />
tetanus toxoid vaccinations at any time showed<br />
only a negligible increase from 33.0 per cent to<br />
33.4 per cent, those receiving iron and folic acid<br />
showed a slight increase from 61.6 per cent to<br />
63.3 per cent (Table 10.12). This leaves a very<br />
large number outside the purview of antenatal<br />
care and the protection it affords to the mother<br />
and her infant.<br />
Institutional deliveries<br />
Ensuring that women receive professional care<br />
during childbirth and in the postpartum period<br />
will greatly reduce infant and maternal deaths<br />
caused by prolonged or complicated labour,<br />
eclampsia, haemorrhage, infections, etc. The<br />
NFHS data indicates that there was a marginal<br />
increase in institutional deliveries from 26.8<br />
per cent in 1992-93 to 31 per cent in 1998-<br />
99. The Sample Survey (DES: 2004A) suggests<br />
that the situation has improved signifi cantly<br />
with the percentage of births receiving some<br />
kind of professional care being a high 63.36 per<br />
cent, with another 24.08 per cent attended by<br />
trained dais. While this is a good development,<br />
the outcomes in terms of lowered IMR and MMR<br />
are yet to become visible. The inaccessibility of<br />
ST habitations, combined with high absenteeism<br />
of medical staff in primary healthcare centres,<br />
further contribute to the diffi culties that tribal<br />
people have in availing basic health facilities.<br />
Genetic and other diseases<br />
There are also certain genetic disorders and<br />
defi ciency diseases specifi c to tribal areas such<br />
as GEPD and sickle cell anaemia. Malaria,<br />
tuberculosis and sexually transmitted diseases<br />
are other areas of concern. Cases of HIV/AIDS<br />
too have made their appearance among the tribal<br />
TABLE 10.12<br />
Tetanus toxoid vaccinations and iron/folic acid tablets during pregnancy<br />
(Per cent)<br />
Year None One Two or more Iron and folic acid tablets or syrup<br />
1992-93 33.0 8.0 59.0 61.6<br />
1998-99 33.4 11.0 55.6 63.3<br />
Sources:<br />
1. National Family Health Survey-1 <strong>Karnataka</strong> 1992-93, IIPS, Mumbai, February 1995.<br />
2. National Family Health Survey-2 <strong>Karnataka</strong> 1998-99, IIPS, Mumbai, November 2001.<br />
242
<strong>Karnataka</strong> <strong>Human</strong> <strong>Development</strong> <strong>Report</strong> <strong>2005</strong><br />
population. Given the isolation of some tribes, their<br />
traditional healing systems should be allowed to<br />
complement modern medical care practices. Many<br />
ST habitations are located in remote areas in the<br />
forest where immediate attention by trained<br />
medical staff is rarely available when it is most<br />
needed, so traditional healthcare can fi ll this<br />
breach.<br />
Nutrition<br />
The nutritional status of an individual depends<br />
partly on income but also on awareness of the<br />
importance of the nutritional content of food. The<br />
diet of ST women is likely to be low in terms of<br />
consumption of fruit (39.8 per cent), eggs (49.4 per<br />
cent) and chicken, meat, fi sh (26.6 per cent). Their<br />
consumption of milk/curd is higher than that of SCs,<br />
but less than OBCs and others, and contains some<br />
amount of pulses, beans, green leafy vegetables<br />
and other vegetables. If this is juxtaposed with data<br />
relating to the consumption patterns of (i) poor<br />
women whose consumption of milk, curd, fruit and<br />
vegetables is less than that of high income women<br />
and (ii) rural women whose consumption of milk,<br />
curd, fruit and meat is below that of urban women,<br />
then it is not surprising that ST women have very poor<br />
nutritional levels (NFHS-2, 1998-99). Malnutrition is<br />
of many kinds: there is protein-energy malnutrition<br />
and micronutrient malnutrition caused by inadequate<br />
dietary intake, as well as intake of food insuffi cient in<br />
protein and micronutrients. Mal- and under-nutrition<br />
are refl ected in the statistics relating to height and<br />
body mass. Among rural women, 9.4 per cent were<br />
below the mean height (which is on par with OBCs<br />
and others and less than SCs) and 49.0 per cent<br />
were below the body mass index (BMI), which is<br />
much worse than for all social groups. At the all-<br />
India level, 13.5 per cent were below the mean<br />
height and a high 46.3 per cent were below the BMI,<br />
which is poorer than SCs (42.1), OBCs (35.8) and<br />
others (30.5) (see Table 9.21, chapter 9). Given their<br />
poverty levels, ST women have very high levels of<br />
under-nutrition. Tribal children also suffer from sharp<br />
levels of under-nutrition (Table 10.13).<br />
Policies directed at reducing under-nutrition<br />
among children and women must also target<br />
the dietary intake of adolescent girls in addition<br />
to focusing on pregnant and nursing mothers.<br />
Government programmes include ICDS, for<br />
children in the age group 0–6, pregnant women<br />
and nursing mothers, the public distribution<br />
system (PDS), which provides 10 kg of rice<br />
and wheat at Rs.3.0 per kg to the poor and<br />
midday meals for school children. The midday<br />
meals scheme is a big step in the right direction<br />
but, unfortunately, it does not address the<br />
nutrition needs of out-of-school children,<br />
many of whom are girls. Another cause of poor<br />
nutrition could be the declining access of the<br />
tribal people to forest areas, which had earlier<br />
provided them with food rich in protein and<br />
micronutrients. Nutrition security through kitchen<br />
gardens is an intervention that would pay rich<br />
dividends.<br />
Family planning<br />
Awareness of birth control methods is relatively<br />
high among ST married males (48.0 per cent)<br />
and married females (45.0 per cent). Permanent<br />
forms of birth control appear to be the preferred<br />
mode, with 26.30 per cent women and a low<br />
Another cause of poor<br />
nutrition could be the<br />
declining access of the<br />
tribal people to forest<br />
areas, which had earlier<br />
provided them with<br />
food rich in protein and<br />
micronutrients.<br />
TABLE 10.13<br />
Nutrition status of children<br />
Year Weight-for-age Height-for-age Weight-for-height<br />
% < 3SD<br />
(severely<br />
underweight)<br />
% < 2SDI<br />
(underweight)<br />
% < 3SD<br />
(severely<br />
stunted)<br />
% < 2SDI<br />
(stunted)<br />
% 3SD<br />
(severely<br />
wasted)<br />
% 2SDI<br />
(wasted)<br />
1992-93 26.4 66.7 26.4 56.9 6.9 26.4<br />
1998-99 28.7 55.7 22.1 41.2 1.1 21.0<br />
Sources:<br />
1. National Family Health Survey-1 <strong>Karnataka</strong> 1992-93, IIPS, Mumbai, February 1995.<br />
2. National Family Health Survey-2 <strong>Karnataka</strong> 1998-99, IIPS, Mumbai, November 2001.<br />
243
Status of Scheduled Tribes in <strong>Karnataka</strong><br />
Almost 89.0 per cent of<br />
ST villages surveyed have<br />
a drinking water facility<br />
within the village and<br />
the sources comprise<br />
bore-wells with hand<br />
pumps, mini water supply<br />
and piped water supply<br />
schemes. Three out of four<br />
villages have adequate<br />
drinking water supply<br />
during all seasons.<br />
1.58 per cent men selecting permanent birth<br />
control (DES: 2004A). The brunt of family<br />
planning is borne by women, possibly because<br />
they have a higher stake in not becoming<br />
pregnant frequently and because men are not<br />
prepared to take equal responsibility for birth<br />
control, or possibly, because healthcare providers<br />
fi nd it easier to target women.<br />
Sanitation<br />
An unsanitary environment contributes to the<br />
proliferation of disease, leading to high morbidity<br />
rates, which reduces productivity and affects the<br />
earning capacity of individuals. The poor sanitary<br />
condition of ST households is highlighted by the<br />
2001 Census data, which shows that 79.71 per<br />
cent of households do not have latrines and 61 per<br />
cent do not have any kind of drainage facilities.<br />
A high 90.3 per cent of rural ST households and<br />
41.7 per cent of urban households do not have<br />
latrines, although it must be noted that the rest<br />
of the population is not well situated either, since<br />
the state averages are 82.5 per cent for rural and<br />
24.8 per cent for urban areas. About 42 per cent<br />
ST households have a bathroom in the house, as<br />
against 58.9 per cent of the total population at the<br />
state level and 36.1 per cent at the all-India level.<br />
In <strong>Karnataka</strong>, STs have better sanitary facilities<br />
than their counterparts at the all-India level, but<br />
this is only a matter of degree. A low 11.18 per<br />
cent of ST settlements/villages have community<br />
latrines, about 30.5 per cent of households have<br />
open drains and only 8.6 of households have<br />
closed drainage. A high 58.0 per cent habitations<br />
lack storm water drains.<br />
Drinking water<br />
Tap water constitutes the main source of drinking<br />
water for 53.7 per cent ST households (58.39<br />
for all households). Access to drinking water<br />
by tap within the premises is higher for all<br />
households (24.1) than for STs (12.7) and SCs<br />
(12.6). A slightly higher number of ST households<br />
have access to tap water near the premises<br />
(Census: 2001).<br />
Almost 89.0 per cent of ST villages surveyed have<br />
a drinking water facility within the village and the<br />
sources comprise bore-wells with hand pumps,<br />
mini water supply and piped water supply schemes.<br />
Three out of four villages have adequate drinking<br />
water supply during all seasons (Table 10.14).<br />
Housing<br />
The percentage of STs living in permanent houses<br />
(43.7 per cent) is lower than the corresponding<br />
fi gures for SCs (51.1) and all households (54.9)<br />
according to the 2001 Census. About 39 per<br />
cent dwell in semi-permanent houses compared<br />
with 35.6 per cent for all households and 36.6<br />
per cent for SCs. A higher percentage of rural STs<br />
live in semi-permanent houses (43.4) than urban<br />
STs (23.1) who live predominantly in permanent<br />
houses (66.9). There is little difference between<br />
STs and all households, with reference to building<br />
material used. A high percentage of STs (84.4 per<br />
cent) owned their houses, compared with 78.5<br />
per cent for all households. House ownership<br />
is highest in rural areas (91.9 per cent). This<br />
can be attributed to the very progressive state<br />
and Centrally-sponsored housing programmes<br />
(Ashraya, Ambedkar, Indira Awaas), which clearly<br />
have had visible outcomes.<br />
TABLE 10.14<br />
Availability of drinking water facility<br />
Item<br />
Percentage<br />
I. Access to drinking water<br />
a. Within colony 88.82<br />
b. Outside colony within village 8.70<br />
c. Outside village 2.48<br />
II. Type of drinking water facility<br />
a. Bore-well with hand pump 65.84<br />
b. Mini water scheme 53.42<br />
c. Piped water supply 58.39<br />
d. Tank 18.01<br />
e. Pond 1.86<br />
f. River 4.35<br />
g. Open well 15.53<br />
h. Others 4.97<br />
III. Availability of adequate drinking water<br />
a. Available 74.53<br />
b. Not available 25.47<br />
Note: For item II, percentages do not add up to 100% due to<br />
accessibility of households to multiple sources.<br />
Source: Sample Survey, Directorate of Economics and Statistics,<br />
<strong>Karnataka</strong>, 2004A.<br />
244
<strong>Karnataka</strong> <strong>Human</strong> <strong>Development</strong> <strong>Report</strong> <strong>2005</strong><br />
Electricity<br />
Electrical connectivity is fairly high among ST<br />
households. According to the 2001 Census, a<br />
total 64.7 per cent of ST households in <strong>Karnataka</strong><br />
had electricity as a source of lighting, compared<br />
with 78.5 per cent for all households and 68.5<br />
per cent for SC households. In rural areas, STs<br />
depended on electricity (60.3 per cent) as well<br />
as kerosene (38.8), whereas urban ST households<br />
relied principally on electricity (80.6 per cent).<br />
These high levels of connectivity indicate that<br />
state policies to provide electrical connections to<br />
ST households have paid off handsomely.<br />
State policies<br />
The Department of Tribal Welfare was formed<br />
specifi cally to address the needs of STs in<br />
<strong>Karnataka</strong>. Its budget is part of the budget of the<br />
Department of Social Welfare.<br />
Tribal Sub-Plan<br />
The concept of the Tribal Sub-Plan (TSP) and<br />
its counterpart the Special Component Plan<br />
(SCP) emerged in the National Fifth Five-Year<br />
Plan. The Tribal Sub-Plan was fi rst introduced<br />
in 1976-77 when it was implemented in fi ve<br />
Integrated Tribal <strong>Development</strong> Projects (ITDP)<br />
in the districts of Mysore, Chikmaglur, Kodagu and<br />
Dakshina Kannada (including Udupi). In 1992, it<br />
was extended to all districts in the state.<br />
The objectives of the TSP are poverty alleviation,<br />
protection of tribal culture, education, healthcare<br />
and providing basic minimum infrastructure.<br />
Poverty alleviation includes programmes in<br />
agriculture, animal husbandry, sericulture,<br />
horticulture, village and small industries as well<br />
as all employment-generating schemes such as<br />
Swarna Jayanthi Swarozgar Yojana (SJSY).<br />
Pooling TSP funds<br />
Under the TSP, departments earmark three<br />
per cent of their plan budget for expenditure on<br />
tribal development. However, as in the case of the<br />
Special Component Plan for Scheduled Castes,<br />
some departmental schemes were not particularly<br />
relevant or effective and ended up being symbolic<br />
gestures to the development of STs. The TSP<br />
funds were fi rst pooled in 1991. In ‘pooling’,<br />
funds earmarked under TSP are partially or<br />
completely withdrawn from the department. The<br />
resultant corpus is then utilised to fi nance three<br />
strategic areas: housing, education (construction<br />
of hostels) and fi nancing irrigation wells and<br />
The Department of Tribal<br />
Welfare was formed<br />
specifically to address the<br />
needs of STs in <strong>Karnataka</strong>.<br />
TABLE 10.15<br />
Funds pooled under the Tribal Sub-Plan<br />
(Rs. lakh)<br />
Component 2001-02 2002-03 2003-04 2004-05 <strong>2005</strong>-06<br />
State<br />
sector<br />
District<br />
sector<br />
Total<br />
State<br />
sector<br />
District<br />
sector<br />
Total<br />
State<br />
sector<br />
District<br />
sector<br />
Total<br />
State<br />
sector<br />
District<br />
sector<br />
Total<br />
State<br />
sector<br />
District<br />
sector<br />
Total<br />
State plan outlay 750508 108320 858828 794253 66808 861061 909159 68841 978000 1138321 93971 1232292 1155211 200289 1355500<br />
Divisible outlay 208729 91942 300671 232657 66808 299465 256874 68841 325715 336847 93971 430818 114416 167359 281775<br />
TSP outlay 8926 4485 13411 10346 2721 13067 9940 3070 13009 4977 4366 9343 5914 9413 15327<br />
Pooled TSP funds 2083 1870 1798 1138 1846<br />
Percentage of TSP to<br />
state plan outlay<br />
Percentage of TSP to<br />
divisible outlay<br />
Percentage of pooled<br />
funds to state sector<br />
TSP<br />
1.19 4.14 1.56 1.30 4.07 1.52 1.09 4.46 1.33 0.44 4.65 0.76 0.51 4.70 1.13<br />
4.28 4.88 4.46 4.45 4.07 4.36 3.87 4.46 3.99 1.48 4.65 2.17 5.17 5.63 5.44<br />
23.34 18.07 18.09 22.87 31.21<br />
Source: Directorate of Scheduled Tribes Welfare, <strong>Karnataka</strong>.<br />
245
Status of Scheduled Tribes in <strong>Karnataka</strong><br />
The land purchase<br />
scheme provides land<br />
to landless agricultural<br />
labourers by purchasing<br />
lands from non-SC/ST<br />
landholders at a unit<br />
cost of Rs.60,000 with a<br />
subsidy of 50 per cent.<br />
pump sets under the Ganga Kalyan scheme.<br />
Table 10.15 provides information about the TSP<br />
outlay and the funds pooled since 2001-02. 1<br />
Review of programmes<br />
In this section, we look at programmes, which have<br />
been more successful than others in promoting<br />
tribal development.<br />
Collection of minor forest produce and tribal cooperatives:<br />
Tribal people living in hilly, forest areas<br />
depend heavily on minor forest produce (nontimber<br />
forest produce) for their livelihood. As much<br />
as 50 per cent of the income of the Soliga Tribe in<br />
Chamarajnagar district, for example, comes from<br />
the collection of minor forest produce (MFP). Largescale<br />
Adivasi multi-purpose societies (LAMPS)<br />
were formed in the late 1970s, with tribal people<br />
as members, to market non-timber forest products<br />
(NTFP) procured from the forests by the tribal<br />
people. It also supplies essential food commodities<br />
and consumer items to its members. At present,<br />
there are 21 LAMP Societies in <strong>Karnataka</strong> with<br />
42,182 tribal families in the jurisdiction. Only<br />
25,504 out of 63,558 members, are active. LAMP<br />
Cooperatives, which were established to provide<br />
marketing tie-ups and ensure better prices for<br />
NTFP products procured by the tribals, have had<br />
mixed outcomes. One view is that they do not<br />
provide much scope for tribals in the price fi xation<br />
mechanism for NTFP. While the NTFP selling<br />
rates have been registering a steady increase, the<br />
purchase price fi xed for procuring the produce from<br />
the tribals has shown only a nominal increase.<br />
LAMPS should enhance rates so that the poor tribal<br />
people, who actually procure these items from<br />
within the deep jungle at some personal risk, can<br />
improve their economic conditions.<br />
Animal Husbandry : Unlike subsistence agriculture,<br />
animal husbandry is an important incomegenerating<br />
activity for the tribals, as it gives<br />
immediate returns. Unfortunately, the income<br />
from these activities is meagre due to tribals’<br />
inability to provide adequate fodder and water<br />
1<br />
Sectors, which have direct and quantifi able benefi ts for the<br />
Scheduled Tribes, are classifi ed as ‘divisible’ and the TSP<br />
allocation is limited to these sectors. ‘Non-divisible’ sectors<br />
include major and medium irrigation, energy, borrowings, etc.<br />
and lack of marketing support. Not surprisingly, a<br />
high 30.82 per cent of families failed to maintain<br />
their assets (Tribal Sub Plan-Asset Evaluation<br />
Study 2000-01).<br />
Income Generation: Apart from poverty reduction<br />
and income generating programmes such as<br />
SJSY, SGSY, Stree Shakti, there are also specifi c<br />
schemes to address the needs of the Scheduled<br />
Tribes who are landless or who have land that<br />
is not irrigated. The <strong>Karnataka</strong> Scheduled Castes<br />
and Scheduled Tribes <strong>Development</strong> Corporation<br />
implements various programmes for the economic<br />
development of the community, among which, the<br />
most important are:<br />
a. The land purchase scheme: This provides<br />
land to landless agricultural labourers<br />
by purchasing lands from non-SC/ST<br />
landholders at a unit cost of Rs.60,000 with<br />
a subsidy of 50 per cent.<br />
b. Self-employment programme: Under this,<br />
fi nancial institutions provide assistance<br />
for setting up businesses. The corporation<br />
provides a subsidy of Rs.10,000 for a unit<br />
cost of Rs.1,00,000, and the remaining<br />
amount is a loan from fi nancial institutions.<br />
Where the unit cost is above Rs.50,000,<br />
the corporation sanctions 20 per cent as<br />
‘margin money loan’, with a ceiling of<br />
Rs.one lakh in each case, with an interest<br />
of four per cent, while 75 per cent is a loan<br />
from banks and NSFDC. The benefi ciary<br />
must meet the remaining 5 per cent as his/<br />
her contribution.<br />
c. Ganga Kalayana : This comprises (i) the<br />
Community Irrigation Scheme, under which,<br />
land owned by several ST families are<br />
provided bore-well irrigation. Depending<br />
upon the availability of water, two to three<br />
bore-wells are drilled and other expenses<br />
for installation of pump sets, energisation,<br />
storage tanks, pipelines are provided by<br />
the corporation; (ii) the individual irrigation<br />
bore-well programme, where the corporation<br />
takes up construction of irrigation borewells<br />
and provides infrastructure at a unit<br />
cost of Rs.75,000 of which Rs.65,000 is<br />
subsidy and the rest is a loan from fi nancial<br />
institutions.<br />
246
<strong>Karnataka</strong> <strong>Human</strong> <strong>Development</strong> <strong>Report</strong> <strong>2005</strong><br />
Micro industries: The objective here is to utilise<br />
local skills for the promotion of micro industries<br />
like bee-keeping, minor forest produce, tribal<br />
crafts, sericulture, and carpentry. An investment<br />
varying from Rs.500 to Rs.25,000 generates an<br />
income of about Rs.30–40 per day.<br />
Self-help groups: Self-help groups (SHGs) have<br />
radically changed the micro-credit systems in<br />
rural areas. Tribals, who form a large percentage<br />
of rural agricultural labour, and subsistence<br />
farmers fi nd it diffi cult to source credit from<br />
fi nancial institutions and are likely to benefi t from<br />
the SHG philosophy. Self-help groups promote<br />
savings and microfi nance among members,<br />
but they also have other objectives such as<br />
social empowerment and gender equity. The<br />
Stree Shakti programme of the department of<br />
Women and Child <strong>Development</strong> has 1,19,621<br />
ST women members in 1,00,000 SHGs.<br />
The role of NGOs in tribal development<br />
There is growing realisation of the need to develop<br />
a healthy partnership between the government<br />
and the non-governmental organisations<br />
(NGOs). The role of NGOs in tribal welfare<br />
activities, though small, has been responsible for<br />
introducing qualitative changes in the lives of the<br />
people. Vivekananda Girijana Kalyana Kendra,<br />
Swami Vivekananda Youth Movement, DEED,<br />
FEDINA, CORD, Samagra Grameena Ashrama,<br />
Janashikshana Trust, Chintana Foundation, DUDI,<br />
Samvriddi/Krupa, Vanavasi Kalyana Ashrama are<br />
some of the NGOs involved in tribal development<br />
in <strong>Karnataka</strong>.<br />
Community based organisations<br />
It is possible to make development works more<br />
effective and sustainable through an engagement<br />
with the local community, which has a better<br />
understanding than non-tribals, of its own<br />
socio-economic needs, traditions and culture.<br />
Their participation in programmes, funded<br />
by government and voluntary organisations<br />
builds confi dence in the people to utilise the<br />
services thus offered and provides feedback for<br />
modifi cation and re-orientation of programmes.<br />
In Chamarajnagar district, the tribal people’s<br />
organisations are known as sanghas. They actively<br />
BOX 10.1<br />
NGO experiences in tribal health<br />
Under the IPP-9 project, the Health Department and NGOs trained tribal girls as Auxiliary Nurse<br />
and Midwives (ANM) and they were posted to sub centres in remote tribal areas. These ANMs are<br />
now providing good healthcare services to tribal women and children.<br />
The government-owned primary health centres at Gumballi and Thithimathi, were handed over<br />
to Karuna Trust and Vivekananda Foundation respectively and are run as model PHCs.<br />
In B.R. Hills, VGKK, an NGO, is promoting the traditional knowledge systems of tribals and has<br />
integrated traditional healthcare system with modern medicine. Tribal knowledge of herbal<br />
medicines is being promoted.<br />
Source: Author.<br />
participate in issues concerning tribals, such as<br />
preventing forest fi res, illegal quarrying, smuggling<br />
and poaching. Their participation in programmes<br />
such as sustainable harvesting of NTFP through<br />
participatory resource monitoring, value additions<br />
to the NTFP and conservation of bio-diversity has<br />
helped to reduce the exploitation of minor forest<br />
produce by outsiders.<br />
Concerns<br />
Some state programmes have been very successful<br />
in providing services to the Scheduled Tribes, e.g.<br />
free housing, drinking water supply and electrical<br />
connectivity to ST households. There is a gamut<br />
of programmes designed to address the problems<br />
of school dropouts (ashram schools, scholarships,<br />
free text books and uniforms, midday meals)<br />
and income poverty through the many poverty<br />
reduction programmes. Unfortunately, the<br />
degree of effectiveness in terms of programme<br />
implementation that one sees in these sectors is<br />
not evident in the three critical areas of health,<br />
education and poverty reduction. The magnitude<br />
of the problem is so great that a large percentage<br />
of Scheduled Tribe families is still poor and lacks<br />
access to resources that would improve their<br />
education and health status. It can be said, based<br />
on some of the indicators discussed above and in<br />
chapter 2, that the human development status<br />
of the Scheduled Tribes is more than a decade<br />
behind the rest of the population of the state<br />
and they are the poorest and most deprived<br />
of all sub-populations in the state.<br />
The role of NGOs in<br />
tribal welfare activities,<br />
though small, has<br />
been responsible for<br />
introducing qualitative<br />
changes in the lives of the<br />
people.<br />
Tribal participation in<br />
programmes such as<br />
sustainable harvesting<br />
of NTFP through<br />
participatory resource<br />
monitoring, value<br />
additions to the NTFP<br />
and conservation of biodiversity<br />
have helped to<br />
reduce the exploitation of<br />
minor forest produce by<br />
outsiders.<br />
247
Status of Scheduled Tribes in <strong>Karnataka</strong><br />
TABLE 10.16<br />
Scheduled Tribes in <strong>Karnataka</strong>: Key indicators<br />
Sl. No. Indicators Units Results<br />
I. General:<br />
1 Population ** lakh 34.64<br />
2 Percentage to total state population ** per cent 6.55<br />
3 Percentage to total Hindu population ** per cent 7.82<br />
II. Education and literacy:<br />
4 Literacy rate ** per cent 48.27<br />
5 Levels of education:<br />
a. High School *<br />
6.32<br />
b. PUC * 1.54<br />
per cent<br />
c. Graduation * 0.81<br />
d. Post-graduation * 0.09<br />
6 Out-of-school children (7-14 Age group) *** per cent 2.42<br />
7 Dropout rates<br />
a. Primary level (7-14 Age group) * per cent 6.29<br />
b. Higher Primary/High School level * per cent 14.54<br />
III. Health status:<br />
8 Sex ratio ** per 1000 males 972<br />
9 Estimated birth rate * per 1000 22.79<br />
10 Estimated death rate * per 1000 8.50<br />
11 Estimated infant mortality rate * per 1000 live births 64.37<br />
12 Life expectancy at birth * Years 61.8<br />
13 Type of birth assistance at deliveries:<br />
a. Institutional *<br />
32.05<br />
b. Health staff * per cent<br />
31.31<br />
c. Trained dais * 24.08<br />
14 Access to nutrition programme:<br />
a. Boys *<br />
83.70<br />
b. Girls * 83.64<br />
per cent<br />
c. Pregnant women * 54.69<br />
d. Nursing mothers * 59.53<br />
IV. Housing profile:<br />
15 Households by ownership:<br />
a. Owned **<br />
84.4<br />
b. Rented ** per cent<br />
11.8<br />
c. Any other ** 3.8<br />
(Table 10.16 Contd...)<br />
248
<strong>Karnataka</strong> <strong>Human</strong> <strong>Development</strong> <strong>Report</strong> <strong>2005</strong><br />
(Table 10.16 Contd...)<br />
Sl. No. Indicators Units Results<br />
16 Households by type of structures:<br />
a. Permanent **<br />
66.9<br />
b. Semi-permanent ** per cent<br />
23.1<br />
c. Temporary ** 10.0<br />
17 Toilet facility:<br />
a. Within house premises *<br />
8.35<br />
b. Outside house premises * 9.33<br />
c. Public latrine * 6.75<br />
d. Pit latrine ** per cent<br />
8.8<br />
e. Water closet ** 7.9<br />
f. Other latrine ** 3.6<br />
g. No latrine ** 79.7<br />
18 Type of drainage:<br />
a. Closed drainage per cent 8.6<br />
b. Open drainage per cent 30.5<br />
c. No drainage per cent 60.9<br />
19 Type of fuel used for cooking:<br />
a. Firewood **<br />
79.8<br />
b. Cow dung ** 0.2<br />
per cent<br />
c. Kerosene ** 6.2<br />
d. LPG ** 6.1<br />
20 Lighting:<br />
a. Access to electricity ** per cent 64.7<br />
b. Kerosene ** per cent 34.3<br />
c. Any other ** per cent 0.5<br />
d. No lighting ** per cent 0.5<br />
21 Access to drinking water * per cent 88.82<br />
V. Economic scenario:<br />
22 Type of occupation:<br />
a. Cultivator *<br />
8.80<br />
b. Agricultural labour * 17.89<br />
per cent<br />
c. Other labour * 7.35<br />
d. Government services * 1.68<br />
23 Annual per capita income * Rupees 5713<br />
24 Monthly per capita expenditure * Rupees 439<br />
25 Proportion of BPL households * per cent 38<br />
Sources:<br />
1. * Sample Survey, Directorate of Economics and Statistics, <strong>Karnataka</strong>, 2004A.<br />
2. ** Registrar General of India, Census 2001.<br />
3. *** Children’s Census, Department of Public Instruction, <strong>Karnataka</strong>, <strong>2005</strong>.<br />
249
Status of Scheduled Tribes in <strong>Karnataka</strong><br />
TABLE 10.17<br />
Major Scheduled Tribes in <strong>Karnataka</strong><br />
1 Adiyan 26 Koya, Bhine Koya, Rajkoya<br />
2 Barda 27 Kudiya, Melakudi<br />
3 Bavacha, Bamcha 28 Kuruba (in Kodagu district).<br />
4 Bhil, Bhil Garasia, Dholi Bhil, Dungri Bhil,<br />
Dungri Garasia, Mewasi Bhil, Rawal Bhil, Tadvi<br />
Bhil, Bhagalia, Bhilala, Pawra, Vasava, Vasave.<br />
29 Kurumans<br />
5 Chenchu, Chenchwar 30 Maha Malasar<br />
6 Chodhara 31 Malaikudi<br />
7 Dubla, Talavia, Halpati 32 Malasar<br />
8 Gamit, Gamta, Gavit, Mavchi, Padvi, Valvi. 33 Maleyakandi<br />
9 Gond, Naikpod, Rajgond 34 Maleru<br />
10 Gowdalu 35 Maratha (in Kodagu district).<br />
11 Hakki Pikki, Harnshikari 36 Marati (in Dakshina Kannada district).<br />
12 Hasalaru 37 Meda, Medari, Gauriga, Burud<br />
13 Irular 38 Naikda, Nayaka, Cholivala Nayaka,<br />
Kapadia Nayaka, Mota Nayaka, Nana<br />
Nayaka, Naik, Nayak, Beda, Bedar and<br />
Valmiki.<br />
14 Iruliga 39 Palliyan<br />
15 Jenu Kuruba 40 Paniyan<br />
16 Kadu Kuruba 41 Pardhi, Advichincher, Phanse Pardhi.<br />
17 Kammara (in Dakshina Kannada district and<br />
Kollegal taluk of Chamarajnagar district).<br />
18 Kaniyan, Kanyan (in Kollegal taluk of<br />
Chamarajnagar district).<br />
19 Kathodi, Katkari, Dhor Kathodi, Dhor Katkari,<br />
Son Kathodi, Son Katkari.<br />
42 Patelia<br />
43 Rathawa<br />
44 Sholaga<br />
20 Kattunayakan 45 Sholigaru<br />
21 Kokna, Kokni, Kukna 46 Toda<br />
22 Koli Dhor, Tokre Koli, Kolcha, Kolgha. 47 Varli<br />
23 Konda Kapus 48 Vitolia, Kotwalia, Barodia<br />
24 Koraga 49 Yerava<br />
25 Kota 50 Siddi (in Uttara Kannada district).<br />
Source: Directorate of Tribal Welfare, <strong>Karnataka</strong>.<br />
250
Their literacy rate is the lowest for all social<br />
groups and female literacy, which is a low<br />
36.6 per cent when compared with the state<br />
average of 56.9, places ST women far behind a<br />
population that is, itself, disadvantaged to start<br />
with. There are disparities between ST students<br />
and others at every level and along all indicators<br />
of educational attainment: enrolment and<br />
retention in primary education and subsequent<br />
participation in secondary and tertiary education.<br />
One bright feature is the fact that girls perform<br />
well scholastically once they clear the hurdles to<br />
the deceptively simple acts of fi rst enrolling and<br />
secondly, being allowed to stay on in school.<br />
The health of the tribal people has not improved<br />
signifi cantly over the previous decade. Their IMR<br />
(64.37) is worryingly higher than that of the<br />
total population (52.0) of the state. This scenario<br />
can be partly attributed to the inadequacy of<br />
institutional support. Both antenatal and postpartum<br />
care by skilled attendants is not adequately<br />
available to the tribal people, especially those<br />
who live in remote or inaccessible habitations.<br />
State functionaries have not focused suffi ciently<br />
on these vulnerable people to ensure a reduction<br />
in maternal and infant deaths. Under-nutrition<br />
levels among children are severe enough to lead<br />
to stunting.<br />
The occupational distribution shows that the<br />
majority of the tribal people are small and<br />
marginal farmers and agricultural labour.<br />
Their holdings are unirrigated and therefore<br />
economically unviable. The Scheduled Tribes also<br />
have very low monthly per capita expenditure<br />
compared with the rest of the population. Access<br />
to MFP and NTFP is critical to the survival of<br />
certain tribes, who live in or around forests,<br />
most of which are now classifi ed as wildlife<br />
sanctuaries.<br />
Recommendations<br />
Develop a comprehensive policy on tribal<br />
development, which derives inputs from<br />
people at the grassroot level to ensure<br />
sustainable development that is ecologically<br />
sound, people oriented, decentralised and<br />
culturally acceptable.<br />
Ensure the collection and collation of<br />
disaggregated data to enable benchmarking<br />
and monitoring.<br />
Conduct a rapid survey of the health status<br />
of the tribals and prepare region-specifi c and<br />
tribe-specifi c health plans.<br />
Relax norms for primary health centres<br />
and sub-centres in tribal areas and make<br />
allowances for geography and population.<br />
Select tribal girls for training as ANMs<br />
and post them to sub-centres located in<br />
predominantly tribal areas. They could also<br />
be trained in traditional medicine and health<br />
practices, thus encouraging and integrating<br />
traditional healing systems into modern<br />
medicine.<br />
Encourage nutrition security by promoting<br />
kitchen gardens.<br />
Focus on genetic diseases.<br />
Ensure 100 per cent antenatal care coverage<br />
and immunisation of women and children.<br />
Provide secondary and tertiary care, transport<br />
facilities for emergency services and obstetric<br />
care.<br />
Ensure greater access to education through<br />
convergence of the services of several<br />
departments: Education, Rural <strong>Development</strong><br />
and Labour to monitor child labour, track<br />
dropouts and provide local employment to<br />
their parents.<br />
Include tribal culture, traditional knowledge<br />
systems, tribal history and vocational skills<br />
training in the school curriculum.<br />
Involve tribals in biodiversity conservation;<br />
encourage them to grow fruit trees on<br />
degraded forest-lands; allow sustainable<br />
harvesting of the non-forest produce for<br />
their livelihood, without endangering the<br />
biodiversity of the forest.<br />
Encourage need-based economic activities<br />
that use locally available raw materials and<br />
assist in marketing of fi nished goods.<br />
Provide more budgetary support to the land<br />
purchase scheme.<br />
Promote organic forming, conservation of<br />
traditional seed.<br />
Empower tribals at village level to participate<br />
effectively in Gram Sabhas, by promoting<br />
community based organisations.<br />
<strong>Karnataka</strong> <strong>Human</strong> <strong>Development</strong> <strong>Report</strong> <strong>2005</strong><br />
Develop a comprehensive<br />
policy on tribal<br />
development, which<br />
derives inputs from people<br />
at the grassroot level<br />
to ensure sustainable<br />
development that is<br />
ecologically sound, people<br />
oriented, decentralised<br />
and culturally acceptable.<br />
Include tribal culture,<br />
traditional knowledge<br />
systems, tribal history and<br />
vocational skills training<br />
in the school curriculum.<br />
251
Institutional Reforms for <strong>Human</strong><br />
<strong>Development</strong>: Panchayat Raj
CHAPTER 11<br />
Institutional Reforms for <strong>Human</strong><br />
<strong>Development</strong>: Panchayat Raj<br />
Introduction<br />
The Government of <strong>Karnataka</strong>, as part of its strategy<br />
of promoting human development, has undertaken<br />
several institutional reforms. One area where it<br />
undertook this task early is decentralisation of<br />
governance and planning. Basically, institutional<br />
reform of this kind is a way of ensuring<br />
grassroots participation, greater transparency and<br />
accountability and responsiveness to local needs.<br />
If this combination works, then people are assured<br />
of effi cient service delivery and better human<br />
development outcomes.<br />
Evolution of local government<br />
in <strong>Karnataka</strong><br />
In the erstwhile princely state of Mysore, the<br />
idea of local self-governance emerged as early<br />
as 1874, with the establishment of ‘local fund<br />
committees’ in each district, for taking up<br />
construction of roads and subsidiary works. But<br />
these committees did not evoke local interest<br />
and initiative because of the dominance of the<br />
offi cial members. The Mysore Local Boards Act of<br />
1902, which sought to correct this shortcoming,<br />
provided for a three-tier local self-government<br />
structure consisting of the village panchayat with a<br />
nominated chairman, a taluk board with the subdivision<br />
offi cer as president and a district board<br />
with the Deputy Commissioner as president. Since<br />
even these measures did not lessen the hold of<br />
the bureaucracy, the Mysore Local Boards and<br />
Village Panchayat Act was enacted in 1918 to<br />
provide for elected members and elected vice<br />
presidents at these levels. In 1926, the Mysore<br />
District and Mysore Village Panchayats Act was<br />
enacted, providing panchayats with adequate<br />
powers, fi nances and resources, and eliminating<br />
taluk boards from the system. All these measures<br />
were intended to loosen the hold of bureaucrats<br />
and to induct people’s representatives into local<br />
government.<br />
During the early 1950s there were further<br />
attempts to make these institutions people<br />
oriented and more representative. The Mysore<br />
Village Panchayats and Local Boards Act, 1959<br />
was enacted, within the broad framework of<br />
the Balwanthrai Mehta Committee <strong>Report</strong>, to<br />
provide for village panchayats, taluk development<br />
boards and district development councils. The<br />
fi rst two bodies were wholly elected and the<br />
last was a coordinating body with nominated<br />
members and people’s representatives and district<br />
level government offi cials. The Panchayat Raj<br />
institutions (PRIs) under the 1959 Act provided<br />
a viable politico-administrative structure, which<br />
had been so far absent. The Act made provision for<br />
reservation for women and the Scheduled Castes<br />
(SCs) and Scheduled Tribes (STs) to the elected<br />
bodies but it did not bestow suffi cient attention on<br />
the question of fi nancial autonomy. A fi eld level<br />
study (N. Sivanna, 1990) noted that the system<br />
threw up a power structure, which refl ected the<br />
one that obtained in rural <strong>Karnataka</strong>.<br />
The Ashok Mehta Committee, which submitted<br />
its report in 1978, sought a more comprehensive<br />
role for Panchayat Raj institutions such that<br />
they would ‘undertake democratic development<br />
management under conditions of rapid changes,<br />
continuous growth and sustained innovations in<br />
all spheres of rural life’ (Government of India,<br />
1978:77). The <strong>Karnataka</strong> Legislature then<br />
enacted the <strong>Karnataka</strong> Zilla Parishads, Taluk<br />
Panchayat Samithis, Mandal Panchayats and<br />
Nyaya Panchayats Act in 1983, which established<br />
a new PR structure consisting of mandal<br />
panchayats at the village level, taluk panchayat<br />
samithis and zilla parishads. These institutions<br />
apart, the Act provided for a gram sabha (village<br />
assembly) which comprised all eligible voters of<br />
a given mandal panchayat, panchayat members<br />
and government offi cers who were expected<br />
Decentralisation of<br />
governance and planning<br />
is a way of ensuring<br />
grassroots participation,<br />
greater transparency<br />
and accountability and<br />
responsiveness to local<br />
needs. If this combination<br />
works, then people are<br />
assured of efficient service<br />
delivery and better human<br />
development outcomes.<br />
255
Institutional Reforms for <strong>Human</strong> <strong>Development</strong>: Panchayat Raj<br />
The gram sabha was<br />
conceived as a space<br />
that provided an<br />
opportunity to the people<br />
to voice their needs and<br />
aspirations; it was also to<br />
be a platform where the<br />
elected representatives<br />
and the bureaucrats were<br />
made accountable to the<br />
people for their actions<br />
and to serve as a means<br />
of ensuring transparency<br />
in administration.<br />
to use the forum to (i) discuss and review all<br />
development problems and programmes of the<br />
village; (ii) select benefi ciaries for benefi ciary<br />
oriented programmes; and (iii) plan for the<br />
development of the village economy and its<br />
people which included minimum needs, welfare<br />
and production oriented activities. The gram<br />
sabha was conceived as a space that provided an<br />
opportunity to the people to voice their needs and<br />
aspirations; it was also to be a platform where<br />
the elected representatives and the bureaucrats<br />
were made accountable to the people for their<br />
actions and to serve as a means of ensuring<br />
transparency in administration.<br />
The decentralised system that was put in place<br />
under the 1983 Act was really radical, in the<br />
sense, that many powers were devolved to the<br />
people to govern themselves and to promote<br />
local development. It made the PR bureaucracy<br />
accountable to the people’s representatives,<br />
rather than the state bureaucracy. There<br />
was substantial reservation for women and<br />
backward classes. People’s participation in local<br />
government was enabled by holding gram sabhas,<br />
which were mandatorily convened twice a year.<br />
Here the citizens reviewed the activities of the<br />
mandal governments, selected the benefi ciaries<br />
under various anti-poverty programmes and<br />
development projects, and made decisions<br />
about project selection and community<br />
participation.<br />
Studies on the performance of these PRIs,<br />
identifi ed certain shortcomings. While the<br />
reservation policy gave women, the Scheduled<br />
Castes and Scheduled Tribes and backward<br />
castes representation in local bodies, they did not<br />
occupy positions of leadership such as Pradhan in<br />
the mandal panchayat or Adhyaksha of the zilla<br />
parishad. Members of the dominant communities<br />
wrested these positions due to their control of<br />
rural society (Amal Ray and K. Jayalakshmi,<br />
October, 1987; A. Aziz, 1994). Second, with the<br />
assigning of the Jawahar Rozgar Yojana funds<br />
and with improved revenue collections the PRIs’<br />
fi nancial status improved, but they still suffered<br />
from lack of fi nancial autonomy because they<br />
continued to depend overwhelmingly on grants<br />
from the state government. The quantum of<br />
discretionary grants available to them was<br />
minimal. Third, the panchayats did better in<br />
some areas than in others. The evaluation<br />
committee which reviewed the performance of<br />
PRIs testifi ed to the good performance of PRIs,<br />
(Government of <strong>Karnataka</strong>, 1989) whereas<br />
other studies showed that most of the projects<br />
implemented were construction oriented; i.e. the<br />
construction of, and repairs to, buildings, roads,<br />
bridges, rather than production oriented (A. Aziz,<br />
1993; A. Aziz, 1994; and Planning Department,<br />
Government of <strong>Karnataka</strong>, 1987). Finally,<br />
the PR bodies did not have any constitutional<br />
safeguards or permanence. Consequently, with<br />
the completion of the fi rst fi ve-year term in<br />
January 1992, elections to these institutions<br />
were not held; instead, they were superseded<br />
and administrators appointed to carry out the<br />
functions of the PRIs. The 73rd Amendment to<br />
the Constitution gave constitutional guarantees<br />
to PRIs of elections, guarantees against the state<br />
superseding Panchayat Raj (PR) bodies, seat<br />
and authority position reservation for the weaker<br />
sections, fi nancial devolution on a scientifi c basis,<br />
and so on. Following this, many states, including<br />
<strong>Karnataka</strong>, passed new Panchayat Raj Acts<br />
conforming to the provisions of the Constitution<br />
Amendment Act.<br />
The current scenario<br />
Attempts have been made in recent times<br />
to strengthen PRIs by adopting measures to<br />
promote good governance and accountability<br />
through ‘enhanced people’s participation, citizen<br />
orientation, responsiveness, improved service<br />
delivery, improved fi nancial management and<br />
greater downward accountability’ (RDPR,<br />
Government of <strong>Karnataka</strong>, 17.5.2004). The<br />
<strong>Karnataka</strong> Panchayat Raj Act, 1993 was amended<br />
in October 2003 and the 47 amendments thus<br />
effected were intended to facilitate people’s<br />
participation and to make PRIs more accountable<br />
to their constituents. Conceptually, gram sabhas<br />
provide a space for grassroots participation. In<br />
reality, their functioning has often been neither<br />
democratic nor participatory. The poor, women,<br />
the SCs and STs remained marginalised and<br />
voiceless.<br />
256
<strong>Karnataka</strong> <strong>Human</strong> <strong>Development</strong> <strong>Report</strong> <strong>2005</strong><br />
To ensure greater and more effective participation,<br />
the amendments provide for the ward/vasathi<br />
sabha in each constituency of the gram panchayat<br />
(GP) with mandatory powers to identify and<br />
prioritise benefi ciaries, approve development<br />
plans, generate project proposals, and identify<br />
defi ciencies in rural amenities.<br />
A signifi cant step taken in the direction of carrying<br />
decentralisation forward is the Belur Declaration<br />
adopted in January 2004. This declaration lists the<br />
steps to be taken by the authorities concerned to<br />
strengthen the gram panchayat by appropriately<br />
devolving powers, functions and funds, by<br />
equipping them with technical and managerial<br />
capabilities and by ensuring transparency and<br />
accountability in its functions.<br />
<strong>Karnataka</strong> is ahead of many states in terms<br />
of the powers and functions that have been<br />
delegated to PRIs. An analysis will reveal the<br />
extent to which the PRIs have managed delivery<br />
systems effi ciently; ensured transparency and<br />
accountability; and taken decision-making<br />
to the grassroots. The following aspects of<br />
decentralisation will be examined: (i) devolution<br />
of powers, functions, functionaries and funds;<br />
(ii) creation of a participatory environment through<br />
reservation of seats and authority positions;<br />
(iii) community participation especially<br />
participation of people’s organisations and<br />
NGOs; and (iv) decentralised governance and<br />
planning.<br />
Under the 1993 Act, the panchayats shall<br />
function in accordance with the principle that<br />
what is appropriate at a given level should not<br />
be done at a higher level. The 29 functions listed<br />
in the Eleventh Schedule of the Constitution, and<br />
devolved to panchayats were delineated in three<br />
separate schedules, each of which was applicable<br />
to the gram panchayat (GP), taluk panchayat (TP)<br />
and zilla panchayat (ZP) respectively. The functions<br />
include preparation of annual plans and annual<br />
budgets; preparation of sectoral development<br />
schemes to promote agriculture, animal<br />
husbandry, rural housing, drinking water, roads<br />
and bridges, rural electrifi cation, education, public<br />
health, sanitation, women and child development,<br />
BOX 11.1<br />
Imparting transparency and accountability in PRI functioning<br />
Certain other provisions impart greater transparency and accountability to the functioning of<br />
PRIs: (i) TP and ZP members must declare their assets and furnish accounts of election expenses;<br />
(ii) all panchayat members must disclose their pecuniary interest, if any, in panchayat dealings;<br />
(iii) meeting proceedings must be displayed within 72 hours on the GP notice board along with<br />
the names of members voting for or against the resolutions passed; (iv) all panchayats must<br />
make available details of works undertaken and expenditures incurred, receipts of funds etc;<br />
(v) bills of works undertaken in the GP area by TPs and ZPs will be cleared only after the GP<br />
concerned certifi es that the works have been satisfactorily completed; and (vi) attendance of<br />
offi cials at GP meetings is mandatory.<br />
social welfare, maintenance of community assets,<br />
promotion of libraries and so on. More powers<br />
and functions were devolved in 2004-05 and<br />
in order to remove ambiguity, a detailed activity<br />
map was prepared for each of the three panchayat<br />
tiers. Certain distortions and ambiguities noticed<br />
at the implementation level were sought to be<br />
removed by rationalising or merging schemes.<br />
Such rationalisation has resulted in the reduction<br />
of schemes from 421 to 217. This means that PRIs<br />
are now less constrained and straitjacketed by the<br />
normal plethora of department schemes, each<br />
with a set of infl exible guidelines that clamped a<br />
tight hold on expenditure and left little room for<br />
innovation or fl exibility.<br />
Principles of fiscal devolution<br />
Since the decentralised governments are<br />
required to perform several devolved functions,<br />
and perform those functions efficiently, the<br />
funds devolved to them ought also to be<br />
adequate. Under Article 243-1 of the 73rd<br />
Constitution Amendment Act, the State<br />
Finance Commissions (SFCs) are empowered<br />
to determine the quantum of state resources<br />
to be devolved to panchayats and urban local<br />
governments. Theoretically speaking, transfer<br />
of resources from the state government to<br />
decentralised governments can take two forms:<br />
general purpose and specific purpose grants.<br />
The former is meant to offset fiscal disabilities<br />
arising from inabilities to locally raise adequate<br />
resources to provide the needed infrastructure<br />
at levels compared to those in richer regions,<br />
so as to utilise the growth potential available<br />
PRIs are now less<br />
constrained and<br />
straitjacketed by the<br />
normal plethora of<br />
department schemes, each<br />
with a set of inflexible<br />
guidelines that clamped a<br />
tight hold on expenditure<br />
and left little room for<br />
innovation or flexibility.<br />
257
Institutional Reforms for <strong>Human</strong> <strong>Development</strong>: Panchayat Raj<br />
While the state<br />
government broadly<br />
accepted the first SFC<br />
recommendations on<br />
the quantum of funds<br />
devolution to panchayats,<br />
it did not do so with<br />
regard to the allocation<br />
criteria and continued to<br />
follow the modified Gadgil<br />
formula, on the ground<br />
that the latter was better<br />
placed for ensuring social<br />
justice.<br />
in the poorer regions and to promote higher<br />
growth rates there. On the other hand, the<br />
specific purpose grants are meant to ensure<br />
that categorical equity or ‘wealth neutral’<br />
services (unrelated to ability to pay) such as<br />
education, health and sanitation, rural roads<br />
etc. are provided in adequate quantities<br />
(M. Govinda Rao). The First <strong>Karnataka</strong> State<br />
Finance Commission arrived at a figure of<br />
36 per cent of the non-plan gross own<br />
revenue receipts of the state government to<br />
be devolved to panchayats and urban local<br />
self-governments (Government of <strong>Karnataka</strong>,<br />
January 1996). This is an improvement over<br />
the 34.3 per cent in vogue and amounted to<br />
Rs.2,675 crore during 1996-97. The Second<br />
<strong>Karnataka</strong> State Finance Commission hiked this<br />
figure to 40 per cent. As for sharing this amount<br />
between panchayats and urban local bodies<br />
(ULBs) the First Commission recommended a<br />
share of 30.4 per cent to the former and 5.6<br />
per cent to the latter; the recommendation of<br />
the Second Commission was 32 per cent and<br />
8 per cent respectively. As for the allocation of<br />
this amount across different tiers of panchayats,<br />
the Commission recommended a ratio of<br />
40:35:25 to zilla panchayats, taluk panchayats<br />
and gram panchayats respectively. Under this<br />
allocation scheme, gram panchayats would<br />
have gained greatly because the proportion<br />
going to them at that time was estimated to<br />
be only 13 per cent of the devolved funds. The<br />
criteria and the weightage suggested by the<br />
First Commission for allocating funds across<br />
panchayats within each tier were: population<br />
(33.3 per cent), area (33.3 per cent), and<br />
backwardness seen in terms of road length,<br />
hospital beds and illiteracy (33.3 per cent). This<br />
formula marked a departure from the modified<br />
Gadgil formula followed since 1987, when<br />
the Commission introduced a new criterion in<br />
the form of area in addition to population and<br />
backwardness. The Second Commission, while<br />
retaining those criteria, replaced roads by the<br />
proportion of Scheduled Caste and Scheduled<br />
Tribe population under the third criterion. The<br />
allocative formula was changed to 30 per cent<br />
each to the first two criteria and to 40 per cent<br />
for backwardness. Incidentally, while the state<br />
government broadly accepted the first SFC<br />
recommendations on the quantum of funds<br />
devolution to panchayats, it did not do so with<br />
regard to the allocation criteria and continued<br />
to follow the modified Gadgil formula, on the<br />
ground that the latter was better placed for<br />
ensuring social justice.<br />
<strong>Human</strong> development and fiscal<br />
devolution<br />
An analysis of fiscal decentralisation in<br />
<strong>Karnataka</strong> by Rao, Amar Nath and Vani<br />
(2004) 1 identifies certain features of fiscal<br />
decentralisation to rural local governments that<br />
impact on human development expenditures.<br />
Formally, <strong>Karnataka</strong> has transferred all the<br />
functions listed in the schedule to the local<br />
governments, but several are exercised<br />
concurrently with the state government. The<br />
<strong>Karnataka</strong> Panchayat Raj Act, 1993 lists 31<br />
functional items to gram panchayats, 28 items<br />
to taluk panchayats and 29 items to zilla<br />
panchayats. The actual assignment, however,<br />
involved transferring a number of schemes<br />
included in the plan – to constitute the<br />
‘District Sector’ plans – to ZPs, TPs and GPs<br />
for implementation. The employees of various<br />
line departments in the state were transferred<br />
to the district sector to implement these<br />
programmes. To ensure that they continue<br />
to enjoy the same powers and to undertake<br />
the same functions, the expenditure functions<br />
were devolved in terms of schemes, with the<br />
condition that the local governments could<br />
not scrap any of the schemes, and salary was<br />
given priority in expenditure implementation.<br />
In terms of adequacy and reach, the volume of<br />
spending assigned to rural local governments<br />
continues to be low. While the state government<br />
has transferred the functions and the functionaries<br />
to panchayats, the hardening fi scal situation<br />
has restricted the devolution of funds. Based<br />
1<br />
Rao, Govinda, M., Amar Nath, H.K. and Vani, B. P (2004), ‘Fiscal<br />
Decentralisation in <strong>Karnataka</strong>’, in Sethi, Geeta (ed.), Fiscal<br />
Decentralisation to Rural Governments in India, the World Bank,<br />
Oxford University Press.<br />
258
on the information in the Link Document 2 , the<br />
estimated expenditure by panchayats was 21.8<br />
per cent of the state’s expenditures or about<br />
5 per cent of GSDP in 2001-02. Of this, an<br />
overwhelming proportion was incurred for nonplan<br />
purposes. Plan expenditure was estimated<br />
at 38 per cent in 2001-02 and was lower at<br />
27.4 per cent in 2002-03. In most sectors, the<br />
resources were just adequate to pay the salaries<br />
of the employees and the greatest proportion of<br />
expenditures at panchayat level was accounted<br />
for by spillover schemes from the previous plans<br />
and other salary and maintenance expenditures.<br />
Furthermore, the role of the grassroot tier – the<br />
GP - was negligible. Allocation to GPs constituted<br />
just about fi ve per cent of total district sector<br />
outlays and a little over one per cent of state<br />
outlay. This changed only in <strong>2005</strong>, when many<br />
schemes were delegated to gram panchayats.<br />
The distribution of resources across different<br />
districts is not based on actual needs. It must be<br />
noted that a signifi cant proportion of assigned<br />
functions to the rural local governments relates to<br />
human development. As functions, functionaries<br />
and fi nances are devolved in terms of various<br />
schemes, the distribution of funds to various<br />
districts is not based on the requirements, but<br />
is historically pre-determined and those districts<br />
with good infrastructure and have big budgets<br />
continue to receive higher transfers. There is little<br />
scope, in this pattern, to focus on the deprived<br />
districts in allocating resources. This has resulted<br />
in the persistence of sharp variations in human<br />
development outcomes among different districts.<br />
Devolution to local bodies is the easiest component<br />
of expenditure compression. The state government<br />
has tried to contain the expenditure growth under<br />
the fi scal adjustment programmes initiated in<br />
2002-03, mainly by restricting plan expenditures.<br />
As a result, the share of plan allocation by rural<br />
local governments in total state expenditures was<br />
reduced from 8.3 per cent in 2001-02 to 5.1 per<br />
cent in 2002-03 and the share of plan allocation<br />
to rural local bodies in the state’s Annual Plan<br />
outlay declined from 27.8 per cent to 18.1 per<br />
cent during the year. In fact, the district sector<br />
plan outlay declined throughout the 1990s, from<br />
2.5 per cent of GSDP in 1990-91 to 1.6 per cent<br />
in 2001-02. As a ratio of total state expenditure,<br />
the decline was from 40 per cent to 18 per cent<br />
during the period (Figure 11.1). Thus, there has<br />
been a steady erosion in the assistance given<br />
to rural local governments for developmental<br />
spending during the last decade, which was<br />
reversed only in <strong>2005</strong>-06.<br />
The various tiers of local rural governance in<br />
<strong>Karnataka</strong> are characterised by a plethora of<br />
<strong>Karnataka</strong> <strong>Human</strong> <strong>Development</strong> <strong>Report</strong> <strong>2005</strong><br />
There has been a<br />
steady erosion in the<br />
assistance given to rural<br />
local governments for<br />
developmental spending<br />
during the last decade,<br />
which was reversed only<br />
in <strong>2005</strong>-06.<br />
Percentage of State Plan Expenditure<br />
45.0<br />
40.0<br />
35.0<br />
30.0<br />
25.0<br />
20.0<br />
15.0<br />
10.0<br />
5.0<br />
0.0<br />
FIGURE 11.1<br />
Plan expenditures of rural local governments<br />
1990-91<br />
1991-92<br />
1992-93<br />
1993-94<br />
1994-95<br />
1995-96<br />
State Plan<br />
Central schemes<br />
1996-97<br />
1997-98<br />
1998-99<br />
1999-2000<br />
2000-01<br />
2001-02<br />
2002-03<br />
2<br />
Link document is the document prepared by the state government listing the various schemes implemented by ZPs, TPs, and GPs. The<br />
allocation reported in the document refers to budget estimates.<br />
Years<br />
Total District Sector<br />
259
Institutional Reforms for <strong>Human</strong> <strong>Development</strong>: Panchayat Raj<br />
The Achilles’ heel of<br />
decentralised government<br />
is taxation. Decentralised<br />
governmental units, on<br />
their part, have not taken<br />
a proactive role, either<br />
in raising the resources<br />
to increase allocation to<br />
social sector expenditures,<br />
or in increasing the<br />
effectiveness of spending<br />
programmes by improving<br />
the delivery systems.<br />
schemes on the one hand, and concentration<br />
of outlay in only a few schemes on the other.<br />
Although there were over 371 plan and<br />
228 non-plan schemes in 2001-02, only a<br />
handful of schemes contributed to the bulk<br />
of expenditures. Among the state sector plan<br />
schemes implemented in TPs, the pre-school<br />
children feeding programme was the most<br />
important. On the non-plan side, disbursement<br />
of school teachers’ salaries and providing grants<br />
to schools accounted for 80 per cent of the nonplan<br />
outlay in TPs. In the ZPs too, a handful<br />
of schemes were important. On the plan side,<br />
piped water supply, family welfare centres and<br />
PHCs, SGRY, SGSY, rural sub-centres for family<br />
welfare and DPAP accounted for 55 per cent of<br />
the plan outlay on Central schemes in 2002-<br />
03. On the non-plan side, grants disbursed to<br />
the non-government secondary schools alone<br />
accounted for about a third of expenditures in<br />
the ZPs.<br />
Discretionary funds<br />
Does rural fiscal decentralisation in <strong>Karnataka</strong><br />
empower local governments to provide public<br />
services according to the preferences of their<br />
residents? The disaggregated analysis of the<br />
outlay on 30 major schemes implemented<br />
by the rural local governments shows that<br />
they hardly have any leeway or autonomy<br />
in determining their allocation priorities. Of<br />
the total outlay, 58 per cent is earmarked for<br />
salaries, 11 per cent is simply transferred as<br />
grants-in-aid to institutions and 10 per cent is<br />
required to be spent on transfer payments to<br />
persons. Another 16 per cent is earmarked for<br />
specified schemes. This leaves the panchayats<br />
absolute discretion over only five per cent of<br />
the outlay. In respect of another 16 per cent<br />
of the outlay, they have limited autonomy.<br />
However, here too, the panchayats have the<br />
choice to determine the allocation between<br />
various input purchases within the schemes,<br />
but cannot change total allocation from the<br />
scheme. This suggests that the nature of fiscal<br />
decentralisation will have to change to enable<br />
PRIs to address area-specific needs in a more<br />
focused way.<br />
The general complaint of the panchayat leaders,<br />
especially in GPs, is that the funds devolved are<br />
not commensurate with the needs of the people<br />
and monies sanctioned to them are not released in<br />
time to carry out development works. Untied grants<br />
to GPs have increased signifi cantly over the years.<br />
Gram panchayats were initially given an annual<br />
grant of Rs.1,00,000 in 1993, Rs.2,00,000 in<br />
1999, Rs.3,50,000 in 2000, which was raised to<br />
Rs.5,00,000 in 2003. At present, they continue<br />
to get grants from the Centre under SGRY and<br />
under the Eleventh National Finance Commission<br />
recommendations. Now this grant comes to about<br />
Rs.7,50,000 per annum per gram panchayat<br />
and will increase in <strong>2005</strong>, with more schemes<br />
being delegated to PRIs. In <strong>2005</strong>-06, the District<br />
Sector Plan outlay shot up to Rs.2,002.89 crore<br />
from Rs.939.71 crore in 2004-05. The state<br />
government now directly releases its grants to the<br />
gram panchayats through banks, which makes the<br />
releases transparent and less liable to leak during<br />
transmission. 3 Rationalisation of schemes and<br />
transfer of more schemes to PRIs will offer more<br />
autonomy to PRIs.<br />
Gram panchayats and resource<br />
mobilisation<br />
The Achilles’ heel of decentralised government is<br />
taxation. Decentralised governmental units, on<br />
their part, have not taken a proactive role, either<br />
in raising the resources to increase allocation<br />
to social sector expenditures, or in increasing<br />
the effectiveness of spending programmes by<br />
improving the delivery systems. The ZPs and<br />
TPs do not have revenue-raising powers and<br />
they function as de-concentrated agencies of<br />
the state government in disbursing the salaries<br />
of teachers and health workers. At the same<br />
time, the GPs spend just about six per cent of<br />
the total expenditures incurred by the rural local<br />
governments, and thus, have a negligible role in<br />
providing social services impacting on human<br />
development. To be sure, they play some role in<br />
water supply and sanitation and in implementing<br />
the SGRY, but the resources available with the GPs<br />
3<br />
Surprisingly, when the Centre decided to directly release its<br />
grants to panchayats some state governments opposed the<br />
move!<br />
260
for water supply are meagre and in the poorer<br />
districts of northern <strong>Karnataka</strong>, which also have<br />
water scarcity, the problem is acute. Their inability<br />
to raise resources from the sources assigned to<br />
them adds to the problem of inadequate resource<br />
transfer from the state government. The GPs<br />
implement 50 per cent of the outlay on SGRY, and<br />
to that extent, they play their part in implementing<br />
poverty alleviation programmes.<br />
One reason for the relatively minor role of rural<br />
local governments in human development is<br />
their poor record of raising revenues from own<br />
sources. The ZPs and TPs do not have independent<br />
revenue raising powers, so they merely implement<br />
the schemes designed by the state or the Central<br />
government. Only the GPs have revenue raising<br />
powers, but in 2000-01, they raised only<br />
Rs.16.2 crore, or 0.08 per cent of the Gross<br />
District Domestic Product (GDDP), which in turn,<br />
constituted 22 per cent of the total revenues of<br />
the GPs. The taxes and rates assigned to gram<br />
panchayats are house tax, non-motorable vehicle<br />
tax, factory tax, entertainment tax other than<br />
cinema halls, water tax, licence fee, fee on fairs,<br />
and so on. Except property tax, the other taxes<br />
assigned are not productive, nor are they elastic;<br />
and the panchayats are too close to the people<br />
to be able to collect taxes and rates effi ciently.<br />
Both the design and implementation of property<br />
tax need to be improved. Though potentially<br />
lucrative, the tax suffers from a poor and outdated<br />
valuation system and the GPs do not have the<br />
administrative or enforcement capacity to raise<br />
signifi cant revenues from the tax. GPs have been<br />
able to collect only 69 per cent of the amount due<br />
and the cost of collection of the tax is estimated<br />
at 72 per cent. In as many as 42 per cent of the<br />
panchayats, the cost of tax collection was found to<br />
be higher than the revenue collected. A signifi cant<br />
effort will have to be made to strengthen the<br />
administrative and enforcement capacity of the<br />
GPs to raise more revenues from the sources<br />
assigned to them, to enable these grassroot level<br />
governments to play a meaningful role in human<br />
development.<br />
The state government took certain initiatives in<br />
2003 to help gram panchayats: (i) guidelines<br />
standardising rules for collection of property tax<br />
were issued; (ii) a process was set in motion for<br />
evaluation of tax that was transparent, and allowed<br />
people to participate in the tax determination<br />
process; (iii) property lists were publicised and<br />
<strong>Karnataka</strong> <strong>Human</strong> <strong>Development</strong> <strong>Report</strong> <strong>2005</strong><br />
Only the GPs have revenue<br />
raising powers, but in<br />
2000-01, they raised only<br />
Rs.16.2 crore, or<br />
0.08 per cent of the Gross<br />
District Domestic Product,<br />
which in turn, constituted<br />
22 per cent of the total<br />
revenues of the GPs.<br />
TABLE 11.1<br />
Revenue and expenditure pattern of PRIs (all tiers): Selected states, 1997-98<br />
(Per cent)<br />
States Tax and non-tax revenue Expenditure on core services<br />
All states 3.5 7.4<br />
Andhra Pradesh 5.8 16.1<br />
<strong>Karnataka</strong> 0.8 9.8<br />
Gujarat 1.8 0.7<br />
Kerala 10.1 11.9<br />
Madhya Pradesh 1.8 3.2<br />
Maharashtra 3.4 7.4<br />
Punjab* 39.8 24.5<br />
Tamil Nadu 8.1 33.4<br />
West Bengal 4.0 0.4<br />
Rajasthan 2.0 0.8<br />
Note: * For Punjab, total resources are low, i.e. just about Rs.135.4 crore, as compared to <strong>Karnataka</strong>’s Rs.3,768 crore. In the former,<br />
non-tax revenue is more than tax revenue as against the reverse situation in the latter.<br />
Source: <strong>Report</strong> of the Eleventh Finance Commission, 2000-05, Government of India, New Delhi, 2000, Annexure VIII.2A, pp 227-31.<br />
261
Institutional Reforms for <strong>Human</strong> <strong>Development</strong>: Panchayat Raj<br />
The state has been<br />
implementing social<br />
legislations and<br />
development programmes<br />
for equity and social<br />
justice for decades, but<br />
their effectiveness and<br />
reach were affected by the<br />
fact that the poor and the<br />
vulnerable did not have<br />
access to political power.<br />
put on the GP notice board for inspection. The<br />
outcome of this initiative was that there was a<br />
30 per cent increase in the number of properties<br />
enumerated and the GP tax demand more than<br />
doubled from Rs.80.6 crore to Rs.197.5 crore<br />
(RDPR, Government of <strong>Karnataka</strong>, 17.5.2004:<br />
8). It is now the turn of the gram panchayats to<br />
improve tax mobilisation.<br />
Table 11.1 depicts the actual picture of the<br />
resource mobilisation of the Panchayat Raj<br />
institutions that existed in 1997-98, based on the<br />
data of the Eleventh Finance Commission. Perhaps<br />
one may even hypothesise that mobilisation of<br />
resources would be more effective since the local<br />
governments are closer to people, but the actual<br />
picture is something different. The revenue that<br />
comes from taxes and other sources is only 3.5<br />
per cent at the all-India level. For <strong>Karnataka</strong> it is<br />
only 0.8 per cent. Among the states, Punjab has a<br />
high proportion (39.8) of tax & non tax revenue,<br />
perhaps because of the small size of resources, i.e.<br />
only Rs.135 crore.<br />
The social base of governance<br />
The state has been implementing social legislations<br />
and development programmes for equity and<br />
social justice for decades, but their effectiveness<br />
and reach were affected by the fact that the poor<br />
and the vulnerable did not have access to political<br />
power. It is now recognised that the marginalised<br />
and the poor must have access to various political<br />
fora to articulate their problems and grievances.<br />
Participation in a grassroots political process is<br />
likely to provide greater opportunities to such<br />
persons to aspire to political power and authority,<br />
through which they can also upgrade the social<br />
and economic status of other members of their<br />
caste/gender.<br />
Political representation to the disadvantaged<br />
castes such as the Scheduled Castes and the<br />
Scheduled Tribes has been guaranteed by the<br />
principle of ‘reservation’. However, there was<br />
no representation for the backward castes<br />
and women until the 1983 Act addressed that<br />
need, by providing reservation in seats and<br />
authority positions, not only to SCs and STs,<br />
but also to women and backward castes. The<br />
seat and authority position matrix is: (i) for SCs<br />
and STs in proportion to their population or a<br />
minimum of 18 per cent, (ii) 33.3 per cent for<br />
other backward castes, and, more significantly,<br />
(iii) one third for women from each of these<br />
TABLE 11.2<br />
Own revenue and expenditure pattern of village panchayats:<br />
Some selected states, 1997-98<br />
(Per cent)<br />
States Tax and non-tax revenue Expenditure on core services<br />
All states 10.1 10.7<br />
Andhra Pradesh 38.7 33.1<br />
<strong>Karnataka</strong> 33.8 28.0<br />
Gujarat 12.9 (13.2)* 23.5 (19.5)*<br />
Kerala 13.3 16.3<br />
Madhya Pradesh 4.0 3.6<br />
Maharashtra 20.6 17.5<br />
Punjab* 45.6 31.6<br />
Tamil Nadu 1.7 0.0<br />
West Bengal 9.2 0.92<br />
Rajasthan 5.1 NA<br />
Note: * for 1993-94.<br />
Source: <strong>Report</strong> of the Eleventh Finance Commission 2000-05, Government of India, New Delhi,2000, Annexure VIII.2B, pp 232-36.<br />
262
<strong>Karnataka</strong> <strong>Human</strong> <strong>Development</strong> <strong>Report</strong> <strong>2005</strong><br />
castes, including the non-reserved seats. This<br />
measure has roped in a large number of men<br />
and women from the various deprived caste<br />
groups, and, has thereby, widened the social<br />
base of governance in rural as well as urban<br />
society. Thus, in respect of panchayats, well<br />
over 60 per cent of the membership comprises<br />
Scheduled Castes, Scheduled Tribes and other<br />
backward castes. Women’s representation is<br />
considerably higher, exceeding their quota of<br />
reservation. The elections held in 2000 returned<br />
44.9 per cent, 42.2 per cent and 38.9 per cent<br />
of women in GPs, TPs and ZPs respectively<br />
(Table 11.3).<br />
TABLE 11.3<br />
Distribution of elected panchayat members by category:<br />
1994 and 2000<br />
Category 1994 2000<br />
(Per cent)<br />
ZP TP GP Total ZP TP GP Total<br />
All (Nos.) 919 3340 80627 84886 890 3255 78740 82885<br />
SCs and STs 23.1 23.1 31.6 31.18 23.8 25.4 26.7 26.6<br />
OBC 33.3 33.4 33.3 33.3 33.6 33.6 33.8 33.8<br />
Others 43.6 43.5 35.1 35.5 42.6 41.0 39.5 39.6<br />
All male 63.5 59.8 56.2 56.4 61.1 57.8 55.1 55.3<br />
All female 36.5 40.2 43.8 43.6 38.9 42.2 44.9 44.7<br />
It is noteworthy that the proportion of these<br />
sections increases as one moves down from the<br />
upper to the lower tiers of panchayats, which<br />
is appropriate, considering that these sections<br />
participate more actively in the lower governance<br />
levels, where decision-making on the public<br />
service delivery takes place more intensively.<br />
This system of reservation has brought into the<br />
local governance system a large proportion of fi rst<br />
time/fi rst generation representatives from hitherto<br />
unrepresented social groups. Though this is a<br />
welcome development, it has meant that certain<br />
gender and caste stereotypes have become visible<br />
and are seen quite wrongly as ‘constraints’. One<br />
such stereotype is that ‘women are alien to politics<br />
and governance’. The ‘belief’ represents no truth,<br />
only the reluctance of existing power structures<br />
to acknowledge and welcome social and political<br />
restructuring in the wake of the 1983 and 1993<br />
Acts. The reservation of seats and authority<br />
positions to various social groups has widened<br />
the social base of political decision-making at the<br />
decentralised governance level, thus, promoting<br />
participatory governance.<br />
People’s participation in<br />
decision-making<br />
The Act provides all the mechanisms necessary<br />
to ensure that the bodies are representative and<br />
their functioning is participatory. Good governance<br />
would imply, among other things, an effi cient<br />
delivery system; one, which is responsive to the<br />
needs and aspirations of citizens and addresses<br />
these needs with the least amount of leakage.<br />
The question that arises next is about the kind<br />
of needs and programmes that are identifi ed, and<br />
implemented. A study 4 has found that projects can<br />
be grouped in three categories, viz. (i) social and<br />
economic infrastructure projects such as school and<br />
hospital buildings, roads, bridges, irrigation tanks,<br />
and so on; (ii) civic amenities such as drinking<br />
water, drainage and street lights, community<br />
buildings, bus shelters and shopping centres; and<br />
(iii) sectoral development projects, such as projects<br />
that promote agriculture, forestry, village industries,<br />
horticulture etc. Amenities take priority because of<br />
public demand. However, the preferred projects are<br />
construction oriented such as buildings, culverts<br />
and roads. Sectoral development projects and<br />
industries have not received adequate attention<br />
from PRIs. Explanations offered by Panchayat Raj<br />
functionaries for their preference for construction<br />
oriented projects are: (i) these are the projects<br />
which the people themselves ask for and (ii) the<br />
panchayats must show ‘visible’ evidence of having<br />
met people’s needs, and hence, construction takes<br />
precedence over projects with long gestation<br />
periods or less visible outcomes such as capacity<br />
building. Construction projects lend themselves to<br />
leakage and there are reports of PRI members who<br />
have become contractors and bid for contracts.<br />
Granting that corruption does obtain under the<br />
decentralised government system – and there<br />
seems to be no evidence to the contrary – is it still<br />
4<br />
Study by Abdul Aziz, at al 2002.<br />
Reservation has<br />
brought into the local<br />
governance system a<br />
large proportion of first<br />
time/first generation<br />
representatives from<br />
hitherto unrepresented<br />
social groups.<br />
263
Institutional Reforms for <strong>Human</strong> <strong>Development</strong>: Panchayat Raj<br />
The primary objective of<br />
decentralised planning<br />
by PRIs is the promotion<br />
of rural development by<br />
identifying local needs<br />
and prioritising activities.<br />
BOX 11.2<br />
Evaluation of Panchayat Raj system<br />
more cost effi cient compared to the centralised<br />
governance system? One writer says that it is more<br />
expensive because the decentralised governance<br />
system fails to internalise the negative externality<br />
of one bribe transaction on another because of<br />
two reasons: (i) there is absence of social audit<br />
by people and their organisations; and (ii) the<br />
interlocking social and economic relationships<br />
that obtain in rural society, and the existence of<br />
small proximate groups in the villages, enable<br />
the panchayat functionaries to easily manage<br />
the risk of being caught (P. Bardhan, 1996). The<br />
Government intends to address some of these<br />
issues by establishing offi ces of Ombudsmen in the<br />
districts and strengthening the public grievance<br />
machinery.<br />
Decentralised planning<br />
The primary objective of decentralised planning<br />
by PRIs is the promotion of rural development by<br />
identifying local needs and prioritising activities.<br />
Institutional support for local level planning,<br />
such as district level planning units and the basic<br />
guidelines for carrying out planning activities<br />
have been provided. The taluk panchayats and<br />
gram panchayats have no institutional support<br />
for planning and monitoring, and this should be<br />
provided as early as possible.<br />
The Central and state governments have taken<br />
many initiatives to strengthen planning at the<br />
grassroot level. They are: (i) the merger of JGSY<br />
and EAS to create SGRY. The cash allocation<br />
is supplemented by an equivalent quantity of<br />
The National Eleventh Finance Commission has evaluated the Panchayat Raj system in the<br />
country by using ten parameters and constructing an index of decentralisation. The parameters<br />
used in the construction of the index of decentralisation are: (i) enactment/amendment of state<br />
panchayat/municipal legislation; (ii) intervention/restriction in the functioning of the local bodies;<br />
assignment of functions to the local bodies by state legislation; (iii) actual transfer of functions<br />
to these bodies by way of rules, notifi cations and orders; (iv) assignment of powers of taxation<br />
to local bodies and the extent of exercise of such powers; (v) constitution of the State Finance<br />
Commissions and the extent of action taken on their reports; (vi) election to the local bodies; and<br />
(vii) constitution of District Planning Committees. In terms of these parameters, <strong>Karnataka</strong> ranks<br />
among the top states in the country.<br />
food grains under the programme and this has<br />
augmented the funds available to the GPs and<br />
increased their capacity to plan; (ii) the Swachha<br />
Grama programme launched in April 2001 with<br />
90 per cent government funding, which has<br />
enabled GPs to prioritise rural sanitation which<br />
is inadequate in all villages; (iii) the Jal Nirmal<br />
programme (June 2002) with 85 per cent<br />
state funding is GP-centric from concept to<br />
execution; (iv) the Jalasamrakshana programme<br />
(August 2002), a cost sharing project between<br />
the state and the beneficiary, managed by the<br />
GP; (v) under the Sarva Kutumba Sameekshe<br />
(November 2003), GPs conducted a house-tohouse<br />
survey and created a database that will<br />
be useful for monitoring human development<br />
indicators.<br />
These recent initiatives by the state will<br />
undoubtedly augment the funds available to gram<br />
panchayats and strengthen their capacity to plan at<br />
the grassroot level; especially since planning and<br />
implementation have been a mixed experience so<br />
far. Often, inputs for planning are not obtained<br />
from the people, and it is the panchayat members<br />
and offi cials who supply inputs in the gram sabha<br />
meetings. Consequently, development plans<br />
prepared by the panchayats turn out to be plans<br />
made by offi cials and members for the people,<br />
and not plans of the people prepared by the<br />
people. Some panchayats have ensured people’s<br />
participation at the stage of implementation of<br />
projects through special committees, and projects<br />
are completed effi ciently and in time. In other<br />
panchayats, where people are not involved,<br />
implementation of projects is ineffi cient and not<br />
cost-effective.<br />
The District Sector Plan is supposed to be a<br />
blend of plans emanating from Panchayat<br />
Raj institutions and urban local bodies. The<br />
integration of plans from all the tiers does not<br />
always result in a seamless document, and<br />
instead, a jumble of projects with no time or<br />
project connectivity is produced. District Planning<br />
Committees need capacity building if they are to<br />
function effectively as nodal planning agencies<br />
at the district level.<br />
264
Further, there is a need to ensure that the<br />
planning process is free from any kind of state<br />
intervention. In fact, with a view to making it<br />
more relevant and strong, the Working Group on<br />
Decentralisation (March 2002) holds the view<br />
that the planning process should move away<br />
from sectoral planning to a system of integrated<br />
area planning.<br />
PRIs and civil society<br />
Owing to the critical problems associated with the<br />
public service delivery system such as ineffi ciency,<br />
poor resources, and lack of adequate citizen<br />
participation there has emerged a consensus for<br />
public-private partnership to promote an effi cient<br />
and effective service delivery system. This has<br />
brought into focus the institution of civil society,<br />
which is supposed to demand better performance<br />
and accountability, and monitor public service<br />
provisioning.<br />
The term ‘civil society’ embraces a large number<br />
of institutions outside the state, such as capitalist<br />
market institutions, religious institutions, private<br />
and public associations, all forms of cooperative<br />
social relationships, and political parties (C. Jeffry<br />
Alexander, 1998). We will look at only a few aspects<br />
of civil society, which can have a meaningful<br />
interface with decentralised governments such<br />
as non-governmental organisations (NGOs) and<br />
community based organisations (CBOs). These<br />
institutions/organisations have the potential to<br />
support and strengthen decentralised governments<br />
and work with them as partners. They can play a<br />
role in revitalising decentralised governments at<br />
three levels: motivating people to participate in the<br />
decision-making process, providing information<br />
to people on various aspects of local government<br />
and planning, and providing inputs on attitudinal<br />
changes, for example, with regard to reservations<br />
for weaker sections. They can provide inputs to<br />
both elected members and the bureaucracy (Abdul<br />
Aziz, 1999).<br />
A three-state study covering <strong>Karnataka</strong>, Andhra<br />
Pradesh and Tamil Nadu holds the view that NGOs<br />
and CBOs had no role at all in PRI functioning or<br />
implementation. The NGO-panchayat partnership<br />
did not fl ower because of mutual suspicion about<br />
motives. As for people’s organisations such as<br />
Mahila Mandals and youth clubs, the study notes<br />
that they ‘hardly fi nd a common ground to work<br />
with panchayats. Both of them are content with<br />
organising sports and cultural activities during<br />
national and state festivals taking fi nancial<br />
assistance from panchayats’ (Abdul Aziz, 2002).<br />
A different perspective does exist, however. One<br />
writer says ‘The NGOs in <strong>Karnataka</strong> were dubious<br />
towards the new decentralised political structure<br />
in the beginning (they however) were forced to<br />
redefi ne their rules because PRIs have become<br />
part of the structure within which NGOs have to<br />
work, and structural changes in PRIs are aimed at<br />
people-centered rural development, which is also<br />
the objective of many of the NGOs’ (Susanne Dam<br />
Hansen, 1999: 79-80). As part of this change,<br />
NGOs in <strong>Karnataka</strong> are reported to have supported<br />
PRIs, both during pre- and post-election periods.<br />
During the pre-election period they have enabled<br />
women and the underprivileged to contest<br />
elections and provided them with moral support.<br />
During the post-election period, they have<br />
promoted capacity building among marginalised<br />
people by giving them formal training (Susanne<br />
Dam Hansen, 1999: Alex Tuscano, 1999.<br />
It is clear that though civil society has immense<br />
potential to work as a partner with local bodies,<br />
so far it has played a limited role in terms of<br />
interacting with PRIs. This could, in part, be<br />
due to the reluctance of NGOs and people’s<br />
organisations to work with the local leadership<br />
on the one hand and the cautious attitude<br />
of the panchayat functionaries towards the<br />
intentions of certain civil society organisations<br />
on the other.<br />
Conclusions<br />
The PRI system has been steadily evolving in the<br />
state and there are constant efforts to ensure that<br />
the powers of the Panchayat Raj bodies are not<br />
eroded and more functions are devolved to them<br />
in accordance with the letter and spirit of the<br />
Constitution. Constraints that prevent PRIs from<br />
optimising their performance have been discussed<br />
above. However, even given these constraints, PRIs<br />
have not prioritised human development goals in<br />
<strong>Karnataka</strong> <strong>Human</strong> <strong>Development</strong> <strong>Report</strong> <strong>2005</strong><br />
NGOs and CBOs have the<br />
potential to support and<br />
strengthen decentralised<br />
governments and work<br />
with them as partners.<br />
They can play a role in<br />
revitalising decentralised<br />
governments at three<br />
levels: motivating people<br />
to participate in the<br />
decision-making process,<br />
providing information to<br />
people on various aspects<br />
of local government and<br />
planning, and providing<br />
inputs on attitudinal<br />
changes.<br />
265
Institutional Reforms for <strong>Human</strong> <strong>Development</strong>: Panchayat Raj<br />
PRIs have not prioritised<br />
human development<br />
goals in their wish lists.<br />
More capacity building,<br />
inclusion of human<br />
development goals in<br />
district sector plans<br />
backed by funds and<br />
sustained monitoring<br />
of HD objectives would<br />
contribute significantly to<br />
improving HD outcomes,<br />
in north <strong>Karnataka</strong> in<br />
particular.<br />
their wish lists. More capacity building, inclusion<br />
of human development goals in district sector<br />
plans backed by funds and sustained monitoring<br />
of HD objectives would contribute signifi cantly<br />
to improving HD outcomes, in north <strong>Karnataka</strong><br />
in particular. The new arena of intervention is<br />
the village, and gram panchayats have created<br />
formidable databases that will underpin HD<br />
planning and monitoring at the grassroots. Gram<br />
panchayats are perfectly positioned to ensure that<br />
all children remain in school and that all births are<br />
institutional births. Such initiatives could improve<br />
literacy rates, and reduce IMR and MMR very<br />
visibly. The state’s role should be primarily, as a<br />
resource centre, rather than an enforcer. In that<br />
respect, <strong>Karnataka</strong> has moved steadily towards<br />
ensuring greater autonomy for PRIs. Hopefully<br />
this will promote more participatory governance<br />
and better HD outcomes over the next decade.<br />
Recommendations<br />
<br />
With the state having initiated so many<br />
measures to devolve more powers to<br />
PRIs, the next step should be effi cient<br />
operationalisation of these measures;<br />
<strong>Human</strong> development objectives should<br />
be incorporated in District Plans and the<br />
outcomes monitored;<br />
Increases in district Annual Plan outlays<br />
should not be distributed on a pro-rata basis<br />
to districts. Instead, districts with poor human<br />
and economic development indicators should<br />
receive more resources;<br />
Increase untied funds to districts with very<br />
low human development indicators (HDI)<br />
(primarily, the Hyderabad <strong>Karnataka</strong> area);<br />
Strengthen District Planning Committees by<br />
building capacity;<br />
Provide planning infrastructure to taluk<br />
panchayats;<br />
Strengthen Gram Panchayats by providing<br />
managerial and technical assistance to<br />
enable them to perform more effectively;<br />
Gram Panchayats should increase their<br />
resource base through mobilisation of taxes.<br />
Government could award incentives to gram<br />
panchayats that perform well; and<br />
Build capacity in community based<br />
organisations so that they can function as<br />
effective agents of change.<br />
266
Good Governance
CHAPTER 12<br />
Good Governance<br />
Introduction<br />
Investing in human development is, to some<br />
extent, about the provisioning of funds, but<br />
merely pumping in money without addressing the<br />
subject of effective service delivery means there is<br />
tremendous wastage in human and fi scal terms.<br />
The issue is not merely ‘how much’ has been<br />
provided, but ‘how’ it has been spent. Systems<br />
should be effi cient, people-friendly and corruption<br />
free. Very often, states fail to achieve high levels of<br />
performance in human development because the<br />
systems lack accountability, are riddled with red<br />
tape and are distanced from the people. Leakage<br />
of funds earmarked for human development into<br />
the pockets of contractors, bureaucrats and other<br />
vested interest groups means that funds are not<br />
being used for the most vulnerable sections of<br />
society. Providing good governance will ensure<br />
that the human development requirements of<br />
those who are most in need, will be met effi ciently<br />
and effectively.<br />
Good governance is about providing an effi cient<br />
and effective administration that is committed to<br />
improving the quality of life of the people. It is<br />
about what people expect from the administration,<br />
and the willingness and capacity of the<br />
administration to fulfi ll their expectations. The main<br />
tenets of good governance can be enumerated<br />
as: (i) improved delivery systems for services,<br />
(ii) increasing simplicity and accessibility of<br />
systems and procedures, (iii) increased fi scal<br />
responsibility and effi ciency of expenditures<br />
through sound fi nancial management, (iv) higher<br />
levels of accountability and transparency in<br />
governance, and (v) stringent anti-corruption<br />
measures. Good governance enables a<br />
citizen-friendly, citizen-caring and responsive<br />
administration, and in the process, results in the<br />
exercise of public authority for the common good.<br />
The changes in policy and new governance<br />
measures have brought about a more accountable,<br />
transparent and effi cient administration. <strong>Karnataka</strong><br />
is regarded today as one of the better governed<br />
states in the country, and its civil service seen as<br />
more compact, effi cient and responsive than in<br />
most other states.<br />
The Government of <strong>Karnataka</strong> has undertaken<br />
reforms that focus on collective service delivery and<br />
help in more equitable distribution of services. A<br />
survey conducted by Public Affairs Centre, (PAC)<br />
Bangalore, in 2001 covered rural and urban areas<br />
and basic services such as health, education, bus<br />
transport, and subsidised distribution. The survey’s<br />
results put <strong>Karnataka</strong> in the third place in a list of<br />
22 states. As to whether the quality of public service<br />
delivery has improved in <strong>Karnataka</strong>, evidence is not<br />
available for the whole state, but evidence from<br />
Bangalore suggests it has. The PAC conducted two<br />
surveys in 1994 and 1999 to assess satisfaction<br />
with government services among Bangalore<br />
residents. For the six public utilities covered in the<br />
survey, the proportion of satisfi ed users rose from<br />
nine per cent to 32 per cent, while the number<br />
of dissatisfi ed users fell from 41 per cent to 19<br />
per cent. The survey also provided information on<br />
individual services, which suggest that positive<br />
improvements have occurred.<br />
Apart from signifi cant progress in the delivery<br />
of services in Bangalore city, state-wide services<br />
have also been improved. In fact, many of the<br />
reforms fi rst introduced in Bangalore are now<br />
being extended beyond the capital to other<br />
towns. At present, the focus is on rural services,<br />
e.g. improving regulatory services provided by<br />
local government offi ces, establishing rural IT<br />
kiosks through public-private partnerships, and<br />
expanding rural public transport services.<br />
Good governance is about<br />
providing an efficient and<br />
effective administration<br />
that is committed to<br />
improving the quality of<br />
life of the people. It is<br />
about what people expect<br />
from the administration,<br />
and the willingness<br />
and capacity of the<br />
administration to fulfill<br />
their expectations.<br />
Service delivery<br />
In the last few years, <strong>Karnataka</strong> has been moving<br />
steadily forward on the path of good governance.<br />
Bhoomi is an intervention directed at improving<br />
the delivery of services, which are of particular<br />
relevance to farmers. The Record of Rights,<br />
269
Good Governance<br />
BOX 12.1<br />
Components of good governance<br />
The main components of good governance are:<br />
1. Improving service delivery<br />
To provide services to the people in accordance with specifi ed standards, devoid of harassment or<br />
corruption, minimising waiting time or inconvenience to the members of the public;<br />
To ensure cost effectiveness in the provision of services by adopting the most appropriate system;<br />
To adopt participatory mechanisms in public service delivery, involving the people, people’s<br />
institutions, civil society groups, community based organisations, and self-help groups;<br />
To develop the appropriate cost, time and quality benchmarks for service delivery outcomes;<br />
To develop, implement and monitor performance measurement and management systems by<br />
developing performance indicators for service delivery;<br />
To promote decentralisation and strengthen rural and urban local bodies in order to deliver services<br />
by empowering them with devolution of functions, fi nances and functionaries, and undertaking<br />
capacity building programmes; and<br />
To undertake objective assessments of programmes and obtain feedback in order to improve policy<br />
contents and implementation mechanisms.<br />
2. System improvement<br />
To take steps to simplify government procedures, reduce costs and improve interface with citizens;<br />
To improve systems in order to improve transparency, cut red tape and ensure better performance<br />
management;<br />
To modify complicated and rigid government processes so as to reduce and eliminate delay,<br />
duplication and redundancy, and improve the speed and quality of public service; and<br />
To reform processes dealing with citizens and those which breed corruption, such as procurement and<br />
tenders.<br />
3. Financial management<br />
To ensure fi scal responsibility and sanctity of the budget process;<br />
To move away from expenditure targets to performance-related measures and milestones which can<br />
be defi ned and are measurable; and<br />
To institute effective budget formulation, execution, monitoring, reporting and asset management in<br />
order to ensure that public money is made available quickly and without delay for the purpose for<br />
which it is meant and utilised properly for the benefi t of the people.<br />
4. Accountability and transparency<br />
To develop and implement Citizens’ Charters and Service Charters so as to obtain feedback on<br />
implementation and take corrective action with the involvement of citizens;<br />
To develop and implement a grievances monitoring and redressal mechanism to ensure sensitivity of<br />
the administration to the problems faced by the citizens;<br />
To end secrecy and opacity in administration and bring about transparency so that the administration<br />
is seen as just and fair, especially in matters relating to public procurement;<br />
To ensure that citizens have maximum access to governmental information, by making transparency<br />
the rule and offi cial secrecy the exception; and<br />
To establish citizen evaluation mechanisms such as citizen report cards, social audit, user groups<br />
monitoring and independent evaluation by professional agencies.<br />
5. Anti-corruption measures<br />
To declare zero tolerance for corruption, strengthen vigilance and anti-corruption machinery, eliminate<br />
duplication in enforcement functions and to promote measures to prevent and combat corruption<br />
more effectively and effi ciently.<br />
270
Tenancy and Crop Enumeration (RTC) plays a<br />
vital role in the life of farmers. The records are<br />
required for security of tenure, seeking crop<br />
loan, bail in criminal cases, and scholarships<br />
for children, planning by administrators, as well<br />
as for agriculture related inputs by the private<br />
sector. The land records of all the villages in<br />
<strong>Karnataka</strong> have been computerised (2 crore<br />
land records of <strong>Karnataka</strong> containing various<br />
details like ownership, crop, bank loan, irrigation,<br />
etc. belonging to 70 lakh farmers, spread over<br />
27,000 villages). All 176 taluks operate with<br />
independent servers. Bhoomi uses the fi ngerprint<br />
system at every stage for authentication and nonrepudiation.<br />
It has helped to minimise problems<br />
and impediments like corruption, tampering<br />
of records, delay in updating records and nonavailability<br />
of instant data for planning purposes.<br />
Small and marginal farmers have greatly benefi ted<br />
from Bhoomi .<br />
One instrument for improving service delivery is<br />
decentralisation, an area in which <strong>Karnataka</strong> has<br />
traditionally been a leader, as has been discussed<br />
in chapter 11. A major reform led to 196 urban<br />
local bodies out of 222 adopting the state’s new<br />
capital value-based self-assessment property<br />
tax regime. Revenues have been buoyant as a<br />
result. Assessment of the property tax has become<br />
more transparent and citizen-friendly. Substantial<br />
delegation of fi nancial powers from the state<br />
government to the urban local bodies has been<br />
effected to increase local autonomy and speed up<br />
decision-making.<br />
System improvement<br />
<strong>Karnataka</strong> has undertaken a number of<br />
system improvement measures. One of the<br />
key steps has been the implementation of the<br />
recommendations of the Administrative Reforms<br />
Commission which include introduction of<br />
single fi le system, desk offi ce system, transfer<br />
policy guidelines, implementation of functional<br />
reviews, abolition of divisional level posts which<br />
had become redundant after the zilla panchayats<br />
became operational, sub-state centres, transfer<br />
of state sector schemes to panchayats, merger/<br />
abolition of schemes, and a voluntary retirement<br />
scheme.<br />
The state has been a pioneer in e-governance.<br />
E-governance in <strong>Karnataka</strong> has succeeded in<br />
changing the way the administration functions,<br />
shares information and delivers services to<br />
external and internal clients. Various initiatives<br />
in e-governance have harnessed information<br />
and communications technology to transform<br />
relationships with citizens and businesses, and<br />
between various departments of the government.<br />
The benefi ts from these initiatives have included<br />
reduced corruption, increased transparency,<br />
greater convenience, higher revenues, and lower<br />
costs. They have benefi ted citizens by reducing<br />
delays, consolidating multiple services under one<br />
roof and eliminating the need for frequent visits to<br />
government offi ces. In addition, publication of rules<br />
and procedures online has increased transparency.<br />
Because it is the poor people who bear the brunt<br />
of administrative ineffi ciency and corruption,<br />
delivering services through rural kiosks has led to<br />
their economic and social empowerment.<br />
The e-governance initiatives have also led to<br />
higher productivity. The government has cut staff<br />
and re-deployed its employees in more productive<br />
tasks. Data captured by the electronic system has<br />
enabled more frequent and accurate data sharing<br />
across departments, closer monitoring of employee<br />
productivity, easier identifi cation of pressure points<br />
for delay and corruption, and improved compilation<br />
of historical data that has been mined for policy<br />
analysis. Documentation of the existing procedures<br />
and their simplifi cation into tasks that can be<br />
completed in a few steps without compromising<br />
their basic purpose, has been another signifi cant<br />
gain that e-governance has generated.<br />
<strong>Karnataka</strong>’s e-governance efforts have been<br />
largely based on several key departmental<br />
initiatives. Bhoomi is now fully operational and<br />
is constantly being improved. It was the recipient<br />
of a <strong>United</strong> <strong>Nations</strong> Public Services award in June<br />
2006 1 . A hand-held computer (simputer) has<br />
been provided to village accountants to record<br />
crop data and the next step is to provide access to<br />
the Bhoomi database through rural tele-centres.<br />
1<br />
<strong>Karnataka</strong> <strong>Human</strong> <strong>Development</strong> <strong>Report</strong> <strong>2005</strong> includes some<br />
details of developments for the year 2006 too.<br />
<strong>Karnataka</strong> <strong>Human</strong> <strong>Development</strong> <strong>Report</strong> <strong>2005</strong><br />
The state has been a<br />
pioneer in e-governance.<br />
E-governance in<br />
<strong>Karnataka</strong> has succeeded<br />
in changing the way the<br />
administration functions,<br />
shares information and<br />
delivers services to<br />
external and internal<br />
clients.<br />
271
Good Governance<br />
Under Khajane, all treasuries in the state went<br />
online from October 2002. The Bangalore Water<br />
Supply and Sanitation Board (BWSSB) is using a<br />
GIS system to monitor its water supply network<br />
and hand-held computers for accurate meter<br />
reading and bill production, online bill payments,<br />
automated cash payment machines and an<br />
innovative grievance redressal mechanism. The<br />
Bangalore electrical utility, Bangalore Electricity<br />
Supply Company (BESCOM), has introduced an<br />
electronic clearing system for automatic payment<br />
of bills from bank accounts. Another important<br />
initiative is Sachivalaya Vahini. This system<br />
tracks every fi le and letter in the Secretariat.<br />
It is even possible to track the duration of time<br />
a fi le has ‘languished’ at different levels in the<br />
government. This monitoring system has helped<br />
the <strong>Karnataka</strong> government clear 1,00,000 fi les<br />
in little over a year.<br />
Financial management<br />
The <strong>Karnataka</strong> Fiscal Responsibility Bill, which<br />
became law in August 2002, has been designed<br />
to ensure fi scal responsibility and sanctity of the<br />
budget process. All departments are required<br />
to prepare Departmental Medium Term Fiscal<br />
Plans (DMTFPs). The Act, the fi rst of its kind in<br />
the country, commits the state to eliminating<br />
revenue defi cit and restricting the fi scal defi cit<br />
to three per cent of GSDP by <strong>2005</strong>-06,<br />
thus aiming to ensure the achievement of fi scal<br />
stabilisation: indeed, the 2002-03 achievements<br />
have been the result of the initial moves towards<br />
this goal. Fiscal adjustment initiatives in 2003-04<br />
include economy measures without affecting<br />
high priority sectors, to tackle the likely revenue<br />
shortfall.<br />
Good progress has been made in budget<br />
simplifi cation with the reduction in demands for<br />
grants from 61 to 29, and their rationalisation<br />
along departmental lines, reduction in object<br />
codes from 269 to 70, and reduction in the<br />
number of schemes by about 15 per cent over the<br />
last two years.<br />
A signifi cant initiative in fi nancial management<br />
is the Khajane scheme. More than 34,000<br />
offi cers in the state disburse cheques. In<br />
addition, 4,500 rural and urban local bodies<br />
like zilla panchayats, taluk panchayats, gram<br />
panchayats, and municipalities also draw<br />
money from the Treasury. The system tracks all<br />
the cheques on a real time basis. The treasury<br />
payment system handles over Rs.24,000 crore<br />
annually through 225 treasuries. The system<br />
serves six lakh government employees and<br />
4.7 lakh pensioners of government service, art<br />
and culture, sports people, journalists, freedom<br />
fi ghters, etc. In addition, the system deals with<br />
over 13 lakh recipients of old age, disability and<br />
widow pensions.<br />
BOX 12.2<br />
Government-citizen interaction for e-governance<br />
The following activities, which involve regular government citizen interaction, must be taken up for<br />
e-governance:<br />
Urban <strong>Development</strong> Department Birth and death certifi cates.<br />
Revenue Department Issue of caste and income certifi cates, birth and<br />
death certifi cates.<br />
Social Welfare Department Issue of caste certifi cates.<br />
Education Department Release of grants to educational institutions, schoolbased<br />
tracking of enrolment and retention fi gures.<br />
Home Department Filing of FIRs, monitoring progress of cases<br />
especially with reference to crimes against women,<br />
the Scheduled Castes and Scheduled Tribes.<br />
Health and Family Welfare Department PHC-based tracking of institutional deliveries, ANC,<br />
immunisation, HIV/AIDS cases.<br />
272
<strong>Karnataka</strong> <strong>Human</strong> <strong>Development</strong> <strong>Report</strong> <strong>2005</strong><br />
Accountability and<br />
transparency<br />
People generally do not know what to expect in<br />
terms of service delivery, resulting in a sense of<br />
helplessness among citizens. To counter this, the<br />
people need to be enabled to demand public<br />
accountability. Standards and norms of service<br />
delivery need to be specifi ed and given wide<br />
publicity. The Citizens’ Charter is the best tool for<br />
the purpose. The Charter enhances transparency<br />
in the working of government and also empowers<br />
citizens to resist corrupt practices by those in<br />
authority. A wide range of departments and<br />
agencies with signifi cant public interface have<br />
already adopted the Citizens’ Charter, and have<br />
institutionalised user feedback linked to business<br />
process re-engineering and computerisation.<br />
There is already a comprehensive grievance<br />
monitoring and redressal mechanism in place. At<br />
the fi eld level, a programme for regular grievance<br />
redressal, with the Deputy Commissioners and zilla<br />
panchayat Chief Executive Offi cers, following a prenotifi<br />
ed schedule of visits to the taluk and village<br />
level, has been introduced. The feedback from the<br />
people is also a part of the system. Impromptu,<br />
as well as organised fi eld visits, interaction with<br />
the benefi ciaries, holding grievance redressal<br />
meetings – all these have helped to bring policy<br />
and implementation closer to the people. Such fi rst<br />
hand feedback has also helped the government<br />
strengthen existing development programmes by<br />
taking up mid-course corrections and evolving<br />
better programmes.<br />
In 2000, <strong>Karnataka</strong> passed the Right to<br />
Information Act, which became effective in 2002.<br />
The intention was to dispel the secrecy and lack<br />
of openness in transactions, which is responsible<br />
for much of the corruption in government work.<br />
Access of the citizens to such information would<br />
not only contribute to an administration that is<br />
accountable: it would also provide a safeguard<br />
against abuse of authority by the bureaucracy and<br />
elected representatives.<br />
Anti-corruption measures<br />
The PAC’s report card for Bangalore City in 1993<br />
revealed that the electricity board, the water<br />
and sewerage board, the municipal corporation,<br />
hospitals and the city’s development authority<br />
were the agencies with which citizens had the most<br />
interactions. Nearly 92 per cent of these transactions<br />
were made through repeated personal visits to the<br />
offi ces to resolve a problem. Respondents also<br />
stated that they paid ‘speed money’ to agency staff<br />
to get their work done. Even sick people, using<br />
public or private health services were not spared,<br />
suggesting that ‘speed money’ is taken in the nongovernment<br />
sector as well (Table 12.1).<br />
A high 80 per cent paid speed money in private<br />
hospitals ‘to ensure good and proper treatment’,<br />
as compared with 25 per cent in government<br />
hospitals, where there is greater diversifi cation of<br />
objectives, ranging from tips to paying for getting<br />
themselves discharged. In charitable hospitals, 33<br />
per cent of the patients paid out of gratitude.<br />
Public scrutiny of government decisions has been<br />
made possible with the enactment of the Right to<br />
Information Act, aiming at tackling corruption in<br />
a meaningful way. More transparent procurement<br />
processes also help reduce corruption. In 2000,<br />
the <strong>Karnataka</strong> Transparency in Public Procurement<br />
Act was passed. To reduce political interference in<br />
the tendering process at the local level, the Works<br />
Committees, made up of elected representatives<br />
of urban local governments, have been done away<br />
with. The exemption previously provided under<br />
the Transparency Act to Public Sector Undertakings<br />
has expired and will not be renewed.<br />
In terms of corruption enforcement, <strong>Karnataka</strong><br />
has had, since 1985, the most powerful<br />
Type of hospital<br />
The Charter enhances<br />
transparency in the<br />
working of government<br />
and also empowers<br />
citizens to resist corrupt<br />
practices by those in<br />
authority. A wide range<br />
of departments and<br />
agencies with significant<br />
public interface have<br />
already adopted the<br />
Citizens’ Charter, and<br />
have institutionalised<br />
user feedback linked<br />
to business process<br />
re-engineering and<br />
computerisation.<br />
TABLE 12.1<br />
Profile of bribes paid by in-patients on various counts<br />
Proportion in the sample<br />
claiming to have paid<br />
bribes (%)<br />
Average payment<br />
per transaction<br />
(Rs.)<br />
Government 51 252<br />
Corporation 89 211<br />
Mission and Charity 29 331<br />
Private 24 229<br />
Source: PAC http://www.transparency.org/working_papers/gopakumar/kgopakumar.html.<br />
273
Good Governance<br />
There are no standard<br />
indicators for good<br />
governance. International<br />
agencies have developed<br />
indicators for human<br />
development, but these<br />
alone cannot be taken<br />
as indicators for good<br />
governance.<br />
anti-corruption offi ce in the country, the Lok<br />
Ayukta. In other states, there are either multiple<br />
anti-corruption agencies, or the agency in<br />
existence lacks independence. In <strong>Karnataka</strong>,<br />
the Lok Ayukta, which is an independent offi ce<br />
and is the sole body charged with combating<br />
corruption, is well resourced with 500 staff, and<br />
has a wide ranging mandate to act in respect of<br />
complaints against both politicians and offi cials.<br />
Indicators of good governance<br />
There are no standard indicators for good governance.<br />
International agencies have developed indicators for<br />
human development, but these alone cannot be<br />
taken as indicators for good governance. Reduction<br />
in infant mortality, improvement in literacy rates or<br />
reduction in poverty levels may refl ect the success<br />
of a government in its policies or implementation<br />
procedures. However, while these measures are<br />
indicators of the effective implementation of<br />
programmes, they do not completely capture the<br />
qualitative aspects of good governance. If, for<br />
example, family planning targets are achieved<br />
through coercion rather than awareness building,<br />
then the qualitative aspect is missing. Transparency<br />
International’s Corruption Perception Index is possibly<br />
the best known governance indicator. However, this<br />
is a very broad indicator and cannot really help the<br />
government in initiating specifi c public sector reforms.<br />
The problem is that such an indicator implicates<br />
many institutions and policies at the same time and<br />
there is no suggestion of a solution.<br />
Does a booming economy and higher growth<br />
refl ect good governance? During the second half<br />
of the 1990s, <strong>Karnataka</strong> became the third largest<br />
recipient of FDI among major Indian states,<br />
and had the highest income per capita basis.<br />
<strong>Karnataka</strong>’s good growth record in the 1990s was<br />
maintained in 2000-01 (with real growth of 6.7<br />
per cent), but slowed in 2001-02 and 2002-03 on<br />
account of drought. Poverty in the state has shown<br />
a consistent decline. Rural poverty in <strong>Karnataka</strong><br />
fell from 29.88 per cent in 1993-94 to 17.38<br />
per cent in 1999-2000, as compared to an<br />
all-India decline from 37.27 per cent to 27.09<br />
per cent. However, high fi scal growth, although<br />
an indirect indicator of good governance can fully<br />
qualify for this role only if the economy is able<br />
to ensure more than proportionate benefi ts to the<br />
poor.<br />
Is political stability an indicator of good<br />
governance? Political parties contest and win<br />
elections on various issues. Emotional, rather than<br />
governance issues, often determine the voting<br />
pattern and election outcomes. Therefore, political<br />
parties have very little incentive to focus on good<br />
governance when in power. That being the case,<br />
one needs to look at possible areas of electoral<br />
reforms and proactive participation of civil society<br />
in bringing governance issues before the electorate<br />
as a major area of electoral debate. This is likely<br />
to act as an incentive to political parties to attach<br />
greater importance to governance issues and is<br />
likely to have a lasting impact.<br />
Fiscal performance and audit can also be indicators<br />
of good governance. In the present day scenario,<br />
accountability is measured only by audit, and<br />
the audit process focuses only on the procedural<br />
aspects of the administration’s work. There is<br />
little or no concern for timely outcomes. The<br />
procedures, thus, become an end in themselves<br />
for the administration, and the outcomes that are<br />
more important are not given the attention they<br />
deserve. With so many hierarchical levels involved<br />
in implementing a single task, it becomes diffi cult<br />
to fi x responsibility for the outcome on any single<br />
individual. The entire system works towards<br />
avoiding audit remarks and inquiries, instead of<br />
focusing on how to deliver services effectively to<br />
the public. In this obsession with audit-avoidance,<br />
results are sacrifi ced.<br />
In any case, any assessment of good governance<br />
should include inputs from various governance<br />
stakeholders such as elected representatives, local<br />
bodies (urban and rural), the corporate sector, the<br />
bureaucracy and citizens. Feedback from the Citizens’<br />
Charters could be an excellent governance indicator.<br />
The system of review/report card, as done by the<br />
Public Affairs Centre, on certain mutually identifi ed<br />
parameters of good governance, could also serve<br />
as an objective indicator. It would be worthwhile<br />
for the government to consider instituting regular<br />
report cards/feedback on identifi ed parameters so<br />
that the pace of governance reforms is assessed<br />
274
periodically and mid course corrections, if required,<br />
carried out.<br />
Concerns<br />
There are some specifi c concerns, however, which<br />
need to be addressed expeditiously. The poor<br />
record of redressal of public grievances in almost<br />
all departments of public utilities is a major cause<br />
of public dissatisfaction. This is, almost always, a<br />
subject of criticism by elected representatives. Public<br />
grievances generally arise out of the inaccessibility<br />
of offi cials, failure to acknowledge applications,<br />
non-adherence to time limits, and highly cryptic<br />
and bureaucratic responses to people’s grievances.<br />
Every government department should have a welldefi<br />
ned mission statement setting out standards<br />
of service to be provided. The other reasons for the<br />
grievance redressal system not being effective are<br />
(i) responsibility is not assigned to individuals for<br />
each task; (ii) responsibility for non-redressal of<br />
grievances is rarely fi xed; (iii) government offi cials<br />
are not properly trained in grievance redressal<br />
measures.<br />
A serious problem for any one who has to deal with<br />
the government as a citizen is its sheer complexity.<br />
Because of the multiplicity and commonality of the<br />
schemes, the public has a hard task in identifying<br />
the right department that would be able to solve<br />
their problems. Worse, even for fairly simple<br />
matters such as obtaining caste and income<br />
certifi cates, birth and death certifi cates, licenses<br />
of business, selling of properties, a number of<br />
different agencies requiring a plethora of different<br />
forms are involved. The illiterate and the poor<br />
are badly affected. They are unable to avail<br />
themselves of benefi ts under various development<br />
programmes because of lack of information, the<br />
diffi culties inherent in applying for such benefi ts<br />
and their inability to pay for speeding up work.<br />
Clearly, the citizens’ access to governmental<br />
information is circumscribed. Even the Right to<br />
Information Act will have limited success until<br />
several other related Acts and Government<br />
Rules of Business are changed. There has to be a<br />
fundamental change in the way the government<br />
functions, in terms of updating and codifying<br />
procedures, simplifying rules and an attitudinal<br />
change in the civil service. The culture of secrecy that<br />
pervades the functioning of the government must<br />
be broken. Though the Right to Information Act has<br />
been passed, barriers to information continue to<br />
remain. Offi cial information is not easily accessible<br />
to the people and what is available is not easily<br />
comprehensible, written as it is, in bureaucratic<br />
jargon. Rules and procedures, more often than not,<br />
involve a lot of discretion, providing ample scope<br />
for abuse of powers and corruption.<br />
The conduct of diagnostic surveys through<br />
outsourcing could also help in providing vital<br />
information when institutional weaknesses inhibit<br />
the regular fl ow of information. However, such<br />
diagnostic surveys are not regular and there are<br />
several levels of acceptability to be undergone,<br />
before any correctional measures based on the<br />
survey recommendations can be taken. The<br />
Planning Department of the Government of<br />
<strong>Karnataka</strong> has instituted the practice of evaluating<br />
certain important schemes of the departments by<br />
outsourcing evaluation to independent agencies.<br />
Government tends to measure the success of<br />
programmes by the sheer number of people<br />
benefi ted, rather than by ‘how’ they are benefi ted.<br />
While the Monthly Monitoring Review (MMR) and<br />
<strong>Karnataka</strong> <strong>Development</strong> Project (KDP) meetings<br />
at the government level focus on review of<br />
fi nancial and physical progress, such reviews do<br />
not provide enough opportunity to assess the<br />
quality of service delivery to the people.<br />
Rigid rules, archaic procedures and resistance<br />
to change have always been the barriers to<br />
governance reforms. Several tasks and schemes<br />
in the government have become so redundant<br />
and stereotyped that employees very often do<br />
not know what they are trying to accomplish.<br />
Workloads are unevenly distributed. While some<br />
fi eld offi cers are under-worked, others are overworked<br />
and some offi ces are located in places<br />
inaccessible to the public. The tax-payers and the<br />
general public are not interested in what rules and<br />
processes the bureaucracy follows, but they do<br />
care deeply about how the government delivers<br />
services.<br />
<strong>Karnataka</strong> <strong>Human</strong> <strong>Development</strong> <strong>Report</strong> <strong>2005</strong><br />
Every government<br />
department should have<br />
a well-defined mission<br />
statement setting out<br />
standards of service to be<br />
provided.<br />
275
Good Governance<br />
Making the administration<br />
more people- and<br />
market-friendly as well<br />
as more efficient calls<br />
for improvement in civil<br />
service management. This<br />
means the development<br />
of a professional civil<br />
service.<br />
Making the administration more people- and<br />
market-friendly as well as more effi cient calls for<br />
improvement in civil service management. This<br />
means the development of a professional civil<br />
service. Employees’ skills and aptitudes are not<br />
matched with the work they perform. Performance<br />
has little bearing on pay and promotions. Vested<br />
personal loyalties and political considerations<br />
prompt routine professional and career<br />
decisions. Success offers few rewards, failures<br />
few punishments. Government procedures and<br />
administrative orders make it tough to reward<br />
good performers or even to discipline the nonperformers<br />
as the following report shows.<br />
Teacher absenteeism is a phenomenon present<br />
in all-indian states including <strong>Karnataka</strong>. A<br />
World Bank survey (2004) found that teacher<br />
absenteeism in India ranged from 14.6 per cent<br />
in Maharashtra to 41.9 per cent in Jharkhand.<br />
<strong>Karnataka</strong> stood eighth with 21.7 per cent.<br />
Teachers in schools that had been inspected in<br />
the three months prior to the survey were about<br />
two per cent less likely to be absent. Teachers<br />
who were ‘powerful’ (male, older, better educated<br />
and higher ranking) were likely to be more<br />
frequently absent because they were the ones<br />
against whom it was most diffi cult to take action.<br />
The report points to a lack of accountability<br />
and lack of action, both before and after the<br />
event, in both teachers and supervisors. School<br />
<strong>Development</strong> Monitoring Committees (SDMCs)<br />
have been constituted with parents as members<br />
to ensure better governance in the system, but<br />
its performance has been mixed.<br />
Recommendations<br />
It is clear that <strong>Karnataka</strong> should take steps to<br />
sustain the pace of governance reforms and also<br />
initiate action for further reforms. The improvement<br />
in service delivery and the gradual reduction<br />
of poverty should serve as an impetus to the<br />
government to continue with governance reforms.<br />
There also is a broad political consensus for the<br />
reforms, since many of the reform strategies in the<br />
state have been effected through legislations, for<br />
instance, the Transparency in Public Procurement<br />
Act, Fiscal Responsibility Act, Industrial Facilitation<br />
Act, etc. Such Acts have helped institutionalise<br />
the reform process. Lessons from the ongoing<br />
reform process reveal the importance of political<br />
ownership of the reforms to ensure sustainability.<br />
To take the reforms forward, it is recommended<br />
that the following measures should be initiated:<br />
Set up a Task Force in governance reforms;<br />
Bring out an annual governance strategy and<br />
action plan;<br />
Have a governance strategy and action plan<br />
for each district. This would also help to focus<br />
on reducing regional disparities;<br />
Bring out an e-governance action plan for<br />
every government department;<br />
Give greater publicity to the Right<br />
to Information Act and also improve<br />
documentation, archives of documents;<br />
Continue to take action to rationalise<br />
government activities and schemes;<br />
Extend the success of the Sachivalaya Vahini<br />
to districts, beginning initially with the offi ces<br />
of the Deputy Commissioners and Chief<br />
Executive Offi cers of the zilla panchayats;<br />
Strengthen the public-private partnership,<br />
especially in the areas of infrastructure<br />
development so that government investments<br />
are reduced and the private sector also gets<br />
encouraging returns on its investments; and<br />
Have grievance adalats at the district, taluk<br />
and gram panchayat levels to address issues<br />
pertaining to land, food security, housing,<br />
health, education, public works, drinking<br />
water, sanitation, power, agriculture, with<br />
special emphasis on areas pertaining to<br />
law, order and crime, and especially crimes<br />
against women.<br />
276
Voluntarism and NGOs
CHAPTER 13<br />
Voluntarism and NGOs<br />
Introduction<br />
A dynamic civil society in an elected, participatory<br />
democracy such as India, ensures that there is a<br />
strong and vocal constituency for public fi nancing<br />
and provisioning of basic social services. It also<br />
is the best safeguard against bad governance,<br />
ineffi cient service delivery and the hierarchical<br />
structures of decision-making that result in delays<br />
and red tape. At the same time, civil societies<br />
are often fragmented and stratifi ed into ‘haves’<br />
and ‘have-nots’ on the basis of income, gender<br />
and caste, resulting in disparities in access to<br />
public resources and services. The poor and the<br />
marginalised lack the ability to give voice to their<br />
concerns. Empowering the voiceless and giving<br />
visibility to the ‘invisible’ therefore, are signifi cant<br />
aspects of the process of building strong civil<br />
society organisations (CSOs) and forms a part<br />
of the agenda of many non-governmental<br />
organisations (NGOs). Civil society organisations<br />
are community based organisations and include<br />
labour unions, NGOs, people’s groups, foundations<br />
and religion-based groups.<br />
Unlike the public sector, which is often accused<br />
of ineffi ciency and non-responsive behaviour, or<br />
the private sector which, driven by profi t, prices<br />
itself out of the reach of the poor, the voluntary<br />
sector is perceived to be motivated by altruism,<br />
making it a suitable catalyst for promoting the<br />
sustainable development of the poor in rural<br />
areas; an agency capable of giving voice to the<br />
needs and aspirations of people and enabling the<br />
growth of local participatory mechanisms for selfempowerment.<br />
This chapter will look at the role<br />
of NGOs in human development from several<br />
perspectives, viz. (i) while the poor continue to<br />
be overwhelmingly dependent on public social<br />
services, NGOs have begun to emerge as key<br />
players in various human development sectors,<br />
thereby supplementing public efforts, (ii) NGOdriven<br />
initiatives often bring a more participatory<br />
and empowering focus to development,<br />
(iii) NGOs and civil society organisations, while not<br />
necessarily coterminous, tend to have overlapping<br />
objectives and many grassroots CSOs have their<br />
origins in the ground-breaking work of NGOs. In<br />
this sense, NGOs have strengthened civil society.<br />
The sheer diversity of NGO activity is testimony to<br />
the range, professionalism and expertise of these<br />
organisations. NGOs have been instrumental<br />
in the provision of healthcare, literacy, poverty<br />
alleviation through sustainable development,<br />
rehabilitation, women’s rights, engendered<br />
human development programmes, environmental<br />
protection, HIV/AIDS support programmes,<br />
agriculture extension services, to name a few. They<br />
supplement government services in a signifi cant<br />
way although their methodology is different.<br />
The chapter acknowledges the strengths that NGOs<br />
bring to their work in diverse sectors and analyses<br />
their contributions to human development in the<br />
state. At the same time, the constraints on NGO<br />
actions are also briefl y examined.<br />
Voluntarism, which has its roots in altruism,<br />
has a long tradition in India, and particularly in<br />
<strong>Karnataka</strong>. The roots of voluntarism are two-fold:<br />
religion and the freedom movement. <strong>Karnataka</strong><br />
has the classic example of Sri Basaveswara:<br />
born in 1131 AD, a very great social reformer,<br />
who at the age of 16, rejected untouchability<br />
and the rigid rituals that widows were forced to<br />
follow; and promoted, with vigour, equal rights for<br />
women and a casteless society. Although many of<br />
the voluntary institutions devoted to social service<br />
in <strong>Karnataka</strong> emerged from religion, they created<br />
a distinct space for themselves and adopted a<br />
professional approach to developmental issues.<br />
However, the degree of institutional space between<br />
the organisations devoted to social service and<br />
the formal religious establishment from which<br />
they originate differs. In some institutions, for<br />
example, the religious head is also the head of<br />
the social service institution, while in others, the<br />
social service organisation is more autonomous.<br />
Unlike the public sector,<br />
which is often accused<br />
of inefficiency and nonresponsive<br />
behaviour, or<br />
the private sector which,<br />
driven by profit, prices<br />
itself out of the reach of<br />
the poor, the voluntary<br />
sector is perceived to be<br />
motivated by altruism,<br />
making it a suitable<br />
catalyst for promoting the<br />
sustainable development<br />
of the poor in rural areas;<br />
an agency capable of<br />
giving voice to the needs<br />
and aspirations of people<br />
and enabling the growth<br />
of local participatory<br />
mechanisms for selfempowerment.<br />
279
Voluntarism and NGOs<br />
The recognition of the<br />
role of voluntary agencies<br />
in partnering government<br />
initiatives by the Centre<br />
may have had some<br />
influence in the initiatives<br />
taken by the Government<br />
of <strong>Karnataka</strong> to bring<br />
several NGOs into major<br />
government sponsored<br />
programmes.<br />
The degree of space between the religious<br />
establishment and the social service institution<br />
shapes the social and development strategies that<br />
the latter selects as its mission.<br />
The other major source of voluntarism was the<br />
freedom movement, and Mahatma Gandhi in<br />
particular. There are hundreds of organisations in<br />
<strong>Karnataka</strong>, which originated during the freedom<br />
movement and continue to do constructive work in<br />
communities, addressing issues like Dalit welfare,<br />
illiteracy and poverty. The inspirational basis for<br />
most of them is Mahatma Gandhi’s philosophy<br />
rather than any religion.<br />
The Central Government and<br />
NGOs<br />
The Government of <strong>Karnataka</strong>’s approach to<br />
voluntary agencies is conditioned very much by<br />
the position taken by the Central Government,<br />
mainly in the plan documents. Most of the<br />
plans focus on a broad spectrum of voluntary<br />
involvement. The Sixth Five Year Plan was the<br />
fi rst to include a reference to the voluntary sector,<br />
even if it was only in the context of distinguishing<br />
such organisations from cooperatives and<br />
Panchayat Raj institutions (PRIs), which are<br />
government sponsored. In the Tenth Plan, NGOs<br />
are described as intermediary, not-for-profi t<br />
institutions but they are referred to only twice;<br />
the space and attention given to the voluntary<br />
sector is really minimal. It is only in the Seventh<br />
Plan that there is an extensive discussion of<br />
the voluntary sector and ‘NGOs’, which are<br />
generally understood to be not-for-profi t,<br />
professional, intermediary institutions, which<br />
manage programmes in the areas of economic<br />
and social development, engage in advocacy,<br />
welfare, rehabilitation and training. These NGOs<br />
are generally not membership institutions. They<br />
form one set of institutions, which are part of<br />
a broader portfolio, which include institutions<br />
like trade unions, professional associations,<br />
and environmental groups, which are largely<br />
membership institutions. However, the members<br />
of the membership institutions mentioned above<br />
are largely from the middle and upper classes.<br />
There is another category of institutions generally<br />
called community based organisations (CBOs)<br />
which are also membership institutions but<br />
whose members are from the ‘targeted sections’<br />
of development interventions and a majority are<br />
poor. Many NGOs are involved in building these<br />
community based institutions.<br />
The plan documents, even the Seventh Plan, do not<br />
use the term ‘NGO’. The Tenth Plan is the exception.<br />
The earlier Plans used terms like ‘people’s<br />
participation’ (Sixth Plan), ‘voluntary agencies’<br />
(Seventh Plan), ‘voluntary sector/organisation’<br />
(Eighth, Ninth Plans). The focus, therefore, is on<br />
the broader portfolio of institutions described<br />
above, which fall more comfortably under the<br />
umbrella of Civil Society Organisations rather than<br />
NGOs in the commonly understood sense. This<br />
focus on ‘voluntary’ rather than ‘non-government’<br />
is part of the long tradition of voluntarism in the<br />
country. Many voluntary organisations received<br />
grants from the Central and state governments<br />
to run orphanages, homes for destitute women,<br />
hostels for working women, hostels for Scheduled<br />
Caste and Scheduled Tribe students, primary<br />
and secondary schools and colleges. The focus of<br />
government-voluntary agency partnership was the<br />
management of institutions. The management of<br />
poverty alleviation and social service programmes<br />
was the preserve of the government.<br />
NGOs in <strong>Karnataka</strong><br />
The profi le of government-voluntary organisation<br />
partnership followed much the same path in<br />
<strong>Karnataka</strong>. The recognition of the role of voluntary<br />
agencies in partnering government initiatives by<br />
the Centre may have had some infl uence in the<br />
initiatives taken by the Government of <strong>Karnataka</strong><br />
to bring several NGOs into major government<br />
sponsored programmes. Though this experience<br />
has been a mixed one, there is ample evidence<br />
that, on the whole, this collaboration between the<br />
public and voluntary (NGO) sectors in development<br />
has helped to raise the ownership of people of<br />
these programmes and the quality of people’s<br />
institutions that subsequently emerged.<br />
One interesting feature of this process is that<br />
the government itself has promoted a number of<br />
NGOs registered under the Societies Registration<br />
Act. These institutions, registered under the<br />
280
Societies Act, have government employees as<br />
members and executives of the society. Almost<br />
all of these government sponsored societies have<br />
been promoted in the context of bilaterally and<br />
multilaterally funded projects. Such organisations<br />
tend to further blur the profi le of a voluntary<br />
organisation. In reality, they are part of the<br />
implementing structure of government. If we add<br />
to these organisations set up by government,<br />
other charitable societies and trusts set up by<br />
business houses as well as educational institutions<br />
(including the Indian Institutes of Management)<br />
and hospitals, the character of a voluntary<br />
organisation becomes further indeterminate. As<br />
a result, several of the problems that NGOs - as<br />
commonly understood – continue to face, arise<br />
from decisions taken by governments relating<br />
to taxation and other forms of control that are<br />
actually more appropriate to profi t making<br />
societies like certain hospitals and educational<br />
institutions, but which, by default, extend to all<br />
institutions since they all fall under the umbrella<br />
category of ‘registered societies’.<br />
NGOs, CBOs and SHGs<br />
It might be useful to briefl y describe how this<br />
chapter considers these three institutions. As<br />
already mentioned, the Seventh Plan Document<br />
is the only one which focuses on those<br />
organisations which fi t the category ‘NGO’ as we<br />
now understand it, and which are not-for-profi t,<br />
professional, intermediary institutions which<br />
manage programmes in the areas of economic and<br />
social development, engage in advocacy, welfare,<br />
rehabilitation and training. The World Bank, for<br />
instance, defi nes NGOs as a wide spectrum of<br />
groups and institutions that are entirely or largely<br />
independent of government, and characterised<br />
primarily by humanitarian or cooperative, rather<br />
than commercial, objectives. This description<br />
excludes organisations such as universities<br />
and research institutions which are often<br />
autonomous, and refers mainly to private, nonprofi<br />
t organisations that are engaged in activities<br />
to relieve suffering, promote the interests of the<br />
poor, protect the environment, provide basic social<br />
services, or undertake community development.<br />
They depend on donations and voluntary service<br />
to run their organisations.<br />
The term ‘self-help group’ (SHG) is sometimes<br />
used very ubiquitously to encompass all kinds<br />
of group activity; a more exact defi nition of an<br />
SHG would be a group or collective of people<br />
based on the affi nity of its members, who share a<br />
similar socio-economic status. The group manages<br />
savings and credit to its members, provides access<br />
to regular income to enable members to meet<br />
their livelihood needs while empowering them to<br />
create social and political space for themselves in<br />
their households and communities. Over time, a<br />
sustainable and dynamic SHG may evolve into<br />
an NGO and/or CSO. (See chapter 14 for more<br />
information on SHGs).<br />
A Community Based Organisation (CBO) is a<br />
generic term, used very loosely to describe a<br />
private non-profi t organisation or group that<br />
works within a community for the socio-economic<br />
development of that community. Very often, the<br />
CBO focuses on issues of local signifi cance such as<br />
literacy, violence against women, child healthcare<br />
and livelihoods, to name a few. The term is also<br />
used to describe any group of people such as<br />
SHGs, Village Forest Committees, User Groups, etc.<br />
The term CBO is used mainly to distinguish these<br />
institutions from NGOs, which are intermediary<br />
organisations. The CBOs are usually membership<br />
institutions that function at a more ‘informal’ level<br />
(though some of them do register or may even be<br />
compelled to register if they are to benefi t directly<br />
from certain types of government programmes)<br />
while the NGOs are invariably legal entities.<br />
How successful are CBOs in managing community<br />
resources in a democratic, participatory manner?<br />
The CBOs referred to here are those that manage<br />
community resources such as forests, irrigation<br />
tanks, watersheds and village water supply<br />
schemes. Most of these community user groups<br />
have been formed by NGOs working in a bilateral/<br />
multilateral-funded project administered by the<br />
state government. The management of community<br />
resources through user groups is often a component<br />
of the project structure. A survey of Village Forest<br />
Committees (VFCs) in Uttara Kannada district<br />
indicates that many VFCs have been successful<br />
in eradicating the role of contractors who used to<br />
exploit families who collected non-timber forest<br />
<strong>Karnataka</strong> <strong>Human</strong> <strong>Development</strong> <strong>Report</strong> <strong>2005</strong><br />
A Community Based<br />
Organisation is a generic<br />
term, used very loosely<br />
to describe a private<br />
non-profit organisation<br />
or group that works<br />
within a community<br />
for the socio-economic<br />
development of that<br />
community. Very often, the<br />
CBO focuses on issues of<br />
local significance such as<br />
literacy, violence against<br />
women, child healthcare<br />
and livelihoods, to name<br />
a few.<br />
281
Voluntarism and NGOs<br />
The formation of a CBO<br />
does not automatically<br />
ensure democratic<br />
management of a given<br />
resource, even if NGOs<br />
are involved in the<br />
process. Besides, when<br />
a CBO is formed at the<br />
instance of government,<br />
then, the top-down<br />
approach of management<br />
remains and the user<br />
groups’ dependence on<br />
government departments<br />
for technical and<br />
financial assistance<br />
impedes the evolution<br />
of an autonomous, selfmanaging<br />
CBO.<br />
products (NTFP). However, power over these<br />
resources was then transferred to the powerful<br />
families in the village who dominated the Village<br />
Forest Committees. An employee of the Forest<br />
Department was the secretary of the committee<br />
and was responsible for organising meetings and<br />
keeping the accounts. As a result, meetings were<br />
not held regularly. This combination of legitimising<br />
the powerful and strengthening the nexus between<br />
the local Forest Department staff and the village<br />
elite did little to improve community ownership<br />
and management of forest resources. Both NGOs<br />
and government departments contributed to this<br />
situation. As a result, it was subsequently proposed<br />
that Village Forest Committees be disbanded and<br />
that the panchayats take over the responsibility<br />
of managing these resources. Village forest<br />
committees continue to function, however.<br />
The performance of user groups in the<br />
management of irrigation tanks has also not<br />
matched expectations. This is due to many reasons,<br />
the major one being that many of the cultivators in<br />
the irrigated area of the tank are share croppers,<br />
and therefore, do not have much interest in<br />
improving the land or maintaining the water<br />
source. Management of these facilities, which<br />
had not always been effi ciently managed earlier,<br />
means that the user groups will have to mobilise<br />
funds for payment of electricity and maintenance<br />
charges. The performance of user groups in major<br />
irrigation programmes has been comparatively<br />
better; but there is still much to be done in building<br />
a synergy between the government departments<br />
that manage irrigation and the people who<br />
use the water. The formation of a CBO does not<br />
automatically ensure democratic management of<br />
a given resource, even if NGOs are involved in<br />
the process. Besides, when a CBO is formed at<br />
the instance of government, then, the top-down<br />
approach of management remains and the user<br />
groups’ dependence on government departments<br />
for technical and fi nancial assistance impedes the<br />
evolution of an autonomous, self-managing CBO.<br />
The conclusion is not that the CBOs have no<br />
place in development strategy, but that they<br />
cannot be expected to discharge their functions<br />
competently without systematic capacity building<br />
inputs (which cannot happen through just one or<br />
two training programmes targeting one or two<br />
CBO representatives) and without the delegation<br />
of at least some real authority. The latter scenario<br />
can result in confl ict-situations with PRIs but a<br />
‘happy’ solution has been found by converting<br />
some CBOs such as watershed committees, which<br />
handle substantial funds into sub-committees of<br />
the jurisdictional GP. Co-opting a CBO may mean<br />
that statutory requirements have been met since<br />
the GP is entrusted with local developmental tasks<br />
but it does very little for the autonomy of the CBO.<br />
Further, the nature of the CBO should depend on<br />
the nature of the resource to be managed. A milk<br />
society at the village level, for example, must<br />
include both large and small farmers, as well as<br />
landless families involved in milk production. It<br />
is the large farmers who produce enough milk<br />
to make the route viable. The small farmers<br />
and landless families are then able to sell their<br />
marginally surplus production of milk to the milk<br />
union. However, when the resource is fi nance for<br />
credit, if large and small farmers/landless families<br />
are included in the same group, then the richer<br />
and more powerful people are likely to control all<br />
the resources and ride roughshod over the poor.<br />
<strong>Karnataka</strong> enjoys the distinction of fostering a<br />
healthy relationship between the government<br />
and NGOs. Such partnerships are established in<br />
the hope of greater synergy, and even though<br />
they may bring confl icts in their wake, <strong>Karnataka</strong><br />
has chosen to manage these tensions, rather than<br />
abandoning NGO partnerships altogether.<br />
Government–NGO partnership<br />
What are the reasons for involving NGOs in<br />
development programmes? There is a long<br />
history of NGOs being part of the service delivery<br />
system of the government; the major examples<br />
are in health related programmes, women and<br />
child care, and more recently in programmes<br />
funded by the Ministry of Rural <strong>Development</strong>.<br />
Involvement of NGOs offi cially in multilateral/<br />
bilateral programmes raises the level of<br />
cooperation to another level. The NGOs become<br />
not only implementers; they also fi nd a place in<br />
designing and managing programmes together<br />
with government at all levels.<br />
282
<strong>Karnataka</strong> <strong>Human</strong> <strong>Development</strong> <strong>Report</strong> <strong>2005</strong><br />
The Government of <strong>Karnataka</strong> was the fi rst to<br />
take this step; the watershed project in Gulbarga<br />
(1986) was the fi rst in the country in which the<br />
GoK, a bilateral agency (Swiss <strong>Development</strong><br />
Cooperation) and an NGO (MYRADA) were<br />
offi cially involved in a triangular partnership.<br />
However, a conceptual framework is required<br />
which provides an institutionalised basis for such<br />
collaborations to work effectively.<br />
Assuming that the basis for Government-NGO<br />
partnerships is the comparative advantages that<br />
each can bring into the programme, the relationship<br />
should either thrive on mutual respect – including<br />
spaces for disagreements and compromises in the<br />
interests of the partnership goals – or go separate<br />
ways: there is not much space for a middle path,<br />
and to take on the roles of contractor-supplicant<br />
defeats the purpose of coming together; at any<br />
rate, it cannot be called a ‘partnership’.<br />
One issue that has been worrying many NGOs is<br />
whether the ability to remain true to their core<br />
objectives will be diluted when the government<br />
is the fi nancing agency. How far is the NGO<br />
prepared to go in questioning the assumptions of<br />
the programme under implementation? There is<br />
no doubt that the ability of the NGO to question<br />
will depend very much on: a) the size of the<br />
NGO, especially at the grassroots in terms of the<br />
area covered and people directly involved in its<br />
programmes; b) the NGO’s credibility based on<br />
its past performance and those involved with it<br />
at Board level and senior management positions;<br />
and c) the ability of the NGO to negotiate with<br />
government without polarising and publicising the<br />
issue. All NGOs do not have these features, nor are<br />
all these strengths equally obvious in those NGOs,<br />
which have them.<br />
The ability to infl uence policy is also conditioned by<br />
the bidding process. NGOs argue that bidding for<br />
contracts to implement programmes announced<br />
by the government ties the hands of the bidding<br />
agency and puts it at a disadvantage if it were<br />
to question the contents and implementation<br />
strategies of programmes. However, NGOs do bid<br />
for contracts and the government then deals with<br />
NGOs as contractors.<br />
BOX 13.1<br />
Characteristics of NGOs’ activities<br />
NGOs are characterised by the diversity of their activities. They are also associated with effi cient,<br />
participatory service delivery systems. Government-NGO partnerships seek to build on the<br />
indisputable strengths of the good performing NGOs. These are: (i) the willingness to work<br />
in remote areas among marginalised people, (ii) the ability to set in motion, a participatory<br />
process in the identifi cation of needs, the design and implementation of programmes, (iii) the<br />
readiness to use and mobilise local resources, (iv) a non-hierarchical approach to working<br />
with people, (v) cost effective service delivery, (vi) freedom from red tape and (vii) freedom<br />
to innovate.<br />
But then, the government is not the only<br />
organisation that may push NGOs in a certain<br />
direction. Many NGOs are dependent on donor<br />
funds and the increasing competition for donor<br />
funds squeezes out the smaller NGOs. Donors,<br />
in turn, may impose standardised formats, and<br />
this results in NGOs losing their key strengths:<br />
diversity and fl exibility. Governments, in turn,<br />
accuse NGOs of secrecy and lack of transparency<br />
regarding donors and the use of funds. A more<br />
serious concern for many governments is the issue<br />
of mandate and accountability. Marshcall notes<br />
that NGOs must be very clear about who they<br />
derive their mandate from and to whom they are<br />
accountable. Professing to speak for the people or<br />
acting as alternatives to elected governments is<br />
misleading and undermines the credibility of NGOs.<br />
While tensions can erupt in the wake of successful<br />
social awareness programmes initiated by NGOs,<br />
when the power elites may feel threatened (e.g.<br />
anti-arrack agitations, anti-dowry actions), such<br />
tensions can be seen to be producing outcomes<br />
that promote equity and social justice. It is more<br />
problematic when NGOs and elected bodies come<br />
into confl ict. In <strong>Karnataka</strong>, however, the very<br />
successful ‘Gram SAT’ training of PRI functionaries<br />
was implemented with NGO participation, so, it<br />
is possible for PRIs and NGOs to harmonise their<br />
developmental activities.<br />
Categories of NGOs in<br />
<strong>Karnataka</strong><br />
NGOs are usually categorised according to their<br />
main activity. However, the history of NGOs shows<br />
that many NGOs start with a particular activity,<br />
but broaden their portfolio as they progressively<br />
283
Voluntarism and NGOs<br />
respond to people’s concerns, which are not<br />
compartmentalised. Most NGOs however, are<br />
mobilisers of people and providers of services.<br />
From this basis, they move to catalysing social<br />
change and infl uencing gender relations. An<br />
analysis of the Directory of Voluntary Organisations<br />
in <strong>Karnataka</strong>, which brought out profi les of 530<br />
NGOs, indicates that of the 530 NGOs surveyed,<br />
the largest numbers are engaged in development,<br />
followed by social service and health. It also shows<br />
that the majority, by far, are situated in central and<br />
south <strong>Karnataka</strong>. (Table 13.1)<br />
TABLE 13.1<br />
Category index of NGOs<br />
Main category Sub category No. of NGOs<br />
Culture and Arts<br />
Education<br />
Health and Rehabilitation<br />
Social Service<br />
Culture 5<br />
Media and communication 7<br />
Recreation and adventure 2<br />
Total 14<br />
Education – General 14<br />
Scholarships for education 2<br />
Non-formal education 1<br />
Primary and secondary education 1<br />
Value education 4<br />
Skills/Vocational training 9<br />
Research and scientifi c education 1<br />
Education – others 12<br />
Total 44<br />
Alternative/indigenous healthcare 2<br />
Blood services 2<br />
Cancer-related 3<br />
Community health 5<br />
Disability 5<br />
Services for the intellectually impaired 14<br />
Services for multiple disabilities 6<br />
Physically impaired/Cerebral palsy 11<br />
Speech and hearing impaired 6<br />
Visually impaired 6<br />
Eye care 1<br />
Family planning 1<br />
HIV/AIDS 5<br />
Hospitals 1<br />
Leprosy 4<br />
Mental health 5<br />
Substance abuse rehabilitation 7<br />
Health – General 11<br />
Health – Others 2<br />
Total 97<br />
Social Service - General 49<br />
Care of the elderly 21<br />
Childcare, orphanages, adoption 29<br />
Street children 2<br />
(Table 13.1 Contd...)<br />
284
<strong>Karnataka</strong> <strong>Human</strong> <strong>Development</strong> <strong>Report</strong> <strong>2005</strong><br />
(Table 13.1 Contd...)<br />
Main category Sub category No. of NGOs<br />
Crisis intervention, counselling 14<br />
Destitute and abandoned 3<br />
Total 118<br />
Alternative energy 2<br />
Animal and bird care 5<br />
Ecology and environment 9<br />
Environment<br />
Organic farming and marketing 2<br />
Tribal communities and forests 9<br />
Environment - Others 1<br />
Total 28<br />
General <strong>Development</strong> Organisations 61<br />
Agriculture 4<br />
Alternative tourism 1<br />
Drinking water and sanitation 3<br />
<strong>Development</strong><br />
Handicrafts support 2<br />
Housing 1<br />
Rural development 63<br />
Entrepreneur development 6<br />
Slum development 13<br />
Total 154<br />
Child labour 9<br />
Civic organisations/Civil liberties 5<br />
Consumer interests and concerns 3<br />
Dalit issues 5<br />
Law and Advocacy<br />
Women, Gender, Rights 19<br />
<strong>Human</strong> Rights and Legal Aid 3<br />
Devadasis and sex workers 2<br />
Law and Advocacy - others 1<br />
Total 47<br />
Documentation and research 3<br />
<strong>Development</strong> research fellowships 1<br />
Grant-making (Indian) 1<br />
Grant-making (International) 1<br />
Management, HRD, Evaluation 2<br />
Support organisations<br />
Networking and advisory services 4<br />
Literature (publishing/marketing) 1<br />
Training 7<br />
Accounting/Auditing/Legal Advice 1<br />
Fund raising 2<br />
Support – Other 4<br />
Total 27<br />
Religion<br />
Religion – support and promotion 1<br />
Total 1<br />
Total of all types 530<br />
Note: This is by no means a complete list of NGOs in <strong>Karnataka</strong> and the lack of reliable data is a serious constraint.<br />
Source: Bangalore Cares: Directory of Voluntary Organisations in <strong>Karnataka</strong>, 2000.<br />
285
Voluntarism and NGOs<br />
Conclusion<br />
It may be asked why NGOs should not take over<br />
more government functions when they have so<br />
many advantages. The answer is that most NGOs<br />
are small, and hence, lack institutional capacity,<br />
have access to limited funds and all too often,<br />
are capable of dealing only with single issues.<br />
Besides, the government cannot transfer its<br />
responsibilities for poverty alleviation, food security,<br />
social security and basic social services to NGOs.<br />
People have certain expectations of their elected<br />
representatives that NGOs cannot substitute. NGOs,<br />
with their indubitable strengths, play a signifi cant<br />
role in advocacy, building CSOs and CBOs and<br />
implementing services at the grassroots in a<br />
participatory manner. This is their great contribution:<br />
building a dynamic and responsive civil society and<br />
enabling the poor and the vulnerable to speak for<br />
themselves. This will become evident in the chapter<br />
on self-help groups.<br />
286
Self-Help Groups:<br />
Empowerment Through Participation
CHAPTER 14<br />
Self-Help Groups: Empowerment<br />
Through Participation<br />
Introduction<br />
Self-help groups (SHGs) and women’s self-help<br />
groups (WSHGs) in particular, represent a form of<br />
intervention that is a radical departure from most<br />
current programmes. They are an effective strategy<br />
for poverty alleviation, human development<br />
and social empowerment. They offer grassroots<br />
participatory implementation that is demand<br />
driven by ‘benefi ciaries’ who, in other projects,<br />
often fi nd themselves receiving goods or services<br />
in a manner that is opaque and impersonal. Most<br />
SHG-based programmes are implemented by the<br />
government in partnership with NGOs or by NGOs<br />
and donor agencies. SHGs also have the potential<br />
to transform themselves into vibrant civil society<br />
organisations.<br />
Credit needs of the poor<br />
Poverty represents a negative facet of human<br />
development. The state of <strong>Karnataka</strong> has always<br />
recognised the need for, and the value of, fi nancial<br />
services to the poor. Financial services can be<br />
classifi ed as access to fi nances and management<br />
of fi nances. Where the poor are concerned, access<br />
is tackled through various schemes for below<br />
the poverty line (BPL) households and while the<br />
names of such schemes have changed over the<br />
years, the core elements have remained the same<br />
since the days of the Integrated Rural <strong>Development</strong><br />
Programme (IRDP), viz. a loan accompanied by<br />
a subsidy, that together, amount to a fairly large<br />
single-dose infusion of funds to the identifi ed poor<br />
families. The management aspect was largely<br />
ignored with government functionaries making<br />
most of the credit decisions on behalf of the poor.<br />
Schemes on offer covered a limited range of<br />
pre-determined investment choices accompanied<br />
by infl exible terms and conditions.<br />
Yet, there is no reason to believe that the basic<br />
reasons why poor people need money are any<br />
different – except in matters of detail – from<br />
the requirements of the rich. The poor borrow to<br />
invest in activities that enable income-generation,<br />
to meet societal obligations related to ‘life events’<br />
(births, deaths, weddings, etc.) and to meet<br />
emergency needs related to accidents, drought,<br />
illness and other such unforeseen contingencies.<br />
Cases of loans taken for asset-creation being<br />
‘diverted’ to pay for contingent expenditure occur<br />
because fi nancial institutions do not lend for<br />
non-asset creation purposes.<br />
There is enough empirical evidence at hand to<br />
support the following statements:<br />
1. A single-dose infusion of credit into a poor<br />
household – even when worked out on<br />
the basis of feasibility studies of economic<br />
activities and even if accompanied by a<br />
signifi cant subsidy component – is not viable.<br />
The poor benefi t far more signifi cantly from<br />
multiple doses of credit that begin small<br />
and grow in volume with each loan cycle. It<br />
takes an average of 5 or more loan cycles<br />
to graduate from being poor to becoming<br />
non-poor.<br />
2. The poor need money in amounts, at<br />
specifi c times, and for purposes that make<br />
the money materially useful to them. They<br />
are competent to make practical fi nancial<br />
calculations and take ‘street-smart’ decisions<br />
just as well as the better-off. They may enjoy<br />
receiving grants and subsidies but are, at<br />
the same time, aware that subsidies are<br />
no replacement for a fi nancial system that<br />
works.<br />
3. The requirements of poor families, of<br />
materially useful sums of money, can come<br />
in one of several ways, of which, the three<br />
most ubiquitous are through (i) savings<br />
– where current consumption of money is<br />
postponed to yield lump sums at future dates<br />
Poverty represents a<br />
negative facet of human<br />
development. The state<br />
of <strong>Karnataka</strong> has always<br />
recognised the need for,<br />
and value of, financial<br />
services to the poor.<br />
289
Self-Help Groups: Empowerment Through Participation<br />
BOX 14.1<br />
What is an SHG?<br />
NABARD defi nes it as a group of 20 or less people from a homogenous class who are willing<br />
to come together for addressing their common problems. They make regular savings and use<br />
the pooled savings to give interest-bearing loans to their members. The process helps them<br />
imbibe the essentials of fi nancial intermediation including prioritisation of needs, setting<br />
self-determined terms for repayment, and keeping books and records. It builds fi nancial discipline<br />
and credit history that then encourages banks to lend to them in certain multiples of their own<br />
savings and without any demand for collateral security.<br />
To this defi nition can be added the affi nity dimension and the need to acquire the 6 organisational<br />
characteristics of Vision/Mission, Organisational Management Systems, Organisational<br />
Accountability Norms, Financial Management Systems, Learning and Evaluation Systems and<br />
Networks and Linkages with other institutions.<br />
The poor can and do<br />
save in a variety of<br />
ways. Yet, their poverty<br />
compels them to take<br />
loans from time to time,<br />
which – because of their<br />
fragile situations and<br />
the alignment of market<br />
forces – they may or may<br />
not be able to adequately<br />
service.<br />
(ii) loans – where a lump sum is obtained at<br />
present in exchange for surrendering future<br />
consumption, and (iii) sale of assets – which<br />
may either represent a planned process of<br />
fi nancial management or be a crisis response.<br />
4. The poor can and do save in a variety of<br />
ways. Yet, their poverty compels them to take<br />
loans from time to time, which – because of<br />
their fragile situations and the alignment<br />
of market forces – they may or may not be<br />
able to adequately service. What is true is<br />
that the moneylender – also represented by<br />
landlords, traders, provision shop owners,<br />
relatives, salaried friends and neighbours,<br />
etc. – is their most reliable credit provider,<br />
despite the prospect of adverse consequences<br />
in the future.<br />
The origin of the self-help group strategy can<br />
be traced to recognition of these truths based<br />
on a systematic observation of people’s coping<br />
mechanisms and behaviour in relation to money.<br />
However, though money and its management<br />
was the starting point of the SHG strategy (the<br />
groups were earlier called Credit Management<br />
Groups), experience in the facilitation of such<br />
groups soon made it obvious that not only did the<br />
money in their hands enable the poor to slowly<br />
acquire power, but even more, the group strategy<br />
itself created spaces and involved processes that<br />
transformed SHGs into civil society organisations<br />
that empowered members – both individually and<br />
collectively – a gestalt, where the organised whole<br />
became more than the sum of its parts. This is an<br />
important realisation. It can infl uence the choice<br />
between adopting a credit delivery approach that<br />
is content with putting some extra money (loans/<br />
subsidies) in the hands of a poor person, and a<br />
group-based credit management approach where<br />
the processes of managing group funds lead to<br />
members taking the lead in the management<br />
of the group itself and becomes a means of<br />
empowering the poor, especially women, both in<br />
the public and private domains.<br />
The history of SHGs in<br />
<strong>Karnataka</strong><br />
<strong>Karnataka</strong> does not fi gure on the top of the tables<br />
published by fi nancial institutions that show<br />
the number of self-help groups formed in each<br />
state. This is mainly because the tables capture<br />
data after 1991-92 when the National Bank for<br />
Agriculture and Rural <strong>Development</strong> (NABARD)<br />
launched the SHG-Bank Linkage Programme.<br />
However, between 1984 and 1985, MYRADA, a<br />
non-governmental organisation engaged in rural<br />
development and based in <strong>Karnataka</strong>, promoted<br />
several co-operative societies that were enabled<br />
to give loans to their members. Subsequently, the<br />
large co-operatives broke up into small groups,<br />
which were the genesis of the fi rst SHGs, referred<br />
to at that time as Credit Management Groups,<br />
with a focus on the management of credit. The<br />
concept of each member making a saving in the<br />
group soon followed, as also the establishment<br />
of a system of regular meetings, book keeping<br />
and records, and collective decision-making. A<br />
pilot study (Puhazhendi and Sai, 2000) gave<br />
NABARD the confi dence to mainstream the SHG-<br />
Bank Linkage Programme in 1996 as a normal<br />
lending activity. The programme then spread<br />
rapidly, if unevenly, across the country, making<br />
it by 2002, the largest microfi nance programme<br />
in the world.<br />
Thus, the history of SHG promotion started<br />
with NGOs taking the lead in the mid-1980s<br />
and the lead passing on to NABARD by the<br />
late 1980s. After the SHG-Bank Linkage<br />
Programme was launched in 1991-92, the very<br />
fi rst loans to SHGs in the country were given in<br />
Kolar district of <strong>Karnataka</strong>: by the Vysya Bank,<br />
290
Bangarpet branch to Venkateshwara Mahila<br />
Sangha of Muduguli on December 9, 1991 and<br />
by the Corporation Bank, Andersonpet Branch<br />
to Saraswathi Mahila Sangha of Boduguriki<br />
on January 30, 1992. NABARD upscaled the<br />
programme in <strong>Karnataka</strong> by initiating a series<br />
of measures that included training of NGO<br />
and bank staff, convening regular meetings of<br />
all intervening agencies, analysing reports and<br />
providing feedback for changes in operational<br />
systems to make them more user-friendly, and<br />
launching the fi rst RRB (Regional Rural Bank),<br />
the Cauvery Grameena Bank of Mysore district,<br />
as an SHG promoting institution (1994-95). In<br />
the 1990s, IFAD, with World Bank collaboration<br />
and in partnership with the Government of India<br />
and six state governments, including <strong>Karnataka</strong>,<br />
launched a similar programme titled Swashakti.<br />
This experience encouraged <strong>Karnataka</strong> to launch<br />
a state-wide programme called Stree Shakti,<br />
(Women’s Power) based on the SHG strategy.<br />
Together, the initiatives of the various stakeholders,<br />
(the government, NGOs, banks) increased SHG<br />
coverage in <strong>Karnataka</strong> signifi cantly. At recent<br />
estimates, 40,295 anganwadi workers (of the<br />
Department of Women and Child <strong>Development</strong>),<br />
561 NGOs, 8 regional rural banks, 20 District<br />
Central Co-operative Banks, and 2 commercial<br />
banks are engaged in SHG promotion. Together<br />
they are estimated to have facilitated the creation<br />
of close to 1,95,000 SHGs in <strong>Karnataka</strong>. 1<br />
Outreach<br />
Today there is scarcely a village in <strong>Karnataka</strong><br />
where an SHG has not been facilitated. The<br />
state government is now the single largest SHG<br />
promoting institution. It is important also to note<br />
that even in the many government programmes<br />
that are not primarily SHG-oriented, SHGs are<br />
still included and budgeted for, mainly to engage<br />
and empower the poor and introduce a measure<br />
1<br />
Estimated on the basis of a note circulated by NABARD at a<br />
meeting called in 2004 at Bangalore of bankers, Government<br />
(Women and Child <strong>Development</strong> Department) and NGOs in<br />
<strong>Karnataka</strong> to review the SHG-Bank Linkage Programme and fi x<br />
targets for 2004-05. The number of 1,95,000 SHGs also tallies<br />
well with the fi gures obtained from the various agencies listed<br />
in Table 14.1.<br />
of equity, where otherwise, the programme may<br />
have remained ‘poor-neutral’. Table 14.1 gives an<br />
indicative list of interveners and the SHGs they<br />
have promoted.<br />
Broadly, therefore, there are three categories of<br />
institutions promoting SHGs: the government,<br />
fi nancial institutions and NGOs. The promoting<br />
institution plays a signifi cant role in the way an<br />
SHG develops and functions. The Stree Shakti<br />
programme, anchored by the Department of<br />
Women and Child <strong>Development</strong>, attempts to<br />
focus the attention of members on curbing<br />
domestic violence against women, promoting girl<br />
child education, preventing child marriage, etc.<br />
Up-scaling the number of SHGs to 100,000<br />
meant that all activities did not take place as<br />
scheduled due to budgetary constraints. SHGs<br />
promoted by fi nancial institutions are normally<br />
viewed as potential sources of clients. They tend<br />
to focus on credit provision, and investment in the<br />
institutional capacity building of SHGs is limited.<br />
These SHGs hardly ever move into social activism.<br />
Of the three broad categories of SHG-promoting<br />
institutions mentioned above, fi nancial institutions<br />
may have the smallest numbers, but in a way they<br />
are the most signifi cant since these initiatives<br />
of bankers to become directly involved in SHG<br />
formation have helped to mainstream the SHG<br />
strategy in their priority sector portfolio and to<br />
make it a normal lending activity of banks. SHGs<br />
promoted by NGOs tend to promote the priorities<br />
and agenda of the NGOs concerned and to refl ect<br />
the organisational and fi nancial strengths as well<br />
as weaknesses of the NGOs. Thus, at least in<br />
the fi rst two years of formation, they may range<br />
between two ends of the spectrum: the one<br />
determinedly focussed on altering power balances<br />
in favour of the poor (mainly poor women) without<br />
much attention to strengthening SHG institutional<br />
systems and the other focussed on building up the<br />
SHG as a professionally managed institution with<br />
little or no attempt made to infl uence social issues<br />
on which members could focus, leaving it to the<br />
discretion of members themselves.<br />
However, though there may be one institution<br />
taking the lead in SHG promotion in a given<br />
context, yet in most cases other institutions are<br />
<strong>Karnataka</strong> <strong>Human</strong> <strong>Development</strong> <strong>Report</strong> <strong>2005</strong><br />
Broadly, therefore, there<br />
are three categories of<br />
institutions promoting<br />
SHGs: the government,<br />
financial institutions and<br />
NGOs. The promoting<br />
institution plays a<br />
significant role in the<br />
way an SHG develops and<br />
functions.<br />
291
Self-Help Groups: Empowerment Through Participation<br />
Programme<br />
Swashakti<br />
Implemented by the <strong>Karnataka</strong> State Women’s<br />
<strong>Development</strong> Corporation with IFAD-World Bank<br />
assistance.<br />
Stree Shakti<br />
Implemented by the state government under the<br />
Department of Women and Child <strong>Development</strong>.<br />
SUJALA<br />
Implemented by the Department of Watershed<br />
<strong>Development</strong> with World Bank assistance.<br />
KAWAD<br />
Implemented by the <strong>Karnataka</strong> Watershed<br />
<strong>Development</strong> Society with DFID assistance.<br />
Drought Prone Areas Programme (DPAP),<br />
Desert <strong>Development</strong> Programme (DDP),<br />
Integrated Watershed <strong>Development</strong><br />
Programme (IWDP), Western Ghats<br />
<strong>Development</strong> Programme (WGDP), National<br />
Wastelands <strong>Development</strong> Programme<br />
(NWDP)<br />
These programmes are managed by the Watershed<br />
<strong>Development</strong> Department and implemented<br />
through the zilla panchayats. Funds are provided<br />
by the state and Central Government.<br />
<strong>Karnataka</strong> Urban <strong>Development</strong> and<br />
Coastal Environment Management Project<br />
(KUDCEMP)<br />
Implemented through <strong>Karnataka</strong> Urban<br />
Infrastructure <strong>Development</strong> and Finance<br />
Corporation (KUIDFC) with Asian <strong>Development</strong><br />
Bank assistance.<br />
TABLE 14.1<br />
Some SHG-promoting institutions<br />
No. of SHGs<br />
SHGs facilitated by<br />
promoted<br />
2139 NGO partners of the <strong>Karnataka</strong><br />
State Women’s <strong>Development</strong><br />
Corporation.<br />
100000 Mainly anganwadi workers of the<br />
Department of Women and Child<br />
<strong>Development</strong>. Some NGOs now<br />
being involved.<br />
1171 NGO partners of the Watershed<br />
<strong>Development</strong> Department.<br />
1013 NGO partners of the <strong>Karnataka</strong><br />
Watershed <strong>Development</strong> Society.<br />
DPAP – 4795<br />
DDP - 3220<br />
IWDP – 1290<br />
WGDP – 1075<br />
NWDP – 2840<br />
Department staff and NGOs.<br />
3200 Municipal Corporation staff<br />
of selected towns along with<br />
NGO partners and promoters of<br />
<strong>Karnataka</strong> Urban Infrastructure<br />
<strong>Development</strong> and Finance<br />
Corporation.<br />
Programme focus<br />
Empowerment of women. No credit or<br />
subsidy component. Emphasis on training for<br />
self-development.<br />
Empowerment of women through savings<br />
and micro-credit, social awareness. Adequate<br />
budgetary provision for training. Grant of<br />
Rs.5000 per group as revolving fund.<br />
The programme focus is on watershed<br />
development. SHGs are included to help the<br />
poor and the landless as a means to bring<br />
in a measure of equity into the programme.<br />
Budgetary provision made for SHG capacity<br />
building and to take up income generating<br />
activities.<br />
The programme focus is on watershed<br />
development. SHGs are included to help the<br />
poor and the landless as a means to bring<br />
in a measure of equity into the programme.<br />
Budget is provided for training and working<br />
capital support (Rs.10,000 per group) to<br />
‘community organisations’ (not specifi cally<br />
SHGs) but effi ciency of use has varied with<br />
implementers and quality of monitoring.<br />
The programme focus is primarily on sanitation<br />
and solid waste disposal in urbanising areas.<br />
SHGs are included to ensure that the poor<br />
are involved both in delivering the planned<br />
services and in benefi ting from them.<br />
(Table 14.1 Contd...)<br />
292
<strong>Karnataka</strong> <strong>Human</strong> <strong>Development</strong> <strong>Report</strong> <strong>2005</strong><br />
(Table 14.1 Contd...)<br />
Programme<br />
Swarna Jayanti Shahari Rozgar Yojana<br />
(SJSRY)<br />
Bank loans to SHGs accompanied by state and<br />
Central Govt. subsidy.<br />
Swarnajayanti Gram Swarozgar Yojana<br />
(SGSY)<br />
SHGs promoted by Regional Rural Banks<br />
with NABARD support for capacity building<br />
SHGs promoted by Commercial Banks<br />
with NABARD support for capacity building<br />
SHGs promoted by DCC Banks and<br />
Co-operatives<br />
SHGs promoted by Non-Government<br />
Organisations<br />
No. of SHGs<br />
promoted<br />
6896<br />
Not separately<br />
calculated since<br />
SHGs formed under<br />
all programmes<br />
in rural areas<br />
are included for<br />
support.<br />
SHGs facilitated by<br />
Staff of Town, Municipal and City<br />
Corporations with or without the<br />
involvement of NGOs.<br />
No separate cadres engaged to<br />
form groups. SHGs formed under<br />
all programme are eligible for<br />
support depending on annual<br />
budgetary quotas.<br />
3044 The staff of the Regional Rural<br />
Banks.<br />
21 The staff of banks concerned.<br />
34881 The staff of the DCC Banks/<br />
Co-operatives concerned.<br />
30000<br />
(approximate<br />
number)<br />
Total SHGs promoted 195585<br />
The staff of the NGOs concerned.<br />
Since NGOs are also involved in<br />
several of the programmes listed<br />
above, the number of SHGs given<br />
here excludes the numbers already<br />
given above.<br />
Programme focus<br />
The programme focus is on using the SHG<br />
approach for poverty reduction through<br />
channelling of bank loans and government<br />
subsidies. Budget is provided for training<br />
and working capital support to SHGs but<br />
effi ciency of use varies with implementers.<br />
Focus is on building up priority sector<br />
clientele for SHG-Bank linkage. Budgets<br />
for SHG capacity building vary from bank to<br />
bank. Effi ciency of budget use can even vary<br />
from branch to branch of the same bank.<br />
The focus is on empowerment of women<br />
but the extent to which this is understood<br />
and actually facilitated varies very widely<br />
between NGOs. Different levels of budgetary<br />
constraints also infl uence the quality of<br />
work.<br />
Source : Estimated on the basis of a note circulated by NABARD at a meeting of bankers, Government (Women and Child <strong>Development</strong> Department) and NGOs in <strong>Karnataka</strong> called in 2004<br />
at Bangalore to review the SHG-Bank Linkage Programme and fi x targets for 2004-05.<br />
brought in as the programme progresses. For<br />
example, both the government and the fi nancial<br />
institutions tend to involve NGOs in the training of<br />
SHGs. NGOs and the government encourage their<br />
groups to link with fi nancial institutions, and NGOs<br />
learn both from the government and from fi nancial<br />
institutions the formal systems of reporting and<br />
fi nancial management. Such interactions, coupled<br />
with the dynamic nature of the SHGs themselves,<br />
give reasons to believe that even if the promoting<br />
institutions do not share the same level of skills,<br />
time, staff or budgets for SHG promotion, and even<br />
if SHG promotion is not the primary objective of<br />
all such institutions, they tend to develop the same<br />
understanding of what an SHG is and what it can<br />
achieve as a civil society organisation.<br />
Towards human development<br />
The SHGs, as originally conceived, are not just<br />
groups that promote savings and provide credit,<br />
they are intended to become institutions that<br />
promote human development and empower<br />
their members. The major objectives of building<br />
participatory institutions of the poor such as SHGs<br />
is to provide the members with an opportunity<br />
and the space to develop a vision/mission, to<br />
develop and maintain organisational and fi nancial<br />
management systems, to grow in confi dence and<br />
skills to manage their lives and promote their<br />
interests in the private and public domains, to<br />
establish the linkages required for an institution<br />
to function effectively and sustainably, and to<br />
support its members to become agents of social<br />
change. There is adequate evidence to substantiate<br />
the claim that in this process, the members of the<br />
SHGs build new relationships, which are more<br />
balanced in terms of gender and decision-making<br />
and more equitable in resource distribution,<br />
within the group, in the home and with other<br />
institutions and groups in society. Institutions, by<br />
293
Self-Help Groups: Empowerment Through Participation<br />
BOX 14.2<br />
Promoting good quality SHGs through SPIN<br />
SPIN, or Self-help Promoting Institutions Network is a network of NGOs, Government and Banks<br />
started in Chitradurga district in 1999. Though each member institution in the network may<br />
have an independent agenda, their coming together in SPIN is specifi cally for the promotion of<br />
good quality SHGs. Their commitment is (i) to ensure that common minimum quality standards<br />
are maintained in their SHGs; (ii) all SHG related data is shared between member organisations<br />
and used to create a district level data base; (iii) programme related information and capacity<br />
building inputs are shared between members in the spirit of ‘give and take’.<br />
BOX 14.3<br />
Perspectives of poverty<br />
themselves, do not empower the poor unless they<br />
are participatory like the SHGs (in which all the<br />
members are united by a degree of homogeneity<br />
and affi nity, all are involved in decision-making<br />
and in establishing the rules that govern their<br />
behaviour) and adequately provided with<br />
capacity-building support. In fact, institutions have<br />
the potential to be disempowering, if their structure<br />
is inappropriate and imposed from outside and<br />
their internal processes are hierarchical or elitist;<br />
in such cases they refl ect and reinforce the existing<br />
class/caste/gender relations.<br />
A major assumption on which the SHG strategy is<br />
based is that participatory institutions of the poor<br />
provide them with the space to develop skills and<br />
confi dence and to mobilise resources. Good SHGs<br />
have been known to provide the impetus by which<br />
people can change the iniquitous power relations<br />
which have been keeping them both in poverty and<br />
If human development is the ability to lead a long, healthy and creative life with freedom, selfrespect<br />
and the respect of others, then in turn this requires that (1) the income; (2) the basic<br />
needs perspectives of poverty are met – both of these perspectives will be referred to as the<br />
livelihood needs of the poor; and (3) that the social perspectives are achieved.<br />
1. Income perspective of poverty:<br />
A person is poor if his/her income is below the poverty line.<br />
2. Basic needs perspective of poverty:<br />
A person is poor when he/she is deprived of material requirements for fulfi lling minimum human<br />
needs (food, shelter, clothing, health, education, employment, and participation).<br />
3. Social perspective of poverty:<br />
A person is poor when he/she lacks the ability and opportunity to function at a minimal acceptable<br />
level in society.<br />
subjugation. In a society where gender, class and<br />
caste play a major role in supporting exclusivity<br />
and extraction of surplus, it is not enough to teach<br />
people to fi sh, if they cannot reach the river. The<br />
hurdles in the way have more to do with oppressive<br />
socio-economic relations and structures rather<br />
than with skills. Building people’s institutions,<br />
therefore, should be the primary objective of<br />
SHGs if they wish to transform themselves into<br />
civil society organisations.<br />
The most visible manifestations of success are<br />
fi nancial. Attempts have also been made to assess<br />
the degree of empowerment of SHG members,<br />
though not as regularly and uniformly as fi nancial<br />
information fl ows. A majority of the SHG promoting<br />
institutions have not created reliable databases<br />
or promoted record keeping and documentation<br />
systems that enable good quality data related to<br />
empowerment to be accessed, consolidated and<br />
analysed. ‘Empowerment’ is such a misunderstood<br />
term that its meaning is trivialised to the extent<br />
that merely giving a small loan ends up being<br />
seen as gender empowerment.<br />
Theoretically and ideally, SHGs, both of men and<br />
women, promote the following features which<br />
could have an impact on enhancing human<br />
development and empowerment: (i) a habit<br />
of regular savings; (ii) weekly meetings with a<br />
clear agenda and conducted in a participative<br />
way, where decisions are taken by the groups to<br />
give loans to its members regarding the purpose,<br />
size and schedule of repayments; (iii) a culture<br />
of sanctions for wilful default; (iv) awareness of,<br />
and involvement in, credit plus issues related to<br />
equity, gender and rights including the creation<br />
of a culture that reduces violence in the home;<br />
(v) the ability and willingness to carry out<br />
periodically a participatory self-assessment; and<br />
fi nally, (vi) a culture of learning. Together these<br />
contribute to, and enhance, the management<br />
skills and the confi dence of the SHG members<br />
while increasing their capacity to meet their<br />
livelihood needs.<br />
The following sections will draw from studies,<br />
which indicate the impact resulting from the<br />
experience that the poor have in managing SHGs.<br />
294
<strong>Karnataka</strong> <strong>Human</strong> <strong>Development</strong> <strong>Report</strong> <strong>2005</strong><br />
The impact will focus on issues related to their<br />
ability to cope with their livelihood needs, which<br />
include incomes and basic needs, as well as with<br />
the impact on gender relations in the home and<br />
on changes in society.<br />
The livelihood needs of the<br />
poor – The income and basic<br />
needs perspective of poverty<br />
Savings and Credit<br />
Cultivating the habit of regular savings and<br />
the ability to access them when required<br />
through credit not only reduces signifi cantly the<br />
vulnerability of the livelihood base of the poor<br />
and their dependence, it also enhances human<br />
development. It enables them to borrow for<br />
urgent needs instead of going to moneylender,<br />
which increases their dependency since he/she<br />
is often the one who provides them with labour<br />
employment at low wages. This, in turn, gives<br />
them a degree of freedom to bargain for better<br />
wages and working conditions and enables<br />
them to build a capital base which, hitherto,<br />
was impossible since the exorbitant interest<br />
rates demanded by moneylenders siphoned off<br />
all surplus. The ‘feel good’ factor is evident in a<br />
group that has been able to save enough in the<br />
group to meet with urgent needs. However, the<br />
members of the group need to go further if they<br />
are to justify the claim that savings empower<br />
people. They need to ensure that savings and<br />
credit are managed effectively.<br />
When asked why they joined the SHG, 88 per<br />
cent of SHG members interviewed said that the<br />
primary reason for their joining was that it gave<br />
them the opportunity and motivation to save<br />
money regularly (NABARD 2002). 2<br />
This is a signifi cant piece of information, making<br />
it possible to appreciate the fi gures given in<br />
2<br />
Page 22, Table 3.9, Impact of Self-Help Groups (Group<br />
Processes) on the Social/Empowerment Status of Women<br />
Members in Southern India, commissioned jointly by MYRADA<br />
and NABARD, designed by MYRADA and conducted by A.C.<br />
Neilson ORG-MARG (SRC), published by NABARD in November<br />
2002 and released at the Seminar on SHG-Bank Linkage<br />
organised by NABARD at New Delhi on 25th – 26th November<br />
2002 to commemorate 10 years of SHG-Bank Linkage.<br />
Table 14.2 below as an indicator of the SHG’s<br />
role in building fi nancial buffers for members to<br />
overcome dependence and vulnerability.<br />
This represents a huge sum of money by any<br />
standard, over which the members (95 per cent<br />
of whom are women) have access and control.<br />
Studies made by MYRADA 3 have shown that in<br />
remote villages where the SHGs meet about 25<br />
per cent of the credit requirement, the interest<br />
rates of private moneylenders fall considerably<br />
– often by 50 per cent - and moneylenders from<br />
outside the village stop coming since the cost<br />
of transactions cannot be met with the lower<br />
interest rates.<br />
A study of 64 SHGs in Chitradurga district<br />
(Berg et al, 1998) indicates that the average<br />
savings of members in the SHG increases as their<br />
membership matures.<br />
Loans to members<br />
Savings made by members are pooled and<br />
loaned to one another. SHG members determine<br />
the terms and conditions (these differ from SHG<br />
3<br />
Internal (unpublished) studies conducted by MYRADA in<br />
2003 covering selected villages in Chamarajnagar, Mysore,<br />
Chitradurga and Erode districts to estimate the impact of SHGs<br />
on the existing moneylenders servicing the areas.<br />
Cultivating the habit<br />
of regular savings and<br />
the ability to access<br />
them when required<br />
through credit not only<br />
reduces significantly<br />
the vulnerability of the<br />
livelihood base of the poor<br />
and their dependence,<br />
it also enhances human<br />
development.<br />
TABLE 14.2<br />
Savings by SHG members in selected major programmes<br />
(Rs. crore)<br />
Promoting Institution<br />
<strong>Karnataka</strong> Watershed <strong>Development</strong> (KAWAD)<br />
Society, through partner NGOs (upto February<br />
2004)<br />
Swashakti Programme (KSWDC, through partner<br />
NGOs) (upto December 2003)<br />
Stree Shakti Programme (Department of Women<br />
and Child <strong>Development</strong>, through anganwadi staff)<br />
(upto March 2004)<br />
MYRADA (NGO directly promoting SHGs) (upto<br />
December 2003)<br />
Total SHGs<br />
promoted<br />
Total<br />
members<br />
enrolled<br />
Total savings<br />
mobilised in<br />
SHGs<br />
1013 16012 2.53<br />
2139 38346 4.76<br />
100000 1479794 179.60<br />
8359 130672 27.77<br />
Total 111511 1664824 214.66<br />
Source: <strong>Report</strong>s of KAWAD, KSWDC, Women and Child <strong>Development</strong> Department and MYRADA.<br />
295
Self-Help Groups: Empowerment Through Participation<br />
BOX 14.4<br />
Savings<br />
Where the poor are concerned, savings are made, not out of a surplus of income, but by cutting<br />
down some expenditure somewhere. In theory income minus expenditure = savings; in the case<br />
of the poor, the reality is income minus savings = expenditure. Savings are an essential feature<br />
of all SHGs, creating pools of funds for loaning to members and also serving as the basis to<br />
attract additional loan funds from fi nancial institutions. Several studies have shown that savings<br />
reduce their vulnerability since they provide them with credit during periods when income is<br />
low. Such periods occur just before the onset of monsoons. It is during these periods that they<br />
have to depend on moneylenders whose terms and conditions ensure that they are in perpetual<br />
debt, unable to accumulate capital and in many cases lose their pledged lands or assets. Rural<br />
people generally do not have steady monthly incomes. The harvest, if good, brings in a lump<br />
sum income which they tend to spend without saving for the lean periods because they have no<br />
place to save which is ‘friendly’ and which they can access easily, other than converting money<br />
into household assets.<br />
TABLE 14.3<br />
Savings of SHGs<br />
Age of SHGs 1 Year 3 Years 5 years<br />
Average monthly savings in kind 250 800 750<br />
Average monthly fi nancial savings 175 175 375<br />
Total average monthly savings 425 975 1125<br />
(Rupees)<br />
Source: Berg Christian, Bredenbeck Kirsten, Schurmann Anke, Shanzick Julia and Vanekar Christiaine (1998), Humboldt<br />
Universitat zu Berlin, 1998.<br />
to SHG). Loans are provided for all purposes<br />
without making the traditional distinction<br />
between ‘consumption’ and ‘income generation’.<br />
An example of the variety of purposes is given in<br />
Table 14.5. The SHG model provides its members<br />
with the space and fl exibility to make decisions<br />
that are appropriate to each situation. Only private<br />
moneylenders lend for such a variety of purposes<br />
with minimum fuss and paper work; all fi nancial<br />
institutions and government schemes lend only<br />
for ‘productive’ purposes. But it is the ‘life events’<br />
and emergencies that drive the poor to debt traps.<br />
It leads also to the diversion of loans taken from<br />
formal organisations/government into consumption<br />
loans, which they are unable to repay.<br />
It must be noted, that apart from their savings,<br />
SHG members also credit all the interest<br />
earned on loans to the group’s common fund.<br />
Unfortunately data on interest earned by the<br />
SHGs is not easy to access from any of the<br />
major government sponsored programmes. Data<br />
from MYRADA’s projects however is indicative.<br />
The 8,359 SHGs in MYRADA have earned a<br />
total of Rs.17.1 crore (Rs.171 million) through<br />
interest, which remains in the common fund of<br />
the groups. This is almost two-thirds of their total<br />
savings of Rs.27.7 crore (Rs.277 million). This<br />
amount from interest adds signifi cantly to their<br />
‘own’ funds and is a major indicator of how well<br />
the group is functioning, fi nancially, as well as of<br />
its level of self-reliance.<br />
Promoting institution<br />
<strong>Karnataka</strong> Watershed <strong>Development</strong> (KAWAD) Society, through<br />
partner NGOs (upto February 2004)<br />
Swashakti Programme (KSWDC, through partner NGOs)<br />
(upto December 2003)<br />
Stree Shakti Programme (Department of Women and Child<br />
<strong>Development</strong>, through Anganwadi Staff) (upto March 2004)<br />
TABLE 14.4<br />
Loans given by selected SHGs to their members<br />
Total SHGs<br />
promoted<br />
Total members<br />
enrolled<br />
Total loans given<br />
(Rs. crore)<br />
Total amount<br />
loaned<br />
1013 16012 51598 14.66<br />
2139 38346 73542 13.36<br />
100000 1479794 Data not collected 380.79<br />
MYRADA (NGO directly promoting SHGs) (upto December 2004) 8359 130672 796780 183.45<br />
Grand total 111511 1664824 921920 592.26<br />
Sources: <strong>Report</strong>s of KAWAD, KSWDC, Women and Child <strong>Development</strong> Department and MYRADA.<br />
296
TABLE 14.5<br />
Pattern of lending<br />
<strong>Karnataka</strong> <strong>Human</strong> <strong>Development</strong> <strong>Report</strong> <strong>2005</strong><br />
(Rupees)<br />
Sl.<br />
No.<br />
Item No. of loans Amount<br />
loaned<br />
Amount<br />
recovered<br />
Balance<br />
outstanding<br />
Amount<br />
overdue<br />
1 Clothing 1366 528692 238479 290213 106<br />
2 Education 3945 4261683 2780085 1481598 17474<br />
3 Food 40354 65099160 44786373 20312787 17602<br />
4 Health 8012 10362055 7057492 3304564 590<br />
5 Repaid to moneylender 1203 3582419 2196208 1386211 0<br />
6 Socio-religious ceremonies 3659 8824255 5674839 3149416 38579<br />
7 Travel 689 307762 158043 149720 0<br />
8 Crop loan 26842 45683839 31569955 14113884 1814<br />
9 Equipment (agriculture) 298 222495 134246 88250 14023<br />
10 Irrigation 12 137348 18367 118981 10265<br />
11 Land development 466 1245006 705603 539404 17820<br />
12 Land release/purchase 442 2492261 1451745 1040516 102466<br />
13 Bullock 761 3388875 1655596 1733280 29144<br />
14 Cow/buffalo 2655 13479698 6452113 7027586 36256<br />
15 Feed treatment 19 39039 22382 16657 (-) 6707<br />
16 Infrastructure (sheds, carts, etc.) 173 280439 111894 168545 42714<br />
17 Poultry 17 19210 7940 11270 0<br />
18 Piggery 15 22500 1660 20840 6860<br />
19 Sheep/goat 443 1698036 453646 1244390 68135<br />
20 Bee-keeping 16 19500 19500 0 0<br />
21 Cottage industry 294 656344 326822 329522 71025<br />
22 Petty business 12574 41468598 28702603 12765995 82118<br />
23 Sericulture 123 184120 42423 141697 (-) 1780<br />
24 House construction 311 1114760 591810 522950 10745<br />
25 House electrifi cation 20 26700 15187 11513 1500<br />
26 House repair 1338 4897626 2423549 2474077 13980<br />
27 Low cost latrine 267 256700 165123 91577 0<br />
28 Fishery 44 255133 103003 152130 0<br />
29 Release of bonded labour 2 5000 0 5000 0<br />
30 Paying mortgage on house 4 16500 2900 13600 0<br />
Total 106364 210575755 137869584 72706172 574729<br />
Source: MYRADA’s HD Kote Project, Mysore district as on December 31, 2002.<br />
297
Self-Help Groups: Empowerment Through Participation<br />
It would be misleading to estimate per capita loans<br />
from the above fi gures since the groups vary widely<br />
in age from over 10 years to less than six months.<br />
Sizes of loans given by SHGs to members range from<br />
less than Rs.500 to over Rs.30,000, depending<br />
on the age and capital base of each group. Loan<br />
repayment periods range from under a month to<br />
over two years, and the interest charged by the<br />
groups to their members could range from 12 per<br />
cent to 36 per cent per annum. In fact, the interest<br />
rates charged by SHGs come in for some criticism<br />
but since members decide them collectively, it is<br />
obvious that the rates are not regarded by members<br />
as being exorbitantly high.<br />
The average amount loaned annually under the<br />
Stree Shakti programme alone, which has mobilised<br />
loans from banks for the last three years, works out<br />
to around Rs.106 crore; this fi gure is at least three<br />
times larger than the loans given annually under<br />
the erstwhile IRDP. The total number of loans that<br />
SHGs advanced to members is 9,21,920. This could<br />
never have been achieved by the formal fi nancial<br />
system where one bank branch sanctions about 30<br />
loans in the priority sector.<br />
The wide variety of purposes for which loans<br />
are advanced and the ability to ensure a<br />
high rate of recovery indicates that where the<br />
microfi nance model places the responsibility of<br />
decision-making squarely on the SHG, members<br />
are able to manage the SHG as a productive,<br />
responsive organisation.<br />
An analysis of the data indicates that the SHG<br />
members take several loans over a period of three<br />
to fi ve years. This is the only way that they are able<br />
to move out of poverty. A single dose or a one-time<br />
infusion of subsidised credit does not signifi cantly<br />
raise them above the poverty line. The wide variety<br />
of purposes and the difference in the sizes of loans<br />
for similar purposes show that the SHGs do not<br />
have fi xed and standardised patterns of lending<br />
and are able to adjust to each member’s needs.<br />
A review of the trends in lending indicates that<br />
during the fi rst two years, SHG members take<br />
a large number of loans for clothing, education,<br />
food, health, to repay money lenders, and for<br />
socio-religious ceremonies. These are commonly<br />
known as ‘consumption loans’. The trend in<br />
loans also indicates that loans for trade, cottage<br />
industries, animal husbandry and agriculture<br />
increase in number and size from the third year<br />
onwards after people have acquired a degree of<br />
independence and confi dence that their investment<br />
in assets will be safe and productive.<br />
The Berg study referred to earlier estimates that in<br />
the fi rst year 25 per cent of the SHG members are<br />
above the poverty line; in three years, this number<br />
increases to 70 per cent and in fi ve years, to 86<br />
per cent as Table 14.6 indicates. About fi ve to ten<br />
per cent of the SHG members, who join the SHG,<br />
are just above the poverty line before they join,<br />
though they are closely united by affi nity with the<br />
others; in the fi rst year about 10 per cent to 15<br />
per cent make use of the opportunities provided<br />
by the SHG to cross the poverty line, but in most<br />
cases they fall below after six months or so, and<br />
then rise again.<br />
This trend is also confi rmed by another study<br />
commissioned by NABARD/MYRADA (2002)<br />
as the Table 14.7 indicates.<br />
SHGs and financial institutions<br />
Increased lending has been made possible<br />
through accessing loan funds from fi nancial<br />
institutions, after the SHG – Bank Linkage<br />
Programme was launched in 1991-92. Under<br />
this programme, there are no subsidies for the<br />
asset, yet it has grown, particularly after 1999,<br />
and is today the largest microfi nance programme<br />
in the world. The repayment rates average around<br />
95 per cent.<br />
The SHG members consider their ability to raise<br />
loans from banks and their ability to negotiate with<br />
banks directly as a major indicator of increased levels<br />
of confi dence and self esteem 4 . This provides some<br />
insights into SHG members’ ability to access fi nance<br />
from mainstream institutions. Many members say<br />
4<br />
Social Intermediation Study sponsored by Aga Khan Foundation<br />
and Canadian International <strong>Development</strong> Agency, Page 12<br />
of unpublished fi nal draft of MYRADA segment, Sue Szabo<br />
(supported by Mamtha Krishna and Madhuri Partha Sarathy).<br />
298
<strong>Karnataka</strong> <strong>Human</strong> <strong>Development</strong> <strong>Report</strong> <strong>2005</strong><br />
that they learnt to sign after joining the group.<br />
Although this might seem like a minor achievement<br />
to most of us, to SHG members, it seems to be a<br />
way of gaining acceptance in the ‘mainstream’,<br />
and a source of pride. Many members spoke of<br />
how they were previously ashamed to conduct<br />
bank transactions, as they used thumb impressions<br />
in place of signatures. Only after learning to sign<br />
were they comfortable about going to a bank. It<br />
was after joining the SHG, that they had gained the<br />
confi dence of conducting bank transactions on their<br />
own, and approaching bank offi cials for loans.<br />
The credit funds provided under the SHG-Bank<br />
Linkage Programme in <strong>Karnataka</strong> compare<br />
favourably with the credit disbursed to SHGs<br />
in <strong>Karnataka</strong> under the Swarna Jayanthi Gram<br />
Swarozgar Yojana as shown in Table 14.9. It<br />
may be recalled that all the previous loan-cumsubsidy<br />
programmes of the Central government<br />
for the rural poor, including IRDP and DWACRA,<br />
have been merged under SGSY. The SGSY<br />
programme is mainly intended to provide<br />
loans to groups. Due to various compulsions,<br />
individual benefi ciaries are also being included<br />
in large numbers but they are not considered<br />
the primary target. Hence, Table 14.9 is of loans<br />
given to SHGs only.<br />
Social perspectives of poverty<br />
Data on social development is far more diffi cult to<br />
put together because of the varied ways in which<br />
BOX 14.5<br />
Loan cycles<br />
People need several cycles of loan to overcome poverty and that some of these loans may<br />
be ‘non-productive’ in nature but are an essential part of the process to climb up the socioeconomic<br />
ladder. Thus, if a leaking roof is not repaired the income earning produce stored<br />
under it will be destroyed; if a broken leg is not treated immediately, the labourer may never<br />
be able to work productively again; if land pledged to a moneylender is not redeemed, the<br />
land itself may be lost forever; if a social event is not appropriately celebrated, friends and<br />
relatives may become unavailable in times of need. Similarly, a person may not be able to<br />
manage a larger programme right from the beginning but if her programme starts small and<br />
slowly graduates in size, this growth is steered by her and she can manage it much better.<br />
The varieties of purposes for which loans are given by SHGs indicate that the SHGs are able<br />
to meet this need.<br />
information is collected and the relatively fewer<br />
efforts made to present quality information along<br />
standard parameters in terms of quantifi ed data.<br />
The skill levels and time required to undertake<br />
such research also makes it far more expensive<br />
compared to consolidating fi nancial information.<br />
Nevertheless, an attempt will be made to assess<br />
the impact on SHG members with respect to<br />
their ability to introduce changes in gender<br />
relations in the home and in society as a result<br />
of their experience in a well-functioning SHG.<br />
The CATAD study represents one effort made<br />
to quantify progress in social development and<br />
empowerment; Tables 14.10 - 14.13 indicate<br />
signifi cant progress in these domains.<br />
TABLE 14.6<br />
Percentage of households above the poverty line<br />
Age of SHGs 1 year 3 years 5 years<br />
Percentage of households above the poverty line 25 70 86<br />
Source: SHG-Bank Linkage programme in <strong>Karnataka</strong>, NABARD, 2004.<br />
TABLE 14.7<br />
Financial status of SHG members<br />
Change in personal financial status after 3 years Number of SHG members Percentage<br />
It has improved 114 89.1<br />
It has remained the same 14 10.9<br />
Can’t say 0 0<br />
Total 128 100<br />
Source: SHG-Bank Linkage programme in <strong>Karnataka</strong>, NABARD, 2004.<br />
299
Self-Help Groups: Empowerment Through Participation<br />
BOX 14.6<br />
Profiles in empowerment<br />
Lakkavva Ningappa Heggade is from a poor family and joined the Shri Sharada Stree Shakti group of Metaguda<br />
village, Mudhol taluk, Bagalkot district. She took a loan of Rs.1,000 from her group and bought a sheep, which<br />
gave birth. Soon after, she sold the sheep and lambs at a small profi t. She then added it to another loan of<br />
Rs.3,000 that she took from her group, and bought a cow. She sold milk and milk products to repay her loan. A<br />
third loan of Rs.5,000 enabled her to purchase a buffalo which she managed in the same way. She then took a<br />
loan of Rs.7,000 to buy a small house site. Her fi fth loan of Rs.8,000 was taken to release her father-in-law’s<br />
mortgaged lands and the sixth loan of Rs.6,000 helped her husband and father-in-law to re-start cultivation.<br />
She regularly repays all her loans and has become a model of how a poor woman can overcome poverty with<br />
planning and determination backed by SHG support.<br />
Sundramma, who has been an SHG member for fi ve years, lives with her husband and two children in Holalkere<br />
village of Chitradurga district. The family is landless and lives in a rented house, in front of which they have set<br />
up a small grocery shop. She and her husband also work as agricultural labourers. After six months of regular<br />
savings, Sundramma asked for, and got, a loan of Rs.5,000 from her group, to expand her shop. After repaying<br />
this loan, she took another of Rs.10,000 of which she used Rs.5,000 to improve her shop and Rs.5,000 to buy a<br />
cow. She then took a third loan to buy six sheep, which soon expanded to a fl ock of 12. She sold seven sheep for<br />
Rs.10,000, which she invested in a chit fund since she still owed some money to the SHG and was not yet eligible<br />
for a fourth loan. With the chit fund amount, she purchased a small house site and leased a two acre coconut plot<br />
for one year. Her husband started selling tender coconuts. By then, she had repaid her earlier SHG loan and got<br />
another loan of Rs.15,000, of which she used Rs. 5,000 to buy a buffalo, Rs.5,000 to further expand her shop,<br />
and Rs.5,000 to purchase wholesale bakery items that her husband then started selling, along with the tender<br />
coconuts. She continues to be a responsible SHG member and her family now has assets worth Rs.1 lakh.<br />
Sources: Stree Shakti case study, DWCD, 2004, MYRADA 2003.<br />
TABLE 14.8<br />
Loans by banks to SHGs under the SHG-Bank Linkage programme in<br />
<strong>Karnataka</strong><br />
Year<br />
Number of SHGs credit linked with<br />
formal financial institutions<br />
Amount loaned<br />
(Rs. lakh)<br />
1992-93 114 5.73<br />
1993-94 51 5.51<br />
1994-95 481 77.71<br />
1995-96 1460 145.08<br />
1996-97 760 159.12<br />
1997-98 1138 232.19<br />
1998-99 2002 429.86<br />
1999-2000 5018 1054.81<br />
2000-01 8009 1714.00<br />
2001-02 18413 3475.39<br />
2002-03 25146 7249.50<br />
2003-04 41688 13960.36<br />
Total 103866 28521.28<br />
Source: SHG-Bank Linkage Programme in <strong>Karnataka</strong>, NABARD, 2004.<br />
The study of 64 WSHGs selected three<br />
decision-making areas, all related<br />
to their husbands, in order to assess<br />
whether their experience in the SHGs<br />
had an impact on gender relations. These<br />
decision-making areas were (i) who decides on<br />
the purpose of loans in the home before the<br />
woman submits her request at the SHG meeting;<br />
(ii) who makes decisions about making changes<br />
to household infrastructure; and (iii) who makes<br />
decisions regarding the purchase of higher value<br />
household articles.<br />
In these three decision areas there is a signifi cant<br />
shift from a position where women were largely<br />
dominated to one where they have equal say or<br />
even where they take the lead. This progression<br />
can be attributed largely to two factors: (i)<br />
the money to implement many such decisions<br />
300
<strong>Karnataka</strong> <strong>Human</strong> <strong>Development</strong> <strong>Report</strong> <strong>2005</strong><br />
comes from SHGs and from the increased<br />
contribution of women to household income. As<br />
providers of funds the women are able to assert<br />
their right to infl uence the use of such funds;<br />
(ii) weekly engagement in SHG-related decisionmaking<br />
enables women to gain competence in<br />
decision-making, which includes presenting<br />
their side of the case coherently, reasonably and<br />
logically.<br />
The study then went on to enquire whether SHG<br />
members were able to play an infl uential role<br />
in community affairs. Table 14.11 indicates that<br />
they were increasingly able to do so.<br />
Year<br />
TABLE 14.9<br />
Credit disbursements to SHGs under SGSY and<br />
Bank Linkage Programmes<br />
Credit-cum-subsidy disbursed to<br />
SHGs under SGSY<br />
Credit disbursed by financial<br />
institutions<br />
2000-01 4187.91 1714.00<br />
2001-02 7114.86 3475.39<br />
2002-03 3688.87 7249.50<br />
Total 14991.64 12438.89<br />
Source:<br />
1. SHG-Bank Linkage Programme in <strong>Karnataka</strong>, NABARD, 2004.<br />
2. Ministry of Rural <strong>Development</strong> 2002-03 (upto February 2003) for SGSY.<br />
(Rs. lakh)<br />
TABLE 14.10<br />
Increased decision-making power of women SHG members in their households<br />
(Per cent)<br />
Decision areas Influence on decisions SHG age: < 1 year SHG age: 3 year old SHG age: > 5<br />
years<br />
Decision dominated by husband 30 13 12<br />
Decisions on purpose of<br />
loans<br />
Decision made jointly by SHG member and husband 51 53 42<br />
Decision dominated by SHG member 19 34 46<br />
Decisions on making<br />
Decision dominated by husband 36 4 7<br />
changes to household Decision made jointly by SHG member and husband 48 58 41<br />
infrastructure<br />
Decision dominated by SHG member 16 39 52<br />
Decision dominated by husband 26 17 14<br />
Decisions on higher value<br />
household purchases<br />
Decision made jointly by SHG member and husband 55 35 58<br />
Decision dominated by SHG member 19 48 28<br />
Source: SHG-Bank Linkage programme in <strong>Karnataka</strong>, NABARD, 2004, Pages 117-118.<br />
Community/Village<br />
affairs<br />
Maintenance of village<br />
infrastructure/utilities<br />
Intermediation to solve<br />
problems in<br />
community/village<br />
Representation of SHG<br />
members in local bodies<br />
TABLE 14.11<br />
Increased influence of SHGs over community/village issues<br />
Indicators of influence<br />
Percentage of SHGs that play roles in ensuring the<br />
maintenance of at least 2 utilities<br />
Percentage of SHGs that have been approached at<br />
least once by others in the village to solve problems<br />
Percentage of SHGs having elected members in at<br />
least two local bodies<br />
Source: SHG-Bank Linkage programme in <strong>Karnataka</strong>, NABARD, 2004, Pages 127-128.<br />
SHG age:<br />
< 1 year<br />
SHG age:<br />
3 year old<br />
30 65 90<br />
25 50 50<br />
10 25 55<br />
(Per cent)<br />
SHG age:<br />
> 5 years<br />
301
Self-Help Groups: Empowerment Through Participation<br />
TABLE 14.12<br />
Increased knowledge and awareness of SHG members<br />
(Per cent)<br />
Subjects SHG age category Good knowledge<br />
< 1 year 35<br />
Self-help group concept and approach 3 years old 65<br />
> 5 years 90<br />
< 1 year 40<br />
Banking knowledge<br />
3 years old 65<br />
> 5 years 95<br />
< 1 year 60<br />
Health and sanitation<br />
3 years old 85<br />
> 5 years 95<br />
< 1 year 50<br />
Family planning<br />
3 years old 75<br />
> 5 years 70<br />
< 1 year 45<br />
Income generating programmes<br />
3 years old 75<br />
> 5 years 95<br />
< 1 year 30<br />
Common properties management<br />
3 years old 25<br />
> 5 years 70<br />
Source: SHG-Bank Linkage programme in <strong>Karnataka</strong>, NABARD, 2004, Page 102, Table 3.<br />
BOX 14.7<br />
Leading to social and civic action<br />
Nayakanahatti, a large village of around 1,600 households in Challakere taluk of Chitradurga<br />
district has 20 SHGs with around 400 members. They have been federated into an Indira<br />
Mahila Kendra (IMK) under Indira Mahila Yojana, a programme of the Government of India.<br />
The IMK acts as an interface between the SHGs and government departments. The local fair<br />
price shop provoked frequent complaints regarding the sale of kerosene. An SHG member<br />
brought this up at an IMK meeting where other SHGs and government representatives were<br />
also present. There she discovered that not only was she entitled to a regular supply of her full<br />
monthly quota, she was also only expected to pay Rs.3.35 per litre and not the Rs.3.60 that<br />
she was being charged. At this meeting the SHGs decided to bring the matter to the notice of<br />
the Tehsildar. The Tehsildar issued a warning to the shop and for some months kerosene was<br />
supplied properly. A few months later, the shop manager reverted to his old ways. The matter<br />
was again discussed at an IMK meeting and all the SHGs decided to make a combined public<br />
protest outside the shop. Once again, the supply was resumed properly and the price was<br />
lowered. The members were pleased with the outcome but they also realised that one-time<br />
protests were not always enough and consumers should always be vigilant. The federation also<br />
acted as a catalyst for civic action.<br />
The training provided to the SHGs in the initial year<br />
and a half, focuses largely on institution building.<br />
Apart from this, members also experience an increase<br />
in social awareness through capacity building. The<br />
study also analysed whether members felt that<br />
their knowledge in these areas had increased and<br />
whether there was adequate recall. Table 14.12<br />
indicates that there were signifi cant increases in<br />
knowledge and recall as the groups progressed. In<br />
all cases it can be seen that members’ knowledge<br />
(and ability to recall this knowledge) increased with<br />
the length of time spent as a group member.<br />
A study commissioned by the Department of<br />
Women and Child <strong>Development</strong> (2003) 5 also<br />
yields some interesting data on social development<br />
aspects. This study covered a random selection<br />
of 65 Stree Shakti groups with 998 members<br />
across 13 districts of <strong>Karnataka</strong>. Members ranked<br />
(i) group unity and fellowship; (ii) awareness of<br />
issues; and (iii) self confi dence as the benefi ts<br />
they had derived from their SHGs. Improvement<br />
in social status, participation in community events<br />
or awareness of social problems were quite low on<br />
the list. What is signifi cant, however, despite some<br />
of the shortcomings of this programme, is that the<br />
process of development in a government delivered<br />
scheme was participatory and empowering.<br />
SHGs offer a successful and viable alternative to<br />
top-down approaches to programme formulation<br />
and implementation.<br />
Self-help groups, managed in an ideal<br />
scenario, provide a way of reducing poverty<br />
that simultaneously improves the capacity of<br />
its members on many levels. It is grounded in<br />
participatory decision-making, which creates a<br />
sense of ownership among members. This is very<br />
different from how many other poverty alleviation/<br />
human development programmes evolve with a<br />
top-down system of decision-making and distance<br />
from the people most affected by these decisions.<br />
For the purposes of presenting an alternative<br />
approach to sustainable development, this chapter<br />
Source: MYRADA (2002) and Stree Shakti Case Study, DWCD, 2004.<br />
5<br />
Page 19, Table-13, Stree Shakti Self-Help Groups – Basic<br />
Quality Assessment: A Study commissioned by the Department<br />
of Women and Child <strong>Development</strong>, <strong>Karnataka</strong>, and carried out<br />
by MYRADA in October 2003.<br />
302
<strong>Karnataka</strong> <strong>Human</strong> <strong>Development</strong> <strong>Report</strong> <strong>2005</strong><br />
BOX 14.8<br />
Dealing with dowry<br />
Beebamma is a member of a Stree Shakti SHG at Santhemagenahalli of Channapatna taluk, Bangalore<br />
Rural district. Her daughter was of marriageable age and she was worried that she would not be in a position<br />
to pay dowry. Her preoccupation with this issue prompted her to discuss it with the other members at an<br />
SHG meeting. The members understood her situation and decided to fi nd a solution. In this process they<br />
discovered that another member, Putteeramma, had a son of the right age. They proposed that the two women<br />
could negotiate an alliance. This worked out and soon the wedding was celebrated without any dowry being<br />
involved, only the wedding expenses for which Beebamma was granted a loan of Rs.5,000 from her SHG. The<br />
SHG members narrated this, not only as an example of helping one another, but also as a demonstration of the<br />
usefulness of open and meaningful discussions at SHG meetings. Dowry, it may be noted, is legally prohibited.<br />
The group acted responsibly to curb this evil.<br />
Source: MYRADA (2002) and Stree Shakti Case Study, DWCD, 2004.<br />
consciously focuses on success stories and best<br />
practices. The reality is that many SHGs are unable<br />
to survive in times of natural or personal calamity.<br />
Savings drop when there is drought, which affects<br />
income and leads to migration. Many Stree Shakti<br />
SHGs became defunct during the drought that<br />
affected the state three years in a row from 2001<br />
onwards. There is sometimes an internal confl ict<br />
between donor-driven project goals i.e. fi nancial<br />
viability of an SHG and the larger theme of<br />
empowerment, especially in women’s SHGs. SHGs<br />
have been known to replicate the social relations<br />
of their environment, with poorer SHGs unable<br />
to compete for credit with the more viable ones.<br />
These issues must be recognised and addressed<br />
if we are to upscale the concept as a signifi cant<br />
poverty reduction and social empowerment tool.<br />
Issues taken up<br />
Anti-child marriage<br />
Anti-dowry<br />
Anti-domestic violence<br />
Pro-girls’ education<br />
Any other<br />
TABLE 14.13<br />
Stree Shakti SHGs: Involvement in social activities<br />
Total SHGs interviewed<br />
65 SHGs from 13 districts of which 5 aged less than 2 years and 60<br />
aged above 2 years<br />
Source: Page 19, Table-13, Stree Shakti Self-Help Groups – Basic Quality Assessment: A Study commissioned by the<br />
Department of Women and Child <strong>Development</strong>, <strong>Karnataka</strong>, and carried out by MYRADA in October 2003.<br />
Notes:<br />
1. In the case of girl child education, though only few SHGs have taken it up as an issue of public concern, all the<br />
interviewed SHGs said that in their own groups they tried to ensure that all members with girls in the school-going<br />
age members sent their daughters to school.<br />
2. Any other includes village water, street lights, road and drain cleaning, mobilising social security for the disabled and<br />
widows, contributing money for charitable and community development purposes.<br />
BOX 14.9<br />
The SHG that evolved into a CSO<br />
In Neelanahalli village of Davangere district, a Stree Shakti SHG, Adishakti Mahila Sangha, won the Best<br />
SHG Award from the state government last year. Group lending has helped members take up a number of<br />
income generating activities. In addition to their own saving, the SHG has taken loans of Rs.2,80,000 from<br />
the State Bank of India, Davangere under the SHG-Bank Linkage Programme and Rs.1,25,000 under the<br />
SGSY Programme. But most importantly, the group has raised its voice against alcoholism, dowry and child<br />
marriage. Looking beyond the needs of its own members, it has also organised veterinary camps where all<br />
villagers can bring their animals for treatment. Its most important community contribution so far has been<br />
in resolving the drinking water problem in the village. The group contributed Rs.11,000 from its own funds<br />
towards the Government of India’s Swajaldhara Water Project, as a result of which the village was enabled to<br />
augment its drinking water supply. This SHG has steadily grown into a vital civil society organisation.<br />
Source: MYRADA (2002) and Stree Shakti Case Study, DWCD, 2004.<br />
303
Self-Help Groups: Empowerment Through Participation<br />
Recommendations<br />
<br />
<br />
Given the effectiveness of SHGs in<br />
reducing poverty and building capacity of<br />
members, this strategy must now move<br />
into areas such as the development of the<br />
Scheduled Castes, the Scheduled Tribes and<br />
Minorities.<br />
It is very important for programmes<br />
using the SHG strategy to have clarity<br />
about objectives. Too many objectives are<br />
unrealistic. Fuzzy defi nitions of objectives<br />
mean that they may fall by the wayside.<br />
Objectives relating to empowerment must<br />
be clearly defi ned and then supported by<br />
appropriate interventions.<br />
Given the low levels of community and<br />
political participation by members, this aspect<br />
must be strengthened since SHG members<br />
usually are people who are voiceless in the<br />
community.<br />
Training programmes for Panchayat members<br />
should also build capacity in CSOs such as<br />
SHGs. This process will enable the emergence<br />
of a more vibrant civil society.<br />
304
The Way Forward
CHAPTER 15<br />
The Way Forward<br />
Introduction<br />
In this, the last chapter, which sets out to chart a<br />
course for the future, we take stock of the issues<br />
discussed in the preceding chapters and suggest<br />
some broad policy strategies. Each chapter<br />
contains a very detailed set of recommendations<br />
which will not be repeated here. The chapter will<br />
highlight central concerns in <strong>Karnataka</strong>’s human<br />
development and indicate signposts for the future.<br />
Unlike previous State HDRs, this <strong>Report</strong> has a<br />
thematic focus: it analyses public investment in<br />
human development in <strong>Karnataka</strong> and its outcomes<br />
with regard to the physical quality of life, especially<br />
for the poor and marginalised groups – literacy,<br />
education, healthcare, nutrition, drinking water,<br />
sanitation, housing and livelihoods. The <strong>Report</strong> has<br />
presented, within the context of fi nancing human<br />
development, an analysis of the multiple deprivations<br />
experienced by people located at the intersection<br />
of caste, poverty, gender and region. The <strong>Report</strong><br />
notes that equity and effi ciency are not mutually<br />
exclusive, but are mutually reinforcing. There<br />
cannot be a trade-off between fi scal prudence and<br />
social sector investment. The provision of adequate<br />
funds must necessarily be matched by enhanced<br />
effi ciency in service delivery for both the rural and<br />
urban poor. The governance reforms in <strong>Karnataka</strong><br />
have been evaluated from this perspective. Since<br />
devolution of planning, governance and service<br />
delivery powers and functions to local bodies, is<br />
perceived, quite correctly, as the most effective way<br />
of ensuring accountability and transparency at the<br />
grassroots, the <strong>Report</strong> assesses the performance<br />
of local governments in transforming the human<br />
development scenario in <strong>Karnataka</strong>. Governments<br />
and local bodies perform best when civil society is<br />
vigilant in voicing and safeguarding public interest.<br />
Social mobilisation based on right to information<br />
initiatives and informal collective associations such<br />
as women’s self-help groups, which go beyond<br />
credit, to empowerment, could well be a step in<br />
that direction. A review of the work of NGOs and<br />
their partnerships with government as well as civil<br />
society suggests that there is a need for stronger<br />
partnerships for development – a public-private-<br />
NGO-community coalition for human development,<br />
instead of stand-alone interventions by each of<br />
them separately.<br />
<strong>Human</strong> development in<br />
<strong>Karnataka</strong><br />
It is now recognised that while high economic<br />
growth is indeed crucial to a country’s development,<br />
it may not automatically improve the lives of all<br />
people especially if there is inequity of access to the<br />
benefi ts of growth, which results in exclusion and<br />
the marginalisation of large sub-populations. The<br />
UNDP <strong>Human</strong> <strong>Development</strong> <strong>Report</strong>s replace the<br />
growth driven model of development by one that<br />
affi rms that growth without human development is<br />
inequitable, unjust and exclusionary. <strong>Development</strong><br />
must be people-centric and people-driven to be<br />
truly meaningful.<br />
One of the major fi ndings of the <strong>Karnataka</strong> <strong>Human</strong><br />
<strong>Development</strong> <strong>Report</strong> 1999 was that <strong>Karnataka</strong><br />
ranked seventh among major Indian states with a<br />
human development index (0.448) that was only<br />
slightly higher than all-India (0.423). The 1999<br />
<strong>Report</strong> noted that most of the social indicators<br />
for <strong>Karnataka</strong> hovered around the national<br />
average and there was a need for the state to<br />
break out of the mould of an average performer.<br />
This <strong>Report</strong> establishes that while <strong>Karnataka</strong> has<br />
improved its performance, its HDI (0.650) is only<br />
marginally higher than the all-India HDI value<br />
(0.621). Among states, it still ranks seventh. At<br />
the international level, <strong>Karnataka</strong>’s position is<br />
120 while India is 127. The attainment of human<br />
development in <strong>Karnataka</strong> is considerably better<br />
than in most South Asian countries such as<br />
Pakistan, Nepal, Bhutan and Bangladesh.<br />
Financing human development<br />
The 1999 HDR also recommended a signifi cant<br />
increase in public investment in social sectors<br />
and directing the additional resources to the<br />
Unlike previous State<br />
HDRs, this <strong>Report</strong> has a<br />
thematic focus: it analyses<br />
public investment in<br />
human development<br />
in <strong>Karnataka</strong> and its<br />
outcomes with regard to<br />
the physical quality of life,<br />
especially for the poor<br />
and marginalised groups.<br />
Equity and efficiency are<br />
not mutually exclusive,<br />
but are mutually<br />
reinforcing. There cannot<br />
be a trade-off between<br />
fiscal prudence and social<br />
sector investment.<br />
307
The Way Forward<br />
<strong>Karnataka</strong>’s improvement<br />
in rank over the decade<br />
in terms of both per<br />
capita social expenditure<br />
and per capita human<br />
expenditure, took place<br />
despite the fiscal squeeze<br />
it was then experiencing<br />
and indicates an acrossthe-board<br />
and politically<br />
non-partisan commitment<br />
to human development.<br />
In order to achieve the<br />
targets set for the Tenth<br />
Plan, not to speak of<br />
the MDGs, the state<br />
government will have<br />
to make an additional<br />
allocation of about two<br />
per cent of GSDP.<br />
more needy districts. During 1990-2001,<br />
<strong>Karnataka</strong> experienced the country’s highest<br />
growth rate of GSDP as well as per capita GSDP,<br />
at 7.6 per cent and 5.9 per cent respectively.<br />
Despite this, the state remains in the category of<br />
middle-income states, with per capita GSDP slightly<br />
below all state average. The HDI in <strong>Karnataka</strong> also<br />
increased by 20 per cent from 0.541 (revised) in<br />
1991 to 0.650 in 2001. Although <strong>Karnataka</strong>’s<br />
standing in HDI and its various components is<br />
higher than all-India, its position is below the<br />
neighbouring states of Kerala, Maharashtra and<br />
Tamil Nadu. Complacency at being better than the<br />
all-India average should not lull <strong>Karnataka</strong> into<br />
moving slowly. The state, in the years ahead, must<br />
ensure that it draws level with, if not surpass, the<br />
performance of those neighbouring states that<br />
have performed well in human development. This<br />
means that there will have to be a substantial<br />
increase in investment in both physical and human<br />
capital and improvement in the productivity of<br />
the capital invested. Countries like Cuba and Sri<br />
Lanka, which prioritised social sector spending,<br />
have seen this strategy pay off with very good<br />
human development indicators. In India, the<br />
states are the principal providers of social services,<br />
incurring as much as 85 per cent of the national<br />
expenditure on services such as health, nutrition,<br />
education, housing, water supply and sanitation.<br />
Hence, any enhancement of human development<br />
indicators will mean that <strong>Karnataka</strong> must earmark<br />
a substantial quantum of its fi nancial resources for<br />
the social sector.<br />
UNDP’s Global HDR 1991 suggests that the<br />
public expenditure ratio (PER) for a country<br />
should be around 25 per cent; the social allocation<br />
ratio (SAR) should be about 40 per cent and the<br />
social priority ratio (SPR) about 50 per cent. The<br />
human expenditure ratio (HER) should be about<br />
5 per cent. In contrast, PER in <strong>Karnataka</strong> has<br />
been less than the suggested norm of 25 per<br />
cent over the entire decade. SAR, even with the<br />
inclusion of rural development, has seen a steady<br />
decline throughout the 1990s. At the beginning<br />
of the decade, the SAR at 41 per cent was just<br />
above the norm, but during the decade, it fell to<br />
almost 34 per cent in 2002-03, which is well<br />
below the suggested norm of 40 per cent. The<br />
calculation of SPR, due to the inclusion of more<br />
heads of expenditure than those used by UNDP,<br />
meant that SPR was just around the norm of 50<br />
per cent in 2002-03. Finally, the HER was lower<br />
than the suggested norm of 5 per cent in all<br />
the years, and it has been steadily swerving from<br />
the norm.<br />
However, if one moves away from ratios then<br />
the situation is somewhat brighter because<br />
<strong>Karnataka</strong> was next only to Gujarat and<br />
Maharashtra in the percentage of increase in per<br />
capita social expenditure and per capita social<br />
priority expenditure in the 1990s. <strong>Karnataka</strong>’s<br />
improvement in rank over the decade in terms of<br />
both per capita social expenditure and per capita<br />
human expenditure, took place despite the fi scal<br />
squeeze it was then experiencing and indicates<br />
an across-the-board and politically non-partisan<br />
commitment to human development.<br />
The declining trend in the PER, SAR, and SPR<br />
in the 1990s indicates the magnitude of the<br />
challenges <strong>Karnataka</strong> must confront to achieve<br />
the MDGs and the Tenth Plan targets. There has<br />
also been a signifi cant decline in the share of<br />
expenditure for rural development, nutrition and<br />
family welfare. Public healthcare services are very<br />
important to the poor who are its principal clients,<br />
but expenditure on health and family welfare<br />
has marginally declined from about one per cent<br />
of GSDP in 1990-91 to about 0.88 per cent of<br />
GSDP in 2002-03. The share of public health in<br />
the budget has declined from around nine per cent<br />
in 1990-91 to about six per cent in 2001-02.<br />
In order to achieve the targets set for the Tenth Plan,<br />
not to speak of the MDGs, the state government<br />
will have to make an additional allocation of<br />
about two per cent of GSDP. Even this, it should be<br />
noted, is not adequate to achieve the objectives of<br />
the state’s many departmental vision statements,<br />
nevertheless, providing additional resources of<br />
the order of two per cent of the GSDP itself is a<br />
challenging task.<br />
How will this be achieved? A strategy incorporating<br />
three critical elements is suggested:<br />
1: Providing additional budgetary space<br />
308
for allocations to human development<br />
expenditures by (i) increasing the stagnant<br />
revenue-GSDP ratio, (ii) improving power<br />
sector fi nances as a strategy for fi nancing<br />
for human development, (iii) levying<br />
appropriate user charges on irrigation and<br />
taking steps to collect these charges, (iv)<br />
ensuring greater effi ciencies in power and<br />
irrigation, (v) rationalising grants and fees<br />
for higher educational institutions, and (vi)<br />
containing unproductive administrative<br />
expenditures. (vii) The debt swap scheme<br />
introduced recently will provide some<br />
fi scal space to the state government to<br />
enhance spending on human development<br />
in the next few years. (viii) Similarly, the<br />
introduction of VAT should enhance the<br />
revenue productivity of the tax system in<br />
the medium and long term.<br />
2: Expenditures must focus on targeting<br />
problem/low performing sectors such as (i)<br />
the backward regions and districts which<br />
have low HDI; (ii) the poor and the marginal<br />
groups viz. women because the GDI reveals<br />
the existence of inequity of access and<br />
outcomes, and the Scheduled Castes and<br />
Scheduled Tribes whose HDI reveals the<br />
chasm that separates them from the total<br />
population.<br />
3: Social priority sectors must get optimal<br />
funding. Currently, in education, primary<br />
education does receive a major share of the<br />
education budget but with almost all of the<br />
outlay going for salaries, more resources<br />
will have to be provided for infrastructure<br />
and other inputs for improving the quality<br />
of education. While the expenditure on<br />
primary healthcare has remained stagnant,<br />
tertiary healthcare is increasingly getting a<br />
bigger share of resources. This trend must not<br />
continue since investing in primary healthcare<br />
gives better value for the investment. With<br />
as little as 19.55 per cent being spent on<br />
supplies, services and maintenance all of<br />
which are important inputs for improving the<br />
quality of services, <strong>Karnataka</strong> must improve<br />
its performance in healthcare by providing<br />
more funds for medicine and sub-district<br />
medical infrastructure.<br />
<strong>Human</strong> development outcomes<br />
The <strong>Report</strong> analyses the effect of various factors<br />
such as budgetary support, state policies and<br />
economic growth in the 1990s on human<br />
development outcomes in the state, which will be<br />
briefl y reviewed below.<br />
Poverty, income and livelihoods<br />
The state is witnessing a structural transition in<br />
the composition of its domestic product with the<br />
share of the primary sector declining sharply. In<br />
the 1990s, <strong>Karnataka</strong>’s growth of 6.9 per cent<br />
exceeded all-India’s 6.1 per cent. However, in the<br />
period 1993-94 to 2003-04, the manufacturing<br />
and service sectors grew at 7.50 and 10.61 per<br />
cent respectively, while growth in the primary<br />
sector regressed to 0.61 per cent per annum. The<br />
share of the primary sector fell from 38.10 per<br />
cent in 1993-94 to 20.90 per cent in 2003-04<br />
but an increase in the tertiary sector from 37.9 to<br />
54 per cent pushed up the growth rate.<br />
The tertiary sector contributes more than half the<br />
state’s income, but employment is still primary<br />
sector oriented. Agriculture continues to be the<br />
mainstay of employment although employment<br />
levels are decreasing. Agricultural labour, which<br />
accounts for 40 per cent of the rural population,<br />
has the lowest level of consumption among<br />
all occupational groups. The self-employed in<br />
agriculture, who form the next largest segment,<br />
have the second highest incidence of poverty<br />
among all categories. The proportion of marginal<br />
workers in the total workforce is increasing. The<br />
percentage of irrigated land is so low that it has<br />
serious implications for rural incomes. Women<br />
form nearly 60 per cent of the agricultural labour<br />
force. Among the southern states, <strong>Karnataka</strong><br />
has the second largest percentage of children<br />
living in poor households. Growth in <strong>Karnataka</strong><br />
continues to be Bangalore-centric. By 2000-01<br />
Bangalore city alone was contributing about 22<br />
per cent of the state’s total income. Bangalore<br />
Urban and Rural districts generated a fourth of<br />
the state income. Bijapur, Bidar, Gulbarga and<br />
Raichur were the poorest districts in terms of per<br />
capita domestic product. Labour productivity is<br />
the lowest in all north <strong>Karnataka</strong> districts except<br />
Dharwad.<br />
<strong>Karnataka</strong> <strong>Human</strong> <strong>Development</strong> <strong>Report</strong> <strong>2005</strong><br />
Expenditures must focus<br />
on targeting problem/low<br />
performing sectors such<br />
as the backward regions,<br />
the poor and the marginal<br />
groups.<br />
The state is witnessing<br />
a structural transition<br />
in the composition of its<br />
domestic product with<br />
the share of the primary<br />
sector declining sharply.<br />
309
The Way Forward<br />
<strong>Karnataka</strong> has many<br />
achievements to its credit<br />
in terms of universal<br />
access and enrolment<br />
and must now focus on<br />
retention and upgrading<br />
the quality of learning.<br />
Literacy and education<br />
By 2001, <strong>Karnataka</strong> had achieved, at least<br />
partially, the Tenth Plan goal of 75 per cent literacy<br />
with an urban literacy rate of 80.58 per cent. The<br />
rural areas with 59.33 per cent literacy are some<br />
distance from the gatepost. The goal of reducing<br />
the gender gap in literacy by 50 per cent by 2007<br />
will require concerted efforts since, between 1991<br />
and 2001, the gender gap in literacy declined<br />
rather slowly by 3.1 and 3.76 percentage points<br />
in the rural and urban areas respectively. It<br />
is a matter of concern that the illiteracy rate is<br />
more than 63 per cent among Scheduled Tribe<br />
and about 58 per cent among Scheduled Caste<br />
females. As many as 15 districts (nine in north<br />
and six in south <strong>Karnataka</strong>) have a literacy rate<br />
that is below the state average.<br />
The department of Public Instruction has identifi ed<br />
certain education-related goals to be achieved by<br />
2006-07 but they appear to be rather ambitious<br />
when juxtaposed with current levels of attainment:<br />
(i) All children to complete 8 years of schooling. The<br />
improvement in the mean years of schooling over a<br />
4 year period was a modest 4.25 in 2003-04 from<br />
3.97 in 1999-2000. (ii) Of those who complete<br />
8 years, 80 per cent should go on to secondary<br />
education. In 2003-04 it was 40 per cent.<br />
(iii) Increase achievement levels. This has been<br />
defi ned in terms of passing examinations rather<br />
than achieving enhanced learning skills. (iv)<br />
Reduce income, gender, caste, religious, regional<br />
gaps in enrolment, retention and other indicators.<br />
In order to ensure that the above goals can be<br />
met within a realistic time frame, and ‘Education<br />
for All’ does not remain a distant promise, macro<br />
policy initiatives must focus on:<br />
(1) Increasing resources for primary and<br />
secondary education: The Kothari Commission<br />
recommended six per cent of the GSDP and<br />
this seems reasonable. Currently expenditure<br />
on school education is overwhelmingly<br />
salary-related and hence more resources will<br />
have to be provided for quality-enhancing<br />
inputs such as classrooms, furniture, libraries,<br />
laboratories, teachers’ training and instructional<br />
material. Inadequate and/or lack of infrastructure<br />
are a signifi cant cause of high dropout rates. The<br />
infrastructure index for primary schools reveals<br />
that Bangalore Urban district (0.81) leads in<br />
terms of facilities provided to students and Uttara<br />
Kannada (0.20) is last. A World Bank study<br />
(2004) found that poor school infrastructure<br />
also discouraged teachers who preferred to<br />
work in schools with toilets, electricity, covered<br />
classrooms, non-mud fl oors and libraries. In<br />
fact, schools that are near paved roads have less<br />
teacher absence. Education fi nancing must ensure<br />
more capital expenditure. The educationally<br />
backward regions require special attention in the<br />
context of maximising educational performance<br />
with existing resources.<br />
(2) Reducing signifi cantly, the differences in the<br />
educational attainments of boys and girls; SCs,<br />
STs and the total population; the northern districts<br />
especially the Hyderabad <strong>Karnataka</strong> region and<br />
the coastal and malnad districts and between<br />
urban and rural areas. Removal/reduction of<br />
disparities is central to ensuring equity of access<br />
to the underprivileged, and it is a daunting task<br />
because it means that policy makers must engage<br />
with the structural causes of inequality and the<br />
extent to which these gaps can be bridged by<br />
pro-active state policies.<br />
<strong>Karnataka</strong> has many achievements to its credit<br />
in terms of universal access and enrolment and<br />
must now focus on retention and upgrading<br />
the quality of learning. About three per cent of<br />
primary schools in rural, and four per cent schools<br />
in urban areas, do not have any teachers at all<br />
while about 20 per cent in rural and seven<br />
per cent schools in urban areas have only one<br />
teacher. All schools must have two teachers. Nine<br />
districts in north <strong>Karnataka</strong> and fi ve districts<br />
in south <strong>Karnataka</strong> have less than 50 per cent<br />
female teachers in primary schools in 2003-04<br />
which is not in accordance with the state’s own<br />
norms. As many as 16 (nine in north <strong>Karnataka</strong>)<br />
districts are below the state infrastructure<br />
index average. Addressing these shortfalls will<br />
have a benefi cial impact on girls’ attendance<br />
especially in the educationally backward regions/<br />
districts.<br />
310
The infrastructure of high schools is also poor,<br />
particularly in north <strong>Karnataka</strong> as the average<br />
index (0.37) of these districts is below the average<br />
index of the state (0.42). In 2002-03, as many as<br />
54 per cent schools did not have any toilet and<br />
68 per cent schools did not have separate toilets<br />
for girls. Ensuring that 80 per cent of those who<br />
complete primary education move into secondary<br />
education means that high schools must provide<br />
basic facilities to students, especially for girls.<br />
Examination results (SSLC) indicate that<br />
government and rural high schools do not perform<br />
as well as privately managed schools and urban<br />
schools. Government schools provide services<br />
primarily to low income groups, girls, SCs and STs<br />
and rural areas. Their coverage is extensive, which<br />
ensures accessibility and this has been the policy<br />
thrust so far. Ensuring that the underprivileged<br />
have access to quality education will have to be<br />
the next step in the process of removal of barriers<br />
between social groups, regions as well as boys<br />
and girls.<br />
Healthcare and nutrition<br />
As stated above, health expenditure which<br />
declined from one per cent of GSDP in 1990-91<br />
to 0.88 per cent in 2002-03 must be stepped up<br />
to three per cent of the GSDP if the objectives of<br />
the government’s Vision document are to become<br />
a reality. Rural healthcare resources must be<br />
augmented since the gap between urban and<br />
rural health indicators is very pronounced due<br />
to a variety of reasons, including the inadequacy<br />
of the quality of healthcare provided to the rural<br />
population. As in education, policy must target<br />
disparities: backward regions/districts with high<br />
IMR and MMR, sensitive sub-populations (SCs<br />
and STs) whose health profi le is so manifestly<br />
worse than that of the state population, and<br />
women, because so many macro health issues<br />
arise from their location at the juncture of gender<br />
and poverty.<br />
With more than 70 per cent of total infant<br />
deaths taking place at the neonatal stage,<br />
interventions must focus on multiple tactics such<br />
as encouraging spacing methods, particularly<br />
in young couples and strategically combining<br />
community healthcare with institutional facilities.<br />
The state must achieve universal immunisation<br />
among children below two years by intensively<br />
targeting high risk districts such as Raichur. For<br />
MMR to be reduced signifi cantly, healthcare<br />
interventions must ensure complete antenatal<br />
care and universal coverage by trained birth<br />
attendants with institutional obstetric care for<br />
problematic cases. The state has seen an increase<br />
in HIV/AIDS prevalence, consistent with the<br />
national trend and needs to take timely action to<br />
ensure that its gains in human development are<br />
not undermined.<br />
Nutrition is a major health issue, as is evident<br />
from the high levels of under nutrition and<br />
anaemia in poor women and children from rural<br />
areas, and SCs and STs. The targets for 2007<br />
include reduction of severe malnutrition among<br />
children from 6.2 per cent to three per cent and<br />
moderate malnutrition from 45 per cent to 30 per<br />
cent, and reduction in newborn children with low<br />
birth weight from 35 per cent to 10 per cent. Any<br />
workable strategy must centre on convergence<br />
of the multiple food security and employment<br />
generation programmes in the state to ensure that<br />
the weakest and poorest are not excluded from<br />
the ambit of these schemes.<br />
Water supply, sanitation and housing<br />
In terms of house ownership, the state (78.5<br />
per cent) is fourth among the southern states<br />
and is below the all-India level. A little over 31<br />
per cent of households in <strong>Karnataka</strong> have access<br />
to drinking water within the premises placing<br />
the state above its neighbours, Tamil Nadu and<br />
Andhra Pradesh. The growing unsustainability<br />
of water supply schemes is a problem area for<br />
the state since over-exploitation of groundwater<br />
for irrigation has resulted in a sharp decline in<br />
groundwater levels. Rural sanitation is in a pitiful<br />
state. While the situation is not much better in the<br />
other southern states with the exception of Kerala,<br />
an unsanitary environment is the perfect breeding<br />
ground for disease. This is one area that requires<br />
more attention with reference to funding and<br />
public awareness.<br />
<strong>Karnataka</strong> <strong>Human</strong> <strong>Development</strong> <strong>Report</strong> <strong>2005</strong><br />
Healthcare expenditure<br />
must be stepped up to<br />
three per cent of the<br />
GSDP.<br />
An unsanitary<br />
environment is the<br />
perfect breeding ground<br />
for disease. This is one<br />
area that requires more<br />
attention with reference<br />
to funding and public<br />
awareness.<br />
311
The Way Forward<br />
Gender bias in access to<br />
healthcare, education,<br />
water supply, sanitation<br />
and housing has its basis<br />
in the inequalities within<br />
the household that women<br />
have to contend with and<br />
the gender bias of service<br />
providers.<br />
The state must evolve a<br />
strategic vision and plan<br />
of action for women,<br />
which in turn, must<br />
include budgetary support<br />
for women’s development<br />
programmes.<br />
When disparities impact human<br />
development<br />
Gender<br />
The Gender-related <strong>Development</strong> Index (GDI) in<br />
<strong>Karnataka</strong> (0.637) is higher than the all-India<br />
average (0.609), as per the data for the base year<br />
2001. <strong>Karnataka</strong> is 6th among 15 major states in<br />
gender development, which is better than its rank<br />
in human development. At the international level,<br />
<strong>Karnataka</strong>’s rank in the GDI is at 99 as against<br />
103 for the entire nation.<br />
The GDI at the state level has improved from<br />
0.525 in 1991 to 0.637 in 2001, registering an<br />
increase of 21 per cent in ten years. The pace of<br />
reduction in gender disparities needs to be stepped<br />
up. It is only marginally higher than the increase<br />
of 20 per cent in the HDI during the same period.<br />
Only seven districts, Bangalore Rural, Bangalore<br />
Urban, Dakshina Kannada, Kodagu, Shimoga,<br />
Udupi and Uttara Kannada have a GDI above<br />
the state average. Regional disparities are as<br />
sharply manifested in gender issues as in human<br />
development.<br />
Gender bias in access to healthcare, education,<br />
water supply, sanitation and housing has its basis<br />
in (i) the inequalities within the household that<br />
women have to contend with which result in their<br />
getting less priority than males in terms of access<br />
to income, food, healthcare and education, and<br />
(ii) the gender bias of service providers.<br />
Any roll back in public expenditure on social<br />
services, as noted earlier, impacts poor households<br />
very adversely, and women in particular, since the<br />
poor rely heavily on public facilities in health and<br />
education. The burden of expenditure on health or<br />
education on poor households in the context of a<br />
reduction in public funding of these services means<br />
that women’s nutrition, health and education<br />
become casualties when diffi cult choices confront<br />
families.<br />
In <strong>Karnataka</strong>, as in India, the feminisation of<br />
poverty is an unfortunate if increasing trend.<br />
Women’s work participation in agriculture has<br />
increased, it is true, but it has been as wage<br />
labour. Their participation in the secondary and<br />
tertiary sectors is low. The proportion of marginal<br />
workers among women has gone up signifi cantly<br />
and more so in the poorer regions. In addition,<br />
women workers appear to be more crowded<br />
into agriculture which is a low wage sector. This<br />
picture for women workers stands in contrast to<br />
that for men, whose work participation increases<br />
are more evenly distributed across the regions,<br />
whose proportion of marginal workers while<br />
higher than before, is still under 10 per cent, and<br />
who were less dependent on agricultural work by<br />
2001. The fruits of the state’s economic boom<br />
of the 1990s do not appear to have reached<br />
women workers, especially those from the poorer<br />
regions.<br />
Some signifi cant policy initiatives will have to be<br />
undertaken to address gender inequity. The state<br />
must evolve a strategic vision and plan of action<br />
for women, which in turn, must include budgetary<br />
support for women’s development programmes in<br />
the department of Women and Child <strong>Development</strong>.<br />
Stree Shakti, for example, needs signifi cantly<br />
larger funding for capacity building and vocational<br />
training. Programmes for women facing violent<br />
family situations also require additional resources.<br />
With women constituting nearly half of the state’s<br />
population, their share in the budget too must<br />
increase. The government must introduce gender<br />
budget and audit immediately while strengthening<br />
the KMAY, which has deteriorated into number<br />
crunching in the absence of regular feedback<br />
about the quality of impact. A public education<br />
campaign against sex selection and violence<br />
against women must top the agenda. It is to be<br />
borne in mind that an enabling environment has<br />
been built up in <strong>Karnataka</strong> over the years. Gender<br />
sensitisation of key policy makers and service<br />
providers was fi rst initiated by <strong>Karnataka</strong>, as far<br />
back as 1990 and the momentum needs to be<br />
sustained. A greater and more effective focus on<br />
gender mainstreaming through gender budgets,<br />
engendered Monitoring and Evaluation (M&E)<br />
instruments and other supporting mechanisms<br />
is required. Accordingly, state plans and budgets<br />
must be assessed according to agreed criteria<br />
of gender and human development. Indeed,<br />
interventions such as national missions on health<br />
312
and urban renewal need to be implemented with<br />
a gender perspective.<br />
Social groups<br />
This HDR is unique in yet another way. This is the<br />
fi rst SHDR to evaluate the human development<br />
status of the Scheduled Castes (SCs) and Scheduled<br />
Tribes (STs) in the state. The human development<br />
index of the Scheduled Castes (0.575) is higher<br />
than that of the Scheduled Tribes (0.539) but<br />
much lower than that of the total population of<br />
the state (0.650). The gap is -11 per cent for SCs<br />
and -17 per cent for STs. The HDI of the SCs and<br />
STs is closer to the HDI of the total population<br />
in 1991 revealing a signifi cant decadal gap in<br />
human development. The greatest disparities<br />
are in education and income, with SCs being<br />
15 per cent and STs being 20 per cent below the<br />
state income index in 2001 and 11 per cent and<br />
21 per cent respectively below the state education<br />
index for 2001.<br />
In the matter of gender equality as measured by<br />
the GDI, SC women are better off than ST women.<br />
However, there is a considerable difference<br />
between the state GDI average and the GDI for<br />
SC and ST women. As in the case of the HDI, the<br />
GDI values for 2004 for each index is closer to the<br />
state values for 1991.<br />
The <strong>Report</strong> has brought into clear focus, the<br />
sharpness of the disparity between the Scheduled<br />
Caste and the general population along almost<br />
all human development indicators. The Scheduled<br />
Castes are heavily dependent on agriculture<br />
but own only 11.65 per cent of operational<br />
holdings, 83.25 per cent of which is un-irrigated;<br />
hence they derive only 15.4 per cent of their<br />
income from cultivation. More than half of all<br />
marginal land holdings are held by SCs. They<br />
are concentrated in the primary sector (78.83<br />
per cent) where remuneration is low and their<br />
share of the secondary and tertiary sectors is<br />
poor. The literacy rate of the Scheduled Castes<br />
(52.87) is much lower than the state literacy rate<br />
(66.64 per cent). The crude birth rate is 21.8 for<br />
the state, which is equivalent to the estimated<br />
birth rate (22.0) for SCs. The crude death rate is<br />
7.2 for <strong>Karnataka</strong> and the estimated death rate<br />
for SCs is 9.12.The infant mortality rate for SC<br />
children is estimated to be 64.74 per 1,000 live<br />
births while it is 52 for the state.<br />
The Scheduled Tribes are the most marginal of all<br />
social groups in the context of every socio-economic<br />
indicator. Their literacy rate (48.3) is the lowest<br />
for all social groups and female literacy, which is<br />
36.6 per cent, compared with the state average<br />
(56.9), places ST women far behind a population<br />
that is, itself, disadvantaged to start with. Their<br />
performance in school and tertiary education<br />
again places them well behind other social<br />
groups. ST health status is alarmingly poor, having<br />
either stagnated or deteriorated. NFHS data for<br />
1992-93 and 1998-99 shows regressive trends<br />
with the total fertility rate increasing to 2.38 from<br />
2.15, the post-natal mortality rates to 21.9 from<br />
18, the child mortality rate to 38.9 from 38 and<br />
the under-fi ve mortality rate to 120.6 from 120.3.<br />
Only the neonatal mortality rate fell to 63.2<br />
from 67.6.<br />
Some state programmes have been conspicuously<br />
successful in <strong>Karnataka</strong>: housing, providing<br />
drinking water facilities and electrifi cation of tribal<br />
and Dalit houses can be counted among policies<br />
that have seen effective outcomes. However,<br />
the overall picture is not encouraging and their<br />
health, education and livelihood profi les reveal<br />
them as the most disadvantaged sections of the<br />
population. Both the Scheduled Castes and Tribes<br />
are clustered in the poorer districts/regions of the<br />
state. Maximising coverage of these groups would<br />
result in visible improvements in the state’s overall<br />
health, education and income indicators given<br />
the concentration of poverty among the Dalits<br />
and tribals. Policies to increase the access and<br />
retention of girl students will have to recognise<br />
the specifi c constraints that confront tribal and<br />
SC girls. They need more facilities at post-primary<br />
level to increase their access to education.<br />
The health and nutrition status of the SCs and<br />
STs is largely shaped by poverty and their<br />
inability to access services. Their inability to pay<br />
for private healthcare also means that they will<br />
either use public health facilities where available<br />
or defer/forego medical treatment altogether,<br />
<strong>Karnataka</strong> <strong>Human</strong> <strong>Development</strong> <strong>Report</strong> <strong>2005</strong><br />
Some state programmes<br />
have been conspicuously<br />
successful in <strong>Karnataka</strong>:<br />
housing, providing<br />
drinking water facilities<br />
and electrification of<br />
tribal and Dalit houses<br />
can be counted among<br />
policies that have seen<br />
effective outcomes.<br />
313
The Way Forward<br />
Another aspect of spatial<br />
inequality is the sharp<br />
gap, especially in social<br />
infrastructure, between<br />
rural and urban areas.<br />
with disastrous consequences. The less developed<br />
districts are, not coincidentally, also the districts<br />
with many vacant posts, so that the outreach of<br />
health services is circumscribed precisely where<br />
vulnerable populations are most in need.<br />
Programmes should be constantly monitored<br />
at design and appraisal stages to ensure that<br />
resources are not being cornered by/delivered to<br />
already privileged groups. A major problem is the<br />
lack of adequate and timely disaggregated data<br />
on the SCs and STs which needs to be redressed.<br />
Spatial disparities<br />
Regions: Spatial inequality is increasingly<br />
emerging as a major barrier to sustaining the<br />
country’s many human development initiatives.<br />
Like several other Indian states, <strong>Karnataka</strong> is no<br />
stranger to the existence of disparities in the socioeconomic<br />
development of its regions, a scenario<br />
that has its historical roots in pre-state formation<br />
days. As serious policy actions to redress regional<br />
imbalance were not immediately initiated after<br />
1956, the socio-economic differences between<br />
regions and districts continued to harden so that<br />
by 1980-81, Bangalore Urban and Dakshina<br />
Kannada emerged as the most developed districts,<br />
followed closely by Kodagu, Shimoga, Dharwad<br />
and Belgaum, while the three Hyderabad<br />
<strong>Karnataka</strong> districts of Raichur, Bidar and Gulbarga<br />
surfaced as the most backward districts of the<br />
state. By 2000-01, the pattern of growth over<br />
two decades reveals a further congealing of<br />
the economic stratifi cation of districts based on<br />
geographic location: Bangalore Urban, Kodagu,<br />
Dakshina Kannada, Bangalore Rural, Udupi,<br />
Mysore and Chikmaglur districts had a per<br />
capita domestic product that was higher than the<br />
state average with Bangalore Rural and Urban<br />
districts together generating a quarter of the state<br />
income. Bangalore City alone contributed about<br />
22 per cent of the state income. The northern<br />
districts of Bijapur along with the Hyderabad<br />
<strong>Karnataka</strong> triumvirate of Bidar, Gulbarga and<br />
Raichur continued to be in the poorest quartile in<br />
terms of per capita domestic product.<br />
In literacy, Dakshina Kannada (83.35) and<br />
Bangalore Urban (82.96) and Udupi (81.25)<br />
districts are well on the way to matching Kerala’s<br />
performance, while all four districts of the<br />
Hyderabad <strong>Karnataka</strong> region are below the all-<br />
India literacy rate and Bijapur which had a literacy<br />
rate higher than the all-india literacy rate in 1991,<br />
lost ground in 2001, and its literacy rate fell below<br />
the all-india fi gure in respect of male, female<br />
and total literacy levels. The education index<br />
and the infrastructure index indicate that school<br />
performance in terms of the dropout rate, test<br />
scores, gender equity and infrastructure in schools<br />
is better in south <strong>Karnataka</strong>, but the northern<br />
districts have made tangible improvements<br />
overall. In healthcare, the fi ve northeastern<br />
districts of Gulbarga, Bidar, Koppal, Raichur and<br />
Bellary and two northwestern districts of Bagalkot<br />
and Bijapur have worse health indicators than the<br />
rest of the state. The state infant mortality rate<br />
(IMR) is 52 per 1000 live births, however, the<br />
southern districts perform better with an IMR of<br />
50 compared with Bombay <strong>Karnataka</strong> (59) and<br />
Hyderabad <strong>Karnataka</strong> (60). The distribution of<br />
government healthcare facilities and personnel is<br />
uneven, with the result that the quality and reach<br />
of services are shaped by geographic location.<br />
Disparities engendered by gender and caste<br />
intersect with regional imbalance to mould quite<br />
distinctively, the deprivation profi les of women<br />
and the Scheduled Castes and Tribes. The growing<br />
incidence of female poverty, which is visible across<br />
the state, is highest in Hyderabad <strong>Karnataka</strong> where<br />
the share of marginal workers among women went<br />
up from 14 to 39 per cent. Bombay <strong>Karnataka</strong><br />
also saw a signifi cant increase in the proportion<br />
of marginal workers among women. Most of these<br />
women are SCs and STs who constitute a sizable<br />
segment of the rural underclass. Female literacy<br />
levels among the SCs and STs are lowest in the<br />
northeastern districts.<br />
Urban-rural differences: Regional differences<br />
in socio-economic development are one aspect<br />
of spatial inequality. The other is the sharp gap,<br />
especially in social infrastructure, between rural<br />
and urban areas. Various socio-economic indicators<br />
reveal that people in rural areas in the country<br />
have poorer access to sanitation, drinking water,<br />
healthcare and education services, and have<br />
314
fewer economic opportunities than their urban<br />
counterparts. The divide appears to be widening<br />
since improvements in rural areas have not been<br />
dramatic. In <strong>Karnataka</strong>, in 1996 for example, the<br />
rural IMR was 71 and the urban IMR was 40.<br />
In 2004, the rural IMR declined to 64 but the<br />
urban IMR decreased quite substantially to 24.<br />
Clearly, IMR is declining much faster in the urban<br />
environment with its many healthcare advantages<br />
in terms of quality, quantity and access whereas<br />
the reduction in the rural IMR is not satisfactory.<br />
NFHS-2 data shows that people in urban areas<br />
are likely to use health facilities more often than<br />
their rural counterparts: as many as 78.8 per<br />
cent of urban women have institutional deliveries<br />
compared with 38.5 per cent rural women. Mal and<br />
under-nutrition are also more acute among women<br />
and children in rural areas since urban women can<br />
afford a more balanced diet while rural women eat<br />
less fruits, eggs and meat. The Tenth Plan goal of<br />
75 per cent literacy has been achieved in urban<br />
<strong>Karnataka</strong> where the literacy rate is 80.58 per cent<br />
but the rural areas with 59.33 per cent literacy<br />
are lagging behind. Government schools are quite<br />
rightly concentrated in rural areas, while urban<br />
areas favour a mix of the public and the private<br />
sector. Urban parents have the capacity to pay for<br />
‘quality’ education, which is perceived as improving<br />
the life opportunities of their offspring. There is<br />
considerable disparity in the quality of schooling<br />
available to urban and rural children, which can lay<br />
the basis for inequity of life choices.<br />
Urban <strong>Karnataka</strong> is doing better than the rural parts<br />
of the state in terms of facilities such as drinking<br />
water and sanitation. Only 18.5 per cent of rural<br />
households have access to drinking water within<br />
the premises compared with 56.5 per cent in urban<br />
areas. Over 75 per cent of urban households have<br />
latrines within the house while 82.5 per cent rural<br />
households lacked this facility. House ownership<br />
patterns, however, show a different trend. House<br />
ownership is high in the predominantly agrarian<br />
northern districts and it is below the state average<br />
in Bangalore Urban district.<br />
What are the implications of spatial disparity for<br />
the HDI? There is a strong correlation between<br />
the economic development status of a district<br />
and its HDI at least where the top and bottom<br />
ranking districts are concerned. Districts from<br />
both north and south <strong>Karnataka</strong> have shown a<br />
decadal percentage improvement in the HDI that<br />
is higher than the state average i.e. Bangalore<br />
Rural (21.15), Gadag (22.87), Gulbarga (24.50),<br />
Hassan (23.12), Haveri (21.57), Koppal (30.49),<br />
Mysore (20.42) and Raichur (23.48). Signifi cantly,<br />
Koppal has the best performance and three out of<br />
fi ve districts in the Hyderabad <strong>Karnataka</strong> region<br />
have seen very credible improvements in human<br />
development. However, there has not been a<br />
corresponding change in their rankings in HDI<br />
(which are low), since other districts have also<br />
improved/maintained their performance.<br />
Another caveat is that while urban human<br />
development indicators may be higher than rural,<br />
the existence of disparities of income and access<br />
within urban centres is an increasing phenomenon<br />
and points to the need to tackle urban poverty<br />
with speed.<br />
Service delivery, participatory<br />
and community based<br />
governance<br />
Investing in human development is, to some<br />
extent, about the provisioning of funds, but<br />
merely spending money without addressing the<br />
subject of effective service delivery means there<br />
will be a tremendous wastage in human and<br />
fi scal terms. The issue is not merely ‘how much’<br />
has been provided but ‘how’ it has been spent.<br />
Systems should be effi cient, people-friendly<br />
and corruption-free. <strong>Human</strong> development, to<br />
be truly effective, must be people-centred and<br />
people-defi ned. Empowering people to decide<br />
their own development strategies is critical to<br />
providing participatory development. Building<br />
strong, democratic local bodies and vibrant civil<br />
society organisations in partnership with NGOs<br />
can create a self-sustaining environment for<br />
people-centred human development.<br />
Governance<br />
Good governance enables the emergence of a<br />
citizen-friendly, citizen-responsive administration,<br />
and in the process, ensures that public authority is<br />
exercised for the common good. Good governance<br />
<strong>Karnataka</strong> <strong>Human</strong> <strong>Development</strong> <strong>Report</strong> <strong>2005</strong><br />
Investing in human<br />
development is, to<br />
some extent, about the<br />
provisioning of funds, but<br />
merely spending money<br />
without addressing the<br />
subject of effective service<br />
delivery means there will<br />
be a tremendous wastage<br />
in human and fiscal terms.<br />
Good governance enables<br />
the emergence of a<br />
citizen-friendly, citizenresponsive<br />
administration,<br />
and in the process,<br />
ensures that public<br />
authority is exercised for<br />
the common good.<br />
315
The Way Forward<br />
Making the<br />
administration more<br />
people-friendly and<br />
efficient calls for an<br />
improvement in civil<br />
service management. This<br />
means the development<br />
of a professional civil<br />
service. Employees’<br />
skills and aptitudes<br />
must be matched with<br />
the work they perform.<br />
Performance must be<br />
rewarded and nonperformance<br />
disciplined.<br />
Addressing the<br />
question of whether<br />
decentralisation<br />
in <strong>Karnataka</strong> has<br />
empowered local<br />
governments to provide<br />
public services according<br />
to the preferences of their<br />
residents, brings us face<br />
to face with the need for<br />
more reform.<br />
takes cognizance of what people expect from the<br />
administration, and develops the capacity to fulfi ll<br />
their expectations. Governance reform in <strong>Karnataka</strong><br />
has focused on system improvement, service<br />
delivery, fi nancial management, accountability,<br />
transparency, and strong anti-corruption measures.<br />
The Government has initiated several measures<br />
to optimise the effi ciency of service delivery and<br />
induct fi nancial discipline. Citizen’s charters are in<br />
place in all departments for better transparency<br />
and accountability, and the offi ce of the Lok Ayukta<br />
has been strengthened to contend with corruption<br />
effectively. Admittedly, all these are steps in the<br />
right direction but much more needs to be done<br />
to create a sense of accountability and repel<br />
corruption in the delivery system. Absenteeism of<br />
government offi cials and jockeying for transfers to<br />
preferred destinations (in south <strong>Karnataka</strong>, and<br />
maidan districts to be more explicit) leaving many<br />
posts in the northern/malnad/coastal districts<br />
vacant mean that the brunt of the impact is<br />
borne by the poor who use government-provided<br />
services. The higher income groups invariably use<br />
private sector services in education and healthcare<br />
and consequently have little stake in improving<br />
the system. Lack of motivation and alienation<br />
from the poor results in a bureaucracy that is<br />
not accountable to the people it is supposed<br />
to serve. The <strong>Report</strong> uncovers the connection<br />
between high levels of teacher absence and poor<br />
learning skills of pupils or high IMR in districts<br />
with a large number of vacant posts of doctors<br />
and ANMs. Corruption means that resources are<br />
not utilised to serve the objectives for which they<br />
were earmarked. A World Bank study says that<br />
evidence suggests that gender inequality weakens<br />
a country’s quality of governance—and thus the<br />
effectiveness of its development policies. 1<br />
The government must develop an annual<br />
governance strategy and action plan and a<br />
governance strategy and action plan for each<br />
district. This would also support the reduction of<br />
regional disparities. Making the administration<br />
more people-friendly and effi cient calls for an<br />
improvement in civil service management. This<br />
1<br />
Engendering <strong>Development</strong> through Gender Equality by Elizabeth<br />
M. King and Andrew D. Mason in Outreach Spring 2001.<br />
means the development of a professional civil<br />
service. Employees’ skills and aptitudes must be<br />
matched with the work they perform. Performance<br />
must be rewarded and non-performance<br />
disciplined. The Sachivalaya Vahini needs to be<br />
replicated in the districts. Grievance Adalats at<br />
the district, taluk and gram panchayat level could<br />
deal with local problems pertaining to land, food<br />
security, housing, health, education, public works,<br />
drinking water, sanitation, power, agriculture, and<br />
crime especially crimes against women, SCs and<br />
STs. Public-private partnerships which have started<br />
showing results need sustained encouragement.<br />
Institutional reforms<br />
<strong>Karnataka</strong> is a pioneer among Indian states in<br />
terms of the magnitude of the powers, functions<br />
and funds that have devolved to rural, elected<br />
local bodies, especially in governance and<br />
planning. Theoretically, devolution is underpinned<br />
by an assumption that service delivery is more<br />
effi cient, effective and responsive to people’s<br />
needs when decision-making takes place at<br />
the grassroots through a process that is both<br />
participatory and transparent. In <strong>Karnataka</strong>,<br />
policy initiatives have focused on the devolution<br />
of functions, functionaries and fi nances; ensuring<br />
equity through reservation in local bodies and<br />
authority positions for the underprivileged; and<br />
institutionalising community participation in<br />
governance and planning through gram sabhas<br />
and district planning committees.<br />
Addressing the question whether decentralisation<br />
in <strong>Karnataka</strong> has empowered local governments to<br />
provide public services according to the preferences<br />
of their residents, brings us face to face with the<br />
need for more reform. Both the state and the<br />
PRIs are experiencing certain constraints: on the<br />
ground, the government has transferred functions<br />
and functionaries to panchayats, but the tight fi scal<br />
situation has restricted the devolution of funds to<br />
about 21.8 per cent of the state’s expenditures or<br />
about 5 per cent of GSDP in 2001-02, most of<br />
which was non-plan. Plan expenditure was about<br />
38 per cent in 2001-02 and 27.4 per cent in<br />
2002-03. This gives panchayats little scope to plan<br />
development activities in accordance with local<br />
needs since, in most sectors, the resources were just<br />
316
adequate to pay the salaries of the employees and<br />
spillover schemes from previous plans and other<br />
salary and maintenance expenditures. Financial<br />
assistance to GPs until <strong>2005</strong>-06 constituted only<br />
fi ve per cent of the total district sector outlay and a<br />
little over 1 per cent of the state outlay. Distribution<br />
of resources to districts has been historically<br />
pre-determined and is rarely based on actual needs.<br />
One reason is that sanction of new facilities such as<br />
primary health centres or high schools or sanitation<br />
projects is determined at the state level, and not<br />
by the panchayats. This sometimes results in an<br />
uneven distribution of resources across districts. A<br />
disaggregated analysis of the outlay on 30 major<br />
schemes shows that PRIs have little autonomy in<br />
determining their allocation priorities. This suggests<br />
that the nature of fi scal decentralisation will have<br />
to change to enable PRIs to address area-specifi c<br />
needs in a more focused way.<br />
A major complaint of the panchayat leaders,<br />
especially in GPs, is that the funds devolved are<br />
not commensurate with the needs of the people<br />
and monies sanctioned to them are not released<br />
in time to carry out development works. Untied<br />
grants to GPs have increased signifi cantly over<br />
the years. Rationalisation of schemes and transfer<br />
of more schemes to PRIs must be combined with<br />
more autonomy.<br />
The ZPs and TPs do not have revenue-raising<br />
powers and they merely channel resources<br />
received from the state government as salaries<br />
of teachers and health workers. GPs alone have<br />
taxation powers among rural local bodies, but they<br />
spend only six per cent of the total expenditures<br />
incurred by the rural local governments and thus,<br />
have a negligible role in providing social services.<br />
GPs also have a poor track on record of raising<br />
resources to supplement the grants they get from<br />
the Centre and the state.<br />
Reservation in both elected bodies and in authority<br />
positions has brought a large proportion of<br />
fi rst time/fi rst generation representatives from<br />
hitherto unrepresented social groups into the local<br />
governance system, with signifi cant outcomes for the<br />
socio-political process. Unfortunately, participatory<br />
decision-making through gram sabhas has not led<br />
to a prioritisation of human development in the<br />
agenda. There are many reasons for this situation.<br />
One, participation in gram sabhas is not always as<br />
universal or regular as was envisaged and two, very<br />
often decision-making is guided by the panchayats<br />
which seem to prefer construction-oriented activities<br />
with high visibility to human development related<br />
projects, that have long gestation cycles.<br />
Decentralised planning can become a reality only<br />
when state intervention in the planning process is<br />
minimised. The planning process should also move<br />
away from sectoral planning to integrated area<br />
planning. The PR Act provides civil society with<br />
adequate opportunities for participation in local<br />
governance but caste, class and gender hierarchies<br />
in rural society often prevent the underprivileged<br />
from voicing their needs. Building capacity in<br />
vasati sabhas, SHGs and other community based<br />
organisations is a prerequisite to ensuring that<br />
there is effective social audit of local planning and<br />
implementation. To encourage PRIs to prioritise<br />
human development goals requires more capacity<br />
building, inclusion of human development goals<br />
in district plans backed by funds and sustained<br />
monitoring of HD objectives. GPs should be<br />
encouraged to monitor a set of HD indicators<br />
every quarter. These indicators could range from<br />
increased school attendance, reduction in dropouts,<br />
child nutrition, total ANC, immunisation of all<br />
children, and monitoring unemployment. These<br />
actions would contribute signifi cantly to improving<br />
HD outcomes in the state and in north <strong>Karnataka</strong> in<br />
particular. Increases in district plan outlays should<br />
not be distributed on a pro rata basis to districts.<br />
Instead, districts with poor human and economic<br />
development indicators should get more resources.<br />
NGOs and civil society<br />
A dynamic and socially aware civil society is a<br />
prerequisite for the emergence of an articulate<br />
and potent constituency for public fi nancing<br />
and provisioning of basic social services for the<br />
poor and the underprivileged. It is also a vigilant<br />
watchdog against poor governance and corruption.<br />
In developing countries, however, where civil<br />
societies are often fragmented and divided by<br />
hierarchies, the marginalised lack opportunities<br />
to voice their demands. Empowering the poor,<br />
<strong>Karnataka</strong> <strong>Human</strong> <strong>Development</strong> <strong>Report</strong> <strong>2005</strong><br />
Decentralised planning<br />
can become a reality only<br />
when state intervention<br />
in the planning process is<br />
minimised. The planning<br />
process should also<br />
move away from sectoral<br />
planning to integrated<br />
area planning.<br />
Gram panchayats<br />
should be encouraged<br />
to monitor a set of HD<br />
indicators which could<br />
range from increased<br />
school attendance,<br />
reduction in dropouts,<br />
child nutrition, total<br />
ANC, immunisation of all<br />
children, and monitoring<br />
unemployment.<br />
317
The Way Forward<br />
NGOs are responsible<br />
for ushering processes<br />
that have transformed<br />
development at the<br />
grassroots. Nowhere is<br />
this better exemplified<br />
than in the way NGOs<br />
have enabled selfhelp<br />
groups, especially<br />
women’s self-help groups,<br />
to become powerful<br />
instruments of economic<br />
change and gender<br />
empowerment.<br />
While it is often reiterated<br />
that human development<br />
is people-centric, it is<br />
not always people-driven<br />
because those who are<br />
most needy and whose<br />
human development<br />
indicators are low are<br />
unable to voice their<br />
demands.<br />
women, the Scheduled Castes and Tribes, is a<br />
critical aspect of the process of enabling them to<br />
voice their basic needs.<br />
The <strong>Report</strong> examines the role of NGOs from three<br />
perspectives: (i) while the state must perforce be<br />
the dominant provider of services to the poor,<br />
NGOs can, and do, supplement core actions<br />
in various sectors; (ii) NGOs are credited with<br />
bringing a participatory and empowering focus to<br />
development; and (iii) NGOs and civil society.<br />
The Directory of Voluntary Organisations in<br />
<strong>Karnataka</strong>, which brought out profi les of 530<br />
NGOs, shows that of the 530 NGOs surveyed the<br />
largest numbers are engaged in development<br />
activities, followed by social services and<br />
health. The majority work in central and south<br />
<strong>Karnataka</strong> leaving the north largely neglected.<br />
There is an increasing emphasis on community<br />
participation and NGO involvement in social<br />
sector service delivery. This may lead to greater<br />
accountability and local participation but the<br />
caveat is that it cannot always be assumed<br />
that all NGOs (or private agents) will be more<br />
effi cient, participatory or gender aware than<br />
state agencies.<br />
Many community based organisations in <strong>Karnataka</strong><br />
such as village forest committees and tank users’<br />
cooperative societies were formed at the instance<br />
of government/donor agencies, with the result<br />
that they are often hierarchically managed and<br />
are dependent on government departments for<br />
technical and fi nancial assistance. With the space<br />
for evolving into an independent, self-managing<br />
CBO being somewhat constricted, these bodies,<br />
not surprisingly, present mixed outcomes.<br />
NGOs are responsible for ushering processes<br />
that have transformed development at the<br />
grassroots. Nowhere is this better exemplifi ed<br />
than in the way NGOs have enabled selfhelp<br />
groups, especially women’s self-help<br />
groups, to become powerful instruments of<br />
economic change and gender empowerment.<br />
Self-help groups represent the participatory,<br />
people-centred focus that is synonymous with the<br />
NGO contribution to development. The <strong>Karnataka</strong><br />
government sponsors at least 66 per cent of the<br />
nearly 200,000 SHGs in the state. Stree Shakti<br />
is the fl agship development programme of the<br />
department of Women and Child <strong>Development</strong>.<br />
The programme has its share of successes and<br />
shortcomings. Yet, Stree Shakti has also impacted<br />
women’s lives in a meaningful way by increasing<br />
their levels of self confi dence and self worth.<br />
The groups have shown they have the ability<br />
to develop into vibrant CBOs and should be so<br />
encouraged.<br />
Conclusion<br />
It would be tempting to close this <strong>Report</strong> with<br />
the hope that <strong>Karnataka</strong> should break out of<br />
the category of middle ranking states in human<br />
development but for this to happen, many<br />
institutional and policy changes will have to take<br />
place as indicated above. The state must build on<br />
its strengths, which include satisfactory economic<br />
growth in the tertiary sector in the 2000s while<br />
it gears up to address areas of concern in human<br />
development. Providing additional resources<br />
even for human development is a challenge<br />
for <strong>Karnataka</strong>, indeed for almost all-indian<br />
states given their tight fi scal situation, but such<br />
a move is imperative to ensure that backward<br />
regions/districts better their performance and<br />
socially and economically underprivileged<br />
groups are enabled to broaden their life<br />
choices. At the same time, governance reform<br />
and greater fi nancial and institutional support<br />
to local bodies and basic services in rural<br />
areas and for the urban poor are steps in the<br />
direction of ensuring that services reach those<br />
for whom they were designed: the poor and the<br />
vulnerable. The state is not the only stakeholder<br />
in the process. While it is often reiterated that<br />
human development is people-centric, it is not<br />
always people driven because those who are<br />
most needy and whose human development<br />
indicators are low are unable to voice their<br />
demands. In this context, NGOs have performed<br />
ably by initiating a development process that is<br />
grassroots-based and highly participatory in<br />
nature. Many community based organisations<br />
owe their existence to NGO action. In the fi nal<br />
analysis, governments and NGOs perform best<br />
when they are answerable to a civil society that<br />
318
<strong>Karnataka</strong> <strong>Human</strong> <strong>Development</strong> <strong>Report</strong> <strong>2005</strong><br />
is sensitive to the human development needs of<br />
the people. Civil society expresses its opinion<br />
through a multiplicity of organisations, which may<br />
or may not be formally structured. Some nascent<br />
civil society organisations which have taken birth<br />
on account of state-NGO partnerships, such as<br />
self-help groups, have the potential to speak for<br />
the most marginal people and, if nurtured and<br />
given the space to grow, could become powerful<br />
instruments of social change.<br />
319
Appendix: Statistical Tables
<strong>Karnataka</strong> <strong>Human</strong> <strong>Development</strong> <strong>Report</strong> <strong>2005</strong><br />
1. Inter-state Comparison of Key Indicators<br />
State As per NHDR methodology As per UNDP methodology<br />
HDI HDI rank 2001<br />
1991 2001 1991 2001 HDI Rank GDI Rank<br />
1 2 3 4 5 6 7 8 9<br />
1 Andhra Pradesh 0.377 0.416 9 10 0.609 9 0.595 9<br />
2 Assam 0.348 0.386 10 14 0.578 11 0.554 12<br />
3 Bihar 0.308 0.367 15 15 0.495 15 0.477 15<br />
4 Gujarat 0.431 0.479 6 6 0.655 5 0.642 5<br />
5 Haryana 0.443 0.509 5 5 0.653 6 0.636 7<br />
6 <strong>Karnataka</strong> 0.412 0.478 7 7 0.650 7 0.637 6<br />
7 Kerala 0.591 0.638 1 1 0.746 1 0.724 1<br />
8 Madhya Pradesh 0.328 0.394 13 12 0.572 12 0.548 13<br />
9 Maharashtra 0.452 0.523 4 4 0.706 2 0.693 2<br />
10 Orissa 0.345 0.404 12 11 0.569 13 0.555 11<br />
11 Punjab 0.475 0.537 2 2 0.679 4 0.676 3<br />
12 Rajasthan 0.347 0.424 11 9 0.596 10 0.573 10<br />
13 Tamil Nadu 0.466 0.531 3 3 0.687 3 0.675 4<br />
14 Uttar Pradesh 0.314 0.388 14 13 0.535 14 0.520 14<br />
15 West Bengal 0.404 0.472 8 8 0.647 8 0.631 8<br />
India 0.381 0.472 0.621 0.609<br />
Sources:<br />
1. Col. 2 to Col. 5: National <strong>Human</strong> <strong>Development</strong> <strong>Report</strong> (NHDR), 2002, Planning Commission, GoI.<br />
2. Col. 6 to 9: Computed by V. Shantappa, Coordinator, KHDR-<strong>2005</strong> using latest UNDP Methodology, (Refer Technical Note).<br />
323
Appendix: Statistical Tables<br />
1. Inter-state Comparison of Key Indicators<br />
State<br />
Crude birth rate<br />
1991 2002<br />
Total Rural Urban Total Rural Urban<br />
1 10 11 12 13 14 15<br />
1 Andhra Pradesh 26.00 26.50 24.40 20.70 21.10 19.30<br />
2 Assam 30.90 31.70 21.30 26.60 27.50 18.30<br />
3 Bihar 30.70 31.30 25.50 30.90 31.80 23.50<br />
4 Gujarat 27.50 28.20 25.90 24.70 26.60 20.60<br />
5 Haryana 33.10 34.70 27.20 26.60 27.60 22.60<br />
6 <strong>Karnataka</strong> 26.90 27.90 24.00 22.10 23.50 18.80<br />
7 Kerala 18.30 18.40 18.10 16.90 17.00 16.40<br />
8 Madhya Pradesh 35.80 37.30 29.70 30.40 32.30 22.70<br />
9 Maharashtra 26.20 28.00 22.90 20.30 20.60 19.80<br />
10 Orissa 28.80 29.60 21.60 23.20 23.70 19.60<br />
11 Punjab 27.70 28.50 25.60 20.80 21.70 18.10<br />
12 Rajasthan 35.00 36.00 30.30 30.60 31.90 24.20<br />
13 Tamil Nadu 20.80 20.80 20.80 18.50 19.10 17.50<br />
14 Uttar Pradesh 35.70 37.20 29.00 31.60 32.60 26.80<br />
15 West Bengal 27.00 30.30 18.50 20.50 22.60 14.10<br />
India 29.50 30.90 24.30 25.00 26.60 20.00<br />
Source: SRS Bulletins/<strong>Report</strong>s RGI.<br />
State<br />
Crude death rate<br />
1991 2002<br />
Total Rural Urban Total Rural Urban<br />
1 16 17 18 19 20 21<br />
1 Andhra Pradesh 9.70 10.50 6.70 8.10 8.90 5.50<br />
2 Assam 11.50 11.80 6.90 9.20 9.60 6.00<br />
3 Bihar 9.80 10.20 6.30 7.90 8.20 6.10<br />
4 Gujarat 8.50 8.80 7.90 7.70 8.30 6.40<br />
5 Haryana 8.20 8.50 6.80 7.10 7.20 6.40<br />
6 <strong>Karnataka</strong> 9.00 9.80 6.90 7.20 7.90 5.70<br />
7 Kerala 6.00 6.20 5.30 6.40 6.40 6.20<br />
8 Madhya Pradesh 13.80 14.90 9.20 9.80 10.50 7.20<br />
9 Maharashtra 8.20 9.30 6.20 7.30 8.30 5.60<br />
10 Orissa 12.80 13.50 6.50 9.80 10.30 6.40<br />
11 Punjab 7.80 8.50 5.70 7.10 7.40 6.20<br />
12 Rajasthan 10.10 10.60 7.70 7.70 8.00 6.40<br />
13 Tamil Nadu 8.80 9.50 7.60 7.70 8.60 5.90<br />
14 Uttar Pradesh 11.30 12.00 8.30 9.70 10.20 7.30<br />
15 West Bengal 8.30 8.90 6.70 6.70 6.90 6.40<br />
India 9.80 10.60 7.10 8.10 8.70 6.10<br />
Source: SRS Bulletins/<strong>Report</strong>s, RGI.<br />
324
<strong>Karnataka</strong> <strong>Human</strong> <strong>Development</strong> <strong>Report</strong> <strong>2005</strong><br />
1. Inter-state Comparison of Key Indicators<br />
State Total fertility rate Couples<br />
1991 1999<br />
protected<br />
Total Rural Urban Total Rural Urban 31-03-2000<br />
1 22 23 24 25 26 27 28<br />
1 Andhra Pradesh 3.00 3.10 2.50 2.4 2.5 2.1 52.8<br />
2 Assam 3.50 3.60 2.10 3.2 3.3 1.9 15.2<br />
3 Bihar 4.40 4.50 3.50 4.5 4.7 3.4 21.2<br />
4 Gujarat 3.10 3.20 2.90 3.0 3.2 2.4 52.8<br />
5 Haryana 4.00 4.30 3.00 3.2 3.3 2.6 49.4<br />
6 <strong>Karnataka</strong> 3.10 3.30 2.50 2.5 2.7 2.0 56.3<br />
7 Kerala 1.80 1.80 1.70 1.8 1.8 1.8 39.6<br />
8 Madhya Pradesh 4.60 4.90 3.40 3.9 4.3 2.6 45.9<br />
9 Maharashtra 3.00 3.40 2.50 2.5 2.7 2.3 49.3<br />
10 Orissa 3.30 3.40 2.30 2.7 2.8 2.2 37.6<br />
11 Punjab 3.10 3.20 2.80 2.5 2.6 2.1 65.5<br />
12 Rajasthan 4.60 4.90 3.70 4.2 4.4 3.0 36.1<br />
13 Tamil Nadu 2.20 2.30 2.00 2.0 2.1 1.8 50.4<br />
14 Uttar Pradesh 5.10 5.40 3.70 4.7 5.0 3.6 38.0<br />
15 West Bengal 3.20 3.60 2.10 2.4 2.7 1.6 32.2<br />
India 3.80 4.10 2.80 3.2 3.5 2.3 46.2<br />
Sources:<br />
1. Col. 22 to Col. 27: SRS <strong>Report</strong>s, RGI.<br />
2. Col. 28: Department of Health and Family Welfare, GoI.<br />
State<br />
Infant mortality rate<br />
1991 2002<br />
Total Rural Urban Total Rural Urban<br />
1 29 30 31 32 33 34<br />
1 Andhra Pradesh 73 77 56 62 71 35<br />
2 Assam 81 83 42 70 73 38<br />
3 Bihar 69 71 46 61 62 50<br />
4 Gujarat 69 73 57 60 68 37<br />
5 Haryana 68 73 49 62 65 51<br />
6 <strong>Karnataka</strong> 77 87 47 55 65 25<br />
7 Kerala 16 17 16 10 11 8<br />
8 Madhya Pradesh 117 125 74 85 89 56<br />
9 Maharashtra 60 69 38 45 52 34<br />
10 Orissa 124 129 71 87 90 56<br />
11 Punjab 53 58 40 51 55 35<br />
12 Rajasthan 79 84 50 78 81 55<br />
13 Tamil Nadu 57 65 42 44 50 32<br />
14 Uttar Pradesh 97 102 74 80 83 58<br />
15 West Bengal 71 76 47 49 52 36<br />
India 80 87 53 63 69 40<br />
Source: SRS <strong>Report</strong>s, RGI.<br />
325
Appendix: Statistical Tables<br />
1. Inter-state Comparison of Key Indicators<br />
State Neonatal mortality rate Child mortality rate Maternal mortality rate<br />
1991 1999 1999 1998<br />
1 35 36 37 38<br />
1 Andhra Pradesh 50.5 46.0 18.1 159<br />
2 Assam 53.4 53.0 27.5 409<br />
3 Bihar 41.4 41.0 22.9 452<br />
4 Gujarat 45.1 43.0 19.6 28<br />
5 Haryana 40.0 39.0 22.4 103<br />
6 <strong>Karnataka</strong> 52.9 43.0 16.7 195<br />
7 Kerala 11.3 11.0 3.6 198<br />
8 Madhya Pradesh 68.1 61.0 32.6 498<br />
9 Maharashtra 38.2 29.0 12.7 135<br />
10 Orissa 74.7 61.0 29.0 367<br />
11 Punjab 33.5 34.0 16.8 199<br />
12 Rajasthan 48.4 50.0 27.7 670<br />
13 Tamil Nadu 42.6 36.0 13.0 79<br />
14 Uttar Pradesh 64.3 52.0 29.6 707<br />
15 West Bengal 43.6 31.0 15.0 266<br />
India 51.0 45.0 22.5 407<br />
Source: Col. 35 to Col. 38: SRS <strong>Report</strong>s.<br />
326
<strong>Karnataka</strong> <strong>Human</strong> <strong>Development</strong> <strong>Report</strong> <strong>2005</strong><br />
1. Inter-state Comparison of Key Indicators<br />
State Sex ratio Sex ratio (0-6 years) Percentage of<br />
birth order<br />
(3rd and above)<br />
Medical attention at<br />
birth (1999)<br />
1991 2001 1991 2001 1999 Institutional Trained<br />
professional<br />
1 39 40 41 42 43 44 45<br />
1 Andhra Pradesh 972 978 975 961 21.8 42.8 27.1<br />
2 Assam 923 935 975 965 41.5 21.1 16.1<br />
3 Bihar 907 919 953 942 42.8 15.4 19.4<br />
4 Gujarat 934 920 928 883 34.0 36.3 38.3<br />
5 Haryana 865 861 879 819 36.2 24.7 68.1<br />
6 <strong>Karnataka</strong> 960 965 960 946 27.2 49.2 26.0<br />
7 Kerala 1036 1058 958 960 15.4 97.1 1.8<br />
8 Madhya Pradesh 912 919 941 932 44.9 14.7 22.1<br />
9 Maharashtra 934 922 946 913 31.4 47.8 20.6<br />
10 Orissa 971 972 967 953 33.3 13.9 24.0<br />
11 Punjab 882 876 875 798 30.0 12.7 86.1<br />
12 Rajasthan 910 921 916 909 45.8 8.0 26.3<br />
13 Tamil Nadu 974 987 948 942 22.3 64.8 21.5<br />
14 Uttar Pradesh 876 898 927 916 55.0 7.8 42.0<br />
15 West Bengal 917 934 967 960 30.6 36.2 13.9<br />
India 927 933 945 927 41.0 25.4 28.8<br />
Sources:<br />
1. Col. 39 to 42: Census 1991 and Census 2001, (PCA).<br />
2. Col. 43 to 45: SRS: <strong>Report</strong>s RGI.<br />
327
Appendix: Statistical Tables<br />
1. Inter-state Comparison of Key Indicators<br />
State Life expectancy at birth Mean age at<br />
marriage<br />
Literacy rate<br />
2003 1998-99 1991 2001<br />
Persons Male Female Male Female Total Male Female Total Male Female<br />
1 46 47 48 49 50 51 52 53 54 55 56<br />
1 Andhra Pradesh 63.9 62.8 65.0 23.9 18.3 44.1 55.1 32.7 60.5 70.9 51.2<br />
2 Assam 60.0 59.0 60.9 27.8 21.7 52.9 61.9 43.0 63.3 71.9 56.0<br />
3 Bihar 65.3 65.7 64.8 23.8 18.8 37.5 51.4 22.0 47.0 60.3 33.6<br />
4 Gujarat 63.6 63.1 64.1 24.4 20.2 58.3 69.5 46.3 69.1 76.5 55.6<br />
5 Haryana 67.0 64.6 69.3 24.6 19.8 55.8 69.1 40.5 67.9 79.3 56.3<br />
6 <strong>Karnataka</strong> 65.8 62.4 66.4 26.7 20.1 56.0 67.3 44.3 66.6 76.1 56.9<br />
7 Kerala 73.4 71.7 75.0 27.9 21.5 89.8 93.6 86.2 90.9 94.2 87.9<br />
8 Madhya Pradesh 58.6 59.2 58.0 23.5 18.9 44.7 58.5 29.4 63.7 76.5 50.5<br />
9 Maharashtra 68.3 66.8 69.8 25.3 19.8 64.9 76.6 52.3 76.9 86.3 67.5<br />
10 Orissa 59.9 60.1 59.7 26.6 21.2 49.1 63.1 34.7 63.1 75.9 51.0<br />
11 Punjab 70.9 69.8 72.0 25.7 22.1 58.5 65.7 50.4 69.7 75.6 63.5<br />
12 Rajasthan 62.5 62.2 62.8 22.3 18.3 38.6 55.0 20.4 60.4 76.5 44.3<br />
13 Tamil Nadu 68.4 67.0 69.8 26.6 20.9 62.7 73.7 51.3 73.5 82.3 64.5<br />
14 Uttar Pradesh 63.8 63.5 64.1 23.3 19.0 40.7 54.8 24.4 56.3 70.2 43.0<br />
15 West Bengal 67.7 66.1 69.3 26.2 19.6 57.7 67.8 46.6 68.6 77.6 60.2<br />
India 64.8 64.1 65.4 24.9 19.7 52.2 64.1 39.3 64.8 75.8 54.2<br />
Sources:<br />
1. Col. 51 to 56: Census 1991 and 2001.<br />
2. Col. 46 to 48: Technical Group of RGI.<br />
3. Col. 49 and 50: NFHS - 2, 1998-99.<br />
328
<strong>Karnataka</strong> <strong>Human</strong> <strong>Development</strong> <strong>Report</strong> <strong>2005</strong><br />
1. Inter-state Comparison of Key Indicators<br />
State Per capita NSDP Per<br />
captita<br />
GSDP<br />
Work<br />
participation<br />
rate<br />
Incidence of unemployment<br />
1993-94 2001-02 2001-02 2001 1993-94 1999-2000<br />
Male Female Persons Male Female Persons<br />
1 57 58 59 60 61 62 63 64 65 66<br />
1 Andhra Pradesh 7416 10590 11914 45.8 1.3 0.6 1.1 1.8 0.9 1.4<br />
2 Assam 5715 6059 6851 35.8 4.6 9.5 5.6 3.7 8.0 4.6<br />
3 Bihar 3100 3554 3922 33.7 2.6 1.3 2.3 2.9 0.9 2.4<br />
4 Gujarat 9796 13684 16334 41.9 1.8 1.1 1.6 1.1 0.3 0.8<br />
5 Haryana 11079 14250 16386 39.6 1.9 0.9 1.6 1.5 0.4 1.2<br />
6 <strong>Karnataka</strong> 7838 10709 13057 44.5 1.5 1.3 1.4 1.5 1.2 1.4<br />
7 Kerala 7938 10832 11960 32.3 5.8 12.1 7.7 5.6 15.1 8.6<br />
8 Madhya Pradesh 6584 7699 8852 42.7 1.7 0.5 1.3 1.5 0.3 1.1<br />
9 Maharashtra 12183 14892 16807 42.5 2.4 1.1 1.9 3.4 1.8 2.9<br />
10 Orissa 4896 5927 6872 38.8 2.5 1.2 2.1 3.2 1.5 2.6<br />
11 Punjab 12710 15210 17225 37.5 1.8 1.9 1.9 2.4 1.2 2.1<br />
12 Rajasthan 6182 8571 9877 42.1 0.8 0.2 0.5 1.1 0.3 0.8<br />
13 Tamil Nadu 8955 12717 14284 44.7 2.6 2.0 2.4 2.9 1.9 2.6<br />
14 Uttar Pradesh 5066 5687 6636 32.5 1.4 0.1 1.1 1.7 0.7 1.4<br />
15 West Bengal 6756 10375 11389 36.8 3.0 5.0 3.5 3.9 4.3 4.0<br />
India 7690 10774 12215 39.1 2.1 1.7 2.0 2.5 1.8 2.3<br />
Sources:<br />
1. Col. 57 to 59: CSO.<br />
2. Col. 61 to 66: NSSO: (50th and 55th Rounds) <strong>Report</strong>s.<br />
3. Col. 60: Census 2001 PCA.<br />
State<br />
Percentage of population below poverty line<br />
1993-94 1999-2000<br />
Rural Urban Combined Rural Urban Combined<br />
1 67 68 69 70 71 72<br />
1 Andhra Pradesh 15.92 38.33 22.19 11.05 26.63 15.77<br />
2 Assam 45.01 7.73 40.86 40.04 7.47 36.09<br />
3 Bihar 58.21 34.50 54.96 44.30 32.91 42.60<br />
4 Gujarat 22.18 27.89 24.21 13.17 15.59 14.07<br />
5 Haryana 28.02 16.38 25.05 8.27 9.99 8.74<br />
6 <strong>Karnataka</strong> 29.88 40.14 33.16 17.38 25.25 20.04<br />
7 Kerala 25.76 24.55 25.43 9.38 20.27 12.72<br />
8 Madhya Pradesh 40.64 48.38 42.52 37.06 38.44 37.43<br />
9 Maharashtra 37.93 35.15 36.86 23.72 26.81 25.02<br />
10 Orissa 49.72 41.64 48.56 48.01 42.83 47.15<br />
11 Punjab 11.95 11.35 11.77 6.35 5.75 6.16<br />
12 Rajasthan 26.46 30.49 27.41 13.74 19.85 15.28<br />
13 Tamil Nadu 32.48 39.77 35.03 20.55 22.11 21.12<br />
14 Uttar Pradesh 42.28 35.39 40.85 31.22 30.89 31.15<br />
15 West Bengal 40.80 22.41 35.66 31.85 14.86 27.02<br />
India 37.27 32.36 35.97 27.09 23.62 26.10<br />
Source: Planning Commission, GoI.<br />
329
Appendix: Statistical Tables<br />
2. District-wise Key <strong>Human</strong> <strong>Development</strong> Indicators<br />
District HDI GDI<br />
Value Rank Value Rank<br />
2001 1991 2001 1991 2001 1991 2001 1991<br />
1 2 3 4 5 6 7 8 9<br />
1 Bagalkot 0.591 0.505 22 20 0.571 0.483 23 21<br />
2 Bangalore Rural 0.653 0.539 6 11 0.640 0.524 6 12<br />
3 Bangalore Urban 0.753 0.623 1 4 0.731 0.592 1 4<br />
4 Belgaum 0.648 0.545 8 9 0.635 0.525 9 11<br />
5 Bellary 0.617 0.512 18 18 0.606 0.499 17 17<br />
6 Bidar 0.599 0.496 21 23 0.572 0.477 22 23<br />
7 Bijapur 0.589 0.504 23 21 0.573 0.486 21 20<br />
8 Chamarajnagar 0.576 0.488 25 24 0.557 0.472 25 24<br />
9 Chikmaglur 0.647 0.559 9 7 0.636 0.550 8 6<br />
10 Chitradurga 0.627 0.535 16 13 0.618 0.514 14 13<br />
11 Dakshina Kannada 0.722 0.661 2 1 0.714 0.645 2 1<br />
12 Davangere 0.635 0.548 12 8 0.621 0.530 13 9<br />
13 Dharwad 0.642 0.539 10 10 0.626 0.531 11 8<br />
14 Gadag 0.634 0.516 13 17 0.626 0.502 12 16<br />
15 Gulbarga 0.564 0.453 26 25 0.543 0.432 26 25<br />
16 Hassan 0.639 0.519 11 16 0.630 0.507 10 14<br />
17 Haveri 0.603 0.496 20 22 0.596 0.480 19 22<br />
18 Kodagu 0.697 0.623 4 3 0.690 0.617 4 3<br />
19 Kolar 0.625 0.522 17 15 0.613 0.505 16 15<br />
20 Koppal 0.582 0.446 24 26 0.561 0.428 24 26<br />
21 Mandya 0.609 0.511 19 19 0.593 0.491 20 19<br />
22 Mysore 0.631 0.524 14 14 0.605 0.496 18 18<br />
23 Raichur 0.547 0.443 27 27 0.530 0.422 27 27<br />
24 Shimoga 0.673 0.584 5 5 0.661 0.572 5 5<br />
25 Tumkur 0.630 0.539 15 12 0.618 0.528 15 10<br />
26 Udupi 0.714 0.659 3 2 0.704 0.644 3 2<br />
27 Uttara Kannada 0.653 0.567 7 6 0.639 0.548 7 7<br />
<strong>Karnataka</strong> 0.650 0.541 0.637 0.525<br />
Source: Computed by V. Shantappa, Co-ordinator, KHDR-II, (Refer Technical Note).<br />
330
<strong>Karnataka</strong> <strong>Human</strong> <strong>Development</strong> <strong>Report</strong> <strong>2005</strong><br />
2. District-wise Key <strong>Human</strong> <strong>Development</strong> Indicators<br />
District Per capita GDP at 1993-94 prices (Rs.) % of Population living below<br />
Value<br />
Rank<br />
poverty line<br />
2001-02 1991-92 2001-02 1991-92 1993-94 1999-2000<br />
1 10 11 12 13 14 15<br />
1 Bagalkot 11557 6511 12 18<br />
2 Bangalore Rural 17144 6427 4 19 38.2 5.2<br />
3 Bangalore Urban 24774 9816 1 5 31.4 9.9<br />
4 Belgaum 11085 7028 13 10 29.9 17.9<br />
5 Bellary 12291 7277 9 9 44.5 33.1<br />
6 Bidar 7654 5136 26 26 56.1 30.4<br />
7 Bijapur 9092 6562 23 17 29.03 32.1<br />
8 Chamarajnagar 10182 6985 17 11<br />
9 Chikmaglur 13328 10132 6 4 15.6 2.3<br />
10 Chitradurga 10155 6658 18 16 39 16.3<br />
11 Dakshina Kannada 20682 13390 2 2 8.9 7.4<br />
12 Davangere 9989 6815 19 13<br />
13 Dharwad 12549 7905 8 6 49.8 21.4<br />
14 Gadag 10607 5918 15 23<br />
15 Gulbarga 8616 5505 25 24 45.5 26.8<br />
16 Hassan 10263 6681 16 15 14.21 11.5<br />
17 Haveri 8679 4850 24 27<br />
18 Kodagu 18838 16090 3 1 20.7 4.9<br />
19 Kolar 9619 6219 21 20 48.5 41.9<br />
20 Koppal 10882 5476 14 25<br />
21 Mandya 9908 6745 20 14 30.2 16.6<br />
22 Mysore 13178 6888 7 12 28.9 15.5<br />
23 Raichur 7579 6022 27 22 25.1 45.6<br />
24 Shimoga 12152 7797 10 7 25.6 8.1<br />
25 Tumkur 9408 6133 22 21 40.6 18.5<br />
26 Udupi 15471 10714 5 3<br />
27 Uttara Kannada 12043 7788 11 8 25 6.7<br />
<strong>Karnataka</strong> 13057 7447 33.2 20.1<br />
Sources:<br />
1. Col 10 and 11: Directorate of Economics and Statistics, <strong>Karnataka</strong>.<br />
2. Col. 14: Computed by V. Shantappa, Thulasiram, Nagarajashetty and J. Sridhar, based on pooled NSS-Consumer expenditure data of 1993-94.<br />
3. Col.15: Computed by Suryanarayana and Zaidi (2002) based on pooled NSS-Consumer expenditure data of 1999-2000.<br />
331
Appendix: Statistical Tables<br />
2. District-wise Key <strong>Human</strong> <strong>Development</strong> Indicators<br />
District<br />
Work participation rate<br />
All SC ST<br />
2001 1991 2001 1991 2001 1991<br />
1 16 17 18 19 20 21<br />
1 Bagalkot 43.6 42.2 44.3 39.9 48.9 46.0<br />
2 Bangalore Rural 47.4 43.0 47.9 44.3 49.6 45.5<br />
3 Bangalore Urban 39.3 34.3 39.1 34.2 41.2 35.3<br />
4 Belgaum 44.6 42.4 45.2 42.8 49.9 45.9<br />
5 Bellary 45.4 44.7 47.9 48.1 49.7 49.6<br />
6 Bidar 37.1 39.9 41.1 44.2 42.3 47.0<br />
7 Bijapur 39.7 41.1 40.3 39.0 41.6 44.9<br />
8 Chamarajnagar 46.4 43.9 45.9 44.3 47.8 43.4<br />
9 Chikmaglur 45.3 45.0 50.2 50.7 50.5 51.5<br />
10 Chitradurga 47.6 44.7 48.4 47.8 49.3 31.1<br />
11 Dakshina Kannada 49.9 45.3 58.1 52.7 57.5 48.2<br />
12 Davangere 43.8 42.5 48.1 43.8 49.5 48.4<br />
13 Dharwad 42.7 39.0 43.2 38.9 49.9 43.3<br />
14 Gadag 47.1 44.8 49.3 43.6 51.5 49.8<br />
15 Gulbarga 43.1 43.1 45.5 46.1 48.0 48.6<br />
16 Hassan 50.2 44.3 51.4 46.8 52.6 46.7<br />
17 Haveri 46.3 43.7 51.2 48.6 50.9 46.9<br />
18 Kodagu 48.6 47.1 54.7 52.8 61.1 58.4<br />
19 Kolar 48.7 43.4 49.1 46.0 54.4 50.1<br />
20 Koppal 46.4 46.4 47.6 49.3 49.6 51.7<br />
21 Mandya 47.7 44.5 47.0 45.4 49.5 47.7<br />
22 Mysore 42.0 38.8 43.3 38.4 46.6 41.5<br />
23 Raichur 43.9 43.1 45.4 43.7 49.1 48.3<br />
24 Shimoga 43.5 40.1 47.4 44.7 46.6 42.3<br />
25 Tumkur 51.0 47.7 51.9 50.1 53.6 50.1<br />
26 Udupi 43.9 39.8 49.9 46.1 50.4 46.5<br />
27 Uttara Kannada 42.9 38.8 44.7 41.8 44.8 38.6<br />
<strong>Karnataka</strong> 44.5 42.0 46.3 44.7 49.4 47.8<br />
Source: Census 2001 and 1991 (PCA).<br />
332
<strong>Karnataka</strong> <strong>Human</strong> <strong>Development</strong> <strong>Report</strong> <strong>2005</strong><br />
2. District-wise Key <strong>Human</strong> <strong>Development</strong> Indicators<br />
District<br />
Female work participation rate<br />
All SC ST<br />
2001 1991 2001 1991 2001 1991<br />
1 22 23 24 25 26 27<br />
1 Bagalkot 33.3 32.2 38.5 31.4 43.0 38.6<br />
2 Bangalore Rural 34.7 29.2 39.0 34.2 40.2 33.7<br />
3 Bangalore Urban 18.7 13.2 23.3 17.7 23.7 17.4<br />
4 Belgaum 32.7 29.7 36.7 34.4 44.2 38.1<br />
5 Bellary 35.9 35.5 43.7 43.8 44.4 43.3<br />
6 Bidar 26.2 30.5 35.5 40.7 34.6 41.5<br />
7 Bijapur 28.5 31.9 33.6 31.7 32.0 37.7<br />
8 Chamarajnagar 31.1 27.3 34.9 33.0 34.4 29.0<br />
9 Chikmaglur 30.9 32.1 42.6 44.1 41.8 45.0<br />
10 Chitradurga 37.7 34.6 42.4 41.7 42.1 40.7<br />
11 Dakshina Kannada 41.7 37.6 54.5 49.6 51.6 41.5<br />
12 Davangere 30.1 30.2 41.2 34.6 40.3 39.9<br />
13 Dharwad 28.6 25.0 33.6 29.2 41.7 32.0<br />
14 Gadag 37.7 36.3 45.2 36.8 46.6 45.1<br />
15 Gulbarga 34.9 34.6 40.9 41.8 42.6 42.1<br />
16 Hassan 39.7 32.4 44.8 38.8 43.7 37.2<br />
17 Haveri 33.7 31.6 45.5 42.5 43.0 38.8<br />
18 Kodagu 36.2 35.3 49.1 47.6 57.3 53.7<br />
19 Kolar 39.0 31.4 42.2 37.4 49.0 40.9<br />
20 Koppal 38.9 38.5 43.8 44.9 45.8 46.5<br />
21 Mandya 33.9 31.0 37.4 36.6 38.7 38.6<br />
22 Mysore 25.3 20.8 30.9 22.9 33.2 26.8<br />
23 Raichur 34.7 32.6 40.0 35.7 43.4 40.6<br />
24 Shimoga 28.0 24.4 37.1 34.5 34.9 31.1<br />
25 Tumkur 41.3 38.1 45.2 43.4 46.3 42.5<br />
26 Udupi 33.9 31.3 42.5 41.1 42.2 39.8<br />
27 Uttara Kannada 27.8 23.7 32.5 30.6 32.6 25.0<br />
<strong>Karnataka</strong> 32.0 29.4 38.4 36.6 41.7 39.6<br />
Source: Census data 2001 and 1991 (PCA).<br />
333
Appendix: Statistical Tables<br />
2. District-wise Key <strong>Human</strong> <strong>Development</strong> Indicators<br />
District<br />
Literacy rate<br />
2001 1991<br />
All SC ST All SC ST<br />
1 28 29 30 31 32 33<br />
1 Bagalkot 57.30 42.44 42.87 53.58 39.60 44.30<br />
2 Bangalore Rural 64.70 55.35 56.22 50.17 35.60 37.60<br />
3 Bangalore Urban 82.96 70.23 72.83 76.27 57.30 62.00<br />
4 Belgaum 64.21 55.57 43.72 53.00 41.40 34.00<br />
5 Bellary 57.40 42.31 41.12 45.89 30.10 27.00<br />
6 Bidar 60.94 52.37 48.68 45.11 34.10 29.20<br />
7 Bijapur 57.01 47.16 46.19 56.55 45.90 44.30<br />
8 Chamarajnagar 50.87 49.94 41.53 38.19 33.80 29.00<br />
9 Chikmaglur 72.20 54.58 58.84 61.05 35.20 39.90<br />
10 Chitradurga 64.45 52.75 53.93 52.28 35.10 24.10<br />
11 Dakshina Kannada 83.35 66.14 72.95 76.74 54.90 62.70<br />
12 Davangere 67.43 49.96 54.11 55.96 32.70 39.20<br />
13 Dharwad 71.61 61.19 54.46 62.73 50.30 49.30<br />
14 Gadag 66.11 48.45 57.73 55.88 38.00 45.00<br />
15 Gulbarga 50.01 39.05 32.40 38.54 25.20 21.60<br />
16 Hassan 68.63 53.61 56.43 56.85 35.00 40.10<br />
17 Haveri 67.79 50.25 58.67 56.10 42.50 46.70<br />
18 Kodagu 77.99 64.93 40.37 68.35 45.70 25.50<br />
19 Kolar 62.84 52.98 47.80 50.45 37.00 31.40<br />
20 Koppal 54.10 38.78 42.11 38.23 47.50 23.00<br />
21 Mandya 61.05 55.92 54.63 48.15 39.10 37.50<br />
22 Mysore 63.48 53.98 46.35 50.88 35.70 33.10<br />
23 Raichur 48.81 38.76 29.01 34.34 21.50 14.40<br />
24 Shimoga 74.52 56.78 62.11 63.90 39.80 48.00<br />
25 Tumkur 67.01 54.33 59.69 54.48 37.00 43.80<br />
26 Udupi 81.25 70.13 69.63 74.47 46.20 56.60<br />
27 Uttara Kannada 76.60 65.45 62.74 66.73 50.20 35.10<br />
<strong>Karnataka</strong> 66.64 52.87 48.27 56.04 38.10 36.00<br />
Source: Census data 2001 and 1991 (PCA).<br />
334
<strong>Karnataka</strong> <strong>Human</strong> <strong>Development</strong> <strong>Report</strong> <strong>2005</strong><br />
2. District-wise Key <strong>Human</strong> <strong>Development</strong> Indicators<br />
District Female literacy rate Literacy - gender<br />
disparity index<br />
2001 1991<br />
All SC ST All SC ST 2001 1991<br />
1 34 35 36 37 38 39 40 41<br />
1 Bagalkot 43.56 28.75 28.49 38.19 25.30 27.20 0.295 0.347<br />
2 Bangalore Rural 54.99 44.56 46.03 38.15 22.80 25.00 0.190 0.275<br />
3 Bangalore Urban 77.48 61.98 64.80 68.81 46.80 51.50 0.094 0.131<br />
4 Belgaum 52.32 41.63 29.50 38.69 25.80 19.20 0.235 0.319<br />
5 Bellary 45.28 29.04 28.75 32.24 17.40 15.20 0.257 0.339<br />
6 Bidar 48.81 40.22 35.61 30.53 21.40 14.90 0.246 0.366<br />
7 Bijapur 43.47 31.95 31.88 41.81 30.40 31.70 0.287 0.314<br />
8 Chamarajnagar 42.48 42.22 32.77 28.6 22.80 20.20 0.191 0.269<br />
9 Chikmaglur 64.01 44.76 49.44 51.31 24.60 30.10 0.154 0.199<br />
10 Chitradurga 53.78 40.92 41.54 39.38 21.70 25.60 0.209 0.288<br />
11 Dakshina Kannada 77.21 58.36 65.69 68.84 45.90 53.70 0.112 0.148<br />
12 Davangere 58.04 38.16 42.98 44.41 19.20 26.10 0.179 0.245<br />
13 Dharwad 61.92 49.26 41.95 50.41 36.80 33.90 0.180 0.243<br />
14 Gadag 52.52 33.69 42.08 39.68 24.90 27.00 0.266 0.353<br />
15 Gulbarga 37.90 27.02 20.77 24.49 12.80 9.40 0.281 0.402<br />
16 Hassan 59.00 43.14 45.56 44.9 23.50 27.40 0.188 0.259<br />
17 Haveri 57.37 36.94 45.16 43.28 31.00 29.80 0.198 0.271<br />
18 Kodagu 72.26 56.56 34.61 61.22 36.00 21.50 0.105 0.137<br />
19 Kolar 52.23 42.09 36.23 37.75 25.20 18.70 0.213 0.293<br />
20 Koppal 39.61 25.62 26.48 22.78 35.90 8.70 0.323 0.453<br />
21 Mandya 51.53 46.25 45.42 36.7 27.80 26.70 0.195 0.272<br />
22 Mysore 55.81 45.52 37.47 41.6 26.10 23.90 0.152 0.210<br />
23 Raichur 35.93 26.09 16.91 21.7 11.00 5.40 0.307 0.399<br />
24 Shimoga 66.88 46.40 52.51 54.33 28.00 36.50 0.141 0.189<br />
25 Tumkur 56.94 43.39 48.70 41.93 24.60 30.50 0.195 0.274<br />
26 Udupi 75.19 62.81 62.78 66.64 34.20 48.20 0.117 0.157<br />
27 Uttara Kannada 68.47 55.55 53.61 56.77 38.70 23.80 0.148 0.193<br />
<strong>Karnataka</strong> 56.87 41.72 36.57 44.34 26.00 23.60 0.189 0.250<br />
Note: Disparity Index=Log(X2/X1)+Log[(Q-X1)/(Q-x2)], where X2>X1 and Q>200,<br />
where X1=female literacy rate, X2=Male literacy rate<br />
Source: Census data 2001 and 1991 (PCA).<br />
335
Appendix: Statistical Tables<br />
2. District-wise Key <strong>Human</strong> <strong>Development</strong> Indicators<br />
District<br />
% of schools<br />
without<br />
teachers<br />
2001<br />
% of schools<br />
with single<br />
teacher<br />
2001<br />
% of habitations having primary school<br />
facility within 1km (Gross Access Ratio)<br />
1993 2002 Primary<br />
schools<br />
Infrastructure index (all<br />
management schools) 2003-04<br />
Secondary<br />
schools<br />
1 42 43 44 45 46 47<br />
1 Bagalkot 3.6 8.9 - 99.25 0.46 0.27<br />
2 Bangalore Rural 1.7 22.3 89.39 96.28 0.40 0.56<br />
3 Bangalore Urban 1.7 15.9 90.13 96.38 0.81 0.55<br />
4 Belgaum 1.7 19.3 95.76 94.53 0.36 0.47<br />
5 Bellary 2.1 5.7 93.27 96.54 0.41 0.46<br />
6 Bidar 3.0 10.3 94.23 94.32 0.32 0.25<br />
7 Bijapur 1.2 9.9 93.46 92.69 0.29 0.36<br />
8 Chamarajnagar 0.9 18.6 - 86.70 0.48 0.17<br />
9 Chikmaglur 5.4 4.1 69.03 72.05 0.42 0.62<br />
10 Chitradurga 1.0 16.9 94.24 96.84 0.28 0.46<br />
11 Dakshina Kannada 1.5 16.2 71.88 86.86 0.64 0.73<br />
12 Davangere 1.0 8.1 - 98.14 0.37 0.44<br />
13 Dharwad 9.1 11.3 97.42 98.17 0.60 0.33<br />
14 Gadag 0.7 5.6 - 98.58 0.61 0.51<br />
15 Gulbarga 1.4 9.2 97.75 91.99 0.25 0.19<br />
16 Hassan 4.0 25.3 86.24 90.56 0.28 0.38<br />
17 Haveri 2.9 9.7 - 98.84 0.38 0.43<br />
18 Kodagu 1.4 19.5 68.50 74.78 0.65 0.42<br />
19 Kolar 3.6 23.4 84.37 96.87 0.33 0.23<br />
20 Koppal 3.0 11.4 - 99.42 0.38 0.52<br />
21 Mandya 9.1 27.0 92.32 96.39 0.48 0.47<br />
22 Mysore 3.9 13.1 88.34 94.82 0.61 0.46<br />
23 Raichur 1.8 16.0 87.42 92.10 0.34 0.47<br />
24 Shimoga 5.4 31.3 72.71 70.26 0.44 0.25<br />
25 Tumkur 3.2 27.3 88.99 94.99 0.30 0.55<br />
26 Udupi 2.2 19.1 - 83.98 0.54 0.19<br />
27 Uttara Kannada 2.9 38.9 74.67 73.23 0.20 0.69<br />
<strong>Karnataka</strong> 3.0 18.9 83.75 88.41 0.43 0.42<br />
Sources:<br />
1. Col. 42-45: Seventh All-India Education Survey (Provisional).<br />
2. Col. 46 and 47: Computed by CMDR, Dharwad (refer Technical Note).<br />
336
<strong>Karnataka</strong> <strong>Human</strong> <strong>Development</strong> <strong>Report</strong> <strong>2005</strong><br />
2. District-wise Key <strong>Human</strong> <strong>Development</strong> Indicators<br />
District<br />
Enrolment equity index at primary<br />
level (I - VIII) 2000-01<br />
Tribal<br />
equity<br />
index<br />
Social<br />
equity<br />
index<br />
Gender<br />
equity<br />
index<br />
Sex ratio<br />
Life expectancy<br />
at birth<br />
2001 1991<br />
Crude birth rate<br />
2001 1991 Persons Persons 2001-02 1991-92<br />
1 48 49 50 51 52 53 54 55 56<br />
1 Bagalkot 102.65 105.08 45.85 977 982 60.8 59.0 26.4 30.4<br />
2 Bangalore Rural 122.52 111.65 53.23 953 945 66.5 64.4 18.7 26.7<br />
3 Bangalore Urban 248.90 119.03 50.11 906 903 67.3 64.8 19.6 26.0<br />
4 Belgaum 76.41 93.43 47.68 959 954 67.7 64.4 23.9 27.8<br />
5 Bellary 87.28 92.17 45.67 969 966 66.1 62.8 26.4 30.2<br />
6 Bidar 46.29 87.41 48.95 948 952 63.3 61.0 26.1 30.1<br />
7 Bijapur 293.38 127.03 48.25 948 948 62.6 59.2 25.6 30.4<br />
8 Chamarajnagar 94.47 104.65 49.50 968 953 63.5 62.5 18.6 26.9<br />
9 Chikmaglur 93.88 93.77 48.28 984 977 63.2 60.1 19.2 29.4<br />
10 Chitradurga 87.15 95.57 48.57 955 951 64.6 62.8 21.4 27.9<br />
11 Dakshina Kannada 117.78 105.13 46.49 1023 1020 67.4 66.0 18.4 25.5<br />
12 Davangere 77.58 85.49 43.20 951 942 65.8 63.0 21.7 27.9<br />
13 Dharwad 110.14 112.51 45.04 948 935 61.9 59.1 22.2 29.6<br />
14 Gadag 135.81 109.14 47.26 968 969 62.7 60.0 23.1 29.5<br />
15 Gulbarga 41.74 93.48 45.60 964 962 62.9 59.5 28.0 31.2<br />
16 Hassan 104.62 98.66 48.19 1005 999 65.2 59.5 18.1 31.0<br />
17 Haveri 99.53 108.04 48.58 942 936 62.2 59.6 22.8 29.6<br />
18 Kodagu 69.18 94.73 48.59 996 979 63.3 61.0 20.1 26.0<br />
19 Kolar 120.55 109.99 48.23 970 965 64.2 62.0 21.5 28.3<br />
20 Koppal 95.29 103.78 45.50 982 981 63.5 60.0 28.8 30.3<br />
21 Mandya 130.05 93.56 50.69 985 963 62.9 60.9 17.7 28.2<br />
22 Mysore 125.14 114.18 45.43 965 953 64.8 62.9 19.8 26.9<br />
23 Raichur 78.09 92.25 43.86 980 978 63.9 60.4 27.8 30.3<br />
24 Shimoga 134.77 151.11 46.32 977 964 67.4 65.8 20.7 26.2<br />
25 Tumkur 103.36 101.92 47.61 966 959 65.3 63.0 19.2 27.7<br />
26 Udupi 107.71 216.75 49.50 1127 1134 67.8 66.1 15.8 25.4<br />
27 Uttara Kannada 62.58 100.24 45.61 970 966 62.9 60.9 20.7 26.7<br />
<strong>Karnataka</strong> 91.21 101.59 47.58 965 960 65.8 62.1 22.4 27.0<br />
Sources:<br />
1. Col. 48 to 50: Computed by V. Shantappa, based on enrolment fi gures of CPI, (refer Technical Note).<br />
2. Col. 51 and 52: Census 2001 and 1991 (PCA).<br />
3. Col. 53 to 56: Computed by Dr. P.J. Bhattacharjee.<br />
337
Appendix: Statistical Tables<br />
2. District-wise Key <strong>Human</strong> <strong>Development</strong> Indicators<br />
District Crude death rate Infant mortality rate No. of beds (Govt. medical<br />
2001-02 1991-92 2001-02 1991-92 institutions) per lakh<br />
population<br />
2003-04 1991-92<br />
% of complete<br />
immunisation<br />
2003-04<br />
% of safe<br />
deliveries<br />
2001<br />
1 57 58 59 60 61 62 63 64<br />
1 Bagalkot 8.7 10.0 64 95 47 47 64.4 50.1<br />
2 Bangalore Rural 6.5 6.8 48 64 51 52 92.7 79.1<br />
3 Bangalore Urban 6.1 6.8 45 64 123 179 72.1 90.6<br />
4 Belgaum 6.1 6.9 45 65 50 51 74.3 68.6<br />
5 Bellary 7.2 8.2 53 79 91 102 77.3 54.0<br />
6 Bidar 8.4 9.2 66 87 67 59 89.0 52.5<br />
7 Bijapur 9.2 10.0 67 95 67 61 77.6 50.1<br />
8 Chamarajnagar 7.8 8.3 57 79 86 60 84.8 69.7<br />
9 Chikmaglur 8.5 9.7 62 92 113 91 95.9 78.0<br />
10 Chitradurga 7.3 7.9 54 75 88 71 80.8 53.8<br />
11 Dakshina Kannada 6.0 6.2 44 59 96 97 93.3 91.5<br />
12 Davangere 7.1 7.9 52 75 99 91 93.4 53.8<br />
13 Dharwad 9.4 10.3 69 97 112 133 86.3 65.3<br />
14 Gadag 9.0 10.0 66 95 57 54 86.9 65.3<br />
15 Gulbarga 9.1 9.9 67 94 66 64 81.0 47.7<br />
16 Hassan 9.1 10.0 59 95 110 93 84.4 69.7<br />
17 Haveri 9.0 10.0 66 95 54 44 81.2 65.3<br />
18 Kodagu 8.4 9.1 62 86 234 257 109.7 79.4<br />
19 Kolar 8.0 8.2 59 78 99 92 79.3 59.2<br />
20 Koppal 8.9 9.7 65 92 51 40 72.8 48.0<br />
21 Mandya 8.5 9.2 62 87 91 71 81.5 61.9<br />
22 Mysore 7.7 8.3 56 79 137 135 90.2 69.7<br />
23 Raichur 7.6 8.5 59 80 58 42 88.8 48.0<br />
24 Shimoga 6.1 6.3 45 60 110 107 109.5 83.0<br />
25 Tumkur 7.2 8.0 53 76 61 50 78.4 63.5<br />
26 Udupi 6.1 6.2 45 59 89 87 93.8 91.5<br />
27 Uttara Kannada 8.0 9.0 59 85 105 89 80.0 86.1<br />
<strong>Karnataka</strong> 7.5 8.6 55 82 88 89 81.94 51.0<br />
Sources:<br />
1. Col. 57-59: Computed by Dr. P.J. Bhattacharjee.<br />
2. Col. 60: SRS <strong>Report</strong>, RGI.<br />
3. Col. 61-63: DFHS, <strong>Karnataka</strong>.<br />
4. Col. 64: National Population Commission, 2001.<br />
338
<strong>Karnataka</strong> <strong>Human</strong> <strong>Development</strong> <strong>Report</strong> <strong>2005</strong><br />
2. District-wise Key <strong>Human</strong> <strong>Development</strong> Indicators<br />
District<br />
Percentage of temporary houses to total houses<br />
2001 1991<br />
All Rural Urban All Rural Urban<br />
1 65 66 67 68 69 70<br />
1 Bagalkot 7.92 9.08 5.07<br />
2 Bangalore Rural 14.03 15.81 7.32 19.63 21.76 10.53<br />
3 Bangalore Urban 1.75 3.81 1.48 3.44 6.90 2.90<br />
4 Belgaum 7.05 8.46 2.63 9.11 10.87 3.21<br />
5 Bellary 24.47 27.86 18.31 25.42 26.23 23.60<br />
6 Bidar 2.29 2.55 1.31 5.18 6.01 1.54<br />
7 Bijapur 9.21 10.84 3.34 8.62 10.14 3.95<br />
8 Chamarajnagar 11.50 12.29 7.00<br />
9 Chikmaglur 6.02 7.09 1.63 16.48 18.92 3.67<br />
10 Chitradurga 12.53 13.11 9.92 13.64 16.00 7.42<br />
11 Dakshina Kannada 4.63 6.87 1.16 23.22 29.96 4.84<br />
12 Davangere 5.66 7.10 2.38<br />
13 Dharwad 17.21 30.19 6.92 21.54 26.95 12.12<br />
14 Gadag 28.08 30.67 23.19<br />
15 Gulbarga 5.13 6.31 1.72 5.45 6.65 1.54<br />
16 Hassan 2.63 2.89 1.38 6.98 7.78 3.14<br />
17 Haveri 8.52 9.26 5.58<br />
18 Kodagu 4.03 4.52 0.88 13.47 15.26 2.93<br />
19 Kolar 10.82 13.44 2.76 16.19 19.37 5.01<br />
20 Koppal 33.81 35.55 25.30<br />
21 Mandya 8.88 8.60 10.34 14.37 14.15 15.38<br />
22 Mysore 5.14 6.81 2.36 12.28 15.44 4.81<br />
23 Raichur 31.68 36.21 18.39 36.44 38.26 29.90<br />
24 Shimoga 7.46 10.90 1.16 21.08 27.78 3.79<br />
25 Tumkur 13.79 16.05 4.42 19.69 22.47 6.12<br />
26 Udupi 6.85 7.96 2.03<br />
27 Uttara Kannada 8.55 11.26 1.91 21.84 27.64 4.63<br />
<strong>Karnataka</strong> 9.51 12.32 4.23 14.97 18.86 6.45<br />
Note: Figures in cols. 68 to 70: relate to undivided 20 districts.<br />
Source: Census 2001 and 1991 (PCA).<br />
339
Appendix: Statistical Tables<br />
2. District-wise Key <strong>Human</strong> <strong>Development</strong> Indicators<br />
District<br />
% of households having access to all 3 facilities<br />
(safe drinking water + electricity + toilet) 2001<br />
All Rural Urban<br />
1 71 72 73<br />
1 Bagalkot 12.09 4.05 31.85<br />
2 Bangalore Rural 31.78 19.20 79.00<br />
3 Bangalore Urban 82.88 38.81 88.65<br />
4 Belgaum 20.74 9.35 56.61<br />
5 Bellary 24.76 10.07 51.26<br />
6 Bidar 17.27 6.37 58.80<br />
7 Bijapur 11.00 2.53 41.56<br />
8 Chamarajnagar 15.52 9.10 52.69<br />
9 Chikmaglur 38.41 29.12 76.41<br />
10 Chitradurga 19.66 10.03 62.48<br />
11 Dakshina Kannada 55.63 38.04 82.68<br />
12 Davangere 31.87 17.28 64.93<br />
13 Dharwad 43.00 14.10 66.33<br />
14 Gadag 14.89 5.93 31.87<br />
15 Gulbarga 16.96 3.74 54.79<br />
16 Hassan 26.24 15.28 77.17<br />
17 Haveri 24.00 15.65 57.43<br />
18 Kodagu 40.32 35.75 69.58<br />
19 Kolar 31.39 18.00 72.37<br />
20 Koppal 12.14 7.00 37.21<br />
21 Mandya 23.30 14.74 68.66<br />
22 Mysore 41.28 14.27 86.20<br />
23 Raichur 13.89 4.75 40.64<br />
24 Shimoga 45.07 29.55 73.36<br />
25 Tumkur 24.24 12.35 73.39<br />
26 Udupi 51.26 44.44 80.62<br />
27 Uttara Kannada 33.46 21.37 62.94<br />
Source: Census 2001 (PCA).<br />
<strong>Karnataka</strong> 35.18 15.22 72.64<br />
340
<strong>Karnataka</strong> <strong>Human</strong> <strong>Development</strong> <strong>Report</strong> <strong>2005</strong><br />
3. Population and Demography<br />
District<br />
Area<br />
(in sq. km)<br />
1991 population 2001 population<br />
Person Male Female Person Male Female<br />
1 2 3 4 5 6 7 8<br />
1 Bagalkot 6594 1390259 701515 688744 1651892 834247 817645<br />
2 Bangalore Rural 5815 1673194 860231 812963 1881514 962183 919331<br />
3 Bangalore Urban 2190 4839162 2542950 2296212 6537124 3426599 3110525<br />
4 Belgaum 13415 3583606 1834005 1749601 4214505 2150090 2064415<br />
5 Bellary 8419 1656000 842300 813700 2027140 1029714 997426<br />
6 Bidar 5448 1255799 643192 612607 1502373 771022 731351<br />
7 Bijapur 10475 1537731 789504 748227 1806918 926424 880494<br />
8 Chamarajnagar 5685 883365 452333 431032 965462 489940 475522<br />
9 Chikmaglur 7201 1017283 514526 502757 1140905 574911 565994<br />
10 Chitradurga 8388 1312717 672849 639868 1517896 776221 741675<br />
11 Dakshina Kannada 4843 1656165 819847 836318 1897730 938434 959296<br />
12 Davangere 6018 1559222 803083 756139 1790952 917705 873247<br />
13 Dharwad 4230 1374895 710671 664224 1604253 823204 781049<br />
14 Gadag 4657 859042 436321 422721 971835 493533 478302<br />
15 Gulbarga 16224 2582169 1316088 1266081 3130922 1592789 1538133<br />
16 Hassan 6814 1569684 785144 784540 1721669 859086 862583<br />
17 Haveri 4851 1269213 655426 613787 1439116 740469 698647<br />
18 Kodagu 4102 488455 246869 241586 548561 274831 273730<br />
19 Kolar 8223 2216889 1128316 1088573 2536069 1286193 1249876<br />
20 Koppal 8458 958078 483701 474377 1196089 603312 592777<br />
21 Mandya 4961 1644374 837597 806777 1763705 888034 875671<br />
22 Mysore 6269 2281653 1168291 1113362 2641027 1344670 1296357<br />
23 Raichur 5559 1351809 683258 668551 1669762 841840 827922<br />
24 Shimoga 8465 1452259 739561 712698 1642545 830559 811986<br />
25 Tumkur 10598 2305819 1177233 1128586 2584711 1313801 1270910<br />
26 Udupi 3598 1038099 486409 551690 1112243 522231 590012<br />
27 Uttara Kannada 10291 1220260 620697 599563 1353644 686876 666768<br />
<strong>Karnataka</strong> 191791 44977201 22951917 22025284 52850562 26898918 25951644<br />
Sources:<br />
1. Col. 3 to 5: Computed for 27 districts based on taluk-wise fi gures of Population Census 1991.<br />
2. Col. 6 to 8: Primary Census Abstract 2001.<br />
341
Appendix: Statistical Tables<br />
3. Population and Demography<br />
District<br />
Projected population<br />
2002 2003 2004 <strong>2005</strong> 2006 2007 2008 2009 2010 2011<br />
1 9 10 11 12 13 14 15 16 17 18<br />
1 Bagalkot 1680451 1708670 1736888 1765107 1793326 1821545 1849763 1877982 1906201 1934420<br />
2 Bangalore<br />
Rural<br />
3 Bangalore<br />
Urban<br />
1895780 1914144 1932509 1950873 1969237 1987601 <strong>2005</strong>966 2024330 2042694 2061058<br />
6728599 6934088 7139577 7345066 7550554 7756043 7961532 8167021 8372510 8577999<br />
4 Belgaum 4270035 4332805 4395576 4458346 4521117 4583888 4646658 4709429 4772199 4834970<br />
5 Bellary 2062756 2100270 2137785 2175299 2212813 2250327 2287842 2325356 2362870 2400384<br />
6 Bidar 1523355 1545336 1567316 1589297 1611278 1633259 1655240 1677221 1699201 1721182<br />
7 Bijapur 1833377 1857891 1882405 1906919 1931433 1955947 1980461 2004975 2029488 2054002<br />
8 Chamarajnagar 969672 975068 980465 985862 991258 996655 1002051 1007448 1012845 1018241<br />
9 Chikmaglur 1153223 1167341 1181460 1195578 1209697 1223815 1237934 1252053 1266171 1280290<br />
10 Chitradurga 1526896 1543565 1560234 1576903 1593573 1610242 1626911 1643580 1660249 1676918<br />
11 Dakshina<br />
Kannada<br />
1921374 1946344 1971315 1996286 2021256 2046227 2071198 2096168 2121139 2146110<br />
12 Davangere 1806642 1823591 1840540 1857490 1874439 1891388 1908337 1925286 1942235 1959184<br />
13 Dharwad 1626428 1649061 1671695 1694329 1716963 1739596 1762230 1784864 1807497 1830131<br />
14 Gadag 982747 993539 1004331 1015122 1025914 1036706 1047498 1058290 1069082 1079873<br />
15 Gulbarga 3182130 3239403 3296675 3353948 3411220 3468493 3525765 3583038 3640310 3697583<br />
16 Hassan 1731570 1741821 1752072 1762323 1772574 1782825 1793076 1803327 1813578 1823829<br />
17 Haveri 1450226 1462591 1474957 1487322 1499688 1512054 1524419 1536785 1549151 1561516<br />
18 Kodagu 550015 554708 559401 564094 568787 573480 578173 582865 587558 592251<br />
19 Kolar 2552929 2582451 2611974 2641497 2671020 2700542 2730065 2759588 2789110 2818633<br />
20 Koppal 1219186 1244876 1270566 1296256 1321946 1347637 1373327 1399017 1424707 1450397<br />
21 Mandya 1767339 1772960 1778581 1784203 1789824 1795445 1801066 1806687 1812308 1817929<br />
22 Mysore 2648828 2672745 2696662 2720579 2744496 2768412 2792329 2816246 2840163 2864080<br />
23 Raichur 1674167 1700122 1726077 1752032 1777987 1803942 1829897 1855852 1881807 1907762<br />
24 Shimoga 1657651 1675707 1693764 1711820 1729876 1747932 1765988 1784045 1802101 1820157<br />
25 Tumkur 2601436 2623356 2645276 2667197 2689117 2711037 2732957 2754877 2776797 2798717<br />
26 Udupi 1115065 1120636 1126207 1131778 1137349 1142920 1148491 1154062 1159633 1165204<br />
27 Uttara Kannada 1365075 1376851 1388627 1400403 1412179 1423955 1435731 1447507 1459283 1471059<br />
<strong>Karnataka</strong> 53496950 54259943 55022935 55785927 56548920 57311912 58074904 58837897 59600889 60363881<br />
Source: Computed by V.Shantappa and G. Thulasiram (Methodology in Technical Note).<br />
342
<strong>Karnataka</strong> <strong>Human</strong> <strong>Development</strong> <strong>Report</strong> <strong>2005</strong><br />
3. Population and Demography<br />
District Decadal population growth (%) 1991 population<br />
1961<br />
to<br />
1971<br />
1971<br />
to<br />
1981<br />
1981<br />
to<br />
1991<br />
1991<br />
to<br />
2001<br />
2001<br />
to<br />
2011<br />
Rural<br />
Urban<br />
Male Female Total Male Female Total<br />
1 19 20 21 22 23 24 25 26 27 28 29<br />
1 Bagalkot 20.74 23.54 20.79 18.82 17.10 505829 499400 1005229 195686 189344 385030<br />
2 Bangalore Rural 16.22 24.3 15.23 12.45 9.54 703416 666492 1369908 156815 146471 303286<br />
3 Bangalore 46.55 59.08 38.44 35.09 31.22 351357 318552 669909 2191593 1977660 4169253<br />
Urban<br />
4 Belgaum 22.16 22.94 20.3 17.61 14.72 1400174 1341646 2741820 433831 407955 841786<br />
5 Bellary 24.21 33.64 26.84 22.41 18.41 570285 555461 1125746 272015 258239 530254<br />
6 Bidar 24.26 20.83 26.12 19.63 14.56 513840 496256 1010096 129352 116351 245703<br />
7 Bijapur 18.61 18.68 22.94 17.51 13.67 631731 602284 1234015 157773 145943 303716<br />
8 Chamarajnagar 15.5 24.61 14.99 9.29 5.47 388068 371622 759690 64265 59410 123675<br />
9 Chikmaglur 23.33 23.77 11.57 12.15 12.22 425865 419557 845422 88661 83200 171861<br />
10 Chitradurga 21.3 21.13 20.51 15.63 10.48 559529 535718 1095247 113320 104150 217470<br />
11 Dakshina 27.17 22.72 15.98 14.59 13.09 552849 569874 1122723 266998 266444 533442<br />
Kannada<br />
12 Davangere 29.99 32.44 23.07 14.86 9.39 572927 545787 1118714 230156 210352 440508<br />
13 Dharwad 26.76 31.26 19.64 16.68 14.08 336095 316631 652726 374576 347593 722169<br />
14 Gadag 18.35 19.37 15.56 13.13 11.12 284330 276755 561085 151991 145966 297957<br />
15 Gulbarga 27.28 19.63 24.1 21.25 18.10 999383 972983 1972366 316705 293098 609803<br />
16 Hassan 23.05 23.1 15.67 9.68 5.93 644650 652312 1296962 140494 132228 272722<br />
17 Haveri 14.87 24.76 20.53 13.39 8.51 550775 514673 1065448 104651 99114 203765<br />
18 Kodagu 17.18 22.1 5.75 12.31 7.96 206659 203855 410514 40210 37731 77941<br />
19 Kolar 17.56 25.64 16.34 14.40 11.14 863585 836321 1699906 264731 252252 516983<br />
20 Koppal 31.44 22.27 28.05 24.84 21.26 407944 402063 810007 75757 72314 148071<br />
21 Mandya 28.38 22.85 15.96 7.26 3.07 699719 677851 1377570 137878 128926 266804<br />
22 Mysore 28.4 25.12 24.84 15.75 8.45 748558 716476 1465034 419733 396886 816619<br />
23 Raichur 26.76 28.84 30.53 23.52 14.25 512804 506954 1019758 170454 161597 332051<br />
24 Shimoga 29.57 27.59 15.11 13.10 10.81 496372 484799 981171 243189 227899 471088<br />
25 Tumkur 19.04 21.51 16.58 12.10 8.28 975346 948310 1923656 201887 180276 382163<br />
26 Udupi 19.55 22.31 9.42 7.14 4.76 372520 436427 808947 113889 115263 229152<br />
27 Uttara Kannada 23.13 26.38 13.66 10.93 8.67 470332 455412 925744 150365 144151 294516<br />
<strong>Karnataka</strong> 24.22 26.75 21.12 17.51 14.22 15744942 15324471 31069413 7206975 6700813 13907788<br />
Sources:<br />
1. Col. 19 to 23: Computed.<br />
2. Col. 24 to 29: Computed for 27 districts based on taluk-wise fi gures of Population Census 1991.<br />
343
Appendix: Statistical Tables<br />
3. Population and Demography<br />
District 2001 population Percentage share of<br />
rural population<br />
Rural Urban 1991 2001<br />
Male Female Total Male Female Total<br />
1 30 31 32 33 34 35 36 37<br />
1 Bagalkot 591400 581972 1173372 242847 235673 478520 72.31 71.03<br />
2 Bangalore Rural 752077 722041 1474118 210106 197290 407396 81.87 78.35<br />
3 Bangalore Urban 406201 370936 777137 3020398 2739589 5759987 13.84 11.89<br />
4 Belgaum 1630756 1571058 3201814 519334 493357 1012691 76.51 75.97<br />
5 Bellary 668534 651756 1320290 361180 345670 706850 67.98 65.13<br />
6 Bidar 591653 565845 1157498 179369 165506 344875 80.43 77.04<br />
7 Bijapur 723276 687553 1410829 203148 192941 396089 80.25 78.08<br />
8 Chamarajnagar 414783 402589 817372 75157 72933 148090 86.00 84.66<br />
9 Chikmaglur 461286 456895 918181 113625 109099 222724 83.11 80.48<br />
10 Chitradurga 635442 608216 1243658 140779 133459 274238 83.43 81.93<br />
11 Dakshina Kannada 574657 593771 1168428 363777 365525 729302 67.79 61.57<br />
12 Davangere 637670 610284 1247954 280035 262963 542998 71.75 69.68<br />
13 Dharwad 371275 351061 722336 451929 429988 881917 47.47 45.03<br />
14 Gadag 319629 310023 629652 173904 168279 342183 65.32 64.79<br />
15 Gulbarga 1152343 1125958 2278301 440446 412175 852621 76.38 72.77<br />
16 Hassan 703957 713039 1416996 155129 149544 304673 82.63 82.30<br />
17 Haveri 586935 553161 1140096 153534 145486 299020 83.95 79.22<br />
18 Kodagu 236270 236909 473179 38561 36821 75382 84.04 86.26<br />
19 Kolar 968253 942293 1910546 317940 307583 625523 76.68 75.34<br />
20 Koppal 502732 495065 997797 100580 97712 198292 84.55 83.42<br />
21 Mandya 744276 736714 1480990 143758 138957 282715 83.77 83.97<br />
22 Mysore 845379 813520 1658899 499291 482837 982128 64.21 62.81<br />
23 Raichur 626859 622066 1248925 214981 205856 420837 75.44 74.80<br />
24 Shimoga 540238 531297 1071535 290321 280689 571010 67.56 65.24<br />
25 Tumkur 1052113 1025396 2077509 261688 245514 507202 83.43 80.38<br />
26 Udupi 421056 484834 905890 101175 105178 206353 77.93 81.45<br />
27 Uttara Kannada 489908 475823 965731 196968 190945 387913 75.86 71.34<br />
<strong>Karnataka</strong> 17648958 17240075 34889033 9249960 8711569 17961529 69.08 66.01<br />
Source: Primary Census Abstract, 2001.<br />
344
<strong>Karnataka</strong> <strong>Human</strong> <strong>Development</strong> <strong>Report</strong> <strong>2005</strong><br />
3. Population and Demography<br />
District Density Sex ratio Sex ratio<br />
(0-6 age group)<br />
1991 2001 1991 2001 1991 2001<br />
Total Rural Urban<br />
1 38 39 40 41 42 43 44 45<br />
1 Bagalkot 211 251 982 980 984 970 960 940<br />
2 Bangalore Rural 288 323 945 955 960 939 957 942<br />
3 Bangalore Urban 2210 2979 903 908 913 907 950 943<br />
4 Belgaum 267 314 954 960 963 950 955 921<br />
5 Bellary 196 240 966 969 975 957 956 947<br />
6 Bidar 231 276 952 949 956 923 962 941<br />
7 Bijapur 147 172 948 950 951 950 952 928<br />
8 Chamarajnagar 173 189 953 971 971 970 961 964<br />
9 Chikmaglur 141 158 977 984 990 960 978 959<br />
10 Chitradurga 156 179 951 955 957 948 967 946<br />
11 Dakshina Kannada 363 416 1020 1022 1033 1005 962 952<br />
12 Davangere 263 302 942 952 957 939 953 946<br />
13 Dharwad 333 376 935 949 946 951 947 943<br />
14 Gadag 184 209 969 969 970 968 955 952<br />
15 Gulbarga 159 193 962 966 977 936 959 938<br />
16 Hassan 230 253 999 1004 1013 964 967 958<br />
17 Haveri 263 298 936 944 942 948 954 957<br />
18 Kodagu 119 133 979 996 1003 955 957 977<br />
19 Kolar 270 307 965 972 973 967 971 959<br />
20 Koppal 133 166 981 983 985 971 961 953<br />
21 Mandya 331 355 963 986 990 967 959 934<br />
22 Mysore 333 383 953 964 962 967 967 962<br />
23 Raichur 198 241 978 983 992 958 968 964<br />
24 Shimoga 171 193 964 978 983 967 964 956<br />
25 Tumkur 218 243 959 967 975 938 970 949<br />
26 Udupi 268 286 1134 1130 1151 1040 972 958<br />
27 Uttara Kannada 119 132 966 971 971 969 949 946<br />
<strong>Karnataka</strong> 235 275 960 965 977 942 960 946<br />
Sources:<br />
1. Population Census 1991 and 2001 (Primary Census Abstract).<br />
2. Col. 44 and 45: Population Census 1991 and Population Census 2001 (Primary Census Abstract).<br />
345
Appendix: Statistical Tables<br />
3. Population and Demography<br />
District Total fertility rate Mean age at marriage % of birth order<br />
1991 2001 1998-99<br />
3 and above<br />
1998-99<br />
Male<br />
Female<br />
1 46 47 48 49 50<br />
1 Bagalkot 3.1<br />
2 Bangalore Rural 3.8 2.2 25.8 18.9 16.4<br />
3 Bangalore Urban 3.5 1.9 26.0 20.9 23.3<br />
4 Belgaum 3.6 2.7 23.0 17.0 36.7<br />
5 Bellary 4.9 3.1 24.6 18.5 48.6<br />
6 Bidar 4.8 3.4 22.5 16.3 52.9<br />
7 Bijapur 4.3 3.0 23.5 16.2 43.0<br />
8 Chamarajnagar 2.0<br />
9 Chikmaglur 3.1 1.9 26.4 20.5 32.0<br />
10 Chitradurga 3.6 2.3 25.2 18.6 37.4<br />
11 Dakshina Kannada 3.6 1.7 27.7 22.2 32.0<br />
12 Davangere 2.4<br />
13 Dharwad 3.9 2.5 24.9 19.4 37.4<br />
14 Gadag 2.6<br />
15 Gulbarga 4.8 3.5 22.7 17.6 53.7<br />
16 Hassan 2.9 1.9 25.5 19.8 19.7<br />
17 Haveri 2.6<br />
18 Kodagu 2.8 2.0 26.8 19.9 18.8<br />
19 Kolar 3.9 2.5 24.3 18.6 29.7<br />
20 Koppal 3.4<br />
21 Mandya 3.1 1.9 25.5 18.3 26.1<br />
22 Mysore 3.6 2.1 26.2 17.9 23.9<br />
23 Raichur 4.7 3.3 22.8 17.4 52.8<br />
24 Shimoga 3.7 2.0 26.4 20.5 22.8<br />
25 Tumkur 3.5 2.2 25.2 18.9 27.3<br />
26 Udupi 1.5<br />
27 Uttara Kannada 3.7 2.2 27.9 21.4 27.2<br />
<strong>Karnataka</strong> 3.9 2.4 26.2 19.5 35.3<br />
Sources:<br />
1. Col. 46: Registrar General of India, GoI (for old 20 districts).<br />
2. Col. 47: District Level Estimates of Fertility from India, 2001 Census, by Christophe Z Guilmoto S, Irudaya Rajan (EPW Feb 16, 2002).<br />
3. Col. 48 to 50: Rapid Household Survey <strong>Report</strong> (RCH) 1998-99, ISEC, Bangalore and IIPS Mumbai.<br />
346
<strong>Karnataka</strong> <strong>Human</strong> <strong>Development</strong> <strong>Report</strong> <strong>2005</strong><br />
4. Education Profile<br />
District Total literacy rate Male literacy rate Female literacy rate Compound growth rate of<br />
literacy 1991-2001<br />
1991 2001 1991 2001 1991 2001<br />
Total Male Female<br />
1 2 3 4 5 6 7 8 9 10<br />
1 Bagalkot 53.58 57.30 68.78 70.88 38.19 43.56 0.94 0.55 1.61<br />
2 Bangalore Rural 50.17 64.70 61.51 73.99 38.15 54.99 2.58 1.86 3.72<br />
3 Bangalore Urban 76.27 82.96 82.94 87.92 68.81 77.48 0.84 0.58 1.19<br />
4 Belgaum 53.00 64.21 66.65 75.70 38.69 52.32 1.94 1.28 3.06<br />
5 Bellary 45.89 57.40 59.11 69.20 32.24 45.28 2.26 1.59 3.45<br />
6 Bidar 45.11 60.94 58.97 72.46 30.53 48.81 3.05 2.08 4.80<br />
7 Bijapur 56.55 57.01 70.50 69.94 41.81 43.47 0.13 -0.04 0.45<br />
8 Chamarajnagar 38.19 50.87 47.31 59.03 28.60 42.48 2.91 2.24 4.04<br />
9 Chikmaglur 61.05 72.20 70.56 80.29 51.31 64.01 1.69 1.30 2.24<br />
10 Chitradurga 52.28 64.45 64.50 74.66 39.38 53.78 2.11 1.47 3.17<br />
11 Dakshina Kannada 76.74 83.35 84.88 89.70 68.84 77.21 0.88 0.65 1.15<br />
12 Davangere 55.96 67.43 66.82 76.37 44.41 58.04 1.88 1.35 2.71<br />
13 Dharwad 62.73 71.61 74.22 80.82 50.41 61.92 1.33 0.86 2.08<br />
14 Gadag 55.88 66.11 71.63 79.32 39.68 52.52 1.70 1.02 2.84<br />
15 Gulbarga 38.54 50.01 52.08 61.77 24.49 37.90 2.64 1.72 4.46<br />
16 Hassan 56.85 68.63 68.87 78.37 44.90 59.00 1.90 1.30 2.77<br />
17 Haveri 56.10 67.79 68.05 77.61 43.28 57.37 1.91 1.32 2.86<br />
18 Kodagu 68.35 77.99 75.35 83.70 61.22 72.26 1.33 1.06 1.67<br />
19 Kolar 50.45 62.84 62.69 73.17 37.75 52.23 2.22 1.56 3.30<br />
20 Koppal 38.23 54.10 53.47 68.43 22.78 39.61 3.53 2.50 5.69<br />
21 Mandya 48.15 61.05 59.18 70.50 36.70 51.53 2.40 1.77 3.45<br />
22 Mysore 50.88 63.48 59.71 70.88 41.60 55.81 2.24 1.73 2.98<br />
23 Raichur 34.34 48.81 46.75 61.52 21.70 35.93 3.58 2.78 5.17<br />
24 Shimoga 63.90 74.52 73.12 82.01 54.33 66.88 1.55 1.15 2.10<br />
25 Tumkur 54.48 67.01 66.49 76.78 41.93 56.94 2.09 1.45 3.11<br />
26 Udupi 74.47 81.25 83.58 88.23 66.64 75.19 0.88 0.54 1.21<br />
27 Uttara Kannada 66.73 76.60 76.39 84.53 56.77 68.47 1.39 1.02 1.89<br />
<strong>Karnataka</strong> 56.04 66.64 67.26 76.10 44.34 56.87 1.75 1.24 2.52<br />
Sources:<br />
1. Col. 2, 4 and 6: Population Census 1991(adjusted).<br />
2. Col. 3, 5 and 7: Primary Census Abstract 2001.<br />
347
Appendix: Statistical Tables<br />
4. Education Profile<br />
District<br />
Rural literacy rate<br />
1991 2001<br />
Total Male Female Total Male Female<br />
1 11 12 13 14 15 16<br />
1 Bagalkot 51.23 66.01 36.33<br />
2 Bangalore Rural 46.37 58.61 33.43 61.62 71.88 50.95<br />
3 Bangalore Urban 56.68 67.97 44.09 70.24 78.82 60.78<br />
4 Belgaum 46.47 61.23 31.07 58.85 71.53 45.80<br />
5 Bellary 38.71 52.73 24.34 50.29 63.49 36.82<br />
6 Bidar 39.43 53.85 24.51 56.71 69.22 43.64<br />
7 Bijapur 50.91 66.09 35.29 51.97 65.95 37.32<br />
8 Chamarajnagar 47.24 55.64 38.59<br />
9 Chikmaglur 57.46 67.59 47.19 69.59 78.42 60.70<br />
10 Chitradurga 48.69 61.36 31.42 60.72 71.84 49.12<br />
11 Dakshina Kannada 65.5 72.79 58.16 79.72 87.07 72.69<br />
12 Davangere 72.37 81.65 64.00 62.75 73.04 52.02<br />
13 Dharwad 60.77 73.13 47.70<br />
14 Gadag 52.34 66.7 37.13 61.55 76.40 46.28<br />
15 Gulbarga 42.28 54.93 29.43<br />
16 Hassan 30.36 44.32 16.06 65.23 75.94 54.72<br />
17 Haveri 52.4 65.51 39.56 65.91 76.61 54.52<br />
18 Kodagu 76.10 82.14 70.10<br />
19 Kolar 43.16 56.79 29.06 57.09 68.87 44.99<br />
20 Koppal 51.01 66.10 35.81<br />
21 Mandya 44.19 55.89 32.12 57.74 67.82 47.65<br />
22 Mysore 36.00 46.01 25.53 51.84 61.01 42.31<br />
23 Raichur 30.42 44.26 16.48 42.49 56.09 28.86<br />
24 Shimoga 55.48 66.38 44.24 69.61 78.45 60.66<br />
25 Tumkur 50.23 63.00 36.98 63.39 74.25 52.29<br />
26 Udupi 79.35 86.85 72.97<br />
27 Uttara Kannada 62.1 72.58 51.31 72.65 81.56 63.52<br />
<strong>Karnataka</strong> 47.69 60.3 34.76 59.33 70.45 48.01<br />
Source: Population Census - PCA 1991 and 2001.<br />
348
<strong>Karnataka</strong> <strong>Human</strong> <strong>Development</strong> <strong>Report</strong> <strong>2005</strong><br />
4. Education Profile<br />
District<br />
Urban literacy rate<br />
1991 2001<br />
Total Male Female Total Male Female<br />
1 17 18 19 20 21 22<br />
1 Bagalkot 71.75 82.40 60.87<br />
2 Bangalore Rural 67.39 74.56 59.68 75.97 81.61 69.97<br />
3 Bangalore Urban 79.33 85.28 72.68 84.65 89.13 79.70<br />
4 Belgaum 73.59 83.54 62.99 80.66 88.43 72.53<br />
5 Bellary 60.93 71.93 49.32 70.24 79.41 60.69<br />
6 Bidar 68.03 78.76 55.91 75.14 83.14 66.47<br />
7 Bijapur 68.42 80.88 55.27 74.59 83.86 64.89<br />
8 Chamarajnagar 70.88 77.69 63.86<br />
9 Chikmaglur 78.59 84.73 72.03 82.87 87.77 77.78<br />
10 Chitradurga 73.52 81.2 65.05 81.14 87.21 74.74<br />
11 Dakshina Kannada 83.27 88.43 77.76 89.10 93.78 84.47<br />
12 Davangere 84.51 90.87 78.21 78.08 83.90 71.89<br />
13 Dharwad 80.31 87.00 73.28<br />
14 Gadag 70.2 79.82 59.93 74.40 84.60 63.88<br />
15 Gulbarga 70.12 79.16 60.49<br />
16 Hassan 64.36 75.86 51.87 84.43 89.34 79.35<br />
17 Haveri 77.76 84.02 71.08 74.98 81.44 68.17<br />
18 Kodagu 89.74 93.19 86.11<br />
19 Kolar 74.09 81.63 66.15 80.31 86.18 74.27<br />
20 Koppal 69.14 79.67 58.34<br />
21 Mandya 68.46 75.75 60.66 78.39 84.31 72.26<br />
22 Mysore 73.5 79.69 66.91 82.80 87.33 78.12<br />
23 Raichur 56.38 68.53 43.59 66.86 76.76 56.54<br />
24 Shimoga 78.01 84.23 71.35 83.60 88.53 78.50<br />
25 Tumkur 75.61 82.51 67.79 81.80 86.91 76.35<br />
26 Udupi 89.47 93.83 85.31<br />
27 Uttara Kannada 81.1 88.12 73.79 86.27 91.80 80.59<br />
<strong>Karnataka</strong> 74.2 82.04 65.74 80.58 86.66 74.13<br />
Source: Population Census - PCA 1991 and 2001.<br />
349
Appendix: Statistical Tables<br />
4. Education Profile<br />
District<br />
Management-wise primary schools (standard I - VII)<br />
1990-91 1998-99 2003-04 (I - VIII)<br />
Govt. Private Total Govt. Private Total Govt. Private Total<br />
Aided Unaided Aided Unaided Aided Unaided<br />
1 23 24 25 26 27 28 29 30 31 32 33 34<br />
1 Bagalkot - - - - 1151 36 161 1348 1139 46 175 1360<br />
2 Bangalore Rural 2437 22 61 2520 2515 27 170 2712 2537 40 211 2788<br />
3 Bangalore Urban 1202 518 627 2347 1311 541 1059 2911 1418 568 1256 3242<br />
4 Belgaum 2365 38 71 2474 2804 33 355 3192 3006 70 389 3465<br />
5 Bellary 1272 34 72 1378 1261 51 180 1492 1275 57 214 1546<br />
6 Bidar 762 83 106 951 890 155 46 1091 935 161 169 1265<br />
7 Bijapur 2039 93 114 2246 1465 115 134 1714 1588 121 192 1901<br />
8 Chamarajnagar - - - 0 747 32 61 840 787 40 75 902<br />
9 Chikmaglur 1339 22 28 1389 1527 19 109 1655 1554 21 121 1696<br />
10 Chitradurga 1881 50 180 2111 1583 55 144 1782 1709 64 134 1907<br />
11 Dakshina<br />
1309 499 41 1849 930 244 61 1235 984 231 174 1389<br />
Kannada<br />
12 Davangere - - - 0 1344 93 157 1594 1364 113 231 1708<br />
13 Dharwad 1996 62 93 2151 696 48 95 839 727 69 114 910<br />
14 Gadag - - - 0 600 13 77 690 598 22 88 708<br />
15 Gulbarga 1744 146 90 1980 2086 182 227 2495 2243 132 219 2594<br />
16 Hassan 2286 27 87 2400 2548 37 209 2794 2566 39 212 2817<br />
17 Haveri - - - 0 1092 19 71 1182 1122 22 81 1225<br />
18 Kodagu 391 15 28 434 363 11 43 417 408 12 70 490<br />
19 Kolar 2720 55 131 2906 3285 61 301 3647 3426 100 414 3940<br />
20 Koppal - - - 0 869 7 79 955 862 11 109 982<br />
21 Mandya 1678 42 65 1785 1859 34 185 2078 1853 37 214 2104<br />
22 Mysore 2420 148 153 2721 1873 107 203 2183 1916 119 304 2339<br />
23 Raichur 1511 30 46 1587 1107 18 109 1234 1214 20 169 1403<br />
24 Shimoga 2164 50 103 2317 1881 42 166 2089 1925 62 172 2159<br />
25 Tumkur 2853 44 121 3018 3520 60 187 3767 3525 58 295 3878<br />
26 Udupi - - - - 588 246 37 871 614 237 71 922<br />
27 Uttara Kannada 1599 26 28 1653 2086 23 53 2162 2152 38 74 2264<br />
<strong>Karnataka</strong> 35968 2004 2245 40217 41981 2309 4679 48969 43447 2510 5947 51904<br />
Source: Commissioner for Public Instructions (CPI), <strong>Karnataka</strong>.<br />
350
<strong>Karnataka</strong> <strong>Human</strong> <strong>Development</strong> <strong>Report</strong> <strong>2005</strong><br />
4. Education Profile<br />
District<br />
Management-wise primary schools (standard - I-VII) in percentage<br />
1990-91 1998-99 2003-04 (I - VIII)<br />
Govt. Aided Unaided Govt. Aided Unaided Govt. Aided Unaided<br />
1 35 36 37 38 39 40 41 42 43<br />
1 Bagalkot - - - 85.39 2.67 11.94 83.75 3.38 12.87<br />
2 Bangalore Rural 96.71 0.87 2.42 92.74 1.00 6.27 91.00 1.43 7.57<br />
3 Bangalore Urban 51.21 22.07 26.72 45.04 18.58 36.38 43.74 17.52 38.74<br />
4 Belgaum 95.59 1.54 2.87 87.84 1.03 11.12 86.75 2.02 11.23<br />
5 Bellary 92.31 2.47 5.23 84.52 3.42 12.06 82.47 3.69 13.84<br />
6 Bidar 80.13 8.73 11.15 81.58 14.21 4.22 73.91 12.73 13.36<br />
7 Bijapur 90.78 4.14 5.08 85.47 6.71 7.82 83.54 6.37 10.10<br />
8 Chamarajnagar - - - 88.93 3.81 7.26 87.25 4.43 8.31<br />
9 Chikmaglur 96.40 1.58 2.02 92.27 1.15 6.59 91.63 1.24 7.13<br />
10 Chitradurga 89.10 2.37 8.53 88.83 3.09 8.08 89.62 3.36 7.03<br />
11 Dakshina Kannada 70.80 26.99 2.22 75.30 19.76 4.94 70.84 16.63 12.53<br />
12 Davangere - - - 84.32 5.83 9.85 79.86 6.62 13.52<br />
13 Dharwad 92.79 2.88 4.32 82.96 5.72 11.32 79.89 7.58 12.53<br />
14 Gadag - - - 86.96 1.88 11.16 84.46 3.11 12.43<br />
15 Gulbarga 88.08 7.37 4.55 83.61 7.29 9.10 86.47 5.09 8.44<br />
16 Hassan 95.25 1.13 3.63 91.20 1.32 7.48 91.09 1.38 7.53<br />
17 Haveri - - - 92.39 1.61 6.01 91.59 1.80 6.61<br />
18 Kodagu 90.09 3.46 6.45 87.05 2.64 10.31 83.27 2.45 14.29<br />
19 Kolar 93.60 1.89 4.51 90.07 1.67 8.25 86.95 2.54 10.51<br />
20 Koppal - - - 90.99 0.73 8.27 87.78 1.12 11.10<br />
21 Mandya 94.01 2.35 3.64 89.46 1.64 8.90 88.07 1.76 10.17<br />
22 Mysore 88.94 5.44 5.62 85.80 4.90 9.30 81.92 5.09 13.00<br />
23 Raichur 95.21 1.89 2.90 89.71 1.46 8.83 86.53 1.43 12.05<br />
24 Shimoga 93.40 2.16 4.45 90.04 2.01 7.95 89.16 2.87 7.97<br />
25 Tumkur 94.53 1.46 4.01 93.44 1.59 4.96 90.90 1.50 7.61<br />
26 Udupi 96.73 1.57 1.69 96.48 1.06 2.45 95.05 1.68 3.27<br />
27 Uttara Kannada - - - 67.51 28.24 4.25 66.59 25.71 7.70<br />
<strong>Karnataka</strong> 89.43 4.98 5.58 85.73 4.72 9.56 83.71 4.84 11.46<br />
Source: Computed based on CPI data.<br />
351
Appendix: Statistical Tables<br />
4. Education Profile<br />
District<br />
High schools by management<br />
1990-91 1998-99 2003-04<br />
Govt. Private Total Govt. Private Total Govt. Private Total<br />
Aided Unaided Aided Unaided Aided Unaided<br />
1 44 45 46 47 48 49 50 51 52 53 54 55<br />
1 Bagalkot - - - 102 58 72 77 207 97 79 91 267<br />
2 Bangalore Rural 49 70 45 164 83 83 121 287 117 88 142 347<br />
3 Bangalore Urban 62 217 161 440 85 237 602 924 103 235 841 1179<br />
4 Belgaum 52 181 70 303 124 260 164 548 163 271 202 636<br />
5 Bellary 57 65 19 117 60 49 52 161 113 62 96 271<br />
6 Bidar 56 55 29 140 81 67 123 271 111 64 111 286<br />
7 Bijapur 38 123 82 141 56 83 127 266 83 131 89 303<br />
8 Chamarajnagar - - - 61 31 35 44 110 51 32 59 142<br />
9 Chikmaglur 31 67 25 123 82 90 60 232 84 92 60 236<br />
10 Chitradurga 60 154 42 164 49 111 63 223 131 125 137 393<br />
11 Dakshina<br />
89 132 22 135 116 169 123 408 118 104 93 315<br />
Kannada<br />
12 Davangere - - - 167 76 113 38 227 83 141 94 318<br />
13 Dharwad 83 196 68 124 33 77 66 176 46 93 61 200<br />
14 Gadag - - - 90 46 71 47 164 54 70 56 180<br />
15 Gulbarga 96 34 24 154 165 53 140 358 251 24 70 345<br />
16 Hassan 88 64 52 204 117 82 90 289 185 89 111 385<br />
17 Haveri - - - 133 51 80 68 199 76 94 68 238<br />
18 Kodagu 19 35 9 63 22 38 21 81 36 46 38 120<br />
19 Kolar 85 59 29 173 118 50 138 306 183 61 150 394<br />
20 Koppal - - - 56 55 17 20 92 90 22 31 143<br />
21 Mandya 55 46 15 116 102 63 110 275 155 68 96 319<br />
22 Mysore 118 101 33 191 105 86 145 336 156 85 169 410<br />
23 Raichur 57 35 17 53 52 13 33 98 103 20 81 204<br />
24 Shimoga 90 109 14 162 84 75 106 265 125 88 121 334<br />
25 Tumkur 77 180 81 338 99 195 145 439 155 249 189 593<br />
26 Udupi - - - 108 51 50 28 129 87 64 49 200<br />
27 Uttara Kannada 40 122 8 170 63 124 47 234 73 124 57 254<br />
<strong>Karnataka</strong> 1302 2045 845 4192 2064 2443 2798 7305 3029 2621 3362 9012<br />
Source: Commissioner for Public Instructions, <strong>Karnataka</strong>.<br />
352
<strong>Karnataka</strong> <strong>Human</strong> <strong>Development</strong> <strong>Report</strong> <strong>2005</strong><br />
4. Education Profile<br />
District<br />
Percentage of high schools by management<br />
1990-91 1998-99 2003-04<br />
Govt. Aided Unaided Govt. Aided Unaided Govt. Aided Unaided<br />
1 56 57 58 59 60 61 62 63 64<br />
1 Bagalkot - - - 28.02 34.78 37.20 36.33 29.59 34.08<br />
2 Bangalore Rural 29.88 42.68 27.44 28.92 28.92 42.16 33.72 25.36 40.92<br />
3 Bangalore Urban 14.09 49.32 36.59 9.20 25.65 65.15 8.74 19.93 71.33<br />
4 Belgaum 17.16 59.74 23.10 22.63 47.45 29.93 25.63 42.61 31.76<br />
5 Bellary 40.43 46.10 13.48 37.27 30.43 32.30 41.70 22.88 35.42<br />
6 Bidar 40.00 39.29 20.71 29.89 24.72 45.39 38.81 22.38 38.81<br />
7 Bijapur 15.64 50.62 33.74 21.05 31.20 47.74 27.39 43.23 29.37<br />
8 Chamarajnagar - - - 28.18 31.82 40.00 35.92 22.54 41.55<br />
9 Chikmaglur 25.20 54.47 20.33 35.34 38.79 25.86 35.59 38.98 25.42<br />
10 Chitradurga 23.44 60.16 16.41 21.97 49.78 28.25 33.33 31.81 34.86<br />
11 Dakshina Kannada 36.63 54.32 9.05 28.43 41.42 30.15 37.46 33.02 29.52<br />
12 Davangere - - - 33.48 49.78 16.74 26.10 44.34 29.56<br />
13 Dharwad 23.92 56.48 19.60 18.75 43.75 37.50 23.00 46.50 30.50<br />
14 Gadag - - - 28.05 43.29 28.66 30.00 38.89 31.11<br />
15 Gulbarga 62.34 22.08 15.58 46.09 14.80 39.11 72.75 6.96 20.29<br />
16 Hassan 43.14 31.37 25.49 40.48 28.37 31.14 48.05 23.12 28.83<br />
17 Haveri - - - 25.63 40.20 34.17 31.93 39.50 28.57<br />
18 Kodagu 30.16 55.56 14.29 27.16 46.91 25.93 30.00 38.33 31.67<br />
19 Kolar 49.13 34.10 16.76 38.56 16.34 45.10 46.45 15.48 38.07<br />
20 Koppal - - - 59.78 18.48 21.74 62.94 15.38 21.68<br />
21 Mandya 47.41 39.66 12.93 37.09 22.91 40.00 48.59 21.32 30.09<br />
22 Mysore 46.83 40.08 13.10 31.25 25.60 43.15 38.05 20.73 41.22<br />
23 Raichur 52.29 32.11 15.60 53.06 13.27 33.67 50.49 9.80 39.71<br />
24 Shimoga 42.25 51.17 6.57 31.70 28.30 40.00 37.43 26.35 36.23<br />
25 Tumkur 22.78 53.25 23.96 22.55 44.42 33.03 26.14 41.99 31.87<br />
26 Udupi - - - 39.53 38.76 21.71 43.50 32.00 24.50<br />
27 Uttara Kannada 23.53 71.76 4.71 26.92 52.99 20.09 28.74 48.82 22.44<br />
<strong>Karnataka</strong> 31.06 48.78 20.16 28.25 33.44 38.30 33.61 29.08 37.31<br />
Source: Computed based on CPI data.<br />
353
Appendix: Statistical Tables<br />
4. Education Profile<br />
District<br />
Enrolment of students in primary schools (All) (standard I - VIII)<br />
1990-91 (I - VII) 1998-99 2000-01 2003-04<br />
Boys Girls Total Boys Girls Total Boys Girls Total Boys Girls Total<br />
1 65 66 67 68 69 70 71 72 73 74 75 76<br />
1 Bagalkot 124279 93754 218033 126857 129499 256356 167120 141451 308571 168396 150962 319358<br />
2 Bangalore 148109 125678 273787 157084 149188 306272 129666 147457 277123 144917 136559 281476<br />
Rural<br />
3 Bangalore 365630 350707 716337 557351 538260 1095611 622378 624917 1247295 453170 464011 917181<br />
Urban<br />
4 Belgaum 280544 241476 522020 344573 304151 648724 410739 374155 784894 410834 357966 768800<br />
5 Bellary 138559 116380 254939 187594 154728 342322 204018 171412 375430 193418 177108 370526<br />
6 Bidar 145978 92017 237995 162908 139065 301973 178317 170891 349208 191518 175536 367054<br />
7 Bijapur 108938 92352 201290 196846 163340 360186 179051 166826 345877 213597 186464 400061<br />
8 Chamaraj 61426 54059 115485 74364 64846 139210 72548 71012 143560 76862 71187 148049<br />
nagar<br />
9 Chikmaglur 79255 74190 153445 91158 82636 173794 93475 87163 180638 91472 84199 175671<br />
10 Chitradurga 111457 102555 214012 146167 132250 278417 141947 133957 275904 147990 132866 280856<br />
11 Dakshina 158794 156899 315693 154948 149571 304519 171075 148548 319623 171986 153616 325602<br />
Kannada<br />
12 Davangere 143435 134109 277544 161338 151689 313027 181491 137944 319435 169863 157876 327739<br />
13 Dharwad 111381 97120 208501 139180 119781 258961 155112 127059 282171 151796 140049 291845<br />
14 Gadag 71837 67301 139138 86962 78152 165114 107072 95839 202911 93171 86591 179762<br />
15 Gulbarga 202420 134378 336798 313271 254705 567976 345834 289825 635659 373766 335539 709305<br />
16 Hassan 123928 111510 235438 129036 126226 255262 144566 134376 278942 128631 122811 251442<br />
17 Haveri 106141 84212 190353 98106 75077 173183 125076 118078 243154 136649 127579 264228<br />
18 Kodagu 42849 37209 80058 43724 40043 83767 46375 43731 90106 43594 41990 85584<br />
19 Kolar 202367 170644 373011 211351 193704 405055 236409 220148 456557 233535 217596 451131<br />
20 Koppal 59555 48944 108499 100108 81239 181347 116030 96788 212818 126694 111941 238635<br />
21 Mandya 136291 118366 254657 151275 134192 285467 144520 148431 292951 131175 122543 253718<br />
22 Mysore 167449 152537 319986 204159 182907 387066 215996 179728 395724 213127 197656 410783<br />
23 Raichur 87695 61904 149599 123379 85304 208683 157328 122862 280190 164286 147257 311543<br />
24 Shimoga 117294 111439 228733 126075 134858 260933 145697 125627 271324 133964 123098 257062<br />
25 Tumkur 204832 176933 381765 207546 197136 404682 217873 197891 415764 204741 183717 388458<br />
26 Udupi 160460 112432 272892 157250 112158 269408 97342 95308 192650 85347 79546 164893<br />
27 Uttara 107673 95217 202890 119107 110350 229457 125411 105099 230510 114595 109187 223782<br />
Kannada<br />
<strong>Karnataka</strong> 3768576 3214322 6982898 4571717 4085055 8656772 4932466 4476523 9408989 4769094 4395450 9164544<br />
Source: Col. 65 to 66: Computed based on taluk-wise fi gures of CPI, <strong>Karnataka</strong>.<br />
354
<strong>Karnataka</strong> <strong>Human</strong> <strong>Development</strong> <strong>Report</strong> <strong>2005</strong><br />
4. Education Profile<br />
District<br />
Enrolment of students in primary schools (SC) (standard I - VIII)<br />
1990-91 (I-VII) 1998-99 2000-01 2003-04<br />
Boys Girls Total Boys Girls Total Boys Girls Total Boys Girls Total<br />
1 77 78 79 80 81 82 83 84 85 86 87 88<br />
1 Bagalkot 21557 16262 37819 30401 26129 56530 31004 27819 58823<br />
2 Bangalore<br />
Rural<br />
3 Bangalore<br />
Urban<br />
14957 10838 25795 34677 32629 67306 34679 33473 68152 40145 32306 72451<br />
52271 50029 102300 105429 101655 207084 107859 101352 209211 108072 102951 211023<br />
4 Belgaum 33542 23822 57364 46398 40284 86682 49561 44262 93823 48625 39934 88559<br />
5 Bellary 30071 15675 45746 36745 27537 64282 41958 33891 75849 51322 37799 89121<br />
6 Bidar 18461 13373 31834 36787 32479 69266 45741 36677 82418 50264 42714 92978<br />
7 Bijapur 37884 24433 62317 41319 32301 73620 45490 36093 81583 51947 37996 89943<br />
8 Chamaraj<br />
20574 20557 41131 21703 20069 41772 20485 19638 40123<br />
nagar<br />
9 Chikmaglur 10179 8591 18770 19786 18305 38091 21024 18631 39655 22283 20259 42542<br />
10 Chitradurga 31311 21858 53169 35602 32285 67887 35293 34848 70141 38320 34642 72962<br />
11 Dakshina 16256 13323 29579 11457 11414 22871 12213 10384 22597 12000 10334 22334<br />
Kannada<br />
12 Davangere 40207 34420 74627 36939 23841 60780 32712 28341 61053<br />
13 Dharwad 27957 20929 48886 11480 11279 22759 15219 14225 29444 16391 14373 30764<br />
14 Gadag 15270 12177 27447 15893 18477 34370 19134 14093 33227<br />
15 Gulbarga 28111 14410 42521 86248 71471 157719 89068 74219 163287 93324 79158 172482<br />
16 Hassan 13546 10043 23589 27940 24250 52190 29287 27927 57214 28339 25630 53969<br />
17 Haveri 19119 14999 34118 19559 17612 37171 20874 17641 38515<br />
18 Kodagu 4641 3511 8152 5434 4891 10325 8112 5409 13521 7187 6361 13548<br />
19 Kolar 37006 28584 65590 62924 57396 120320 70496 65952 136448 74476 64588 139064<br />
20 Koppal 16068 12696 28764 22390 17334 39724 22462 18881 41343<br />
21 Mandya 11244 9158 20402 23296 21230 44526 21249 20240 41489 23771 23206 46977<br />
22 Mysore 37905 30598 68503 42961 40133 83094 44287 40350 84637 40419 36837 77256<br />
23 Raichur 20551 10321 30872 24221 19049 43270 36645 24218 60863 43906 36014 79920<br />
24 Shimoga 21099 15709 36808 30310 26835 57145 40417 37561 77978 26543 24635 51178<br />
25 Tumkur 22820 16531 39351 43584 38795 82379 44954 39858 84812 51922 39257 91179<br />
26 Udupi 8595 7722 16317 19229 17419 36648 6571 5643 12214<br />
27 Uttara 6631 5399 12030 10858 9684 20542 10203 10545 20748 11249 10139 21388<br />
Kannada<br />
<strong>Karnataka</strong> 476443 347135 823578 878846 772735 1651581 969869 850996 1820865 993747 851189 1844936<br />
Source: Commissioner for Public Instruction, <strong>Karnataka</strong>.<br />
355
Appendix: Statistical Tables<br />
4. Education Profile<br />
District<br />
Enrolment of students in primary schools (ST) (standard I - VIII)<br />
1990-91 (I - VII) 1998-99 2000-01 2003-04<br />
Boys Girls Total Boys Girls Total Boys Girls Total Boys Girls Total<br />
1 89 90 91 92 93 94 95 96 97 98 99 100<br />
1 Bagalkot 5187 3843 9030 8846 7319 16165 8988 7944 16932<br />
2 Bangalore<br />
Rural<br />
3 Bangalore<br />
Urban<br />
11374 7368 18742 5795 5445 11240 6370 5819 12189 5695 5474 11169<br />
9711 9326 19037 23725 22648 46373 23715 21973 45688 16881 15920 32801<br />
4 Belgaum 3765 2925 6690 21786 17860 39646 19806 18775 38581 25523 22942 48465<br />
5 Bellary 10267 6760 17027 32147 25459 57606 35836 29729 65565 41217 33378 74595<br />
6 Bidar 400 243 643 5420 4285 9705 10584 9893 20477 17185 17394 34579<br />
7 Bijapur 1988 1173 3161 4588 3975 8563 9782 8224 18006 4521 3623 8144<br />
8 Chamaraj<br />
7505 6775 14280 8571 7105 15676 7849 6733 14582<br />
nagar<br />
9 Chikmaglur 2944 2376 5320 3942 3096 7038 3528 3314 6842 3727 3520 7247<br />
10 Chitradurga 34191 25192 59383 26925 23590 50515 24199 21625 45824 26326 24556 50882<br />
11 Dakshina 14177 11930 26107 6077 5813 11890 7060 5661 12721 6762 6302 13064<br />
Kannada<br />
12 Davangere 19154 18784 37938 21943 9518 31461 16201 16815 33016<br />
13 Dharwad 3963 2748 6711 4908 4546 9454 7814 7082 14896 7849 7653 15502<br />
14 Gadag 7340 6278 13618 7645 8454 16099 6175 5287 11462<br />
15 Gulbarga 991 518 1509 6018 5120 11138 7793 6257 14050 16030 11071 27101<br />
16 Hassan 3301 2201 5502 2699 2376 5075 2455 2482 4937 2487 2379 4866<br />
17 Haveri 14009 12208 26217 11498 10505 22003 12374 11619 23993<br />
18 Kodagu 2239 1880 4119 1866 2028 3894 2930 2667 5597 4095 3476 7571<br />
19 Kolar 15909 11844 27753 18526 16483 35009 24122 23269 47391 20290 19198 39488<br />
20 Koppal 13385 9436 22821 14015 11288 25303 15285 14430 29715<br />
21 Mandya 2203 1734 3937 2237 2004 4241 2179 1914 4093 1922 2033 3955<br />
22 Mysore 9966 6423 16389 20255 17746 38001 29888 25874 55762 23911 21085 44996<br />
23 Raichur 6255 3129 9384 21037 13176 34213 24745 18619 43364 40901 29262 70163<br />
24 Shimoga 7810 6647 14457 5563 5715 11278 6228 7570 13798 5453 5421 10874<br />
25 Tumkur 18855 16043 34898 17940 16429 34369 17892 15624 33516 14001 11694 25695<br />
26 Udupi 6095 4397 10492 3884 4644 8528 4258 4123 8381<br />
27 Uttara 830 673 1503 1766 1489 3255 1519 1314 2833 2447 2307 4754<br />
Kannada<br />
<strong>Karnataka</strong> 161139 121133 282272 305895 261004 566899 344847 296518 641365 358353 315639 673992<br />
Source: Commissioner for Public Instruction, <strong>Karnataka</strong>.<br />
356
<strong>Karnataka</strong> <strong>Human</strong> <strong>Development</strong> <strong>Report</strong> <strong>2005</strong><br />
4. Education Profile<br />
District Growth of enrolment in primary schools (all) (percentage)<br />
1990-91 to<br />
2000-01<br />
All Boys Girls<br />
1998-99 to<br />
2003-04<br />
1990-91 to<br />
2000-01<br />
1998-99 to<br />
2003-04<br />
1990-91 to<br />
2000-01<br />
1998-99 to<br />
2003-04<br />
1 101 102 103 104 105 106<br />
1 Bagalkot 41.53 24.58 34.47 32.74 50.87 16.57<br />
2 Bangalore Rural 1.22 -8.10 -12.45 -7.75 17.33 -8.47<br />
3 Bangalore Urban 74.12 -16.29 70.22 -18.69 78.19 -13.79<br />
4 Belgaum 50.36 18.51 46.41 19.23 54.95 17.69<br />
5 Bellary 47.26 8.24 47.24 3.10 47.29 14.46<br />
6 Bidar 46.73 21.55 22.15 17.56 85.72 26.23<br />
7 Bijapur 71.83 11.07 64.36 8.51 80.64 14.16<br />
8 Chamarajnagar 24.31 6.35 18.11 3.36 31.36 9.78<br />
9 Chikmaglur 17.72 1.08 17.94 0.34 17.49 1.89<br />
10 Chitradurga 28.92 0.88 27.36 1.25 30.62 0.47<br />
11 Dakshina Kannada 1.24 6.92 7.73 11.00 (5.32) 2.70<br />
12 Davangere 15.09 4.70 26.53 5.28 2.86 4.08<br />
13 Dharwad 35.33 12.70 39.26 9.06 30.83 16.92<br />
14 Gadag 45.83 8.87 49.05 7.14 42.40 10.80<br />
15 Gulbarga 88.74 24.88 70.85 19.31 115.68 31.74<br />
16 Hassan 18.48 -1.50 16.65 -0.31 20.51 -2.71<br />
17 Haveri 27.74 52.57 17.84 39.29 40.22 69.93<br />
18 Kodagu 12.55 2.17 8.23 -0.30 17.53 4.86<br />
19 Kolar 22.40 11.38 16.82 10.50 29.01 12.33<br />
20 Koppal 96.15 31.59 94.83 26.56 97.75 37.79<br />
21 Mandya 15.04 -11.12 6.04 -13.29 25.40 -8.68<br />
22 Mysore 23.67 6.13 28.99 4.39 17.83 8.06<br />
23 Raichur 87.29 49.29 79.40 33.16 98.47 72.63<br />
24 Shimoga 18.62 -1.48 24.22 6.26 12.73 -8.72<br />
25 Tumkur 8.91 -4.01 6.37 -1.35 11.85 -6.81<br />
26 Udupi -29.40 -38.79 -39.34 -45.73 -15.23 -29.08<br />
27 Uttara Kannada 13.61 -2.47 16.47 -3.79 10.38 -1.05<br />
<strong>Karnataka</strong> 34.74 5.87 30.88 4.32 39.27 7.60<br />
Source: Commissioner for Public Instructions, <strong>Karnataka</strong>.<br />
357
Appendix: Statistical Tables<br />
4. Education Profile<br />
District Growth of SC enrolment in primary schools (%) Growth of ST enrolment in primary schools (%)<br />
Total Boys Girls Total Boys Girls<br />
1998-99 to<br />
2003-04<br />
1998-99 to<br />
2003-04<br />
1998-99 to<br />
2003-04<br />
1998-99 to<br />
2003-04<br />
1998-99 to<br />
2003-04<br />
1998-99 to<br />
2003-04<br />
1 107 108 109 110 111 112<br />
1 Bagalkot 55.54 43.82 71.07 87.51 73.28 106.71<br />
2 Bangalore Rural 7.64 15.77 -0.99 -0.63 -1.73 0.53<br />
3 Bangalore Urban 1.90 2.51 1.28 -29.27 -28.85 -29.71<br />
4 Belgaum 2.17 4.80 -0.87 22.24 17.15 28.45<br />
5 Bellary 38.64 39.67 37.27 29.49 28.21 31.11<br />
6 Bidar 34.23 36.64 31.51 256.30 217.07 305.93<br />
7 Bijapur 22.17 25.72 17.63 -4.89 -1.46 -8.86<br />
8 Chamarajnagar -2.45 -0.43 -4.47 2.11 4.58 -0.62<br />
9 Chikmaglur 11.69 12.62 10.67 2.97 -5.45 13.70<br />
10 Chitradurga 7.48 7.63 7.30 0.73 -2.22 4.10<br />
11 Dakshina Kannada -2.35 4.74 -9.46 9.87 11.27 8.41<br />
12 Davangere -18.19 -18.64 -17.66 -12.97 -15.42 -10.48<br />
13 Dharwad 35.17 42.78 27.43 63.97 59.92 68.35<br />
14 Gadag 21.06 25.30 15.73 -15.83 -15.87 -15.79<br />
15 Gulbarga 9.36 8.20 10.76 143.32 166.37 116.23<br />
16 Hassan 3.41 1.43 5.69 -4.12 -7.85 0.13<br />
17 Haveri 12.89 9.18 17.61 -8.48 -11.67 -4.82<br />
18 Kodagu 31.22 32.26 30.06 94.43 119.45 71.40<br />
19 Kolar 15.58 18.36 12.53 12.79 9.52 16.47<br />
20 Koppal 43.73 39.79 48.72 30.21 14.20 52.93<br />
21 Mandya 5.50 2.04 9.31 -6.74 -14.08 1.45<br />
22 Mysore -7.03 -5.92 -8.21 18.41 18.05 18.82<br />
23 Raichur 84.70 81.27 89.06 105.08 94.42 122.09<br />
24 Shimoga -10.44 -12.43 -8.20 -3.58 -1.98 -5.14<br />
25 Tumkur 10.68 19.13 1.19 -25.24 -21.96 -28.82<br />
26 Udupi -25.15 -23.55 -26.92 -20.12 -30.14 -6.23<br />
27 Uttara Kannada 4.12 3.60 4.70 46.05 38.56 54.94<br />
<strong>Karnataka</strong> 11.71 13.07 10.15 18.89 17.15 20.93<br />
Source: Commissioner for Public Instruction, <strong>Karnataka</strong>.<br />
358
<strong>Karnataka</strong> <strong>Human</strong> <strong>Development</strong> <strong>Report</strong> <strong>2005</strong><br />
4. Education Profile<br />
District Enrolment of students in high schools (all) (standard IX - X)<br />
1990-91 (VIII - X) 1998-99<br />
Boys Girls Total Boys Girls Total<br />
1 113 114 115 116 117 118<br />
1 Bagalkot 13055 7030 20085 12899 6945 19844<br />
2 Bangalore Rural 32370 18560 50930 18223 16876 35099<br />
3 Bangalore Urban 72804 66930 139734 62463 65653 128116<br />
4 Belgaum 60218 31421 91639 49977 34433 84410<br />
5 Bellary 16288 9686 25974 17971 10682 28653<br />
6 Bidar 12995 5342 18337 12588 10104 22692<br />
7 Bijapur 16928 10075 27003 27378 16264 43642<br />
8 Chamarajnagar 9822 7699 17521 9489 7397 16886<br />
9 Chikmaglur 12269 10818 23087 12053 9809 21862<br />
10 Chitradurga 19892 14914 34806 19125 14496 33621<br />
11 Dakshina Kannada 22706 18971 41677 23593 20677 44270<br />
12 Davangere 17396 16162 33558 10178 8519 18697<br />
13 Dharwad 16315 12934 29249 13596 11754 25350<br />
14 Gadag 11058 6503 17561 14999 9025 24024<br />
15 Gulbarga 19003 9841 28844 23085 18033 41118<br />
16 Hassan 21170 16296 37466 18655 14836 33491<br />
17 Haveri 14451 8461 22912 20138 11959 32097<br />
18 Kodagu 8790 7827 16617 5572 5853 11425<br />
19 Kolar 30035 19552 49587 27332 21196 48528<br />
20 Koppal 5777 3644 9421 7459 4865 12324<br />
21 Mandya 22825 15440 38265 20556 19215 39771<br />
22 Mysore 33887 23403 57290 29997 19709 49706<br />
23 Raichur 6443 3078 9521 11416 5517 16933<br />
24 Shimoga 14532 17582 32114 13915 20130 34045<br />
25 Tumkur 36671 23396 60067 38937 30171 69108<br />
26 Udupi 17064 16362 33426 12867 12179 25046<br />
27 Uttara Kannada 17167 13850 31017 14131 12555 26686<br />
<strong>Karnataka</strong> 581931 415777 997708 548592 438852 987444<br />
Sources:<br />
1. Col. 113 to 115: Computed based on taluk-wise fi gures of CPI.<br />
2. Col. 116 to 118: CPI.<br />
359
Appendix: Statistical Tables<br />
4. Education Profile<br />
District Enrolment of students in high schools (all) (standard IX - X)<br />
2000-01 2003-04<br />
Boys Girls Total Boys Girls Total<br />
1 119 120 121 122 123 124<br />
1 Bagalkot 18273 10938 29211 21275 14878 36153<br />
2 Bangalore Rural 18260 22631 40891 24943 24802 49745<br />
3 Bangalore Urban 72966 78777 151743 68752 70890 139642<br />
4 Belgaum 51808 38964 90772 65939 47347 113286<br />
5 Bellary 20031 13652 33683 22597 15851 38448<br />
6 Bidar 16266 12955 29221 22149 20910 43059<br />
7 Bijapur 30534 13394 43928 29853 23253 53106<br />
8 Chamarajnagar 4006 8620 12626 11467 9723 21190<br />
9 Chikmaglur 12247 11484 23731 14266 14097 28363<br />
10 Chitradurga 19825 18804 38629 20041 18021 38062<br />
11 Dakshina Kannada 21512 21300 42812 22901 21854 44755<br />
12 Davangere 20425 14882 35307 25279 23736 49015<br />
13 Dharwad 33961 17083 51044 20794 19135 39929<br />
14 Gadag 13564 10841 24405 13754 9866 23620<br />
15 Gulbarga 32765 18667 51432 27405 20338 47743<br />
16 Hassan 25943 19709 45652 22605 24790 47395<br />
17 Haveri 20655 16341 36996 20461 16704 37165<br />
18 Kodagu 7906 10269 18175 9755 9571 19326<br />
19 Kolar 75960 30008 105968 50268 44252 94520<br />
20 Koppal 11551 6966 18517 11785 7879 19664<br />
21 Mandya 25969 21917 47886 24127 23386 47513<br />
22 Mysore 33069 36371 69440 34132 23915 58047<br />
23 Raichur 12674 7201 19875 14338 11158 25496<br />
24 Shimoga 23614 17654 41268 23962 21705 45667<br />
25 Tumkur 49940 28657 78597 47215 39223 86438<br />
26 Udupi 15585 16413 31998 15692 17127 32819<br />
27 Uttara Kannada 16881 13137 30018 16346 15736 32082<br />
<strong>Karnataka</strong> 706190 537635 1243825 686893 597244 1284137<br />
Source: Commissioner for Public Instruction, <strong>Karnataka</strong>.<br />
360
<strong>Karnataka</strong> <strong>Human</strong> <strong>Development</strong> <strong>Report</strong> <strong>2005</strong><br />
4. Education Profile<br />
District Enrolment of SC students in high schools (standard IX - X)<br />
1990-91 (VIII - X) 1998-99<br />
Boys Girls Total Boys Girls Total<br />
1 125 126 127 128 129 130<br />
1 Bagalkot 1708 618 2326<br />
2 Bangalore Rural 2976 1176 4152 3519 3078 6597<br />
3 Bangalore Urban 8321 6486 14807 17370 15613 32983<br />
4 Belgaum 3918 1505 5423 5247 3017 8264<br />
5 Bellary 1693 602 2295 2276 1120 3396<br />
6 Bidar 3276 1369 4645 2848 2087 4935<br />
7 Bijapur 4879 1228 6107 4625 3037 7662<br />
8 Chamarajnagar 2401 3538 5939<br />
9 Chikmaglur 1065 520 1585 1539 1120 2659<br />
10 Chitradurga 5887 2829 8716 3871 3121 6992<br />
11 Dakshina Kannada 1428 1065 2493 1321 1121 2442<br />
12 Davangere 3733 2263 5996<br />
13 Dharwad 3578 2014 5592 985 676 1661<br />
14 Gadag 1661 992 2653<br />
15 Gulbarga 3009 673 3682 4252 1928 6180<br />
16 Hassan 1825 730 2555 3212 2081 5293<br />
17 Haveri 4236 2580 6816<br />
18 Kodagu 502 438 940 429 375 804<br />
19 Kolar 4606 2862 7468 6507 4644 11151<br />
20 Koppal 692 359 1051<br />
21 Mandya 2208 1240 3448 3062 2339 5401<br />
22 Mysore 4533 2146 6679 4813 3813 8626<br />
23 Raichur 1325 394 1719 548 139 687<br />
24 Shimoga 2099 1118 3217 2292 1750 4042<br />
25 Tumkur 4039 2204 6243 5208 3246 8454<br />
26 Udupi 402 362 764<br />
27 Uttara Kannada 581 407 988 930 737 1667<br />
<strong>Karnataka</strong> 61748 31006 92754 89687 65754 155441<br />
Source: Commissioner for Public Instruction, <strong>Karnataka</strong>.<br />
361
Appendix: Statistical Tables<br />
4. Education Profile<br />
District Enrolment of SC students in high schools (standard IX - X)<br />
2000-01 2003-04<br />
Boys Girls Total Boys Girls Total<br />
1 131 132 133 134 135 136<br />
1 Bagalkot 2106 2329 4435 3384 2064 5448<br />
2 Bangalore Rural 3754 3868 7622 5050 4668 9718<br />
3 Bangalore Urban 13945 13682 27627 16034 15922 31956<br />
4 Belgaum 5005 3802 8807 6025 3582 9607<br />
5 Bellary 3010 1477 4487 3701 1906 5607<br />
6 Bidar 3271 2315 5586 5439 4007 9446<br />
7 Bijapur 4486 3504 7990 4269 2159 6428<br />
8 Chamarajnagar 3456 2969 6425 3470 3318 6788<br />
9 Chikmaglur 1752 2309 4061 2392 2163 4555<br />
10 Chitradurga 4442 3118 7560 3623 3584 7207<br />
11 Dakshina Kannada 1053 588 1641 1179 1210 2389<br />
12 Davangere 3121 2199 5320 3902 3031 6933<br />
13 Dharwad 1607 1213 2820 1800 1713 3513<br />
14 Gadag 1444 2203 3647 1537 879 2416<br />
15 Gulbarga 4637 3137 7774 5493 3569 9062<br />
16 Hassan 3049 3571 6620 4131 3768 7899<br />
17 Haveri 2938 1993 4931 2328 1430 3758<br />
18 Kodagu 521 513 1034 1100 1029 2129<br />
19 Kolar 9070 8903 17973 9131 8422 17553<br />
20 Koppal 1271 671 1942 3453 930 4383<br />
21 Mandya 3745 2846 6591 3222 3807 7029<br />
22 Mysore 11397 8232 19629 17495 16571 34066<br />
23 Raichur 920 426 1346 2442 2238 4680<br />
24 Shimoga 11042 10058 21100 3102 2808 5910<br />
25 Tumkur 5947 4382 10329 6580 4100 10680<br />
26 Udupi 681 707 1388 751 817 1568<br />
27 Uttara Kannada 1077 1159 2236 3009 1241 4250<br />
<strong>Karnataka</strong> 108747 92174 200921 124042 100936 224978<br />
Source: Commissioner for Public Instruction, <strong>Karnataka</strong>.<br />
362
<strong>Karnataka</strong> <strong>Human</strong> <strong>Development</strong> <strong>Report</strong> <strong>2005</strong><br />
4. Education Profile<br />
District Enrolment of ST students in high schools (IX - X)<br />
1990-91 (VIII - X) 1998-99<br />
Boys Girls Total Boys Girls Total<br />
1 137 138 139 140 141 142<br />
1 Bagalkot 483 170 653<br />
2 Bangalore Rural 525 252 777 797 636 1433<br />
3 Bangalore Urban 1062 844 1906 4325 4813 9138<br />
4 Belgaum 138 117 255 1100 737 1837<br />
5 Bellary 402 86 488 2053 935 2988<br />
6 Bidar 725 445 1170 627 488 1115<br />
7 Bijapur 288 62 350 773 369 1142<br />
8 Chamarajnagar 580 416 996<br />
9 Chikmaglur 99 55 154 317 287 604<br />
10 Chitradurga 4200 2311 6511 3455 2527 5982<br />
11 Dakshina Kannada 723 554 1277 626 575 1201<br />
12 Davangere 1710 1580 3290<br />
13 Dharwad 229 121 350 193 96 289<br />
14 Gadag 1076 725 1801<br />
15 Gulbarga 237 112 349 798 423 1221<br />
16 Hassan 221 120 341 384 301 685<br />
17 Haveri 2251 1647 3898<br />
18 Kodagu 112 100 212 181 136 317<br />
19 Kolar 880 406 1286 1735 998 2733<br />
20 Koppal 583 347 930<br />
21 Mandya 91 50 141 256 178 434<br />
22 Mysore 408 233 641 2436 1280 3716<br />
23 Raichur 109 30 139 2255 772 3027<br />
24 Shimoga 521 378 899 693 745 1438<br />
25 Tumkur 1342 842 2184 2788 1889 4677<br />
26 Udupi 220 189 409<br />
27 Uttara Kannada 50 19 69 122 83 205<br />
<strong>Karnataka</strong> 12362 7137 19499 32817 23342 56159<br />
Source: Commissioner for Public Instruction, <strong>Karnataka</strong>.<br />
363
Appendix: Statistical Tables<br />
4. Education Profile<br />
District Enrolment of ST students in high schools (standard IX - X)<br />
2000-01 2003-04<br />
Boys Girls Total Boys Girls Total<br />
1 143 144 145 146 147 148<br />
1 Bagalkot 927 1145 2072 998 603 1601<br />
2 Bangalore Rural 1004 616 1620 3810 917 4727<br />
3 Bangalore Urban 2729 2629 5358 3793 4137 7930<br />
4 Belgaum 2191 1268 3459 2482 1584 4066<br />
5 Bellary 2434 1441 3875 3291 1849 5140<br />
6 Bidar 891 504 1395 1169 1328 2497<br />
7 Bijapur 970 492 1462 845 515 1360<br />
8 Chamarajnagar 1175 777 1952 962 760 1722<br />
9 Chikmaglur 315 307 622 499 484 983<br />
10 Chitradurga 2889 1987 4876 2669 2860 5529<br />
11 Dakshina Kannada 477 510 987 855 880 1735<br />
12 Davangere 2011 1121 3132 2750 2537 5287<br />
13 Dharwad 870 672 1542 425 298 723<br />
14 Gadag 1289 925 2214 806 589 1395<br />
15 Gulbarga 403 205 608 1436 482 1918<br />
16 Hassan 418 326 744 437 419 856<br />
17 Haveri 1194 1615 2809 1740 1501 3241<br />
18 Kodagu 182 169 351 439 396 835<br />
19 Kolar 3842 2815 6657 2906 2203 5109<br />
20 Koppal 1133 593 1726 1128 811 1939<br />
21 Mandya 194 269 463 201 228 429<br />
22 Mysore 4716 3454 8170 4045 3362 7407<br />
23 Raichur 590 264 854 1960 951 2911<br />
24 Shimoga 1194 1280 2474 740 684 1424<br />
25 Tumkur 3080 2172 5252 2107 1810 3917<br />
26 Udupi 497 477 974 548 673 1221<br />
27 Uttara Kannada 129 156 285 264 256 520<br />
<strong>Karnataka</strong> 37744 28189 65933 43305 33117 76422<br />
Source: Commissioner for Public Instruction, <strong>Karnataka</strong>.<br />
364
<strong>Karnataka</strong> <strong>Human</strong> <strong>Development</strong> <strong>Report</strong> <strong>2005</strong><br />
4. Education Profile<br />
District<br />
Growth of enrolment in high<br />
schools (All) (%)<br />
Growth of SC enrolment in high<br />
schools (%)<br />
Growth of ST enrolment in high<br />
schools (%)<br />
1998-99 to 2003-04 1998-99 to 2003-04 1998-99 to 2003-04<br />
All Boys Girls All Boys Girls All Boys Girls<br />
1 149 150 151 152 153 154 155 156 157<br />
1 Bagalkot 82.19 64.94 114.23 134.22 98.13 233.98 145.18 106.63 254.71<br />
2 Bangalore Rural 41.73 36.88 46.97 47.31 43.51 51.66 229.87 378.04 44.18<br />
3 Bangalore Urban 9.00 10.07 7.98 -3.11 -7.69 1.98 -13.22 -12.30 -14.05<br />
4 Belgaum 34.21 31.94 37.50 16.25 14.83 18.73 121.34 125.64 114.93<br />
5 Bellary 34.19 25.74 48.39 65.11 62.61 70.18 72.02 60.30 97.75<br />
6 Bidar 89.75 75.95 106.95 91.41 90.98 92.00 123.95 86.44 172.13<br />
7 Bijapur 21.69 9.04 42.97 -16.11 -7.70 -28.91 19.09 9.31 39.57<br />
8 Chamarajnagar 25.49 20.85 31.45 14.30 44.52 -6.22 72.89 65.86 82.69<br />
9 Chikmaglur 29.74 18.36 43.72 71.31 55.43 93.13 62.75 57.41 68.64<br />
10 Chitradurga 13.21 4.79 24.32 3.08 -6.41 14.84 -7.57 -22.75 13.18<br />
11 Dakshina Kannada 1.10 -2.93 5.69 -2.17 -10.75 7.94 44.46 36.58 53.04<br />
12 Davangere 162.15 148.37 178.62 15.63 4.53 33.94 60.70 60.82 60.57<br />
13 Dharwad 57.51 52.94 62.80 111.50 82.74 153.40 150.17 120.21 210.42<br />
14 Gadag -1.68 -8.30 9.32 -8.93 -7.47 -11.39 -22.54 -25.09 -18.76<br />
15 Gulbarga 16.11 18.71 12.78 46.63 29.19 85.11 57.08 79.95 13.95<br />
16 Hassan 41.52 21.17 67.09 49.23 28.61 81.07 24.96 13.80 39.20<br />
17 Haveri 15.79 1.60 39.68 -44.87 -45.04 -44.57 -16.85 -22.70 -8.86<br />
18 Kodagu 69.16 75.07 63.52 164.80 156.41 174.40 163.41 142.54 191.18<br />
19 Kolar 94.77 83.92 108.78 57.41 40.33 81.35 86.94 67.49 120.74<br />
20 Koppal 59.56 58.00 61.95 317.03 398.99 159.05 108.49 93.48 133.72<br />
21 Mandya 19.47 17.37 21.71 30.14 5.23 62.76 -1.15 -21.48 28.09<br />
22 Mysore 16.78 13.78 21.34 294.92 263.49 334.59 99.33 66.05 162.66<br />
23 Raichur 50.57 25.60 102.25 581.22 345.62 1510.07 -3.83 -13.08 23.19<br />
24 Shimoga 34.14 72.20 7.82 46.21 35.34 60.46 -0.97 6.78 -8.19<br />
25 Tumkur 25.08 21.26 30.00 26.33 26.34 26.31 -16.25 -24.43 -4.18<br />
26 Udupi 31.03 21.96 40.63 105.24 86.82 125.69 198.53 149.09 256.08<br />
27 Uttara Kannada 20.22 15.67 25.34 154.95 223.55 68.39 153.66 116.39 208.43<br />
<strong>Karnataka</strong> 30.05 25.21 36.09 44.74 38.31 53.51 36.08 31.96 41.88<br />
Source: Commissioner for Public Instruction, <strong>Karnataka</strong>.<br />
365
Appendix: Statistical Tables<br />
4. Education Profile<br />
District Gross enrolment ratio - 1998-99<br />
Children in the age group 6 to
<strong>Karnataka</strong> <strong>Human</strong> <strong>Development</strong> <strong>Report</strong> <strong>2005</strong><br />
4. Education Profile<br />
District Gross enrolment ratio - 2000-01<br />
Children in the age group 6 to
Appendix: Statistical Tables<br />
4. Education Profile<br />
District Gross enrolment ratio - 2003-04<br />
Children in the age group 6 to
<strong>Karnataka</strong> <strong>Human</strong> <strong>Development</strong> <strong>Report</strong> <strong>2005</strong><br />
4. Education Profile<br />
District Gross enrolment ratio - 1998-99<br />
Children in the age group 6 to
Appendix: Statistical Tables<br />
4. Education Profile<br />
District Gross enrolment ratio - 2000-01<br />
Children in the age group 6 to
<strong>Karnataka</strong> <strong>Human</strong> <strong>Development</strong> <strong>Report</strong> <strong>2005</strong><br />
4. Education Profile<br />
District Gross enrolment ratio - 2003-04<br />
Children in the age group 6 to
Appendix: Statistical Tables<br />
4. Education Profile<br />
District Gross enrolment ratio - 1990-91<br />
Children in the age group 6 to
<strong>Karnataka</strong> <strong>Human</strong> <strong>Development</strong> <strong>Report</strong> <strong>2005</strong><br />
4. Education Profile<br />
District Gross enrolment ratio - 1998-99<br />
Children in the age group 6 to < 18 years<br />
Gross enrolment ratio of children (standard I - XII)<br />
Boys Girls Total Boys Girls Total<br />
1 200 201 202 203 204 205<br />
1 Bagalkot 229635 213080 442715 63.82 65.50 64.63<br />
2 Bangalore Rural 244275 234164 478439 74.23 72.86 73.56<br />
3 Bangalore Urban 714518 686822 1401340 92.28 93.75 93.00<br />
4 Belgaum 559938 511075 1071013 73.72 67.96 70.97<br />
5 Bellary 302200 282215 584415 70.59 60.42 65.68<br />
6 Bidar 225377 210158 435535 81.59 73.75 77.81<br />
7 Bijapur 263302 235500 498802 89.13 78.47 84.10<br />
8 Chamarajnagar 119882 113836 233718 73.11 65.42 69.36<br />
9 Chikmaglur 137738 136055 273793 78.42 71.81 75.13<br />
10 Chitradurga 201340 189511 390851 87.65 81.39 84.62<br />
11 Dakshina Kannada 229365 230464 459829 82.55 79.16 80.85<br />
12 Davangere 240891 228592 469483 75.63 73.84 74.76<br />
13 Dharwad 212593 197153 409746 76.62 70.61 73.73<br />
14 Gadag 136151 125369 261520 79.13 72.32 75.86<br />
15 Gulbarga 465873 427554 893427 75.18 65.94 70.76<br />
16 Hassan 215146 216057 431203 72.26 68.53 70.39<br />
17 Haveri 203522 189109 392631 61.28 48.20 54.98<br />
18 Kodagu 63643 62378 126021 81.10 77.84 79.48<br />
19 Kolar 333290 319264 652554 74.87 69.36 72.18<br />
20 Koppal 174194 162711 336905 63.80 54.44 59.28<br />
21 Mandya 223516 217943 441459 80.33 72.92 76.68<br />
22 Mysore 333403 324155 657558 74.42 65.60 70.07<br />
23 Raichur 245781 229991 475772 56.70 40.74 48.99<br />
24 Shimoga 201101 196363 397464 73.93 83.00 78.41<br />
25 Tumkur 330365 312602 642967 78.20 75.86 77.06<br />
26 Udupi 131468 137404 268872 134.85 96.46 115.23<br />
27 Uttara Kannada 171396 165913 337309 81.10 78.37 79.76<br />
<strong>Karnataka</strong> 6909903 6555438 13465341 77.85 72.11 75.05<br />
Sources:<br />
1. Col. 200 to 202: Projected children’s population.<br />
2. Col. 203 to 205: Computed based on enrolment fi gures of CPI and PUC Board and projected children’s population.<br />
373
Appendix: Statistical Tables<br />
4. Education Profile<br />
District Gross enrolment ratio - 2000-01<br />
Children in the age group 6 to
<strong>Karnataka</strong> <strong>Human</strong> <strong>Development</strong> <strong>Report</strong> <strong>2005</strong><br />
4. Education Profile<br />
District Gross enrolment ratio - 2003-04<br />
Children in the age group 6 to
Appendix: Statistical Tables<br />
4. Education Profile<br />
District<br />
Children<br />
6-14 years<br />
Percentage of children out of school in age group 6-14 years as per children census<br />
2001 2002 2003<br />
Out - of<br />
school<br />
children<br />
6-14 years<br />
% of<br />
children<br />
out of<br />
school<br />
Children<br />
6-14 years<br />
Out of<br />
school<br />
children<br />
6-14 years<br />
% of<br />
children<br />
out of<br />
school<br />
Children<br />
6-14 years<br />
Out of<br />
school<br />
6-14 years<br />
children<br />
% of<br />
children<br />
out of<br />
school<br />
1 218 219 220 221 222 223 224 225 226<br />
1 Bagalkot 282710 37385 13.22 317344 35004 11.03 303224 24201 7.98<br />
2 Bangalore Rural 288375 12691 4.40 300422 11404 3.80 272071 5736 2.11<br />
3 Bangalore Urban 796084 21687 2.72 967869 20048 2.07 752300 8057 1.07<br />
4 Belgaum 609823 51567 8.46 887547 60351 6.80 703218 44627 6.35<br />
5 Bellary 344161 57634 16.75 369173 48616 13.17 454890 39021 8.58<br />
6 Bidar 284244 35264 12.41 303358 17910 5.90 263329 7801 2.96<br />
7 Bijapur 344549 59685 17.32 342907 44905 13.10 319357 33025 10.34<br />
8 Chamarajnagar 143413 13106 9.14 141846 11505 8.11 105336 2933 2.78<br />
9 Chikmaglur 163087 11061 6.78 173389 10031 5.79 160056 5277 3.30<br />
10 Chitradurga 242594 18205 7.50 253633 20231 7.98 255910 10835 4.23<br />
11 Dakshina Kannada 251630 4418 1.76 294765 7720 2.62 254902 4822 1.89<br />
12 Davangere 286006 22023 7.70 298570 21944 7.35 237243 19539 8.24<br />
13 Dharwad 223547 19081 8.54 270612 19496 7.20 237053 13309 5.61<br />
14 Gadag 156688 15836 10.11 168228 15521 9.23 153644 8794 5.72<br />
15 Gulbarga 560739 136667 24.37 643458 104460 16.23 531231 56131 10.57<br />
16 Hassan 254148 12981 5.11 259384 10235 3.95 234650 3325 1.42<br />
17 Haveri 244177 20506 8.40 249883 22322 8.93 228308 17297 7.58<br />
18 Kodagu 71150 6062 8.52 82062 2145 2.61 71445 792 1.11<br />
19 Kolar 433740 42570 9.81 440994 22351 5.07 402654 14499 3.60<br />
20 Koppal 219771 46046 20.95 223003 36367 16.31 211420 20980 9.92<br />
21 Mandya 260219 11101 4.27 268457 8050 3.00 219018 2797 1.28<br />
22 Mysore 328867 29635 9.01 400006 17492 4.37 352580 7691 2.18<br />
23 Raichur 299696 80105 26.73 310789 49467 15.92 275086 20946 7.61<br />
24 Shimoga 244557 14911 6.10 259889 11278 4.34 232141 6677 2.88<br />
25 Tumkur 386956 17403 4.50 413997 20035 4.84 324940 9464 2.91<br />
26 Udupi 201510 13874 6.89 209553 14984 7.15 236197 15826 6.70<br />
27 Uttara Kannada 187053 2059 1.10 171724 2444 1.42 132562 1174 0.89<br />
<strong>Karnataka</strong> 8109494 813563 10.03 9022862 666316 7.38 7924765 405576 5.12<br />
Source: Commissioner for Public Instruction - Children Census 2001, 2002, 2003.<br />
376
<strong>Karnataka</strong> <strong>Human</strong> <strong>Development</strong> <strong>Report</strong> <strong>2005</strong><br />
4. Education Profile<br />
District<br />
Student dropout rates (standard I - VIII)<br />
1999-2000 2003-04<br />
Boys Girls Total Boys Girls Total<br />
1 227 228 229 230 231 232<br />
1 Bagalkot<br />
2 Bangalore Rural 58.95 69.99 65.18 25.39 25.67 25.53<br />
3 Bangalore Urban 41.69 40.32 41.02 49.30 49.77 49.54<br />
4 Belgaum 51.50 58.55 54.75 31.30 48.24 39.49<br />
5 Bellary 64.86 73.32 68.70 64.68 69.73 67.10<br />
6 Bidar 75.43 80.35 77.88 58.67 60.95 59.83<br />
7 Bijapur 56.27 68.26 61.80 51.40 59.03 55.03<br />
8 Chamarajnagar<br />
9 Chikmaglur 51.28 59.86 55.60 32.09 38.48 35.30<br />
10 Chitradurga 32.42 36.99 34.64 21.43 23.06 22.21<br />
11 Dakshina Kannada 41.99 48.91 45.19 24.01 31.86 27.95<br />
12 Davangere<br />
13 Dharwad 56.16 42.10 51.02 35.57 37.01 36.25<br />
14 Gadag<br />
15 Gulbarga 69.63 76.55 72.74 55.23 64.74 60.01<br />
16 Hassan 66.35 68.23 67.26 42.75 42.03 42.39<br />
17 Haveri<br />
18 Kodagu 19.59 16.67 18.12 5.98 8.74 7.33<br />
19 Kolar 57.54 60.65 58.99 39.19 42.80 40.98<br />
20 Koppal<br />
21 Mandya 32.08 43.97 38.02 26.76 38.83 32.65<br />
22 Mysore 42.49 42.64 42.56 40.40 52.36 46.43<br />
23 Raichur 66.90 73.88 69.89 62.95 59.69 61.60<br />
24 Shimoga 59.67 63.97 61.91 48.67 55.97 52.51<br />
25 Tumkur 6.65 23.49 15.13 31.98 42.21 37.02<br />
26 Udupi<br />
27 Uttara Kannada 62.39 61.30 61.85 45.00 42.76 43.94<br />
<strong>Karnataka</strong> 52.13 56.01 53.94 42.81 48.15 45.42<br />
Source: Computed based on CPI fi gures, <strong>Karnataka</strong>.<br />
377
Appendix: Statistical Tables<br />
4. Education Profile<br />
District<br />
Primary school teachers and percentage of female teachers to total teachers (standard I - VII)<br />
1998-99 2003-04<br />
Male Female % of female Male Female % of female<br />
1 233 234 235 236 237 238<br />
1 Bagalkot 4678 2249 32.47 4095 3320 44.77<br />
2 Bangalore Rural 5430 4042 42.67 4480 5550 55.33<br />
3 Bangalore Urban 3886 16381 80.83 4868 17198 77.94<br />
4 Belgaum 5249 4711 47.30 9699 8935 47.95<br />
5 Bellary 4779 2646 35.64 4589 3785 45.20<br />
6 Bidar 5279 2573 32.77 4503 3920 46.54<br />
7 Bijapur 5015 3193 38.90 5615 3377 37.56<br />
8 Chamarajnagar 2194 1567 41.66 2090 1893 47.53<br />
9 Chikmaglur 3594 2732 43.19 3186 3423 51.79<br />
10 Chitradurga 4665 2682 36.50 4156 3408 45.06<br />
11 Dakshina Kannada 3816 2467 39.26 2038 5773 73.91<br />
12 Davangere 4805 3174 39.78 4780 3935 45.15<br />
13 Dharwad 2152 2735 55.96 2110 3826 64.45<br />
14 Gadag 2434 1601 39.68 2467 1984 44.57<br />
15 Gulbarga 7940 4543 36.39 6472 6800 51.24<br />
16 Hassan 5436 3815 41.24 4898 4721 49.08<br />
17 Haveri 3729 1877 33.48 3708 3008 44.79<br />
18 Kodagu 603 1721 74.05 544 2080 79.27<br />
19 Kolar 6983 5159 42.49 6654 8242 55.33<br />
20 Koppal 2398 1620 40.32 3065 1940 38.76<br />
21 Mandya 4571 2745 37.52 4134 3911 48.61<br />
22 Mysore 4190 4803 53.41 4707 6538 58.14<br />
23 Raichur 2963 2424 45.00 3469 2920 45.70<br />
24 Shimoga 4174 2194 34.45 3680 4838 56.80<br />
25 Tumkur 8750 5116 36.90 6407 7121 52.64<br />
26 Udupi 1663 3077 64.92 2185 2834 56.47<br />
27 Uttara Kannada 2979 4629 60.84 2715 5328 66.24<br />
<strong>Karnataka</strong> 114355 96476 45.76 111314 130608 53.99<br />
Source: Computed based on CPI fi gures, <strong>Karnataka</strong>.<br />
378
<strong>Karnataka</strong> <strong>Human</strong> <strong>Development</strong> <strong>Report</strong> <strong>2005</strong><br />
4. Education Profile<br />
District<br />
High school teachers and percentage of female teachers<br />
1990-91 2002-03<br />
Male Female % of female Male Female % of female<br />
1 239 240 241 242 243 244<br />
1 Bagalkot 1774 426 19.36 1643 537 24.63<br />
2 Bangalore Rural 1932 625 24.44 2299 2137 48.17<br />
3 Bangalore Urban 3161 5739 64.48 3691 5242 58.68<br />
4 Belgaum 4465 980 18.00 4323 1383 24.24<br />
5 Bellary 1291 435 25.20 1450 411 22.09<br />
6 Bidar 1812 571 23.96 1437 262 15.42<br />
7 Bijapur 2129 324 13.21 2221 354 13.75<br />
8 Chamarajnagar 804 426 34.63 763 296 27.95<br />
9 Chikmaglur 1575 422 21.13 1653 390 19.09<br />
10 Chitradurga 2378 375 13.62 2179 407 15.74<br />
11 Dakshina Kannada 1608 1315 44.99 1589 1317 45.32<br />
12 Davangere 2144 457 17.57 2705 1751 39.30<br />
13 Dharwad 1543 881 36.34 1400 1006 41.81<br />
14 Gadag 1146 268 18.95 1189 363 23.39<br />
15 Gulbarga 3309 1443 30.37 2246 254 10.16<br />
16 Hassan 1763 578 24.69 2332 1108 32.21<br />
17 Haveri 1656 759 31.43 1615 477 22.80<br />
18 Kodagu 658 400 37.81 610 245 28.66<br />
19 Kolar 2197 688 23.85 2103 886 29.64<br />
20 Koppal 817 248 23.29 952 252 20.93<br />
21 Mandya 1607 620 27.84 1928 600 23.73<br />
22 Mysore 1733 1169 40.28 2000 1347 40.25<br />
23 Raichur 744 380 33.81 909 535 37.05<br />
24 Shimoga 1881 674 26.38 2052 880 30.01<br />
25 Tumkur 3950 3022 43.34 4046 1353 25.06<br />
26 Udupi 623 1232 66.42 1223 447 26.77<br />
27 Uttara Kannada 1481 678 31.40 1502 632 29.62<br />
<strong>Karnataka</strong> 50181 25135 33.37 52060 24872 32.33<br />
Source: Computed based on CPI fi gures, <strong>Karnataka</strong>.<br />
379
Appendix: Statistical Tables<br />
4. Education Profile<br />
District Pupil - teacher ratio Total institutions of PUC<br />
Primary schools<br />
High schools<br />
1998-99 2003-04 1998-99 2002-03 1990-91 1998-99 2000-01 2003-04<br />
1 245 246 247 248 249 250 251 252<br />
1 Bagalkot 35 40 14 25 46 52 54 61<br />
2 Bangalore Rural 30 25 22 19 40 59 62 64<br />
3 Bangalore Urban 50 38 23 22 142 250 258 323<br />
4 Belgaum 60 38 24 28 84 123 126 130<br />
5 Bellary 44 41 27 29 32 49 51 52<br />
6 Bidar 37 40 14 37 64 78 79 82<br />
7 Bijapur 41 42 27 31 46 71 72 73<br />
8 Chamarajnagar 34 34 23 31 17 32 32 37<br />
9 Chikmaglur 25 24 18 21 32 46 47 52<br />
10 Chitradurga 35 34 20 23 57 85 84 88<br />
11 Dakshina Kannada 44 37 25 30 54 95 95 107<br />
12 Davangere 37 34 14 15 36 90 90 93<br />
13 Dharwad 51 45 15 25 37 55 55 66<br />
14 Gadag 37 37 27 24 31 38 39 52<br />
15 Gulbarga 44 50 14 33 70 112 112 112<br />
16 Hassan 25 23 23 23 61 81 81 88<br />
17 Haveri 27 36 21 25 41 60 61 63<br />
18 Kodagu 33 29 18 13 21 32 32 36<br />
19 Kolar 31 27 27 36 39 75 75 87<br />
20 Koppal 43 45 18 25 19 29 29 31<br />
21 Mandya 36 28 29 31 40 79 79 87<br />
22 Mysore 39 33 28 31 46 94 96 112<br />
23 Raichur 37 46 25 24 26 37 37 51<br />
24 Shimoga 38 27 19 22 49 72 72 74<br />
25 Tumkur 26 26 16 22 108 145 145 158<br />
26 Udupi 54 29 21 35 48 62 62 67<br />
27 Uttara Kannada 28 25 20 23 36 58 58 63<br />
<strong>Karnataka</strong> 38 35 21 25 1322 2059 2083 2309<br />
Sources:<br />
1. Col. 249: Computed based on taluk-wise fi gures of PUC Board, <strong>Karnataka</strong>.<br />
2. Col. 250 to 252: PUC Board, <strong>Karnataka</strong>.<br />
380
<strong>Karnataka</strong> <strong>Human</strong> <strong>Development</strong> <strong>Report</strong> <strong>2005</strong><br />
4. Education Profile<br />
District<br />
Enrolment of students in PUC (all)<br />
1990-91 1998-99<br />
Boys Girls Total Boys Girls Total<br />
1 253 254 255 256 257 258<br />
1 Bagalkot 6643 3057 9700 6788 3124 9912<br />
2 Bangalore Rural 11397 8603 20000 6024 4547 10571<br />
3 Bangalore Urban 27339 27661 55000 39546 40012 79558<br />
4 Belgaum 33799 16201 50000 18249 8747 26996<br />
5 Bellary 7962 5238 13200 7771 5113 12884<br />
6 Bidar 10028 6972 17000 8380 5826 14206<br />
7 Bijapur 7546 3754 11300 10452 5200 15652<br />
8 Chamarajnagar 2516 1484 4000 3787 2233 6020<br />
9 Chikmaglur 5254 5746 11000 4802 5252 10054<br />
10 Chitradurga 10114 6786 16900 11185 7504 18689<br />
11 Dakshina Kannada 13698 15702 29400 2318 2657 4975<br />
12 Davangere 7286 8214 15500 10810 12187 22997<br />
13 Dharwad 9810 7890 17700 10670 8581 19251<br />
14 Gadag 5462 4138 9600 10118 7667 17785<br />
15 Gulbarga 9978 6022 16000 5775 3485 9260<br />
16 Hassan 8434 5566 14000 13898 9173 23071<br />
17 Haveri 5630 5070 10700 7777 7003 14780<br />
18 Kodagu 3671 2329 6000 6472 4105 10577<br />
19 Kolar 13718 8282 22000 10859 6556 17415<br />
20 Koppal 2122 1478 3600 3561 2479 6040<br />
21 Mandya 8800 5200 14000 7728 5525 12294<br />
22 Mysore 8207 4793 13000 13977 10029 22139<br />
23 Raichur 4178 2222 6400 4562 2885 6989<br />
24 Shimoga 13147 9253 22400 8689 8000 14804<br />
25 Tumkur 17620 4380 22000 11875 9824 14827<br />
26 Udupi 10235 11365 21600 7170 8206 15131<br />
27 Uttara Kannada 6618 6382 13000 5768 7127 11330<br />
<strong>Karnataka</strong> 268715 196285 465000 259011 203047 448207<br />
Sources:<br />
1. Col. 253 to 255: Worked out based on talukwise fi gures (DAG).<br />
2. Col. 256 to 258: PUC Board, <strong>Karnataka</strong>.<br />
381
Appendix: Statistical Tables<br />
4. Education Profile<br />
District<br />
Enrolment of students in PUC (all)<br />
2000-01 2003-04<br />
Boys Girls Total Boys Girls Total<br />
1 259 260 261 262 263 264<br />
1 Bagalkot 12536 6301 18837 15345 6660 2<strong>2005</strong><br />
2 Bangalore Rural 10042 7660 17702 10825 8381 19206<br />
3 Bangalore Urban 44140 45882 90022 56829 55445 112274<br />
4 Belgaum 25764 14210 39974 32166 14981 47147<br />
5 Bellary 11103 6851 17954 12881 7820 20701<br />
6 Bidar 10474 6925 17399 12104 7910 20014<br />
7 Bijapur 16841 7622 24463 17600 8156 25756<br />
8 Chamarajnagar 5443 2829 8272 5663 3523 9186<br />
9 Chikmaglur 5523 6056 11579 7630 7006 14636<br />
10 Chitradurga 11561 7683 19244 11375 6573 17948<br />
11 Dakshina Kannada 2957 3384 6341 3422 4168 7590<br />
12 Davangere 12718 14544 27262 17684 18331 36015<br />
13 Dharwad 12554 10285 22839 14023 10229 24252<br />
14 Gadag 12648 9873 22521 13329 10319 23648<br />
15 Gulbarga 6416 3539 9955 9780 4663 14443<br />
16 Hassan 15105 10078 25183 17585 10849 28434<br />
17 Haveri 10514 9443 19957 13277 11545 24822<br />
18 Kodagu 7614 4734 12348 10056 6348 16404<br />
19 Kolar 15514 9955 25469 17916 11562 29478<br />
20 Koppal 3748 2565 6313 4613 2509 7122<br />
21 Mandya 11040 8666 19706 13383 9936 23319<br />
22 Mysore 15991 13060 29051 21862 16813 38675<br />
23 Raichur 6376 4041 10417 8338 4801 13139<br />
24 Shimoga 10621 9842 20463 12225 12442 24667<br />
25 Tumkur 15730 12817 28547 20931 15982 36913<br />
26 Udupi 7967 9308 17275 10313 11080 21393<br />
27 Uttara Kannada 6591 7926 14517 9094 9256 18350<br />
<strong>Karnataka</strong> 327531 256079 583610 400249 297288 697537<br />
Source: PUC Board, <strong>Karnataka</strong>.<br />
382
<strong>Karnataka</strong> <strong>Human</strong> <strong>Development</strong> <strong>Report</strong> <strong>2005</strong><br />
4. Education Profile<br />
District<br />
Growth of enrolment in PUC<br />
1998-99 to 2003-04<br />
Enrolment of SC students in PUC<br />
Boys Girls Total 1998-99 2003-04<br />
Boys Girls Total Boys Girls Total<br />
1 265 266 267 268 269 270 271 272 273<br />
1 Bagalkot 126.06 113.19 122.00 898 303 1201 1764 563 2327<br />
2 Bangalore Rural 79.70 84.32 81.69 898 545 1443 1722 1262 2984<br />
3 Bangalore Urban 43.70 38.57 41.12 4340 4285 8625 6245 6250 12495<br />
4 Belgaum 76.26 71.27 74.64 1971 750 2721 3044 1383 4427<br />
5 Bellary 65.76 52.94 60.67 880 357 1237 1431 636 2067<br />
6 Bidar 44.44 35.77 40.88 1765 807 2572 2655 1715 4370<br />
7 Bijapur 68.39 56.85 64.55 2656 775 3431 3736 1238 4974<br />
8 Chamarajnagar 49.54 57.77 52.59 1439 825 2264 1624 1208 2832<br />
9 Chikmaglur 58.89 33.40 45.57 552 382 934 917 813 1730<br />
10 Chitradurga 1.70 -12.41 -3.96 1844 1096 2940 1601 977 2578<br />
11 Dakshina Kannada 47.63 56.87 52.56 213 188 401 383 341 724<br />
12 Davangere 63.59 50.41 56.61 288 397 685 629 679 1308<br />
13 Dharwad 31.42 19.21 25.98 1730 683 2413 2192 994 3186<br />
14 Gadag 31.74 34.59 32.97 967 398 1365 1256 917 2173<br />
15 Gulbarga 69.35 33.80 55.97 700 243 943 981 294 1275<br />
16 Hassan 26.53 18.27 23.25 2753 1302 4055 3559 1920 5479<br />
17 Haveri 70.72 64.86 67.94 920 487 1407 1691 1429 3120<br />
18 Kodagu 55.38 54.64 55.09 586 220 806 1157 479 1636<br />
19 Kolar 64.99 76.36 69.27 1820 1019 2839 3693 2269 5962<br />
20 Koppal 29.54 1.21 17.91 346 152 498 415 187 602<br />
21 Mandya 73.18 79.84 89.68 1113 649 1762 1705 1560 3265<br />
22 Mysore 56.41 67.64 74.69 2084 1601 3685 3618 2620 6238<br />
23 Raichur 82.77 66.41 88.00 607 308 915 1335 827 2162<br />
24 Shimoga 40.70 55.53 66.62 896 649 1545 1610 1333 2943<br />
25 Tumkur 76.26 62.68 148.96 1555 782 2337 3476 2270 5746<br />
26 Udupi 43.84 35.02 41.39 235 288 523 370 484 854<br />
27 Uttara Kannada 57.66 29.87 61.96 359 365 724 560 579 1139<br />
<strong>Karnataka</strong> 54.53 46.41 55.63 34415 19856 54271 53369 35227 88596<br />
Source: Col. 268 to 273: PUC Board, <strong>Karnataka</strong>.<br />
383
Appendix: Statistical Tables<br />
4. Education Profile<br />
District<br />
Enrolment of ST students in PUC<br />
1998-99 2003-04<br />
Boys Girls Total Boys Girls Total<br />
1 274 275 276 277 278 279<br />
1 Bagalkot 274 74 348 499 182 681<br />
2 Bangalore Rural 184 76 260 244 200 444<br />
3 Bangalore Urban 681 602 1283 928 865 1793<br />
4 Belgaum 463 196 659 963 349 1312<br />
5 Bellary 733 348 1081 1176 577 1753<br />
6 Bidar 389 140 529 477 330 807<br />
7 Bijapur 207 57 264 204 125 329<br />
8 Chamarajnagar 223 109 332 314 220 534<br />
9 Chikmaglur 124 73 197 190 142 332<br />
10 Chitradurga 1505 760 2265 1046 717 1763<br />
11 Dakshina Kannada 43 49 92 39 98 137<br />
12 Davangere 286 341 627 367 589 956<br />
13 Dharwad 1217 519 1736 1344 754 2098<br />
14 Gadag 299 144 443 501 299 800<br />
15 Gulbarga 435 125 560 566 172 738<br />
16 Hassan 354 110 464 377 145 522<br />
17 Haveri 97 67 164 167 143 310<br />
18 Kodagu 448 197 645 1007 458 1465<br />
19 Kolar 381 175 556 945 451 1396<br />
20 Koppal 202 106 308 294 120 414<br />
21 Mandya 88 48 136 116 91 207<br />
22 Mysore 665 406 1071 1313 818 2131<br />
23 Raichur 299 93 392 758 237 995<br />
24 Shimoga 203 173 376 344 322 666<br />
25 Tumkur 662 331 993 1259 998 2257<br />
26 Udupi 163 139 302 266 326 592<br />
27 Uttara Kannada 84 50 134 71 93 164<br />
<strong>Karnataka</strong> 10709 5508 16217 15775 9821 25596<br />
Source: Col. 274 to 279: PUC Board, <strong>Karnataka</strong>.<br />
384
<strong>Karnataka</strong> <strong>Human</strong> <strong>Development</strong> <strong>Report</strong> <strong>2005</strong><br />
4. Education Profile<br />
District<br />
Percentage of pass students to students appeared<br />
SSLC results<br />
1998-99 2003-04<br />
Boys Girls Total Boys Girls Total<br />
1 280 281 282 283 284 285<br />
1 Bagalkot 55.43 64.78 58.58 59.03 72.22 63.55<br />
2 Bangalore Rural 54.10 53.68 53.91 47.15 57.51 51.75<br />
3 Bangalore Urban 65.12 67.88 66.49 51.94 63.74 57.42<br />
4 Belgaum 58.77 65.42 61.35 61.96 72.07 65.77<br />
5 Bellary 47.40 52.72 49.49 53.51 59.65 55.82<br />
6 Bidar 65.80 67.90 66.58 51.96 58.78 54.83<br />
7 Bijapur 50.24 59.52 53.19 52.72 65.12 56.86<br />
8 Chamarajnagar 47.55 50.48 48.74 38.82 46.91 42.20<br />
9 Chikmaglur 55.56 57.36 56.44 57.19 66.09 61.50<br />
10 Chitradurga 49.19 54.82 51.50 55.02 61.89 57.95<br />
11 Dakshina Kannada 73.87 78.20 76.03 71.59 81.96 76.50<br />
12 Davangere 59.68 64.26 61.75 44.74 54.96 49.21<br />
13 Dharwad 61.25 68.64 64.54 49.91 60.60 54.45<br />
14 Gadag 47.86 49.85 48.59 56.60 72.86 62.85<br />
15 Gulbarga 55.43 58.14 56.42 38.10 46.93 41.53<br />
16 Hassan 45.76 45.80 45.78 52.12 61.61 56.57<br />
17 Haveri 47.66 50.08 48.67 53.15 61.95 56.86<br />
18 Kodagu 59.07 61.23 60.16 49.26 58.42 53.48<br />
19 Kolar 40.51 43.49 41.77 39.67 48.73 43.36<br />
20 Koppal 56.95 56.38 56.75 51.44 56.51 53.30<br />
21 Mandya 46.88 49.11 47.93 59.28 67.94 63.37<br />
22 Mysore 43.48 49.97 46.34 44.54 54.88 48.94<br />
23 Raichur 54.70 63.32 57.78 45.84 57.31 49.88<br />
24 Shimoga 51.94 52.75 52.34 55.79 65.30 60.48<br />
25 Tumkur 45.12 44.63 44.90 49.83 57.06 53.04<br />
26 Udupi 75.57 76.51 76.04 73.59 80.89 77.27<br />
27 Uttara Kannada 64.11 65.24 64.66 65.59 72.39 68.75<br />
<strong>Karnataka</strong> 55.03 58.92 56.73 52.06 62.03 56.32<br />
Source: Commissioner for Public Instruction, <strong>Karnataka</strong>.<br />
385
Appendix: Statistical Tables<br />
4. Education Profile<br />
District<br />
Percentage of pass students to students appeared<br />
PUC results<br />
1998-99 2003-04<br />
Boys Girls Total Boys Girls Total<br />
1 286 287 288 289 290 291<br />
1 Bagalkot 33.92 51.39 39.19 50.02 60.07 53.26<br />
2 Bangalore Rural 42.30 54.14 47.20 46.47 60.50 53.34<br />
3 Bangalore Urban 54.68 66.08 60.53 61.74 70.59 66.28<br />
4 Belgaum 35.43 49.84 40.51 48.18 63.39 53.55<br />
5 Bellary 32.51 47.40 38.44 46.18 57.55 50.94<br />
6 Bidar 21.17 31.34 24.65 36.84 42.10 39.07<br />
7 Bijapur 27.10 41.50 31.24 45.80 50.49 47.29<br />
8 Chamarajnagar 36.84 58.40 43.75 47.11 58.20 52.04<br />
9 Chikmaglur 47.19 60.58 53.74 61.65 71.84 67.04<br />
10 Chitradurga 23.77 38.75 29.47 47.04 55.82 50.98<br />
11 Dakshina Kannada 68.64 76.82 73.09 78.13 82.06 80.25<br />
12 Davangere 32.12 47.51 38.12 48.07 59.53 53.11<br />
13 Dharwad 42.25 51.80 46.03 48.99 59.60 53.49<br />
14 Gadag 21.33 35.03 25.80 45.93 58.82 50.58<br />
15 Gulbarga 22.63 32.17 26.08 32.23 42.90 36.70<br />
16 Hassan 41.10 56.16 48.33 53.71 63.13 58.71<br />
17 Haveri 39.70 53.54 44.69 57.87 64.59 60.50<br />
18 Kodagu 54.80 63.04 59.13 61.15 68.71 65.25<br />
19 Kolar 42.15 57.23 48.16 46.60 60.94 52.74<br />
20 Koppal 26.40 41.38 31.52 42.38 54.69 47.64<br />
21 Mandya 39.30 49.27 43.83 45.65 58.25 51.99<br />
22 Mysore 45.61 55.60 50.07 51.68 64.05 57.45<br />
23 Raichur 24.53 42.20 30.79 35.78 49.79 41.21<br />
24 Shimoga 56.71 66.47 61.41 57.95 67.34 62.86<br />
25 Tumkur 47.65 59.30 52.55 50.15 64.03 56.51<br />
26 Udupi 74.24 78.90 76.69 77.12 81.99 79.77<br />
27 Uttara Kannada 53.68 65.14 59.41 60.51 73.27 67.38<br />
<strong>Karnataka</strong> 41.22 56.80 47.88 52.27 64.31 57.77<br />
Source: PUC Board, <strong>Karnataka</strong>.<br />
386
<strong>Karnataka</strong> <strong>Human</strong> <strong>Development</strong> <strong>Report</strong> <strong>2005</strong><br />
4. Education Profile<br />
University/District<br />
University-wise no. of degree colleges<br />
Arts<br />
Science<br />
1998-99 2003-04 1998-99 2003-04<br />
Govt. Pvt. Govt. Pvt. Govt. Pvt. Govt. Pvt.<br />
1 292 293 294 295 296 297 298 299<br />
I Mysore<br />
1 Chamarajnagar 3 5 2 8 1 1 1<br />
2 Mysore 8 18 5 17 3 15 2 13<br />
3 Mandya 4 12 5 12 2 4 5 4<br />
4 Hassan 9 8 5 6 3 5 2 5<br />
II <strong>Karnataka</strong><br />
1 Gadag 4 13 4 13 3 5<br />
2 Dharwad 2 20 3 21 6 5<br />
3 Belgaum 3 32 4 26 28 13<br />
4 Bagalkot 2 15 3 16 6 7<br />
5 Bijapur 25 23 5 6<br />
6 Uttara Kannada 4 17 4 16 1 8 1 8<br />
7 Haveri 2 14 4 12 3 4<br />
III Bangalore<br />
1 Bangalore Urban 7 79 7 93 5 82 5 116<br />
2 Bangalore Rural 8 8 8 9 1 4 1 8<br />
3 Kolar 10 10 11 12 6 6 7 6<br />
4 Tumkur 9 21 10 22 4 9 4 9<br />
IV Gulbarga<br />
1 Gulbarga 10 25 10 31 2 10 2 15<br />
2 Haveri<br />
3 Bellary 5 4 5 9 5 9<br />
4 Bidar 1 17 1 23 1 9 1 13<br />
5 Raichur 4 7 4 10 3 4<br />
6 Koppal 4 2 4 5 2 1 2 3<br />
V Mangalore<br />
1 Udupi<br />
2 Dakshina Kannada 1 6 1 7 3 6<br />
3 Kodagu 1<br />
VI Kuvempu<br />
1 Davangere 4 24 1 7<br />
2 Shimoga 9 17 8 22 1 5 2 6<br />
3 Chitradurga 5 33 6 20 3 4 4 2<br />
4 Chikmaglur 5 5 7 7 1 3 3 2<br />
<strong>Karnataka</strong> 119 413 126 464 36 227 43 277<br />
Note: Private includes both aided and unaided colleges.<br />
Source: Respective University.<br />
387
Appendix: Statistical Tables<br />
4. Education Profile<br />
University/District<br />
University-wise no. of degree colleges<br />
Commerce<br />
Total<br />
1998-99 2003-04 1998-99 2003-04<br />
Govt. Pvt. Govt. Pvt. Govt. Pvt. Govt. Pvt.<br />
1 300 301 302 303 304 305 306 307<br />
I Mysore<br />
1 Chamarajnagar 1 3 1 4 5 8 4 13<br />
2 Mysore 5 22 3 17 16 55 10 47<br />
3 Mandya 2 4 3 5 8 20 13 21<br />
4 Hassan 7 7 2 9 19 20 9 20<br />
II <strong>Karnataka</strong><br />
1 Gadag 4 10 3 14 8 26 7 32<br />
2 Dharwad 2 16 2 21 4 42 5 47<br />
3 Belgaum 2 15 2 21 5 75 6 60<br />
4 Bagalkot 1 11 2 11 3 32 5 34<br />
5 Bijapur 11 12 0 41 0 41<br />
6 Uttara Kannada 10 12 5 35 5 36<br />
7 Haveri 14 2 13 2 31 6 29<br />
III Bangalore<br />
1 Bangalore Urban 5 102 5 143 17 263 17 352<br />
2 Bangalore Rural 7 6 7 7 16 18 16 24<br />
3 Kolar 9 6 10 7 25 22 28 25<br />
4 Tumkur 7 8 8 8 20 38 22 39<br />
IV Gulbarga<br />
1 Gulbarga 7 8 7 14 19 43 19 60<br />
2 Haveri 0 0 0 0<br />
3 Bellary 4 9 4 12 9 18 9 30<br />
4 Bidar 1 5 1 8 3 31 3 44<br />
5 Raichur 2 4 2 6 6 14 6 20<br />
6 Koppal 2 3 2 6 8 6 8 14<br />
V Mangalore<br />
1 Udupi 1 2 1 4 1 2 1 4<br />
2 Dakshina Kannada 8 1 11 1 17 2 24<br />
3 Kodagu<br />
VI Kuvempu<br />
1 Davangere 2 14 0 0 7 45<br />
2 Shimoga 8 11 5 9 18 33 15 37<br />
3 Chitradurga 5 16 4 7 13 53 14 29<br />
4 Chikmaglur 3 5 4 6 9 13 14 15<br />
<strong>Karnataka</strong> 85 316 83 401 240 956 252 1142<br />
Note: Private includes both aided and unaided colleges.<br />
Source: Respective University.<br />
388
<strong>Karnataka</strong> <strong>Human</strong> <strong>Development</strong> <strong>Report</strong> <strong>2005</strong><br />
4. Education Profile<br />
University/District<br />
University-wise no. of degree colleges<br />
No. of B.Ed colleges + Physical educ colleges<br />
Law<br />
1998-99 2003-04 1998-99 2003-04<br />
Govt. Pvt. Govt. Pvt. Govt. Pvt. Govt. Pvt.<br />
1 308 309 310 311 312 313 314 315<br />
I Mysore<br />
1 Chamarajnagar<br />
2 Mysore 3 5 3 5 - 4 - 4<br />
3 Mandya 1 - 1 - 2 - 2<br />
4 Hassan - 5 5 1 1<br />
II <strong>Karnataka</strong><br />
1 Gadag 2 2 1 1<br />
2 Dharwad 4 1 3 5 1 5<br />
3 Belgaum 1 4 1 5 4 6<br />
4 Bagalkot 1 2 1 2 1 1<br />
5 Bijapur 1 2 1 2<br />
6 Uttara Kannada 2 2 3 1<br />
7 Haveri 1 1 1 1<br />
III Bangalore<br />
1 Bangalore Urban 1 12 1 12 1 15 1 20<br />
2 Bangalore Rural<br />
3 Kolar 4 4 1 1 1 1<br />
4 Tumkur 5 5 2 2<br />
IV Gulbarga<br />
1 Gulbarga 1 5 1 5 2 2<br />
2 Haveri<br />
3 Bellary 2 2 1 1<br />
4 Bidar 2 2 2 2<br />
5 Raichur 1 1 1 1<br />
6 Koppal 1 1<br />
V Mangalore<br />
1 Udupi - 1 - 1 - 1 - 1<br />
2 Dakshina Kannada 1 1 1 1 - 4 - 3<br />
3 Kodagu - 1 - 1 - - - -<br />
VI Kuvempu<br />
1 Davangere 1 4 1 1<br />
2 Shimoga 2 2 2 2<br />
3 Chitradurga 2 1 1 2 2<br />
4 Chikmaglur 1 1 1<br />
<strong>Karnataka</strong> 8 67 10 71 2 58 3 63<br />
Note: Private includes both aided and unaided colleges.<br />
Source: Respective University.<br />
389
Appendix: Statistical Tables<br />
4. Education Profile<br />
University/District<br />
I<br />
Mysore<br />
Arts<br />
Enrolment of students in general degree colleges<br />
Science<br />
1998-99 2003-04 1998-99 2003-04<br />
Men Women Total Men Women Total Men Women Total Men Women Total<br />
1 316 317 318 319 320 321 322 323 324 325 326 327<br />
1 Chamarajnagar 819 599 1418 643 646 1289 248 182 430 67 67<br />
2 Mysore 3681 2697 6378 6802 4903 11750 3069 2256 5325 2011 1561 3572<br />
3 Mandya 1636 1200 2836 5303 2657 7960 742 546 1288 756 274 1030<br />
4 Hassan 2045 1498 3543 4072 4424 8496 891 655 1546 528 671 1199<br />
II<br />
<strong>Karnataka</strong><br />
1 Gadag 4196 1963 6159 4429 2152 6581 332 225 557 225 116 341<br />
2 Dharwad 4696 3601 8297 4819 3358 8177 1237 1047 2284 1245 1080 2325<br />
3 Belgaum 9715 5248 14963 9947 5721 15668 1150 843 1993 1460 1088 2548<br />
4 Bagalkot 5097 2787 7884 6491 3081 9572 607 371 978 816 529 1345<br />
5 Bijapur 8476 3699 12175 9960 4086 14046 785 428 1213 993 583 1576<br />
6 Uttara Kannada 2401 3322 5723 2346 3547 5893 480 536 1016 622 847 1469<br />
7 Haveri 4133 2709 6842 4586 2857 7443 235 165 400 314 209 523<br />
III Bangalore<br />
1 Bangalore Urban 19553 17237 36790 21023 17812 38835 19441 17010 36451 20597 18048 38645<br />
2 Bangalore Rural 1841 1439 3280 1910 1502 3412 412 302 714 430 335 765<br />
3 Kolar 5120 3253 8373 5144 3289 8433 2120 1264 3384 2144 1372 3516<br />
4 Tumkur 7261 4602 11863 7311 4668 11979 2857 1812 4669 2901 1856 4757<br />
IV Gulbarga<br />
1 Gulbarga 3729 1889 5618 2014 1540 3554 1635 410 2045 2327 1218 3545<br />
2 Bellary 3300 1690 4990 2254 1228 3482 1240 291 1531 1805 1011 2816<br />
3 Bidar 2414 944 3358 1914 1035 2949 1258 268 1526 980 687 1667<br />
4 Raichur 2340 600 2940 1220 830 2050 450 203 653 1057 718 1775<br />
5 Koppal 895 447 1342 925 557 1482 305 263 568 717 507 1224<br />
V Mangalore<br />
1 Udupi 502 733 1235 429 927 1358 249 232 481 234 398 632<br />
2 Dakshina<br />
1173 1266 2439 1419 1809 3228 587 705 1292 679 1117 1796<br />
Kannada<br />
3 Kodagu 247 311 258 237 276 513 32 41 73 61 65 126<br />
VI Kuvempu<br />
1 Davangere 2173 1791 3964 3710 3290 7000 628 846 1474 438 733 1171<br />
2 Shimoga 2248 2804 4052 3332 4422 7754 739 832 1621 1273 1417 2690<br />
3 Chitradurga 2559 1905 4464 3844 2494 6338 515 350 865 497 632 859<br />
4 Chikmaglur 1710 1665 3375 2136 2520 4656 579 556 1135 273 293 566<br />
<strong>Karnataka</strong> 103960 71899 174559 118220 85631 203898 42823 32639 75512 45383 37432 82545<br />
Source: Concerned University.<br />
390
<strong>Karnataka</strong> <strong>Human</strong> <strong>Development</strong> <strong>Report</strong> <strong>2005</strong><br />
4. Education Profile<br />
University/District<br />
Enrolment of students in general degree colleges<br />
Commerce<br />
B.Ed. colleges + Physical education colleges<br />
1998-99 2003-04 1998-99 2003-04<br />
Men Women Total Men Women Total Men Women Total Men Women Total<br />
1 328 329 330 331 332 333 334 335 336 337 338 339<br />
I Mysore<br />
1 Chamarajnagar 140 119 259 118 141 259<br />
2 Mysore 2458 2092 4550 4034 3017 7051 549 418 967 466 491 957<br />
3 Mandya 645 549 1194 885 442 1327 67 33 100 59 41 100<br />
4 Hassan 786 669 1455 372 533 905 330 110 440 234 142 376<br />
II <strong>Karnataka</strong><br />
1 Gadag 769 472 1241 852 553 1405 68 32 100 65 35 100<br />
2 Dharwad 2346 1927 4273 2501 2020 4521 169 131 300 158 142 300<br />
3 Belgaum 2499 1743 4242 3687 2499 6186 204 94 298 193 107 300<br />
4 Bagalkot 1220 555 1775 1107 531 1638 135 65 200 122 78 200<br />
5 Bijapur 998 406 1404 707 232 939 54 46 100 48 51 99<br />
6 Uttara Kannada 1391 1093 2484 1446 1325 2771 97 103 200 91 109 200<br />
7 Haveri 754 438 1192 891 500 1391 143 57 200 64 36 100<br />
III Bangalore<br />
1 Bangalore Urban 15042 12532 27574 18267 14971 33238 811 419 1230 819 422 1241<br />
2 Bangalore Rural 635 500 1135 677 532 1209<br />
3 Kolar 1721 1094 2815 1746 1118 2864 214 110 324 216 112 328<br />
4 Tumkur 1599 986 2585 1626 1038 2664 328 168 496 330 170 500<br />
IV Gulbarga<br />
1 Gulbarga 1834 408 2242 918 320 1238 125 55 180 200 100 300<br />
2 Bellary 1934 378 2310 1107 570 1677 40 75 115 50 100 150<br />
3 Bidar 949 297 1246 780 314 1094 110 80 190 175 70 245<br />
4 Raichur 896 158 1054 874 487 1361 30 60 90 42 100 142<br />
5 Koppal 345 113 458 515 304 819 27 82 109 50 100 150<br />
V Mangalore<br />
1 Udupi 629 602 1231 687 797 1484 66 13 79 74 16 90<br />
2 Dakshina Kannada 1225 912 2256 1800 1414 3213 108 85 193 62 135 197<br />
3 Kodagu 120 108 228 216 130 346 11 56 67 24 76 100<br />
VI Kuvempu<br />
1 Davangere 907 358 1265 934 893 1827 190 110 200 221 179 400<br />
2 Shimoga 918 367 1285 1470 1229 2699 120 80 200 120 80 200<br />
3 Chitradurga 790 290 1080 357 292 649 180 69 249 186 65 251<br />
4 Chikmaglur 614 273 887 462 533 995 66 34 100 56 44 100<br />
<strong>Karnataka</strong> 44164 29439 73720 49036 36735 85770 4242 2585 6727 4125 3001 7126<br />
Source: Concerned University.<br />
391
Appendix: Statistical Tables<br />
4. Education Profile<br />
University/District<br />
Enrolment of students in general degree colleges<br />
Law colleges<br />
1998-99 2003-04<br />
Men Women Total Men Women Total<br />
1 340 341 342 343 344 345<br />
I Mysore<br />
1 Chamarajnagar<br />
2 Mysore 1194 502 1696 1534 642 2176<br />
3 Mandya 367 159 526 552 239 791<br />
4 Hassan 136 54 190 395 228 623<br />
II <strong>Karnataka</strong><br />
1 Gadag 219 63 282 213 32 245<br />
2 Dharwad 1462 281 1743 1273 372 1645<br />
3 Belgaum 687 161 848 821 247 1068<br />
4 Bagalkot 294 53 347 371 54 425<br />
5 Bijapur 314 62 376 310 47 357<br />
6 Uttara Kannada 179 64 243 179 73 252<br />
7 Haveri 421 83 504 245 46 291<br />
III Bangalore<br />
1 Bangalore Urban 3534 1542 5076 4698 1918 6616<br />
2 Bangalore Rural<br />
3 Kolar 426 276 702 495 299 794<br />
4 Tumkur 746 386 1132 986 474 1460<br />
IV Gulbarga<br />
1 Gulbarga 545 232 777 845 150 895<br />
2 Bellary 74 22 96 65 34 99<br />
3 Bidar 82 30 112 100 45 145<br />
4 Raichur 34 14 48 62 32 94<br />
5 Koppal<br />
V Mangalore<br />
1 Udupi 80 48 128 100 68 1688<br />
2 Dakshina Kannada 96 79 175 148 122 270<br />
3 Kodagu<br />
VI Kuvempu<br />
1 Davangere 552 143 695 412 89 501<br />
2 Shimoga 635 159 794 473 338 1041<br />
3 Chitradurga 552 112 664 502 139 641<br />
4 Chikmaglur 70 34 104 51 41 92<br />
<strong>Karnataka</strong> 12699 4559 17258 14830 5729 22209<br />
Source: Concerned University.<br />
392
<strong>Karnataka</strong> <strong>Human</strong> <strong>Development</strong> <strong>Report</strong> <strong>2005</strong><br />
4. Education Profile<br />
District<br />
Source: Vishvesvaraiah Technological University, Belgaum.<br />
No.of engineering colleges<br />
Professional degree colleges<br />
1998-99 2003-04<br />
Enrolment of students in<br />
engineering colleges (2002-03)<br />
Govt. Pvt. Total Govt. Pvt. Total Boys Girls Total<br />
1 346 347 348 349 350 351 352 353 354<br />
1 Bagalkot - 1 1 - 1 1 1323 282 1605<br />
2 Bangalore Rural - 1 1 - 1 1 1507 532 2039<br />
3 Bangalore Urban 1 21 22 2 53 55 23949 8328 32277<br />
4 Belgaum - 4 4 - 4 4 3070 949 4019<br />
5 Bellary - 3 3 - 3 3 2094 737 2831<br />
6 Bidar - 2 2 - 3 3 2288 399 2687<br />
7 Bijapur - 2 2 - 3 3 1119 274 1393<br />
8 Chamarajnagar - - - - - 0<br />
9 Chikkamgalur - 1 1 - 1 1 1132 438 1570<br />
10 Chitradurga - 1 1 - 1 1 956 282 1238<br />
11 Dakshina Kannada - 3 3 - 5 5 2788 692 3480<br />
12 Davangere - 1 1 - 2 2 2736 888 3624<br />
13 Dharwad - 3 3 - 2 2 1065 361 1426<br />
14 Gadag - 2 2 - 3 3 803 226 1029<br />
15 Gulbarga - 2 2 - 4 4 2106 653 2759<br />
16 Hassan - 2 2 - 2 2 1759 655 2414<br />
17 Haveri - 1 1 - 1 1 763 169 932<br />
18 Kodagu - - - - 1 1 313 162 475<br />
19 Kolar - 3 3 - 3 3 1592 646 2238<br />
20 Koppal - 0<br />
21 Mandya - 1 1 - 1 1 1178 397 1575<br />
22 Mysore - 6 6 - 8 8 3240 1577 4817<br />
23 Raichur - 1 1 - 1 1 583 187 770<br />
24 Shimoga - 1 1 - 1 1 976 381 1357<br />
25 Tumkur - 3 3 - 5 5 4479 1526 6005<br />
26 Udupi - 1 1 - 1 1 1163 42 1205<br />
27 Uttara Kannada - 1 1 - 1 1 753<br />
<strong>Karnataka</strong> 1 67 68 2 111 113 63735 20783 84518<br />
393
Appendix: Statistical Tables<br />
4. Education Profile<br />
District<br />
Professional degree colleges (contd.)<br />
Medical colleges<br />
Dental colleges<br />
1998-99 2003-04 1998-99 2003-04<br />
Govt. Pvt. Total Govt. Pvt. Total Govt. Pvt. Total Govt. Pvt. Total<br />
1 355 356 357 358 359 360 361 362 363 364 365 366<br />
1 Bagalkot 0 0 0 0 1 1 0 1 1 0 1 1<br />
2 Bangalore Rural 0 0 0 0 0 0 0 0 0 0 0 0<br />
3 Bangalore Urban 1 4 5 1 5 6 1 14 15 1 15 16<br />
4 Belgaum 0 1 1 0 1 1 0 2 2 0 1 1<br />
5 Bellary 1 0 1 1 0 1 0 0 0 0 0 0<br />
6 Bidar 0 0 0 0 0 0 0 2 2 0 2 2<br />
7 Bijapur 0 2 2 0 2 2 0 1 1 0 1 1<br />
8 Chamarajnagar 0 0 0 0 0 0 0 0 0 0 0 0<br />
9 Chikkamgalur 0 0 0 0 0 0 0 0 0 0 0 0<br />
10 Chitradurga 0 0 0 0 0 0 0 1 1 0 1 1<br />
11 Dakshina Kannada 0 0 0 0 5 5 0 3 3 0 4 4<br />
12 Davangere 0 1 1 0 1 1 0 2 2 0 2 2<br />
13 Dharwad 1 0 1 1 0 1 0 1 1 0 1 1<br />
14 Gadag 0 0 0 0 0 0 0 0 0 0 0 0<br />
15 Gulbarga 0 1 1 0 1 1 0 2 2 0 2 2<br />
16 Hassan 0 0 0 0 0 0 0 1 1 0 1 1<br />
17 Haveri 0 0 0 0 0 0 0 0 0 0 0 0<br />
18 Kodagu 0 0 0 0 0 0 0 1 1 0 1 1<br />
19 Kolar 0 1 1 0 1 1 0 1 1 0 1 1<br />
20 Koppal 0 0 0 0 0 0 0 0 0 0 0 0<br />
21 Mandya 0 1 1 0 1 1 0 0 0 0 0 0<br />
22 Mysore 1 1 2 1 1 2 0 2 2 0 2 2<br />
23 Raichur 0 0 0 0 0 0 0 1 1 0 1 1<br />
24 Shimoga 0 0 0 0 0 0 0 1 1 0 1 1<br />
25 Tumkur 0 1 1 0 1 1 0 1 1 0 0 0<br />
26 Udupi 0 0 0 0 0 0 0 0 0 0 0 0<br />
27 Uttara Kannada 0 0 0 0 0 0 0 0 0 0 0 0<br />
<strong>Karnataka</strong> 4 13 17 4 20 24 1 37 38 1 37 38<br />
Source: Rajiv Gandhi University of Health Sciences, <strong>Karnataka</strong>.<br />
394
<strong>Karnataka</strong> <strong>Human</strong> <strong>Development</strong> <strong>Report</strong> <strong>2005</strong><br />
4. Education Profile<br />
District<br />
Professional degree colleges (contd.)<br />
Pharmacy colleges<br />
Nursing colleges<br />
1998-99 2003-04 1998-99 2003-04<br />
Govt. Pvt. Total Govt. Pvt. Total Govt. Pvt. Total Govt. Pvt. Total<br />
1 367 368 369 370 371 372 373 374 375 376 377 378<br />
1 Bagalkot 0 1 1 0 0 0 0 1 1 0 1 1<br />
2 Bangalore Rural 0 3 3 0 3 3 0 0 0 0 2 2<br />
3 Bangalore Urban 1 13 14 1 15 16 1 16 17 1 83 84<br />
4 Belgaum 0 2 2 0 2 2 0 1 1 0 2 2<br />
5 Bellary 0 1 1 0 1 1 0 1 1 0 3 3<br />
6 Bidar 0 4 4 0 4 4 0 3 3 0 2 2<br />
7 Bijapur 0 1 1 0 1 1 0 1 1 0 2 2<br />
8 Chamarajnagar 0 0 0 0 0 0 0 0 0 0 0 0<br />
9 Chikkamgalur 0 0 0 0 0 0 0 0 0 0 0 0<br />
10 Chitradurga 0 1 1 0 1 1 0 1 1 0 4 4<br />
11 Dakshina Kannada 0 1 1 0 1 1 0 7 7 0 13 13<br />
12 Davangere 0 1 1 0 1 1 0 1 1 0 2 2<br />
13 Dharwad 0 2 2 0 2 2 0 0 0 0 3 3<br />
14 Gadag 0 0 0 0 0 0 0 0 0 0 0 0<br />
15 Gulbarga 0 4 4 0 3 3 0 2 2 0 2 2<br />
16 Hassan 0 0 0 0 0 0 0 2 2 0 4 4<br />
17 Haveri 0 0 0 0 0 0 0 0 0 0 0 0<br />
18 Kodagu 0 0 0 0 0 0 0 0 0 0 0 0<br />
19 Kolar 0 2 2 0 2 2 0 3 3 0 3 3<br />
20 Koppal 0 0 0 0 0 0 0 0 0 0 0 0<br />
21 Mandya 0 2 2 0 2 2 0 1 1 0 1 1<br />
22 Mysore 0 2 2 0 2 2 0 1 1 0 4 4<br />
23 Raichur 0 3 3 0 3 3 0 1 1 0 1 1<br />
24 Shimoga 0 1 1 0 1 1 0 1 1 0 3 3<br />
25 Tumkur 0 1 1 0 1 1 0 3 3 0 7 7<br />
26 Udupi 0 1 1 0 0 0 0 1 1 0 1 1<br />
27 Uttara Kannada 0 0 0 0 0 0 0 0 0 0 1 1<br />
<strong>Karnataka</strong> 1 46 47 1 45 46 1 47 48 1 144 145<br />
Source: Rajiv Gandhi University of Health Sciences, <strong>Karnataka</strong>.<br />
395
Appendix: Statistical Tables<br />
4. Education Profile<br />
District<br />
Professional degree colleges (contd.)<br />
Ayurvedic colleges<br />
Homoeopathy colleges<br />
1998-99 2003-04 1998-99 2003-04<br />
Govt. Pvt. Total Govt. Pvt. Total Govt. Pvt. Total Govt. Pvt. Total<br />
1 379 380 381 382 383 384 385 386 387 388 389 390<br />
1 Bagalkot 0 5 5 0 5 5 0 0 0 0 0 0<br />
2 Bangalore Rural 0 0 0 1 0 1 0 0 0 0 0 0<br />
3 Bangalore Urban 1 2 3 0 4 4 1 1 2 1 1 2<br />
4 Belgaum 0 5 5 1 7 8 0 4 4 0 4 4<br />
5 Bellary 1 1 2 0 1 1 0 0 0 0 0 0<br />
6 Bidar 0 2 2 0 1 1 0 0 0 0 0 0<br />
7 Bijapur 0 3 3 0 4 4 0 1 1 0 1 1<br />
8 Chamarajnagar 0 0 0 0 0 0 0 0 0 0 0 0<br />
9 Chikkamgalur 0 1 1 0 1 1 0 0 0 0 0 0<br />
10 Chitradurga 0 1 1 0 2 2 0 0 0 0 0 0<br />
11 Dakshina Kannada 0 1 1 0 2 2 0 1 1 0 1 1<br />
12 Davangere 0 2 2 0 1 1 0 0 0 0 0 0<br />
13 Dharwad 0 2 2 0 2 2 0 2 2 0 1 1<br />
14 Gadag 0 3 3 0 3 3 0 0 0 0 0 0<br />
15 Gulbarga 0 2 2 0 2 2 0 1 1 0 1 1<br />
16 Hassan 0 1 1 0 1 1 0 0 0 0 0 0<br />
17 Haveri 0 1 1 0 1 1 0 0 0 0 0 0<br />
18 Kodagu 0 0 0 0 0 0 0 0 0 0 0 0<br />
19 Kolar 0 0 0 0 0 0 0 0 0 0 0 0<br />
20 Koppal 0 1 1 0 1 1 0 0 0 0 0 0<br />
21 Mandya 0 0 0 0 0 0 0 0 0 0 0 0<br />
22 Mysore 1 1 2 0 1 1 0 0 0 0 0 0<br />
23 Raichur 0 2 2 0 1 1 0 0 0 0 0 0<br />
24 Shimoga 0 2 2 0 2 2 0 0 0 0 0 0<br />
25 Tumkur 0 0 0 0 0 0 0 0 0 0 0 0<br />
26 Udupi 0 3 3 0 3 3 0 0 0 0 0 0<br />
27 Uttara Kannada 0 1 1 0 1 1 0 0 0 0 0 0<br />
<strong>Karnataka</strong> 3 42 45 2 46 48 1 10 11 1 9 10<br />
Source: Rajiv Gandhi University of Health Sciences, <strong>Karnataka</strong>.<br />
396
<strong>Karnataka</strong> <strong>Human</strong> <strong>Development</strong> <strong>Report</strong> <strong>2005</strong><br />
4. Education Profile<br />
District<br />
Professional degree colleges (contd.)<br />
Unani colleges<br />
Naturopathy colleges<br />
1998-99 2003-04 1998-99 2003-04<br />
Govt. Pvt. Total Govt. Pvt. Total Govt. Pvt. Total Govt. Pvt. Total<br />
1 391 392 393 394 395 396 397 398 399 400 401 402<br />
1 Bagalkot 0 0 0 0 0 0 0 0 0 0 0 0<br />
2 Bangalore Rural 0 0 0 0 0 0 0 0 0 0 0 0<br />
3 Bangalore Urban 1 0 1 1 0 1 0 0 0 0 0 0<br />
4 Belgaum 0 0 0 0 0 0 0 0 0 0 0 0<br />
5 Bellary 0 0 0 0 0 0 0 0 0 0 0 0<br />
6 Bidar 0 0 0 0 0 0 0 0 0 0 0 0<br />
7 Bijapur 0 0 0 0 1 1 0 0 0 0 0 0<br />
8 Chamarajnagar 0 0 0 0 0 0 0 0 0 0 0 0<br />
9 Chikkamgalur 0 0 0 0 0 0 0 0 0 0 0 0<br />
10 Chitradurga 0 0 0 0 0 0 0 0 0 0 0 0<br />
11 Dakshina Kannada 0 0 0 0 0 0 0 1 1 0 2 2<br />
12 Davangere 0 0 0 0 0 0 0 0 0 0 0 0<br />
13 Dharwad 0 0 0 0 0 0 0 0 0 0 0 0<br />
14 Gadag 0 0 0 0 0 0 0 0 0 0 0 0<br />
15 Gulbarga 0 1 1 0 1 1 0 0 0 0 0 0<br />
16 Hassan 0 0 0 0 0 0 0 0 0 0 0 0<br />
17 Haveri 0 0 0 0 0 0 0 0 0 0 0 0<br />
18 Kodagu 0 0 0 0 0 0 0 0 0 0 0 0<br />
19 Kolar 0 0 0 0 0 0 0 0 0 0 0 0<br />
20 Koppal 0 0 0 0 0 0 0 0 0 0 0 0<br />
21 Mandya 0 0 0 0 0 0 0 0 0 0 0 0<br />
22 Mysore 0 0 0 0 0 0 0 0 0 0 0 0<br />
23 Raichur 0 0 0 0 0 0 0 0 0 0 0 0<br />
24 Shimoga 0 0 0 0 0 0 0 0 0 0 0 0<br />
25 Tumkur 0 1 1 0 1 1 0 0 0 0 0 0<br />
26 Udupi 0 0 0 0 0 0 0 0 0 0 0 0<br />
27 Uttara Kannada 0 0 0 0 0 0 0 0 0 0 0 0<br />
<strong>Karnataka</strong> 1 2 3 1 3 4 0 1 1 0 2 2<br />
Source: Rajiv Gandhi University of Health Sciences, <strong>Karnataka</strong>.<br />
397
Appendix: Statistical Tables<br />
4. Education Profile<br />
District<br />
Professional degree colleges (contd.)<br />
Enrolment of students in medical colleges<br />
Enrolment of students in dental colleges<br />
1998-99 2003-04 1998-99 2003-04<br />
Govt. Pvt. Total Govt. Pvt. Total Govt. Pvt. Total Govt. Pvt. Total<br />
1 403 404 405 406 407 408 409 410 411 412 413 414<br />
1 Bagalkot 0 0 0 0 100 100 0 60 60 0 100 100<br />
2 Bangalore Rural 0 0 0 0 0 0 0 0 0 0 0 0<br />
3 Bangalore Urban 149 429 578 150 530 680 46 636 682 57 797 854<br />
4 Belgaum 0 149 149 0 150 150 0 130 130 0 100 100<br />
5 Bellary 95 0 95 100 0 100 0 0 0 0 0 0<br />
6 Bidar 0 0 0 0 0 0 0 75 75 0 80 80<br />
7 Bijapur 0 249 249 0 250 250 0 35 35 0 36 36<br />
8 Chamarajnagar 0 0 0 0 0 0 0 0 0 0 0 0<br />
9 Chikkamgalur 0 0 0 0 0 0 0 0 0 0 0 0<br />
10 Chitradurga 0 0 0 0 0 0 0 60 60 0 60 60<br />
11 Dakshina Kannada 0 0 0 0 500 500 0 290 290 0 340 340<br />
12 Davangere 0 150 150 0 245 245 0 192 192 0 200 200<br />
13 Dharwad 49 0 49 100 0 100 0 100 100 0 100 100<br />
14 Gadag 0 0 0 0 0 0 0 0 0 0 0 0<br />
15 Gulbarga 0 100 100 0 150 150 0 80 80 0 80 80<br />
16 Hassan 0 0 0 0 0 0 0 40 40 0 35 35<br />
17 Haveri 0 0 0 0 0 0 0 0 0 0 0 0<br />
18 Kodagu 0 0 0 0 0 0 0 0 0 0 40 40<br />
19 Kolar 0 150 150 0 150 150 0 40 40 0 40 40<br />
20 Koppal 0 0 0 0 0 0 0 0 0 0 0 0<br />
21 Mandya 0 100 100 0 100 100 0 0 0 0 0 0<br />
22 Mysore 98 150 248 100 150 250 0 98 98 0 138 138<br />
23 Raichur 0 0 0 0 0 0 0 40 40 0 35 35<br />
24 Shimoga 0 0 0 0 0 0 0 36 36 0 34 34<br />
25 Tumkur 0 128 128 0 130 130 0 38 38 1 38 39<br />
26 Udupi 0 0 0 0 0 0 0 0 0 0 0 0<br />
27 Uttara Kannada 0 0 0 0 0 0 0 0 0 0 0 0<br />
<strong>Karnataka</strong> 391 1605 1996 450 2455 2905 46 1950 1996 58 2253 2311<br />
Source: Rajiv Gandhi University of Health Sciences, <strong>Karnataka</strong>.<br />
398
<strong>Karnataka</strong> <strong>Human</strong> <strong>Development</strong> <strong>Report</strong> <strong>2005</strong><br />
4. Education Profile<br />
District<br />
Professional degree colleges (contd.)<br />
Enrolment of students in pharmacy colleges<br />
Enrolment of students in nursing colleges<br />
1998-99 2003-04 1998-99 2003-04<br />
Govt. Pvt. Total Govt. Pvt. Total Govt. Pvt. Total Govt. Pvt. Total<br />
1 415 416 417 418 419 420 421 422 423 424 425 426<br />
1 Bagalkot 0 40 40 0 0 0 0 0 0 0 21 21<br />
2 Bangalore Rural 0 63 63 0 160 160 0 0 0 0 51 51<br />
3 Bangalore Urban 16 389 405 50 809 859 36 211 247 50 3414 3464<br />
4 Belgaum 0 60 60 0 119 119 0 40 40 0 85 85<br />
5 Bellary 0 25 25 0 40 40 0 15 15 0 124 124<br />
6 Bidar 0 70 70 0 179 179 0 10 10 0 36 36<br />
7 Bijapur 0 10 10 0 17 17 0 9 9 0 72 72<br />
8 Chamarajnagar 0 0 0 0 0 0 0 0 0 0 0 0<br />
9 Chikkamgalur 0 0 0 0 0 0 0 0 0 0 0 0<br />
10 Chitradurga 0 22 22 0 35 35 0 0 0 0 81 81<br />
11 Dakshina Kannada 0 43 43 0 81 81 0 251 251 0 608 608<br />
12 Davangere 0 26 26 0 54 54 0 32 32 0 99 99<br />
13 Dharwad 0 26 26 0 100 100 0 0 0 0 66 66<br />
14 Gadag 0 0 0 0 0 0 0 0 0 0 0 0<br />
15 Gulbarga 0 78 78 0 131 131 0 25 25 0 73 73<br />
16 Hassan 0 0 0 0 0 0 0 39 39 0 222 222<br />
17 Haveri 0 0 0 0 0 0 0 0 0 0 0 0<br />
18 Kodagu 0 0 0 0 0 0 0 0 0 0 0 0<br />
19 Kolar 0 13 13 0 51 51 0 99 99 0 141 141<br />
20 Koppal 0 0 0 0 0 0 0 0 0 0 0 0<br />
21 Mandya 0 29 29 0 92 92 0 40 40 0 37 37<br />
22 Mysore 0 49 49 0 136 136 0 25 25 0 108 108<br />
23 Raichur 0 70 70 0 178 178 0 39 39 0 75 75<br />
24 Shimoga 0 60 60 0 57 57 0 0 0 0 85 85<br />
25 Tumkur 0 59 59 0 60 60 0 9 9 0 359 359<br />
26 Udupi 0 48 48 0 0 0 0 50 50 0 90 90<br />
27 Uttara Kannada 0 0 0 0 0 0 0 0 0 0 11 11<br />
<strong>Karnataka</strong> 16 1180 1196 50 2299 2349 36 894 930 50 5858 5908<br />
Source: Rajiv Gandhi University of Health Sciences, <strong>Karnataka</strong>.<br />
399
Appendix: Statistical Tables<br />
4. Education Profile<br />
District<br />
Professional degree colleges (contd.)<br />
Enrolment of students in ayurvedic colleges Enrolment of students in homepathy colleges<br />
1998-99 2003-04 1998-99 2003-04<br />
Govt. Pvt. Total Govt. Pvt. Total Govt. Pvt. Total Govt. Pvt. Total<br />
1 427 428 429 430 431 432 433 434 435 436 437 438<br />
1 Bagalkot 0 96 96 0 220 220 0 0 0 0 0 0<br />
2 Bangalore Rural 0 0 0 0 0 0 0 0 0 0 0 0<br />
3 Bangalore Urban 58 53 111 60 185 245 11 6 17 40 38 78<br />
4 Belgaum 0 145 145 0 315 315 0 97 97 0 245 245<br />
5 Bellary 36 29 65 39 50 89 0 0 0 0 0 0<br />
6 Bidar 0 46 46 0 70 70 0 0 0 0 0 0<br />
7 Bijapur 0 106 106 0 117 117 0 0 0 0 24 24<br />
8 Chamarajnagar 0 0 0 0 0 0 0 0 0 0 0 0<br />
9 Chikkamgalur 0 31 31 0 60 60 0 0 0 0 0 0<br />
10 Chitradurga 0 5 5 0 80 80 0 0 0 0 0 0<br />
11 Dakshina Kannada 0 27 27 0 110 110 0 52 52 0 74 74<br />
12 Davangere 0 24 24 0 50 50 0 0 0 0 0 0<br />
13 Dharwad 0 89 89 0 110 110 0 35 35 0 73 73<br />
14 Gadag 0 35 35 0 140 140 0 0 0 0 0 0<br />
15 Gulbarga 0 13 13 0 52 52 0 27 27 0 96 96<br />
16 Hassan 0 57 57 0 75 75 0 0 0 0 0 0<br />
17 Haveri 0 7 7 0 40 40 0 0 0 0 0 0<br />
18 Kodagu 0 0 0 0 0 0 0 0 0 0 0 0<br />
19 Kolar 0 0 0 0 0 0 0 0 0 0 0 0<br />
20 Koppal 0 3 3 0 40 40 0 0 0 0 0 0<br />
21 Mandya 0 0 0 0 0 0 0 0 0 0 0 0<br />
22 Mysore 47 32 79 50 49 99 0 0 0 0 0 0<br />
23 Raichur 0 18 18 0 40 40 0 0 0 0 0 0<br />
24 Shimoga 0 37 37 0 97 97 0 0 0 0 0 0<br />
25 Tumkur 0 0 0 0 0 0 0 0 0 0 0 0<br />
26 Udupi 0 138 138 0 185 185 0 0 0 0 0 0<br />
27 Uttara Kannada 0 3 3 0 39 39 0 0 0 0 0 0<br />
<strong>Karnataka</strong> 141 994 1135 149 2124 2273 11 217 228 40 550 590<br />
Source: Rajiv Gandhi University of Health Sciences, <strong>Karnataka</strong>.<br />
400
<strong>Karnataka</strong> <strong>Human</strong> <strong>Development</strong> <strong>Report</strong> <strong>2005</strong><br />
4. Education Profile<br />
District<br />
Professional degree colleges (contd.)<br />
Enrolment of students in unani colleges<br />
Enrolment of students in naturopathy colleges<br />
1998-99 2003-04 1998-99 2003-04<br />
Govt. Pvt. Total Govt. Pvt. Total Govt. Pvt. Total Govt. Pvt. Total<br />
1 439 440 441 442 443 444 445 446 447 448 449 450<br />
1 Bagalkot 0 0 0 0 0 0 0 0 0 0 0 0<br />
2 Bangalore Rural 0 0 0 0 0 0 0 0 0 0 0 0<br />
3 Bangalore Urban 18 0 18 30 0 30 0 0 0 0 0 0<br />
4 Belgaum 0 0 0 0 0 0 0 0 0 0 0 0<br />
5 Bellary 0 0 0 0 0 0 0 0 0 0 0 0<br />
6 Bidar 0 0 0 0 0 0 0 0 0 0 0 0<br />
7 Bijapur 0 0 0 0 30 30 0 0 0 0 0 0<br />
8 Chamarajnagar 0 0 0 0 0 0 0 0 0 0 0 0<br />
9 Chikkamgalur 0 0 0 0 0 0 0 0 0 0 0 0<br />
10 Chitradurga 0 0 0 0 0 0 0 0 0 0 0 0<br />
11 Dakshina Kannada 0 0 0 0 0 0 0 23 23 0 69 69<br />
12 Davangere 0 0 0 0 0 0 0 0 0 0 0 0<br />
13 Dharwad 0 0 0 0 0 0 0 0 0 0 0 0<br />
14 Gadag 0 0 0 0 0 0 0 0 0 0 0 0<br />
15 Gulbarga 0 10 10 0 40 40 0 0 0 0 0 0<br />
16 Hassan 0 0 0 0 0 0 0 0 0 0 0 0<br />
17 Haveri 0 0 0 0 0 0 0 0 0 0 0 0<br />
18 Kodagu 0 0 0 0 0 0 0 0 0 0 0 0<br />
19 Kolar 0 0 0 0 0 0 0 0 0 0 0 0<br />
20 Koppal 0 0 0 0 0 0 0 0 0 0 0 0<br />
21 Mandya 0 0 0 0 0 0 0 0 0 0 0 0<br />
22 Mysore 0 0 0 0 0 0 0 0 0 0 0 0<br />
23 Raichur 0 0 0 0 0 0 0 0 0 0 0 0<br />
24 Shimoga 0 0 0 0 0 0 0 0 0 0 0 0<br />
25 Tumkur 0 3 3 0 26 26 0 0 0 0 0 0<br />
26 Udupi 0 0 0 0 0 0 0 0 0 0 0 0<br />
27 Uttara Kannada 0 0 0 0 0 0 0 0 0 0 0 0<br />
<strong>Karnataka</strong> 18 13 31 30 96 126 0 23 23 0 69 69<br />
Source: Rajiv Gandhi University of Health Sciences, <strong>Karnataka</strong>.<br />
401
Appendix: Statistical Tables<br />
5. Health Profile<br />
District<br />
No. of sub-centres<br />
No. of health/medical institutions (government)<br />
No. of primay health centres<br />
(PHCs)<br />
No. of primay health units (PHUs)<br />
1990-91 1998-99 2003-04 1990-91 1998-99 2003-04 1990-91 1998-99 2003-04<br />
1 2 3 4 5 6 7 8 9 10<br />
1 Bagalkot 155 161 161 33 46 46 2 2 2<br />
2 Bangalore Rural 276 286 286 47 73 73 32 29 29<br />
3 Bangalore Urban 134 140 140 23 31 31 43 42 42<br />
4 Belgaum 578 598 598 102 136 136 13 13 13<br />
5 Bellary 240 264 264 38 54 55 21 17 17<br />
6 Bidar 217 231 231 32 42 42 12 13 13<br />
7 Bijapur 271 295 295 39 65 65 3 2 2<br />
8 Chamarajnagar 195 202 202 41 52 52 10 7 7<br />
9 Chikmaglur 328 335 335 36 52 52 44 40 40<br />
10 Chitradurga 196 205 205 40 57 57 31 32 32<br />
11 Dakshina Kannada 447 456 456 55 64 65 4 5 4<br />
12 Davangere 245 253 253 39 70 70 42 33 33<br />
13 Dharwad 164 174 174 21 29 29 3 3 3<br />
14 Gadag 120 126 126 20 29 29 8 6 6<br />
15 Gulbarga 467 512 512 69 105 106 30 24 24<br />
16 Hassan 450 463 463 54 82 82 53 52 52<br />
17 Haveri 287 296 296 37 50 50 23 23 23<br />
18 Kodagu 158 163 163 25 29 29 4 4 4<br />
19 Kolar 359 375 375 63 83 83 38 37 37<br />
20 Koppal 150 172 172 25 43 44 2 2 2<br />
21 Mandya 364 376 376 49 72 73 38 37 37<br />
22 Mysore 477 488 488 69 97 98 49 47 47<br />
23 Raichur 199 206 206 34 47 48 7 6 6<br />
24 Shimoga 365 380 380 39 55 57 38 38 37<br />
25 Tumkur 404 418 418 70 97 98 41 39 39<br />
26 Udupi 245 252 252 51 63 63 12 11 11<br />
27 Uttara Kannada 302 316 316 47 62 63 23 19 19<br />
<strong>Karnataka</strong> 7793 8143 8143 1198 1685 1696 626 583 581<br />
Sources:<br />
1. Col. 2, 5 and 8: Computed based on talukwise fi gures of DHFWS, <strong>Karnataka</strong>.<br />
2. Col. 3, 4, 5, 6, 9 and 10: DHFWS, <strong>Karnataka</strong>.<br />
402
<strong>Karnataka</strong> <strong>Human</strong> <strong>Development</strong> <strong>Report</strong> <strong>2005</strong><br />
5. Health Profile<br />
District<br />
No. of government hospitals<br />
No. of health/medical institutions (government)<br />
Total no. of medical institutions<br />
1990-91 1998-99 2003-04 1990-91 1998-99 2003-04<br />
1 11 12 13 14 15 16<br />
1 Bagalkot 7 17 17 42 66 66<br />
2 Bangalore Rural 4 15 15 91 125 125<br />
3 Bangalore Urban 12 15 15 182 192 192<br />
4 Belgaum 9 25 25 140 190 190<br />
5 Bellary 11 20 20 83 104 105<br />
6 Bidar 5 11 11 50 67 67<br />
7 Bijapur 5 14 14 52 85 85<br />
8 Chamarajnagar 2 6 6 53 67 67<br />
9 Chikmaglur 5 13 13 88 108 108<br />
10 Chitradurga 4 16 16 83 108 108<br />
11 Dakshina Kannada 6 14 14 78 94 94<br />
12 Davangere 5 12 12 86 120 120<br />
13 Dharwad 5 8 8 43 49 49<br />
14 Gadag 7 13 13 35 51 51<br />
15 Gulbarga 12 31 31 122 172 173<br />
16 Hassan 7 22 22 117 159 159<br />
17 Haveri 5 16 16 65 90 90<br />
18 Kodagu 8 16 16 43 55 55<br />
19 Kolar 10 23 23 118 150 150<br />
20 Koppal 5 14 14 32 59 60<br />
21 Mandya 6 15 15 99 130 131<br />
22 Mysore 7 23 23 140 180 181<br />
23 Raichur 4 9 9 50 67 68<br />
24 Shimoga 6 15 15 96 121 122<br />
25 Tumkur 4 14 14 116 151 152<br />
26 Udupi 4 10 10 67 86 86<br />
27 Uttara Kannada 11 23 23 87 110 111<br />
<strong>Karnataka</strong> 176 430 430 2258 2956 2965<br />
Sources:<br />
1. Col. 11 and 14: Computed based on talukwise fi gures of DHFWS, <strong>Karnataka</strong>.<br />
2. Col. 12, 13, 15 and 16: DHFWS, <strong>Karnataka</strong>.<br />
403
Appendix: Statistical Tables<br />
5. Health Profile<br />
District<br />
Rural population served<br />
Per sub-centre<br />
Per PHC<br />
1990-91 1998-99 2003-04 1990-91 1998-99 2003-04<br />
1 17 18 19 20 21 22<br />
1 Bagalkot 6485 6978 7659 30461 24422 26808<br />
2 Bangalore Rural 4963 5042 5293 29147 19752 20736<br />
3 Bangalore Urban 4999 5373 6080 29126 24263 27458<br />
4 Belgaum 4744 5117 5582 26881 22498 24543<br />
5 Bellary 4691 4786 5275 29625 23396 25319<br />
6 Bidar 4655 4825 5228 31566 26538 28756<br />
7 Bijapur 4554 4613 4986 31641 20934 22627<br />
8 Chamarajnagar 3896 3957 4108 18529 15373 15957<br />
9 Chikmaglur 2578 2675 2838 23484 17231 18285<br />
10 Chitradurga 5588 5827 6230 27381 20957 22405<br />
11 Dakshina Kannada 2512 2538 2662 20413 18086 18678<br />
12 Davangere 4566 4782 5071 28685 17283 18327<br />
13 Dharwad 3980 4037 4326 31082 24222 25953<br />
14 Gadag 4676 4837 5166 28054 21015 22448<br />
15 Gulbarga 4223 4277 4692 28585 20853 22662<br />
16 Hassan 2882 2982 3114 24018 16839 17584<br />
17 Haveri 3712 3779 3947 28796 22372 23367<br />
18 Kodagu 2598 2773 2959 16421 15585 16629<br />
19 Kolar 4735 4907 5241 26983 22169 23680<br />
20 Koppal 5400 5466 6160 32400 21866 24079<br />
21 Mandya 3785 3853 3973 28114 20124 20462<br />
22 Mysore 3071 3278 3487 21232 16492 17363<br />
23 Raichur 5124 5665 6249 29993 24828 26818<br />
24 Shimoga 2688 2747 2906 25158 18976 19376<br />
25 Tumkur 4762 4856 5085 27481 20926 21691<br />
26 Udupi 3302 3470 3638 15862 13879 14552<br />
27 Uttara Kannada 3065 3021 3135 19697 15399 15723<br />
<strong>Karnataka</strong> 3987 4144 4461 25934 20024 21418<br />
Source: Computed based on data of DHFWS and Census 1991 population and projected rural population (1998-99 and 2003-04).<br />
404
<strong>Karnataka</strong> <strong>Human</strong> <strong>Development</strong> <strong>Report</strong> <strong>2005</strong><br />
5. Health Profile<br />
District<br />
Population served<br />
per medical institution<br />
Total no. of beds in all medical<br />
institutions (PHCs, CHC, hospitals,<br />
ESI and GoI hospitals)<br />
No. of beds per lakh population<br />
1990-91 1998-99 2003-04 1990-91 1998-99 2003-04 1990-91 1998-99 2003-04<br />
1 23 24 25 26 27 28 29 30 31<br />
1 Bagalkot 33101 23843 26316 654 754 824 47 48 47<br />
2 Bangalore Rural 18387 14529 15460 864 1043 993 52 57 51<br />
3 Bangalore Urban 26589 31343 37185 8668 8694 8798 179 144 123<br />
4 Belgaum 25597 21159 23135 1841 2105 2185 51 52 50<br />
5 Bellary 19952 18408 20360 1688 1828 1949 102 95 91<br />
6 Bidar 25116 21309 23393 744 840 1047 59 59 67<br />
7 Bijapur 29572 20324 22146 932 1114 1268 61 64 67<br />
8 Chamarajnagar 16667 14030 14634 529 641 848 60 68 86<br />
9 Chikmaglur 11560 10209 10939 923 1125 1338 91 102 113<br />
10 Chitradurga 15816 13435 14447 929 1319 1370 71 91 88<br />
11 Dakshina Kannada 21233 19408 20971 1605 1791 1899 97 98 96<br />
12 Davangere 18130 14338 15338 1426 1794 1814 91 104 99<br />
13 Dharwad 31974 31329 34116 1825 1849 1879 133 120 112<br />
14 Gadag 24544 18394 19693 460 513 568 54 55 57<br />
15 Gulbarga 21165 17221 19056 1652 2090 2166 64 71 66<br />
16 Hassan 13416 10540 11019 1457 1749 1929 93 104 110<br />
17 Haveri 19526 15414 16388 560 681 801 44 49 54<br />
18 Kodagu 11359 9605 10171 1257 1279 1309 257 242 234<br />
19 Kolar 18787 16210 17413 2038 2310 2596 92 95 99<br />
20 Koppal 29940 19032 21176 386 526 654 40 47 51<br />
21 Mandya 16610 13281 13577 1160 1396 1622 71 81 91<br />
22 Mysore 16298 14011 14899 3083 3425 3701 135 136 137<br />
23 Raichur 27036 23273 25383 572 712 998 42 46 58<br />
24 Shimoga 15128 13086 13883 1548 1548 1863 107 98 110<br />
25 Tumkur 19878 16539 17403 1154 1394 1622 50 56 61<br />
26 Udupi 15494 12652 13095 908 1068 1005 87 98 89<br />
27 Uttara Kannada 14026 11940 12510 1083 1215 1465 89 93 105<br />
<strong>Karnataka</strong> 19919 17052 18557 39946 44803 48511 89 89 88<br />
Source: Computed based on data of DHFWS and Census 1991 population and projected rural population (1998-99 and 2003-04).<br />
405
Appendix: Statistical Tables<br />
5. Health Profile<br />
District<br />
Population per bed in government<br />
medical institutions<br />
Health staff<br />
(doctors, nurses and ANMS)<br />
Trained dais<br />
1990-91 1998-99 2003-04 1998-99 2003-04 1998-99 2003-04<br />
1 32 33 34 35 36 37 38<br />
1 Bagalkot 2126 2087 2108 426 439 532 550<br />
2 Bangalore Rural 1937 1741 1946 686 691 1750 1840<br />
3 Bangalore Urban 558 692 811 928 930 816 816<br />
4 Belgaum 1947 1910 2012 996 1013 2885 3002<br />
5 Bellary 981 1047 1097 516 513 266 292<br />
6 Bidar 1688 1700 1497 507 516 910 914<br />
7 Bijapur 1650 1551 1485 502 508 1285 1397<br />
8 Chamarajnagar 1670 1466 1156 380 387 447 483<br />
9 Chikmaglur 1102 980 883 629 658 1076 1108<br />
10 Chitradurga 1413 1100 1139 786 777 1010 1022<br />
11 Dakshina Kannada 1032 1019 1038 723 714 754 779<br />
12 Davangere 1093 959 1015 561 568 1286 1396<br />
13 Dharwad 753 830 890 409 397 740 753<br />
14 Gadag 1867 1829 1768 288 291 310 325<br />
15 Gulbarga 1563 1417 1522 786 819 1480 1560<br />
16 Hassan 1077 958 908 743 777 2150 2216<br />
17 Haveri 2266 2037 1841 473 475 1578 1678<br />
18 Kodagu 389 413 427 444 459 440 443<br />
19 Kolar 1088 1053 1006 879 902 1562 1662<br />
20 Koppal 2482 2135 1943 236 265 870 974<br />
21 Mandya 1418 1237 1097 701 707 2400 2525<br />
22 Mysore 740 736 729 1214 1166 1550 1603<br />
23 Raichur 2363 2190 1730 323 330 984 1044<br />
24 Shimoga 938 1023 909 728 733 3290 3375<br />
25 Tumkur 1998 1792 1631 911 879 1300 1350<br />
26 Udupi 1143 1019 1121 434 431 222 264<br />
27 Uttara Kannada 1127 1081 948 703 718 647 670<br />
<strong>Karnataka</strong> 1126 1125 1134 16912 17063 32540 34041<br />
Sources:<br />
1. Col. 32 to 34: Computed based on data of DHFWS and Census/Projected population.<br />
2. Col. 35 to 38: DHFWS, <strong>Karnataka</strong>.<br />
406
<strong>Karnataka</strong> <strong>Human</strong> <strong>Development</strong> <strong>Report</strong> <strong>2005</strong><br />
5. Health Profile<br />
District Untrained dais Total antenatal cases (ANC)<br />
registered<br />
Total no. of deliveries<br />
1998-99 2003-04 1998-99 2003-04 1998-99 2003-04<br />
1 39 40 41 42 43 44<br />
1 Bagalkot 93 75 37712 41876 25585 31265<br />
2 Bangalore Rural 90 38103 34553 27301 26273<br />
3 Bangalore Urban 11 26176 108422 61829 65335<br />
4 Belgaum 349 232 100089 86374 74774 76666<br />
5 Bellary 304 278 44757 56014 43614 44635<br />
6 Bidar 10 6 34022 39040 26946 31419<br />
7 Bijapur 114 2 39069 51256 27087 35903<br />
8 Chamarajnagar 157 121 20151 18270 18562 12074<br />
9 Chikmaglur 80 53 22925 20879 17433 14876<br />
10 Chitradurga 290 278 36072 37990 25169 23233<br />
11 Dakshina Kannada 37 12 26401 25702 21023 23075<br />
12 Davangere 175 65 46934 41900 27430 28379<br />
13 Dharwad 26 13 44347 44329 24159 24247<br />
14 Gadag 35 20 30979 23803 18586 19707<br />
15 Gulbarga 84 4 67451 96157 51592 66894<br />
16 Hassan 216 150 42363 29974 26584 24382<br />
17 Haveri 182 82 40532 38059 25067 26366<br />
18 Kodagu 276 273 10556 9744 11559 7601<br />
19 Kolar 563 463 59356 60529 42083 49370<br />
20 Koppal 385 281 29860 36394 20544 36772<br />
21 Mandya 125 38386 35486 25467 23614<br />
22 Mysore 394 341 48707 46400 36467 43681<br />
23 Raichur 112 52 36294 42644 26585 33180<br />
24 Shimoga 1120 1035 49453 36038 30092 29792<br />
25 Tumkur 50 57840 63232 42444 49834<br />
26 Udupi 78 36 14552 15897 11511 14292<br />
27 Uttara Kannada 53 30 23865 23015 18868 20038<br />
<strong>Karnataka</strong> 5409 3902 1066952 1163977 808361 882903<br />
Source: Directorate of Health and Family Welfare Services (DHFWS), <strong>Karnataka</strong>.<br />
407
Appendix: Statistical Tables<br />
5. Health Profile<br />
District<br />
Percentage of deliveries attended by<br />
Institutions Health staff Trained dias Untrained dais<br />
1998-99 2003-04 1998-99 2003-04 1998-99 2003-04 1998-99 2003-04<br />
1 45 46 47 48 49 50 51 52<br />
1 Bagalkot 31.31 40.65 31.47 28.76 33.81 30.59 3.40 0.00<br />
2 Bangalore Rural 54.19 74.37 24.67 16.56 18.69 8.91 2.45 0.16<br />
3 Bangalore Urban 89.54 91.84 4.91 5.32 4.62 2.69 0.94 0.15<br />
4 Belgaum 44.26 66.05 28.65 18.83 24.45 15.12 2.65 0.00<br />
5 Bellary 34.31 36.37 25.53 22.63 33.85 38.79 6.31 2.22<br />
6 Bidar 24.91 52.23 42.52 23.68 32.38 24.09 0.20 0.00<br />
7 Bijapur 16.88 39.76 37.69 28.80 40.33 31.07 5.10 0.38<br />
8 Chamarajnagar 39.24 58.27 38.53 26.05 19.69 15.68 2.55 0.00<br />
9 Chikmaglur 58.27 76.04 25.51 15.92 12.55 6.86 3.67 1.19<br />
10 Chitradurga 30.45 47.09 38.91 30.59 28.31 21.64 2.32 0.68<br />
11 Dakshina Kannada 83.48 94.50 10.30 2.95 5.96 2.56 0.26 0.00<br />
12 Davangere 42.83 51.91 25.75 24.53 28.55 23.56 2.88 0.00<br />
13 Dharwad 52.17 66.16 21.02 18.32 25.37 15.52 1.44 0.00<br />
14 Gadag 33.81 44.64 30.63 30.65 33.75 24.71 1.81 0.00<br />
15 Gulbarga 15.26 31.94 35.54 24.75 42.15 41.00 7.05 2.31<br />
16 Hassan 52.35 66.49 27.75 20.48 17.57 13.03 2.35 0.00<br />
17 Haveri 17.80 37.03 35.92 33.63 43.68 29.32 2.61 0.02<br />
18 Kodagu 77.53 75.62 7.15 9.95 12.54 14.21 2.79 0.22<br />
19 Kolar 38.32 56.98 28.89 21.95 29.74 21.07 3.05 0.00<br />
20 Koppal 6.85 18.98 38.22 36.45 45.64 43.91 9.29 0.66<br />
21 Mandya 55.11 80.94 25.45 14.30 15.54 4.76 3.93 0.00<br />
22 Mysore 69.96 68.83 25.12 21.32 4.02 9.84 0.89 0.02<br />
23 Raichur 17.27 33.31 21.55 23.33 43.20 43.36 6.69 0.00<br />
24 Shimoga 57.51 78.68 17.92 8.40 22.85 12.92 1.72 0.00<br />
25 Tumkur 45.71 58.82 32.94 33.33 17.84 7.85 3.52 0.00<br />
26 Udupi 85.02 95.12 8.80 2.16 5.20 2.72 0.98 0.00<br />
27 Uttara Kannada 74.02 81.69 9.10 6.67 12.66 11.00 4.22 0.64<br />
<strong>Karnataka</strong> 45.54 57.95 26.28 21.12 24.59 20.53 3.21 0.40<br />
Source: Directorate of Health and Family Welfare Services (DHFWS), <strong>Karnataka</strong>.<br />
408
<strong>Karnataka</strong> <strong>Human</strong> <strong>Development</strong> <strong>Report</strong> <strong>2005</strong><br />
5. Health Profile<br />
District Total fertility rate Infant mortality rate<br />
(IMR)<br />
Crude birth rate<br />
(CBR)<br />
Crude death rate<br />
(CDR)<br />
1991 2001 1991-92 2001-02 1991-92 2001-02 1991-92 2001-02<br />
1 53 54 55 56 57 58 59 60<br />
1 Bagalkot 3.1 95 64 30.4 26.4 10 8.7<br />
2 Bangalore Rural 3.76 2.2 64 48 26.7 18.7 6.8 6.5<br />
3 Bangalore Urban 3.52 1.9 64 45 26 19.6 6.8 6.1<br />
4 Belgaum 3.57 2.7 65 45 27.8 23.9 6.9 6.1<br />
5 Bellary 4.85 3.1 79 53 30.2 26.4 8.2 7.2<br />
6 Bidar 4.82 3.4 87 66 30.1 26.1 9.2 8.4<br />
7 Bijapur 4.27 3.0 95 67 30.4 25.6 10 9.2<br />
8 Chamarajnagar 2.0 79 57 26.9 18.6 8.3 7.8<br />
9 Chikmaglur 3.13 1.9 92 62 29.4 19.2 9.7 8.5<br />
10 Chitradurga 3.6 2.3 75 54 27.9 21.4 7.9 7.3<br />
11 Dakshina Kannada 3.61 1.7 59 44 25.5 18.4 6.2 6<br />
12 Davangere 2.4 75 52 27.9 21.7 7.9 7.1<br />
13 Dharwad 3.94 2.5 97 69 29.6 22.2 10.3 9.4<br />
14 Gadag 2.6 95 66 29.5 23.1 10 9<br />
15 Gulbarga 4.75 3.5 94 67 31.2 28 9.9 9.1<br />
16 Hassan 2.9 1.9 95 59 31 18.1 10 9.1<br />
17 Haveri 2.6 95 66 29.6 22.8 10 9<br />
18 Kodagu 2.77 2.0 86 62 26 20.1 9.1 8.4<br />
19 Kolar 3.89 2.5 78 59 28.3 21.5 8.2 8<br />
20 Koppal 3.4 92 65 30.3 28.8 9.7 8.9<br />
21 Mandya 3.11 1.9 87 62 28.2 17.7 9.2 8.5<br />
22 Mysore 3.56 2.1 79 56 26.9 19.8 8.3 7.7<br />
23 Raichur 4.65 3.3 80 59 30.3 27.8 8.5 7.6<br />
24 Shimoga 3.72 2.0 60 45 26.2 20.7 6.3 6.1<br />
25 Tumkur 3.46 2.2 76 53 27.7 19.2 8 7.2<br />
26 Udupi 1.5 59 45 25.4 15.8 6.2 6.1<br />
27 Uttara Kannada 3.66 2.2 85 59 26.7 20.7 9 8<br />
<strong>Karnataka</strong> 3.87 2.4 82 55 27 22.4 8.6 7.5<br />
Sources:<br />
1. Col. 53: Offi ce of RGI, for 20 districts, GoI,<br />
2. Col. 54: Computed by Dr. Christopher Z.Guilmoto and Dr. Indira Rajan,<br />
3. Col. 55 to 60: Computed by Dr. P. J. Bhattacharjee (Methodology in Technical Note).<br />
409
Appendix: Statistical Tables<br />
5. Health Profile<br />
District<br />
Life expectancy at birth<br />
1991-92 2001-02<br />
Persons Male Female Persons Male Female<br />
1 61 62 63 64 65 66<br />
1 Bagalkot 59.0 58.0 60.0 60.8 60.3 61.3<br />
2 Bangalore Rural 64.4 63.0 65.8 66.5 65.0 68.0<br />
3 Bangalore Urban 64.8 63.3 66.3 67.3 65.9 68.7<br />
4 Belgaum 64.4 63.4 65.4 67.7 66.2 69.2<br />
5 Bellary 62.8 61.8 63.7 66.1 64.6 67.6<br />
6 Bidar 61.0 60.0 62.0 63.3 62.3 64.3<br />
7 Bijapur 59.2 58.3 60.0 62.6 61.6 63.6<br />
8 Chamarajnagar 62.5 61.5 63.5 63.5 62.5 64.5<br />
9 Chikmaglur 60.1 59.0 61.1 63.2 62.2 64.2<br />
10 Chitradurga 62.8 61.8 63.8 64.6 63.6 65.6<br />
11 Dakshina Kannada 66.0 64.5 67.5 67.4 65.9 68.5<br />
12 Davangere 63.0 62.0 64.0 65.8 64.3 67.3<br />
13 Dharwad 59.1 58.2 60.0 61.9 61.4 62.4<br />
14 Gadag 60.0 59.0 61.0 62.7 61.7 63.7<br />
15 Gulbarga 59.5 58.5 60.4 62.9 61.9 63.9<br />
16 Hassan 59.5 58.6 60.3 65.2 63.7 66.7<br />
17 Haveri 59.6 58.5 60.7 62.2 61.2 63.2<br />
18 Kodagu 61.0 60.0 62.0 63.3 62.3 64.3<br />
19 Kolar 62.0 61.0 63.0 64.2 63.2 65.2<br />
20 Koppal 60.0 59.0 61.0 63.5 62.5 64.5<br />
21 Mandya 60.9 59.9 61.8 62.9 61.9 63.9<br />
22 Mysore 62.9 61.8 63.9 64.8 62.8 66.3<br />
23 Raichur 60.4 59.5 61.2 63.9 62.9 64.9<br />
24 Shimoga 65.8 64.3 67.3 67.4 65.9 68.9<br />
25 Tumkur 63.0 62.0 64.0 65.3 63.8 66.8<br />
26 Udupi 66.1 64.6 67.6 67.8 66.3 69.3<br />
27 Uttara Kannada 60.9 59.9 61.8 62.9 61.9 63.9<br />
<strong>Karnataka</strong> 62.1 61.0 63.2 65.8 64.5 67.0<br />
Source: Computed by Dr. P. J. Bhattacharjee (Methodology in Technical Note).<br />
410
<strong>Karnataka</strong> <strong>Human</strong> <strong>Development</strong> <strong>Report</strong> <strong>2005</strong><br />
5. Health Profile<br />
District<br />
One year infants fully immunised (in lakh)<br />
DPT Polio BCG Measles Fully immunised %<br />
1998-99 2003-04 1998-99 2003-04 1998-99 2003-04 1998-99 2003-04 1998-99 2003-04<br />
1 67 68 69 70 71 72 73 74 75 76<br />
1 Bagalkot 38868 34403 38979 35376 37085 40360 35290 26258 99.02 64.36<br />
2 Bangalore Rural 38066 33681 38066 33681 38737 34155 35170 31984 97.74 92.71<br />
3 Bangalore Urban 126825 104836 126825 104836 131269 97291 114428 94200 82.89 72.07<br />
4 Belgaum 97126 82070 97126 82070 98659 81538 91257 66296 94.16 74.32<br />
5 Bellary 38989 50246 38989 50246 43189 55395 37230 46830 73.03 77.28<br />
6 Bidar 35209 37953 25209 37953 30410 40585 32844 35866 74.67 89.00<br />
7 Bijapur 40639 43723 40888 43976 36716 48783 36358 33505 94.19 77.56<br />
8 Chamarajnagar 18332 16256 18332 16256 17836 16303 17217 15270 85.62 84.83<br />
9 Chikmaglur 20435 20451 20435 20451 20958 20740 19147 19374 77.44 95.91<br />
10 Chitradurga 34448 30194 34448 30194 37443 32376 32378 27940 122.30 80.75<br />
11 Dakshina Kannada 24078 23494 24078 23494 23153 23422 22351 23131 65.50 93.27<br />
12 Davangere 38259 37041 38259 37041 39331 40839 34674 35208 122.85 93.39<br />
13 Dharwad 48572 38186 48619 38186 50392 43517 46475 32552 103.77 86.34<br />
14 Gadag 22412 22095 22441 22095 20496 21776 21687 19976 97.84 86.85<br />
15 Gulbarga 66777 74236 66777 74236 65571 78784 62328 69898 86.16 80.99<br />
16 Hassan 33982 28328 33982 28328 33828 26939 30076 24910 94.82 84.44<br />
17 Haveri 34013 28861 34832 28861 32738 29426 33123 23957 109.99 81.21<br />
18 Kodagu 10972 10491 10972 10491 11738 10116 10531 9978 117.28 109.65<br />
19 Kolar 56610 54364 56610 54364 58790 57454 52669 47958 99.80 79.27<br />
20 Koppal 24563 29083 24563 29083 21648 30974 21849 24244 67.16 72.80<br />
21 Mandya 34137 27327 34137 27327 33894 27687 32077 25495 87.17 81.45<br />
22 Mysore 47421 43320 47421 43320 53477 46086 44852 42229 88.74 90.23<br />
23 Raichur 33801 37686 33801 37686 31385 40352 32458 35172 92.89 88.82<br />
24 Shimoga 35407 37187 35407 37187 34129 37286 34108 35572 88.44 109.45<br />
25 Tumkur 53649 53058 53649 53058 56675 55456 50302 47446 85.25 78.42<br />
26 Udupi 14526 14723 14526 14723 14089 14553 13108 14350 52.14 93.79<br />
27 Uttara Kannada 21404 21502 21404 21502 20149 21582 20943 17996 77.23 79.98<br />
<strong>Karnataka</strong> 1089520 1034795 1080775 1036021 1093785 1073775 1014930 927595 88.79 81.94<br />
Source: Directorate of Health and Family Welfare Services (DHFWS), <strong>Karnataka</strong>.<br />
411
Appendix: Statistical Tables<br />
5. Health Profile<br />
District<br />
Prevalence rate of<br />
leprosy<br />
1998-<br />
99<br />
2003-<br />
04<br />
Cumulative<br />
1987 to<br />
1998<br />
AIDS cases<br />
HIV +ve AIDS cases Deaths due to AIDS<br />
1987 to<br />
2003<br />
Cumulative<br />
1987 to<br />
1998<br />
1987 to<br />
2003<br />
Cumulative<br />
1987 to<br />
1998<br />
1 77 78 79 80 81 82 83 84<br />
1 Bagalkot 4.75 1.93 1 1517 0 17 0 3<br />
2 Bangalore Rural 2.12 0.94 108 344 8 21 3 6<br />
3 Bangalore Urban 2.00 0.85 1818 4774 58 355 19 46<br />
4 Belgaum 2.07 1.07 69 912 0 20 0 1<br />
5 Bellary 6.43 3.68 98 2294 6 56 0 0<br />
6 Bidar 6.43 1.47 7 108 2 2 2 2<br />
7 Bijapur 4.93 1.40 105 837 0 4 0 0<br />
8 Chamarajnagar 3.10 2.64 1 143 0 3 0 0<br />
9 Chikmaglur 1.15 0.55 46 315 3 42 2 5<br />
10 Chitradurga 1.39 0.76 94 366 6 21 2 3<br />
11 Dakshina Kannada 1.60 0.72 12 415 0 37 0 0<br />
12 Davangere 2.14 1.75 96 2258 2 299 2 38<br />
13 Dharwad 2.39 1.61 1 759 0 40 0 1<br />
14 Gadag 3.40 2.33 52 550 3 7 3 3<br />
15 Gulbarga 6.46 3.46 79 400 5 22 2 2<br />
16 Hassan 0.25 0.15 4 559 1 42 0 8<br />
17 Haveri 3.47 2.10 87 530 5 49 0 6<br />
18 Kodagu 0.66 0.11 6 661 1 15 0 1<br />
19 Kolar 3.07 1.53 7 96 1 4 1 1<br />
20 Koppal 5.85 3.79 208 713 11 49 5 6<br />
21 Mandya 1.28 0.88 735 1325 12 21 9 9<br />
22 Mysore 1.08 0.75 111 686 8 20 5 7<br />
23 Raichur 4.72 2.82 111 623 7 25 5 6<br />
24 Shimoga 1.29 1.01 119 507 1 91 1 6<br />
25 Tumkur 1.35 0.46 89 598 7 49 1 3<br />
26 Udupi 1.30 1.40 135 1451 1 306 0 16<br />
27 Uttara Kannada 2.79 1.62 110 495 4 113 4 10<br />
<strong>Karnataka</strong> 2.87 1.55 4309 24236 152 1730 66 189<br />
Source: Directorate of Health and Family Welfare Services (DHFWS), <strong>Karnataka</strong>.<br />
1987 to<br />
2003<br />
412
<strong>Karnataka</strong> <strong>Human</strong> <strong>Development</strong> <strong>Report</strong> <strong>2005</strong><br />
5. Health Profile<br />
District Eligible couples protected (%)<br />
Permanent method Temporary method All methods<br />
1998-99 2002-03 1998-99 2002-03 1998-99 2002-03<br />
1 85 86 87 88 89 90<br />
1 Bagalkot 42.3 46.1 13.1 11.4 55.4 57.4<br />
2 Bangalore Rural 56.6 58.9 12.5 11.6 69.1 70.5<br />
3 Bangalore Urban 46.9 43.8 11.2 8.3 58.1 52.1<br />
4 Belgaum 52.6 57.6 18.6 15.1 71.2 72.7<br />
5 Bellary 37.9 44.0 10.4 8.3 48.3 52.3<br />
6 Bidar 48.1 55.5 13.1 13.5 61.2 68.9<br />
7 Bijapur 42.4 45.7 13.9 12.7 56.2 58.3<br />
8 Chamarajnagar 54.5 59.0 13.3 12.5 67.8 71.4<br />
9 Chikmaglur 56.3 54.3 12.1 12.1 68.5 66.4<br />
10 Chitradurga 46.6 48.5 1.2 13.5 56.9 62.0<br />
11 Dakshina Kannada 41.0 40.0 10.8 10.3 51.8 50.3<br />
12 Davangere 46.7 46.4 11.2 14.8 57.9 61.2<br />
13 Dharwad 48.5 50.8 12.1 13.1 60.6 63.9<br />
14 Gadag 48.5 50.6 10.8 11.9 59.3 62.5<br />
15 Gulbarga 34.1 37.6 10.5 8.8 44.6 46.4<br />
16 Hassan 57.2 57.3 11.3 10.7 68.5 68.0<br />
17 Haveri 48.5 51.3 15.0 13.3 63.5 64.7<br />
18 Kodagu 51.4 48.9 14.5 15.8 65.9 63.2<br />
19 Kolar 49.4 54.7 13.5 13.2 62.9 67.8<br />
20 Koppal 31.8 35.8 8.6 9.3 40.4 45.0<br />
21 Mandya 58.8 60.1 13.1 9.8 71.9 69.9<br />
22 Mysore 54.7 57.9 12.0 12.5 66.7 70.4<br />
23 Raichur 31.9 35.8 9.0 10.8 40.9 46.6<br />
24 Shimoga 54.5 50.7 11.1 15.2 65.6 65.8<br />
25 Tumkur 45.7 45.3 10.7 1.2 56.4 55.5<br />
26 Udupi 41.1 40.8 9.8 9.9 50.9 50.7<br />
27 Uttara Kannada 38.8 43.9 15.4 13.6 54.2 57.5<br />
<strong>Karnataka</strong> 47.0 48.8 12.2 11.5 59.2 60.3<br />
Source: Directorate of Health and Family Welfare Services (DHFWS), <strong>Karnataka</strong>.<br />
413
Appendix: Statistical Tables<br />
5. Health Profile<br />
District<br />
No. of sterilisation cases<br />
Total<br />
Females<br />
1998-99 2003-04 1998-99 2003-04<br />
1 91 92 93 94<br />
1 Bagalkot 11670 13690 11652 13681<br />
2 Bangalore Rural 15062 14881 15062 14874<br />
3 Bangalore Urban 51418 37004 51278 36865<br />
4 Belgaum 40394 37156 40387 36960<br />
5 Bellary 10471 13568 10461 13546<br />
6 Bidar 11659 13975 11659 13975<br />
7 Bijapur 11075 14923 11074 14916<br />
8 Chamarajnagar 7243 7746 7243 7746<br />
9 Chikmaglur 8707 7809 8703 7798<br />
10 Chitradurga 10946 9620 10943 9616<br />
11 Dakshina Kannada 7397 7759 7384 7693<br />
12 Davangere 11310 15296 11307 15285<br />
13 Dharwad 13167 11311 13149 11169<br />
14 Gadag 6679 6952 6677 6951<br />
15 Gulbarga 15452 21286 15447 21275<br />
16 Hassan 14341 9780 14327 9756<br />
17 Haveri 10542 11654 10541 11653<br />
18 Kodagu 3519 3851 3519 3844<br />
19 Kolar 20235 19300 20234 19298<br />
20 Koppal 5487 8410 5487 8409<br />
21 Mandya 14895 12457 14894 12455<br />
22 Mysore 21900 22577 21878 22562<br />
23 Raichur 7702 12984 7700 12982<br />
24 Shimoga 12567 12773 12557 12703<br />
25 Tumkur 15823 17805 15822 17801<br />
26 Udupi 5391 5521 5378 5503<br />
27 Uttara Kannada 7522 7693 7515 7685<br />
<strong>Karnataka</strong> 372574 377781 372278 377001<br />
Source: Directorate of Health and Family Welfare Services, <strong>Karnataka</strong>.<br />
414
<strong>Karnataka</strong> <strong>Human</strong> <strong>Development</strong> <strong>Report</strong> <strong>2005</strong><br />
6. Economic Growth<br />
District<br />
District income (GDDP) at current<br />
prices (in Rs. lakh)<br />
District income (NDDP) at current<br />
prices (in Rs. lakh)<br />
Per capita district income (GDDP) at<br />
current prices<br />
1990-91 1998-99 2001-02 1990-91 1998-99 2001-02 1990-91 1998-99 2001-02<br />
1 2 3 4 5 6 7 8 9 10<br />
1 Bagalkot 67179 248274 289274 61681 225998 261180 4802 15491 17320<br />
2 Bangalore Rural 74983 308982 488912 67292 275147 414126 4717 16967 25762<br />
3 Bangalore Urban 439041 1741305 2479765 396915 1539371 2097138 7949 27520 37606<br />
4 Belgaum 186797 648301 718859 169916 584877 642472 5244 15886 16902<br />
5 Bellary 88504 293920 366352 80371 263299 323854 5161 14962 17895<br />
6 Bidar 47088 159903 186261 43127 142899 168077 3704 10980 12273<br />
7 Bijapur 73534 215459 263445 67084 194066 239266 4801 12280 14408<br />
8 Chamarajnagar 41751 138550 148700 38205 125751 135296 5114 14813 15255<br />
9 Chikmaglur 74597 230757 244570 67696 207197 220799 7735 20884 21240<br />
10 Chitradurga 61854 197850 227932 56673 180239 207120 4837 13506 14930<br />
11 Dakshina Kannada 169754 593013 586747 153827 516619 524735 10572 32237 30607<br />
12 Davangere 74936 249962 279383 68533 227358 254300 4945 14399 15443<br />
13 Dharwad 86582 289828 309064 78928 260357 273630 6376 18630 19064<br />
14 Gadag 35352 122158 152212 32099 109762 137685 4296 12957 15492<br />
15 Gulbarga 103770 360988 421592 94852 326915 380602 3922 11909 13346<br />
16 Hassan 71074 226007 264462 65158 204592 240021 4877 13536 15199<br />
17 Haveri 42394 168839 194874 38886 154084 174367 3482 12106 13407<br />
18 Kodagu 54316 158421 144894 50700 146712 133400 11764 29949 26285<br />
19 Kolar 98695 347274 385359 88994 310578 345638 4619 14188 15107<br />
20 Koppal 40613 139083 208656 37200 126911 183016 4019 12014 17295<br />
21 Mandya 73572 237076 267898 67314 215503 244670 4932 13873 15043<br />
22 Mysore 117402 440043 542869 107073 396886 478344 5283 17283 20459<br />
23 Raichur 58885 172458 199892 54128 157402 182772 4220 10787 11997<br />
24 Shimoga 79462 290693 305872 72640 261732 278223 5724 18278 18455<br />
25 Tumkur 98555 356689 376164 89961 321324 337555 4513 14255 14426<br />
26 Udupi 78130 237678 262018 71532 210177 236505 8317 22085 23362<br />
27 Uttara Kannada 64148 210585 249747 58755 189867 223493 5599 16042 18256<br />
<strong>Karnataka</strong> 2502970 8784096 10565775 2279539 7875623 9338282 5606 17173 19821<br />
Note: Worked out at Constant Prices with reference to the base year 1993-94.<br />
Source: Directorate of Economics and Statistics, <strong>Karnataka</strong>.<br />
415
Appendix: Statistical Tables<br />
6. Economic Growth<br />
District<br />
Per capita district income (NDDP)<br />
at current prices<br />
District income (GDDP) at<br />
constant prices (in Rs. lakh)<br />
District income (NDDP) at<br />
constant prices (in Rs. lakh)<br />
1990-91 1998-99 2001-02 1990-91 1998-99 2001-02 1990-91 1998-99 2001-02<br />
1 11 12 13 14 15 16 17 18 19<br />
1 Bagalkot 4409 14101 15638 91075 181027 193023 83180 164245 175511<br />
2 Bangalore Rural 4233 15109 21821 102153 214075 325366 91171 189549 275463<br />
3 Bangalore Urban 7187 24329 31804 542112 1231629 1633607 482628 1078603 1366790<br />
4 Belgaum 4770 14332 15106 250338 455440 471442 226223 409067 423151<br />
5 Bellary 4687 13403 15819 124775 215345 251638 113024 189958 222556<br />
6 Bidar 3393 9812 11075 65290 109248 116167 59446 97051 105017<br />
7 Bijapur 4380 11060 13085 100495 144752 166248 91395 129635 151821<br />
8 Chamarajnagar 4680 13444 13880 57028 99310 99254 51956 89937 91104<br />
9 Chikmaglur 7019 18752 19175 97722 126567 153468 89500 114585 140459<br />
10 Chitradurga 4432 12304 13567 85128 136571 155036 77702 124104 141830<br />
11 Dakshina Kannada 9581 28084 27373 214989 420912 396469 194437 361571 353643<br />
12 Davangere 4523 13097 14056 103263 171774 180721 93958 155310 165387<br />
13 Dharwad 5813 16736 16878 107347 205689 203455 96593 183747 179809<br />
14 Gadag 3901 11642 14013 48700 84476 104219 43978 75382 95375<br />
15 Gulbarga 3585 10785 12049 145642 240000 272157 132362 215862 246493<br />
16 Hassan 4471 12253 13794 97370 152865 178587 88820 137726 163504<br />
17 Haveri 3194 11048 11996 59047 117491 126155 53904 106827 113266<br />
18 Kodagu 10981 27736 24200 74288 91589 103842 69071 84232 96494<br />
19 Kolar 4165 12689 13550 132873 235217 245364 119310 208833 221040<br />
20 Koppal 3681 10962 15170 55330 93660 131288 50358 85071 114518<br />
21 Mandya 4513 12611 13739 100608 167398 176453 91651 151823 162058<br />
22 Mysore 4818 15588 18027 153071 304323 349666 138212 272592 307378<br />
23 Raichur 3879 9845 10970 84033 112845 126273 76992 102375 115736<br />
24 Shimoga 5233 16457 16787 108238 195658 201404 98387 175102 184388<br />
25 Tumkur 4119 12842 12945 133952 242520 245319 121483 217480 221615<br />
26 Udupi 7615 19529 21087 100640 167648 173515 91595 146704 156530<br />
27 Uttara Kannada 5128 14464 16337 89239 143937 164744 81409 128717 147704<br />
<strong>Karnataka</strong> 5106 15396 17518 3324746 6061965 6944876 3008747 5396088 6138640<br />
Note: Worked out at Constant Prices with reference to the base year 1993-94.<br />
Source: Directorate of Economics and Statistics, <strong>Karnataka</strong> and Central Statistical Organisation (for state).<br />
416
<strong>Karnataka</strong> <strong>Human</strong> <strong>Development</strong> <strong>Report</strong> <strong>2005</strong><br />
6. Economic Growth<br />
District Per capita district income (GDDP) at constant prices Per capita district income (NDDP) at constant prices<br />
1990-91 1998-99 2001-02 1990-91 1998-99 2001-02<br />
1 20 21 22 23 24 25<br />
1 Bagalkot 6511 11295 11557 5946 10248 10508<br />
2 Bangalore Rural 6427 11755 17144 5736 10408 14515<br />
3 Bangalore Urban 9816 19465 24774 8739 17046 20728<br />
4 Belgaum 7028 11160 11085 6351 10024 9949<br />
5 Bellary 7277 10962 12291 6591 9670 10871<br />
6 Bidar 5136 7502 7654 4676 6664 6920<br />
7 Bijapur 6562 8250 9092 5968 7388 8303<br />
8 Chamarajnagar 6985 10617 10182 6364 9615 9346<br />
9 Chikmaglur 10132 11455 13328 9280 10370 12198<br />
10 Chitradurga 6658 9323 10155 6077 8472 9290<br />
11 Dakshina Kannada 13390 22882 20682 12110 19656 18448<br />
12 Davangere 6815 9895 9989 6201 8946 9142<br />
13 Dharwad 7905 13222 12549 7114 11811 11091<br />
14 Gadag 5918 8960 10607 5344 7996 9707<br />
15 Gulbarga 5505 7918 8616 5003 7122 7803<br />
16 Hassan 6681 9155 10263 6094 8249 9397<br />
17 Haveri 4850 8424 8679 4428 7659 7793<br />
18 Kodagu 16090 17315 18838 14960 15924 17505<br />
19 Kolar 6219 9610 9619 5584 8532 8665<br />
20 Koppal 5476 8090 10882 4983 7348 9492<br />
21 Mandya 6745 9796 9908 6145 8884 9100<br />
22 Mysore 6888 11952 13178 6219 10706 11584<br />
23 Raichur 6022 7058 7579 5517 6403 6946<br />
24 Shimoga 7797 12302 12152 7087 11010 11125<br />
25 Tumkur 6133 9693 9408 5562 8692 8499<br />
26 Udupi 10714 15578 15471 9751 13632 13957<br />
27 Uttara Kannada 7788 10965 12043 7105 9805 10797<br />
<strong>Karnataka</strong> 7447 11851 13057 6739 10549 11516<br />
Note: Worked out at Constant Prices with reference to the base year 1993-94.<br />
Source: Directorate of Economics and Statistics, <strong>Karnataka</strong> and Central Statistical Organisation (for state).<br />
417
Appendix: Statistical Tables<br />
6. Economic Growth<br />
District<br />
Percentage share of district income (GDDP) at<br />
Current prices<br />
Constant prices<br />
1990-91 1998-99 2001-02 1990-91 1998-99 2001-02<br />
1 26 27 28 29 30 31<br />
1 Bagalkot 2.7 2.8 2.7 2.7 2.9 2.8<br />
2 Bangalore Rural 3.0 3.5 4.6 3.0 3.5 4.4<br />
3 Bangalore Urban 17.5 19.8 23.5 17.4 19.5 22.5<br />
4 Belgaum 7.5 7.4 6.8 7.5 7.4 6.9<br />
5 Bellary 3.5 3.3 3.5 3.5 3.3 3.5<br />
6 Bidar 1.9 1.8 1.8 1.9 1.8 1.8<br />
7 Bijapur 2.9 2.5 2.5 2.9 2.5 2.6<br />
8 Chamarajnagar 1.7 1.6 1.4 1.7 1.6 1.4<br />
9 Chikmaglur 3.0 2.6 2.3 3.0 2.6 2.4<br />
10 Chitradurga 2.5 2.3 2.2 2.5 2.3 2.2<br />
11 Dakshina Kannada 6.8 6.8 5.6 6.7 6.6 5.6<br />
12 Davangere 3.0 2.8 2.6 3.0 2.9 2.7<br />
13 Dharwad 3.5 3.3 2.9 3.5 3.3 2.9<br />
14 Gadag 1.4 1.4 1.4 1.4 1.4 1.5<br />
15 Gulbarga 4.1 4.1 4.0 4.2 4.2 4.1<br />
16 Hassan 2.8 2.6 2.5 2.9 2.6 2.6<br />
17 Haveri 1.7 1.9 1.8 1.7 2.0 1.9<br />
18 Kodagu 2.2 1.8 1.4 2.2 1.9 1.4<br />
19 Kolar 3.9 4.0 3.6 3.9 3.9 3.7<br />
20 Koppal 1.6 1.6 2.0 1.6 1.6 2.0<br />
21 Mandya 2.9 2.7 2.5 3.0 2.7 2.6<br />
22 Mysore 4.7 5.0 5.1 4.7 5.0 5.1<br />
23 Raichur 2.4 2.0 1.9 2.4 2.0 2.0<br />
24 Shimoga 3.2 3.3 2.9 3.2 3.3 3.0<br />
25 Tumkur 3.9 4.1 3.6 3.9 4.1 3.6<br />
26 Udupi 3.1 2.7 2.5 3.1 2.7 2.5<br />
27 Uttara Kannada 2.6 2.4 2.4 2.6 2.4 2.4<br />
<strong>Karnataka</strong> 100.0 100.0 100.0 100.0 100.0 100.0<br />
Source: Directorate of Economics and Statistics, <strong>Karnataka</strong>.<br />
418
<strong>Karnataka</strong> <strong>Human</strong> <strong>Development</strong> <strong>Report</strong> <strong>2005</strong><br />
6. Economic Growth<br />
District<br />
Sector-wise percentage share in total district income (GDDP) at current prices<br />
Primary sector Secondary sector Tertiary sector<br />
1990-91 1998-99 2001-02 1990-91 1998-99 2001-02 1990-91 1998-99 2001-02<br />
1 32 33 34 35 36 37 38 39 40<br />
1 Bagalkot 41.2 40.5 40.0 30.6 28.3 22.9 28.2 31.2 37.1<br />
2 Bangalore Rural 37.5 32.9 29.8 32.4 26.8 29.7 30.1 40.3 40.5<br />
3 Bangalore Urban 3.9 3.5 1.9 41.2 37.3 36.0 55.0 59.2 62.1<br />
4 Belgaum 40.5 39.8 33.3 26.7 26.4 23.1 32.9 33.8 43.7<br />
5 Bellary 45.0 37.3 31.9 19.4 21.9 20.7 35.6 40.8 47.4<br />
6 Bidar 47.5 35.1 31.0 18.5 21.9 16.9 33.9 43.0 52.1<br />
7 Bijapur 51.3 35.3 35.1 16.1 20.6 16.0 32.6 44.1 48.8<br />
8 Chamarajnagar 51.9 47.6 45.7 22.2 22.8 15.8 25.9 29.6 38.5<br />
9 Chikmaglur 59.7 52.8 46.3 10.3 12.1 10.0 30.0 35.1 43.6<br />
10 Chitradurga 48.1 42.6 37.0 20.0 21.1 17.3 31.8 36.3 45.7<br />
11 Dakshina Kannada 17.4 15.4 13.7 42.3 43.2 22.1 40.3 41.4 64.1<br />
12 Davangere 46.8 43.0 39.7 24.3 25.0 18.4 28.9 31.9 41.9<br />
13 Dharwad 20.3 22.7 16.0 25.7 29.3 27.4 54.0 48.0 56.6<br />
14 Gadag 37.2 31.6 27.4 31.0 31.5 19.8 31.8 36.9 52.8<br />
15 Gulbarga 46.0 36.4 30.8 20.2 22.6 20.9 33.8 40.9 48.3<br />
16 Hassan 51.8 43.2 38.2 14.3 18.2 14.6 33.9 38.6 47.2<br />
17 Haveri 45.0 46.1 35.3 25.5 21.6 20.9 29.5 32.3 43.8<br />
18 Kodagu 63.6 58.6 46.4 7.2 9.8 9.5 29.2 31.7 44.1<br />
19 Kolar 41.6 42.3 38.6 23.6 23.2 17.2 34.8 34.4 44.3<br />
20 Koppal 49.3 35.4 29.4 19.3 20.0 25.4 31.4 44.6 45.2<br />
21 Mandya 51.2 43.6 40.8 17.7 20.1 15.5 31.1 36.2 43.7<br />
22 Mysore 28.3 28.7 23.0 27.0 26.1 25.6 44.6 45.2 51.4<br />
23 Raichur 54.5 46.8 41.1 10.8 14.3 12.6 34.8 38.9 46.3<br />
24 Shimoga 43.7 38.6 34.0 22.0 22.7 16.8 34.2 38.7 49.2<br />
25 Tumkur 43.2 42.5 34.3 24.6 23.6 20.3 32.2 33.8 45.4<br />
26 Udupi 27.5 24.0 25.5 30.1 34.8 19.0 42.4 41.2 55.4<br />
27 Uttara Kannada 37.4 29.0 23.3 22.2 29.3 26.8 40.4 41.7 49.9<br />
<strong>Karnataka</strong> 34.5 29.9 24.8 26.9 27.6 24.2 38.6 42.5 51.1<br />
Source: Directorate of Economics and Statistics, <strong>Karnataka</strong>.<br />
419
Appendix: Statistical Tables<br />
6. Economic Growth<br />
District<br />
Sector-wise percentage share in total district income (GDDP) at constant prices<br />
Primary sector Secondary sector Tertiary sector<br />
1990-91 1998-99 2001-02 1990-91 1998-99 2001-02 1990-91 1998-99 2001-02<br />
1 41 42 43 44 45 46 47 48 49<br />
1 Bagalkot 40.2 41.8 41.8 29.0 28.6 24.2 30.7 29.6 34.0<br />
2 Bangalore Rural 36.4 31.6 31.6 30.9 28.1 30.0 32.6 40.3 38.4<br />
3 Bangalore Urban 4.1 3.0 1.8 44.7 39.2 38.1 51.1 57.8 60.2<br />
4 Belgaum 39.8 39.4 34.3 26.0 27.5 24.7 34.2 33.1 41.0<br />
5 Bellary 44.3 37.5 35.3 18.2 21.7 20.7 37.5 40.7 44.0<br />
6 Bidar 45.2 35.6 34.1 17.7 23.3 18.8 37.1 41.1 47.1<br />
7 Bijapur 49.1 34.2 35.6 15.6 22.0 17.7 35.3 43.8 46.7<br />
8 Chamarajnagar 50.5 48.5 48.4 21.1 23.3 16.5 28.5 28.2 35.1<br />
9 Chikmaglur 55.9 46.6 48.2 10.4 16.0 11.0 33.7 37.4 40.7<br />
10 Chitradurga 46.1 42.0 40.2 19.0 22.1 17.8 34.9 35.9 42.0<br />
11 Dakshina Kannada 19.1 13.6 17.0 44.2 46.1 23.3 36.7 40.3 59.7<br />
12 Davangere 44.9 41.4 41.1 23.3 26.9 19.9 31.7 31.7 39.0<br />
13 Dharwad 21.5 22.5 17.9 27.6 30.5 29.1 51.0 47.0 53.0<br />
14 Gadag 35.6 30.9 30.2 29.3 33.4 20.4 35.1 35.8 49.4<br />
15 Gulbarga 44.5 34.0 32.1 19.0 24.9 22.7 36.6 41.0 45.2<br />
16 Hassan 50.1 41.6 41.6 13.9 19.7 15.3 36.1 38.7 43.1<br />
17 Haveri 42.6 45.7 37.1 23.8 22.8 22.8 33.6 31.5 40.1<br />
18 Kodagu 61.4 52.7 50.8 7.1 12.4 9.4 31.5 34.9 39.8<br />
19 Kolar 40.4 41.1 40.7 23.1 25.0 18.6 36.5 33.9 40.7<br />
20 Koppal 47.5 34.0 29.3 18.2 21.4 28.0 34.3 44.6 42.6<br />
21 Mandya 49.5 44.0 42.7 17.1 20.7 16.5 33.3 35.3 40.8<br />
22 Mysore 29.1 27.5 23.9 27.6 27.9 27.7 43.3 44.7 48.4<br />
23 Raichur 52.7 44.3 42.1 9.8 15.8 13.8 37.5 39.9 44.1<br />
24 Shimoga 42.5 36.8 35.8 21.3 24.8 17.8 36.1 38.4 46.4<br />
25 Tumkur 42.2 41.4 36.3 23.5 25.2 21.4 34.3 33.5 42.3<br />
26 Udupi 29.9 23.5 28.6 30.8 36.7 20.1 39.3 39.8 51.3<br />
27 Uttara Kannada 37.4 26.9 24.6 21.1 31.6 28.4 41.5 41.5 47.0<br />
<strong>Karnataka</strong> 34.6 28.5 26.2 26.8 29.5 25.6 38.7 42.0 48.2<br />
Source: Directorate of Economics and Statistics, <strong>Karnataka</strong>.<br />
420
<strong>Karnataka</strong> <strong>Human</strong> <strong>Development</strong> <strong>Report</strong> <strong>2005</strong><br />
6. Economic Growth<br />
District Growth in per capita income (NDDP) at constant prices Ranking of growth in per capita income<br />
1990-91 to<br />
1998-99<br />
1990-91 to<br />
2001-02<br />
1998-99 to<br />
2001-02<br />
1990-91 to<br />
1998-99<br />
1990-91 to<br />
2001-02<br />
1998-99 to<br />
2001-02<br />
1 50 51 52 53 54 55<br />
1 Bagalkot 7.0 0.6 4.9 4 16 6<br />
2 Bangalore Rural 7.7 8.7 8.0 2 1 1<br />
3 Bangalore Urban 8.7 5.0 7.5 1 3 2<br />
4 Belgaum 5.9 -0.2 3.8 8 23 10<br />
5 Bellary 4.9 3.0 4.3 15 7 8<br />
6 Bidar 4.5 0.9 3.3 18 15 20<br />
7 Bijapur 2.7 3.0 2.8 24 8 24<br />
8 Chamarajnagar 5.3 -0.7 3.3 12 25 22<br />
9 Chikmaglur 1.4 4.1 2.3 26 5 25<br />
10 Chitradurga 4.2 2.3 3.6 21 11 15<br />
11 Dakshina Kannada 6.2 -1.6 3.6 7 27 17<br />
12 Davangere 4.7 0.5 3.3 17 19 21<br />
13 Dharwad 6.5 -1.6 3.8 6 26 12<br />
14 Gadag 5.2 5.0 5.1 13 4 5<br />
15 Gulbarga 4.5 2.3 3.8 19 12 11<br />
16 Hassan 3.9 3.3 3.7 23 6 14<br />
17 Haveri 7.1 0.4 4.8 3 20 7<br />
18 Kodagu 0.8 2.4 1.3 27 10 27<br />
19 Kolar 5.4 0.4 3.7 11 21 13<br />
20 Koppal 5.0 6.6 5.5 14 2 3<br />
21 Mandya 4.7 0.6 3.3 16 17 19<br />
22 Mysore 7.0 2.0 5.3 5 14 4<br />
23 Raichur 1.9 2.1 1.9 25 13 26<br />
24 Shimoga 5.7 0.3 3.8 10 22 9<br />
25 Tumkur 5.7 -0.6 3.6 9 24 16<br />
26 Udupi 4.3 0.6 3.0 20 18 23<br />
27 Uttara Kannada 4.1 2.4 3.5 22 9 18<br />
<strong>Karnataka</strong> 5.8 2.2 4.6<br />
Source: Directorate of Economics and Statistics, <strong>Karnataka</strong>.<br />
421
Appendix: Statistical Tables<br />
6. Economic Growth<br />
District<br />
Growth rate of NDDP 1990-91 to 2001-02 at current price<br />
Primary sector<br />
Secondary<br />
sector<br />
Tertiary sector<br />
All sector<br />
1 56 57 58 59<br />
1 Bagalkot 12.6 9.5 15.6 12.8<br />
2 Bangalore Rural 14.6 13.7 19.9 16.4<br />
3 Bangalore Urban 8.9 12.2 16.7 14.9<br />
4 Belgaum 10.0 9.9 14.5 11.7<br />
5 Bellary 9.3 12.2 15.2 12.3<br />
6 Bidar 8.2 11.2 16.1 12.0<br />
7 Bijapur 7.7 11.5 14.9 11.2<br />
8 Chamarajnagar 9.9 7.9 14.8 11.1<br />
9 Chikmaglur 8.1 9.8 13.8 10.4<br />
10 Chitradurga 9.0 10.1 14.8 11.4<br />
11 Dakshina Kannada 8.6 4.1 15.4 10.8<br />
12 Davangere 10.0 8.6 15.2 11.5<br />
13 Dharwad 9.0 11.0 11.5 10.9<br />
14 Gadag 10.0 8.8 17.7 12.9<br />
15 Gulbarga 8.6 12.3 15.8 12.3<br />
16 Hassan 8.7 11.7 14.6 11.5<br />
17 Haveri 11.2 10.8 17.3 13.3<br />
18 Kodagu 5.6 10.8 12.2 8.4<br />
19 Kolar 11.3 8.5 14.2 12.0<br />
20 Koppal 9.7 15.7 18.2 14.2<br />
21 Mandya 9.2 10.4 14.5 11.4<br />
22 Mysore 11.6 11.8 15.0 13.3<br />
23 Raichur 8.1 12.3 13.4 10.7<br />
24 Shimoga 9.5 9.4 15.2 11.8<br />
25 Tumkur 9.6 9.5 15.0 11.7<br />
26 Udupi 9.9 5.8 13.0 10.5<br />
27 Uttara Kannada 7.5 13.5 13.9 11.8<br />
<strong>Karnataka</strong> 9.6 10.6 15.4 12.5<br />
Source: Directorate of Economics and Statistics, <strong>Karnataka</strong>.<br />
422
<strong>Karnataka</strong> <strong>Human</strong> <strong>Development</strong> <strong>Report</strong> <strong>2005</strong><br />
6. Economic Growth<br />
District<br />
Growth rate of NDDP 1990-91 to 2001-02 at constant price<br />
Primary sector<br />
Secondary<br />
sector<br />
Tertiary sector<br />
All sector<br />
1 60 61 62 63<br />
1 Bagalkot 6.8 4.3 7.6 6.4<br />
2 Bangalore Rural 8.9 7.6 11.9 9.7<br />
3 Bangalore Urban 2.0 6.2 11.3 9.1<br />
4 Belgaum 4.2 4.5 7.2 5.4<br />
5 Bellary 4.0 6.2 7.5 5.8<br />
6 Bidar 2.5 5.5 6.9 4.9<br />
7 Bijapur 1.6 5.9 6.7 4.3<br />
8 Chamarajnagar 4.4 2.6 6.7 4.8<br />
9 Chikmaglur 2.6 4.2 5.5 3.8<br />
10 Chitradurga 3.9 4.7 6.8 5.1<br />
11 Dakshina Kannada 4.2 -1.0 9.7 5.1<br />
12 Davangere 4.0 3.1 6.8 4.8<br />
13 Dharwad 3.9 5.2 5.9 5.3<br />
14 Gadag 5.1 3.6 9.8 6.7<br />
15 Gulbarga 2.6 6.6 7.4 5.3<br />
16 Hassan 3.6 6.2 6.9 5.2<br />
17 Haveri 5.3 5.4 8.2 6.4<br />
18 Kodagu 1.3 5.1 4.9 2.8<br />
19 Kolar 5.4 3.0 6.3 5.3<br />
20 Koppal 3.2 10.0 9.7 7.1<br />
21 Mandya 3.5 4.8 6.6 4.9<br />
22 Mysore 5.4 5.9 8.3 6.9<br />
23 Raichur 1.5 6.7 4.9 3.5<br />
24 Shimoga 3.8 3.9 7.6 5.4<br />
25 Tumkur 3.9 4.1 7.1 5.1<br />
26 Udupi 4.2 0.4 7.0 4.6<br />
27 Uttara Kannada 1.5 7.7 6.3 5.1<br />
<strong>Karnataka</strong> 3.9 4.9 8.4 6.1<br />
Source: Directorate of Economics and Statistics, <strong>Karnataka</strong>.<br />
423
Appendix: Statistical Tables<br />
7. Employment<br />
District Total workers 2001<br />
(main + marginal)<br />
Total workers 1991<br />
(main + marginal)<br />
Decadal growth in workers<br />
(1991-2001)<br />
Persons Male Female Persons Male Female Persons Male Female<br />
1 2 3 4 5 6 7 8 9 10<br />
1 Bagalkot 719659 447791 271868 587669 365733 221936 22.5 22.4 22.5<br />
2 Bangalore Rural 892531 573521 319010 719556 482215 237341 24.0 18.9 34.4<br />
3 Bangalore Urban 2566914 1986327 580587 1658298 1355041 303257 54.8 46.6 91.5<br />
4 Belgaum 1877774 1201858 675916 1517726 997906 519820 23.7 20.4 30.0<br />
5 Bellary 920821 562323 358498 740741 451879 288862 24.3 24.4 24.1<br />
6 Bidar 557603 366228 191375 500643 314026 186617 11.4 16.6 2.6<br />
7 Bijapur 718213 467666 250547 631486 392987 238499 13.7 19.0 5.1<br />
8 Chamarajnagar 448369 300601 147768 387491 269820 117671 15.7 11.4 25.6<br />
9 Chikmaglur 516677 341658 175019 457458 296043 161415 12.9 15.4 8.4<br />
10 Chitradurga 721835 442408 279427 587262 366102 221160 22.9 20.8 26.3<br />
11 Dakshina Kannada 946390 546404 399986 740482 429650 310832 27.8 27.2 28.7<br />
12 Davangere 783781 520675 263106 662606 433908 228698 18.3 20.0 15.0<br />
13 Dharwad 684492 461120 223372 536487 370709 165778 27.6 24.4 34.7<br />
14 Gadag 457817 277450 180367 384892 231601 153291 18.9 19.8 17.7<br />
15 Gulbarga 1350072 813265 536807 1112191 674103 438088 21.4 20.6 22.5<br />
16 Hassan 864711 522274 342437 694637 440693 253944 24.5 18.5 34.8<br />
17 Haveri 666714 431235 235479 554684 360433 194251 20.2 19.6 21.2<br />
18 Kodagu 266378 167404 98974 230136 144938 85198 15.7 15.5 16.2<br />
19 Kolar 1235028 747327 487701 962584 621120 341464 28.3 20.3 42.8<br />
20 Koppal 554506 323732 230774 444080 261603 182477 24.9 23.8 26.5<br />
21 Mandya 840419 543607 296812 731763 481429 250334 14.8 12.9 18.6<br />
22 Mysore 1110264 782593 327671 884788 653207 231581 25.5 19.8 41.5<br />
23 Raichur 732762 445291 287471 582204 364143 218061 25.9 22.3 31.8<br />
24 Shimoga 714671 487349 227322 581754 407850 173904 22.8 19.5 30.7<br />
25 Tumkur 1316939 791428 525511 1099590 670021 429569 19.8 18.1 22.3<br />
26 Udupi 488173 287951 200222 422432 245702 176730 15.6 17.2 13.3<br />
27 Uttara Kannada 581278 395869 185409 473157 331119 142038 22.9 19.6 30.5<br />
<strong>Karnataka</strong> 23534791 15235355 8299436 18886797 12413981 6472816 24.6 22.7 28.2<br />
Sources:<br />
1. Primary Census Abstract (PCA) - 1991, GoI.<br />
2. Primary Census Abstract (PCA) - 2001, GoI.<br />
424
<strong>Karnataka</strong> <strong>Human</strong> <strong>Development</strong> <strong>Report</strong> <strong>2005</strong><br />
7. Employment<br />
District Main workers 2001 Main workers 1991 Decadal growth in main<br />
workers (1991-2001)<br />
Persons Male Female Persons Male Female Persons Male Female<br />
1 11 12 13 14 15 16 17 18 19<br />
1 Bagalkot 561559 404358 157201 533411 362800 170611 5.3 11.5 -7.9<br />
2 Bangalore Rural 726652 521915 204737 623043 477616 145427 16.6 9.3 40.8<br />
3 Bangalore Urban 2378180 1878030 500150 1635987 1349655 286332 45.4 39.1 74.7<br />
4 Belgaum 1537645 1116997 420648 1340802 987792 353010 14.7 13.1 19.2<br />
5 Bellary 801369 526849 274520 708299 447681 260618 13.1 17.7 5.3<br />
6 Bidar 424985 315448 109537 466610 312809 153801 -8.9 0.8 -28.8<br />
7 Bijapur 551972 413850 138122 576877 389875 187002 -4.3 6.2 -26.1<br />
8 Chamarajnagar 336961 251700 85261 360819 268334 92485 -6.6 -6.2 -7.8<br />
9 Chikmaglur 428830 312206 116624 412276 291962 120314 4.0 6.9 -3.1<br />
10 Chitradurga 576035 399609 176426 518820 361218 157602 11.0 10.6 11.9<br />
11 Dakshina Kannada 841509 505962 335547 708097 422910 285187 18.8 19.6 17.7<br />
12 Davangere 631726 466994 164732 605296 428641 176655 4.4 8.9 -6.8<br />
13 Dharwad 587018 430193 156825 499583 366941 132642 17.5 17.2 18.2<br />
14 Gadag 388763 260110 128653 349477 228914 120563 11.2 13.6 6.7<br />
15 Gulbarga 1010430 712338 298092 1039922 670426 369496 -2.8 6.3 -19.3<br />
16 Hassan 702827 485086 217741 589529 434318 155211 19.2 11.7 40.3<br />
17 Haveri 531221 389602 141619 500882 356069 144813 6.1 9.4 -2.2<br />
18 Kodagu 247574 159157 88417 220248 143463 76785 12.4 10.9 15.1<br />
19 Kolar 1014667 680376 334291 881514 613841 267673 15.1 10.8 24.9<br />
20 Koppal 422208 286867 135341 415466 260472 154994 1.6 10.1 -12.7<br />
21 Mandya 682440 497231 185209 635593 475785 159808 7.4 4.5 15.9<br />
22 Mysore 926129 712159 213970 822406 648275 174131 12.6 9.9 22.9<br />
23 Raichur 544347 387221 157126 555529 362664 192865 -2.0 6.8 -18.5<br />
24 Shimoga 586832 446288 140544 542419 404062 138357 8.2 10.5 1.6<br />
25 Tumkur 1050291 722302 327989 916196 650667 265529 14.6 11.0 23.5<br />
26 Udupi 417287 263235 154052 404352 242799 161553 3.2 8.4 -4.6<br />
27 Uttara Kannada 455302 350762 104540 428663 325350 103313 6.2 7.8 1.2<br />
<strong>Karnataka</strong> 19364759 13896845 5467914 17292116 12285339 5006777 12.0 13.1 9.2<br />
Sources:<br />
1. Primary Census Abstract (PCA) - 1991, GoI.<br />
2. Primary Census Abstract (PCA) - 2001, GoI.<br />
425
Appendix: Statistical Tables<br />
7. Employment<br />
District Marginal workers 2001 Marginal workers 1991 Decadal growth in marginal<br />
workers (1991-2001)<br />
Persons Male Female Persons Male Female Persons Male Female<br />
1 20 21 22 23 24 25 26 27 28<br />
1 Bagalkot 158100 43433 114667 54258 2933 51325 191.4 1380.8 123.4<br />
2 Bangalore Rural 165879 51606 114273 96513 4599 91914 71.9 1022.1 24.3<br />
3 Bangalore Urban 188734 108297 80437 22311 5386 16925 745.9 1910.7 375.3<br />
4 Belgaum 340129 84861 255268 176924 10114 166810 92.2 739.0 53.0<br />
5 Bellary 119452 35474 83978 32442 4198 28244 268.2 745.0 197.3<br />
6 Bidar 132618 50780 81838 34033 1217 32816 289.7 4072.6 149.4<br />
7 Bijapur 166241 53816 112425 54609 3112 51497 204.4 1629.3 118.3<br />
8 Chamarajnagar 111408 48901 62507 26672 1486 25186 317.7 3190.8 148.2<br />
9 Chikmaglur 87847 29452 58395 45182 4081 41101 94.4 621.7 42.1<br />
10 Chitradurga 145800 42799 103001 68442 4884 63558 113.0 776.3 62.1<br />
11 Dakshina Kannada 104881 40442 64439 32385 6740 25645 223.9 500.0 151.3<br />
12 Davangere 152055 53681 98374 57310 5267 52043 165.3 919.2 89.0<br />
13 Dharwad 97474 30927 66547 36904 3768 33136 164.1 720.8 100.8<br />
14 Gadag 69054 17340 51714 35415 2687 32728 95.0 545.3 58.0<br />
15 Gulbarga 339642 100927 238715 72269 3677 68592 370.0 2644.8 248.0<br />
16 Hassan 161884 37188 124696 105108 6375 98733 54.0 483.3 26.3<br />
17 Haveri 135493 41633 93860 53802 4364 49438 151.8 854.0 89.9<br />
18 Kodagu 18804 8247 10557 9888 1475 8413 90.2 459.1 25.5<br />
19 Kolar 220361 66951 153410 81070 7279 73791 171.8 819.8 107.9<br />
20 Koppal 132298 36865 95433 28614 1131 27483 362.4 3159.5 247.2<br />
21 Mandya 157979 46376 111603 96170 5644 90526 64.3 721.7 23.3<br />
22 Mysore 184135 70434 113701 62382 4932 57450 195.2 1328.1 97.9<br />
23 Raichur 188415 58070 130345 26675 1479 25196 606.3 3826.3 417.3<br />
24 Shimoga 127839 41061 86778 39335 3788 35547 225.0 984.0 144.1<br />
25 Tumkur 266648 69126 197522 183394 19354 164040 45.4 257.2 20.4<br />
26 Udupi 70886 24716 46170 18080 2903 15177 292.1 751.4 204.2<br />
27 Uttara Kannada 125976 45107 80869 44494 5769 38725 183.1 681.9 108.8<br />
<strong>Karnataka</strong> 4170032 1338510 2831522 1594681 128642 1466039 161.5 940.5 93.1<br />
Sources:<br />
1. Primary Census Abstract (PCA) - 1991, GoI.<br />
2. Primary Census Abstract (PCA) - 2001, GoI.<br />
3. Col. 26 to 28: Worked out based on PCA, 1991 and 2001.<br />
426
<strong>Karnataka</strong> <strong>Human</strong> <strong>Development</strong> <strong>Report</strong> <strong>2005</strong><br />
7. Employment<br />
District<br />
Work participation rate: proportion of workers<br />
(main and marginal workers) to total population (rural + urban)<br />
Total workers Male Female<br />
1991 2001 1991 2001 1991 2001<br />
1 29 30 31 32 33 34<br />
1 Bagalkot 42.2 43.6 52.0 53.7 32.2 33.3<br />
2 Bangalore Rural 43.0 47.4 56.1 59.6 29.2 34.7<br />
3 Bangalore Urban 34.3 39.3 53.3 58.0 13.2 18.7<br />
4 Belgaum 42.4 44.6 54.4 55.9 29.7 32.7<br />
5 Bellary 44.7 45.4 53.6 54.6 35.5 35.9<br />
6 Bidar 39.9 37.1 48.8 47.5 30.5 26.2<br />
7 Bijapur 41.1 39.7 49.9 50.5 31.9 28.5<br />
8 Chamarajnagar 43.9 46.4 59.7 61.4 27.3 31.1<br />
9 Chikmaglur 45.0 45.3 57.5 59.4 32.1 30.9<br />
10 Chitradurga 44.7 47.6 54.4 57.0 34.6 37.7<br />
11 Dakshina Kannada 45.3 49.9 53.1 58.2 37.6 41.7<br />
12 Davangere 42.5 43.8 54.0 56.7 30.2 30.1<br />
13 Dharwad 39.0 42.7 52.2 56.0 25.0 28.6<br />
14 Gadag 44.8 47.1 53.1 56.2 36.3 37.7<br />
15 Gulbarga 43.1 43.1 51.2 51.1 34.6 34.9<br />
16 Hassan 44.3 50.2 56.1 60.8 32.4 39.7<br />
17 Haveri 43.7 46.3 55.0 58.2 31.6 33.7<br />
18 Kodagu 47.1 48.6 58.7 60.9 35.3 36.2<br />
19 Kolar 43.4 48.7 55.0 58.1 31.4 39.0<br />
20 Koppal 46.4 46.4 54.1 53.7 38.5 38.9<br />
21 Mandya 44.5 47.7 57.5 61.2 31.0 33.9<br />
22 Mysore 38.8 42.0 55.9 58.2 20.8 25.3<br />
23 Raichur 43.1 43.9 53.3 52.9 32.6 34.7<br />
24 Shimoga 40.1 43.5 55.1 58.7 24.4 28.0<br />
25 Tumkur 47.7 51.0 56.9 60.2 38.1 41.3<br />
26 Udupi 39.8 43.9 49.4 55.1 31.3 33.9<br />
27 Uttara Kannada 38.8 42.9 53.3 57.6 23.7 27.8<br />
<strong>Karnataka</strong> 42.0 44.5 54.1 56.6 29.4 32.0<br />
Source: Worked out based on PCA 1991 and 2001.<br />
427
Appendix: Statistical Tables<br />
7. Employment<br />
District<br />
Proportion of main workers by sex (rural + urban)<br />
Total Male Female<br />
1991 2001 1991 2001 1991 2001<br />
1 35 36 37 38 39 40<br />
1 Bagalkot 38.3 34.0 51.6 48.5 24.8 19.2<br />
2 Bangalore Rural 37.2 38.6 55.5 54.2 17.9 22.3<br />
3 Bangalore Urban 33.8 36.4 53.1 54.8 12.5 16.1<br />
4 Belgaum 37.4 36.5 53.9 52.0 20.2 20.4<br />
5 Bellary 42.8 39.5 53.1 51.2 32.0 27.5<br />
6 Bidar 37.2 28.3 48.6 40.9 25.1 15.0<br />
7 Bijapur 37.6 30.5 49.5 44.7 25.0 15.7<br />
8 Chamarajnagar 40.9 34.9 59.3 51.4 21.5 17.9<br />
9 Chikmaglur 40.5 37.6 56.7 54.3 23.9 20.6<br />
10 Chitradurga 39.5 37.9 53.7 51.5 24.6 23.8<br />
11 Dakshina Kannada 43.3 44.3 52.3 53.9 34.5 35.0<br />
12 Davangere 38.8 35.3 53.4 50.9 23.3 18.9<br />
13 Dharwad 36.3 36.6 51.7 52.3 20.0 20.1<br />
14 Gadag 40.7 40.0 52.5 52.7 28.5 26.9<br />
15 Gulbarga 40.3 32.3 50.9 44.7 29.2 19.4<br />
16 Hassan 37.6 40.8 55.3 56.5 19.8 25.2<br />
17 Haveri 39.5 36.9 54.3 52.6 23.6 20.3<br />
18 Kodagu 45.1 45.1 58.1 57.9 31.8 32.3<br />
19 Kolar 39.8 40.0 54.4 52.9 24.6 26.7<br />
20 Koppal 43.4 35.3 53.9 47.5 32.7 22.8<br />
21 Mandya 38.7 38.7 56.8 56.0 19.8 21.2<br />
22 Mysore 36.1 35.1 55.5 53.0 15.6 16.5<br />
23 Raichur 41.1 32.6 53.1 46.0 28.8 19.0<br />
24 Shimoga 37.4 35.7 54.6 53.7 19.4 17.3<br />
25 Tumkur 39.7 40.6 55.3 55.0 23.5 25.8<br />
26 Udupi 38.1 37.5 48.8 50.4 28.6 26.1<br />
27 Uttara Kannada 35.1 33.6 52.4 51.1 17.2 15.7<br />
<strong>Karnataka</strong> 38.5 36.6 53.5 51.7 22.7 21.1<br />
Source: Worked out based on PCA 1991 and 2001.<br />
428
<strong>Karnataka</strong> <strong>Human</strong> <strong>Development</strong> <strong>Report</strong> <strong>2005</strong><br />
7. Employment<br />
District<br />
Proportion of main workers and their growth rate - rural<br />
Total Male Female Percentage increase in number of<br />
main workers (1991-2001)<br />
1991 2001 1991 2001 1991 2001 Total Male Female<br />
1 41 42 43 44 45 46 47 48 49<br />
1 Bagalkot 41.7 35.5 53.3 48.7 29.9 22.1 -0.2 7.5 -14.1<br />
2 Bangalore Rural 38.2 39.5 56.1 54.4 19.3 24.0 11.3 3.9 33.8<br />
3 Bangalore Urban 39.0 36.8 56.3 53.2 19.9 18.8 9.3 9.8 7.6<br />
4 Belgaum 39.5 38.4 55.2 52.8 23.2 23.5 13.4 11.5 18.2<br />
5 Bellary 47.3 43.1 55.0 51.9 39.3 34.1 7.3 11.1 1.7<br />
6 Bidar 40.0 29.9 50.5 41.8 29.2 17.4 -14.6 -4.5 -32.7<br />
7 Bijapur 40.5 31.8 51.1 45.1 29.3 17.9 -9.6 1.9 -30.7<br />
8 Chamarajnagar 42.2 35.5 60.7 51.7 22.8 18.7 -9.6 -8.6 -12.4<br />
9 Chikmaglur 42.2 38.9 57.7 54.7 26.5 22.8 -0.2 3.1 -7.3<br />
10 Chitradurga 41.6 39.7 55.0 51.9 27.5 26.8 8.3 7.7 9.7<br />
11 Dakshina Kannada 44.6 46.7 52.3 54.4 37.3 39.3 8.9 8.2 9.9<br />
12 Davangere 42.1 37.0 55.5 51.9 28.0 21.5 -1.7 4.7 -14.9<br />
13 Dharwad 44.5 44.0 56.9 56.4 31.2 30.8 9.5 9.8 8.9<br />
14 Gadag 44.2 43.3 53.8 53.8 34.3 32.5 10.3 12.9 6.1<br />
15 Gulbarga 44.4 34.9 53.5 46.4 35.1 23.0 -9.2 0.6 -24.4<br />
16 Hassan 39.2 42.9 56.7 57.8 21.9 28.3 19.7 11.3 41.3<br />
17 Haveri 41.0 38.4 55.2 53.3 25.8 22.6 0.1 3.2 -6.9<br />
18 Kodagu 46.9 46.6 58.8 58.5 34.7 34.8 14.1 13.3 13.5<br />
19 Kolar 43.3 43.0 56.8 54.2 29.3 31.5 11.3 7.1 19.8<br />
20 Koppal 45.2 36.4 54.5 47.6 35.8 25.0 -0.7 7.9 -14.1<br />
21 Mandya 39.9 39.9 58.0 57.0 21.2 22.7 7.5 4.9 14.8<br />
22 Mysore 39.2 37.1 58.8 54.2 18.6 19.2 6.8 4.3 15.0<br />
23 Raichur 44.8 33.8 55.4 46.0 34.1 21.5 -8.5 0.7 -23.7<br />
24 Shimoga 40.9 38.1 57.3 55.1 24.2 20.8 1.5 4.9 -6.9<br />
25 Tumkur 41.3 42.2 56.7 55.8 25.5 28.4 10.5 6.4 20.0<br />
26 Udupi 39.0 37.9 49.0 50.0 30.5 27.4 8.8 15.5 -0.4<br />
27 Uttara Kannada 37.3 35.5 54.2 52.5 19.9 18.0 -0.8 1.1 -6.1<br />
<strong>Karnataka</strong> 41.6 38.7 55.3 52.3 27.4 24.7 4.2 5.8 0.8<br />
Source: Worked out based on PCA 1991 and 2001.<br />
429
Appendix: Statistical Tables<br />
7. Employment<br />
District<br />
Proportion of main workers and their growth rate - urban<br />
Total Male Female Percentage increase in number of<br />
main workers (1991-2001)<br />
1991 2001 1991 2001 1991 2001 Total Male Female<br />
1 50 51 52 53 54 55 56 57 58<br />
1 Bagalkot 29.5 30.2 47.2 47.8 11.1 12.1 28.0 26.7 33.2<br />
2 Bangalore Rural 32.9 35.4 52.8 53.7 11.6 16.0 44.3 36.6 82.0<br />
3 Bangalore Urban 33.0 36.3 52.6 55.0 11.3 15.7 52.2 45.2 88.9<br />
4 Belgaum 30.6 30.4 49.6 49.4 10.3 10.3 19.7 20.3 16.6<br />
5 Bellary 33.3 32.9 49.3 49.9 16.3 15.1 31.8 35.2 21.0<br />
6 Bidar 25.4 23.0 41.2 38.0 7.8 6.8 26.7 28.6 15.1<br />
7 Bijapur 25.9 25.9 43.1 43.3 7.2 7.7 30.9 30.4 34.0<br />
8 Chamarajnagar 32.6 31.8 50.8 49.5 13.0 13.6 16.6 14.7 25.0<br />
9 Chikmaglur 32.1 32.4 52.1 52.5 10.9 11.3 30.3 29.9 32.6<br />
10 Chitradurga 29.2 30.2 47.3 49.4 9.5 10.0 30.4 30.3 31.0<br />
11 Dakshina Kannada 40.5 40.5 52.2 53.2 28.8 27.9 36.9 39.2 32.8<br />
12 Davangere 30.6 31.2 48.2 48.6 11.3 12.7 25.9 23.5 37.1<br />
13 Dharwad 29.0 30.5 46.9 48.8 9.7 11.3 28.9 26.6 41.1<br />
14 Gadag 34.1 33.9 50.0 50.7 17.6 16.5 14.0 16.5 6.7<br />
15 Gulbarga 26.9 25.3 42.9 40.2 9.6 9.4 31.9 31.2 35.5<br />
16 Hassan 29.8 30.9 49.0 50.6 9.5 10.5 15.9 14.9 20.8<br />
17 Haveri 31.2 31.3 49.6 50.2 11.9 11.5 47.0 49.0 38.0<br />
18 Kodagu 35.9 35.7 54.5 54.2 16.1 16.4 -4.0 -4.4 -2.4<br />
19 Kolar 28.1 30.9 46.5 49.0 8.8 12.3 33.1 27.3 65.0<br />
20 Koppal 33.0 29.7 50.1 47.2 15.2 11.7 20.3 25.9 1.3<br />
21 Mandya 32.2 32.4 50.7 51.0 12.5 13.1 6.3 5.5 9.6<br />
22 Mysore 30.4 31.7 49.5 50.8 10.2 12.0 23.6 21.0 37.1<br />
23 Raichur 29.7 29.0 46.2 45.9 12.3 11.5 24.0 25.8 16.6<br />
24 Shimoga 29.9 31.3 49.2 51.2 9.2 10.7 26.8 24.4 41.0<br />
25 Tumkur 31.8 34.1 48.5 51.9 13.0 15.1 42.2 39.2 54.7<br />
26 Udupi 34.9 35.8 48.3 52.2 21.7 20.1 -7.3 -3.5 -15.8<br />
27 Uttara Kannada 28.2 29.0 46.8 47.5 8.9 9.9 35.3 33.3 46.5<br />
<strong>Karnataka</strong> 31.4 32.9 49.5 50.8 12.0 13.8 34.9 32.6 46.4<br />
Source: Worked out based on PCA 1991 and 2001.<br />
430
<strong>Karnataka</strong> <strong>Human</strong> <strong>Development</strong> <strong>Report</strong> <strong>2005</strong><br />
7. Employment<br />
District<br />
Proportion of marginal workers and growth rate: rural + urban<br />
Total Male Female<br />
1991 2001 1991 2001 1991 2001<br />
1 59 60 61 62 63 64<br />
1 Bagalkot 3.9 9.6 0.4 5.2 7.4 14.0<br />
2 Bangalore Rural 5.8 8.8 0.6 5.4 11.3 12.4<br />
3 Bangalore Urban 0.5 2.9 0.2 3.2 0.7 2.6<br />
4 Belgaum 5.0 8.1 0.5 3.9 9.5 12.4<br />
5 Bellary 1.9 5.9 0.5 3.4 3.5 8.4<br />
6 Bidar 2.7 8.8 0.2 6.6 5.4 11.2<br />
7 Bijapur 3.5 9.2 0.4 5.8 6.9 12.8<br />
8 Chamarajnagar 3.0 11.5 0.4 10.0 5.8 13.1<br />
9 Chikmaglur 4.5 7.7 0.8 5.1 8.2 10.3<br />
10 Chitradurga 5.2 9.6 0.7 5.5 9.9 13.9<br />
11 Dakshina Kannada 2.0 5.5 0.8 4.3 3.1 6.7<br />
12 Davangere 3.7 8.5 0.6 5.8 6.9 11.3<br />
13 Dharwad 2.7 6.1 0.5 3.8 5.0 8.5<br />
14 Gadag 4.1 7.1 0.6 3.5 7.8 10.8<br />
15 Gulbarga 2.8 10.8 0.3 6.3 5.4 15.5<br />
16 Hassan 6.7 9.4 0.8 4.3 12.6 14.5<br />
17 Haveri 4.2 9.4 0.7 5.6 8.1 13.4<br />
18 Kodagu 2.0 3.4 0.6 3.0 3.5 3.9<br />
19 Kolar 3.6 8.7 0.6 5.2 6.8 12.3<br />
20 Koppal 3.0 11.1 0.2 6.1 5.8 16.1<br />
21 Mandya 5.8 9.0 0.7 5.2 11.2 12.7<br />
22 Mysore 2.7 7.0 0.4 5.2 5.2 8.8<br />
23 Raichur 2.0 11.3 0.2 6.9 3.8 15.7<br />
24 Shimoga 2.7 7.8 0.5 4.9 5.0 10.7<br />
25 Tumkur 8.0 10.3 1.6 5.3 14.6 15.5<br />
26 Udupi 1.7 6.4 0.6 4.7 2.7 7.8<br />
27 Uttara Kannada 3.7 9.3 0.9 6.6 6.5 12.1<br />
<strong>Karnataka</strong> 3.5 7.9 0.6 5.0 6.7 10.9<br />
Source: Worked out based on PCA 1991 and 2001.<br />
431
Appendix: Statistical Tables<br />
7. Employment<br />
District Proportion of marginal workers - 2001<br />
Rural<br />
Urban<br />
Persons Male Female Persons Male Female<br />
1 65 66 67 68 69 70<br />
1 Bagalkot 12.0 6.0 18.0 3.7 3.2 4.2<br />
2 Bangalore Rural 10.4 5.9 15.1 3.1 3.3 2.8<br />
3 Bangalore Urban 7.7 6.9 8.6 2.2 2.7 1.8<br />
4 Belgaum 9.6 4.2 15.3 3.1 3.1 3.1<br />
5 Bellary 7.7 4.0 11.6 2.5 2.4 2.5<br />
6 Bidar 10.4 7.2 13.7 3.7 4.5 2.7<br />
7 Bijapur 10.8 6.5 15.4 3.4 3.5 3.3<br />
8 Chamarajnagar 12.6 10.7 14.7 5.4 6.1 4.8<br />
9 Chikmaglur 8.7 5.5 12.0 3.5 3.6 3.3<br />
10 Chitradurga 11.2 6.2 16.4 2.4 2.6 2.2<br />
11 Dakshina Kannada 7.4 5.4 9.4 2.5 2.7 2.4<br />
12 Davangere 10.8 6.8 15.0 3.1 3.6 2.6<br />
13 Dharwad 10.3 5.1 15.9 2.6 2.7 2.5<br />
14 Gadag 8.8 4.1 13.7 3.9 2.4 5.5<br />
15 Gulbarga 13.5 7.3 19.8 3.8 3.9 3.8<br />
16 Hassan 10.9 4.7 17.0 2.5 2.7 2.4<br />
17 Haveri 10.9 6.2 15.8 3.9 3.5 4.3<br />
18 Kodagu 3.6 3.0 4.2 2.3 2.9 1.7<br />
19 Kolar 10.6 6.0 15.4 2.8 2.9 2.7<br />
20 Koppal 12.6 6.6 18.6 3.5 3.7 3.3<br />
21 Mandya 10.0 5.5 14.6 3.3 3.5 3.0<br />
22 Mysore 9.9 6.9 13.0 2.0 2.4 1.6<br />
23 Raichur 14.2 8.4 20.1 2.7 2.6 2.7<br />
24 Shimoga 10.3 5.5 15.1 3.2 3.9 2.4<br />
25 Tumkur 12.0 5.9 18.4 3.2 2.8 3.7<br />
26 Udupi 7.2 5.2 8.9 2.7 2.7 2.7<br />
27 Uttara Kannada 11.3 7.1 15.6 4.5 5.3 3.6<br />
<strong>Karnataka</strong> 10.5 6.0 15.1 2.8 3.0 2.6<br />
Source: Census 2001 (PCA).<br />
432
<strong>Karnataka</strong> <strong>Human</strong> <strong>Development</strong> <strong>Report</strong> <strong>2005</strong><br />
7. Employment<br />
District Sector share of employment: main and marginal workers 2001<br />
Percentage to total workers: all areas (rural + urban)<br />
Cultivators Agricultural labourers Workers in household<br />
industries<br />
Other workers<br />
Total Male Female Total Male Female Total Male Female Total Male Female<br />
1 71 72 73 74 75 76 77 78 79 80 81 82<br />
1 Bagalkot 27.1 32.9 17.6 37.9 23.6 61.4 7.5 7.5 7.6 27.4 35.9 13.5<br />
2 Bangalore Rural 41.4 43.2 38.0 20.4 13.7 32.4 4.8 4.0 6.1 33.5 39.0 23.5<br />
3 Bangalore Urban 3.3 3.2 3.8 2.6 1.8 5.4 2.7 1.9 5.5 91.3 93.1 85.2<br />
4 Belgaum 37.6 39.9 33.5 31.3 20.5 50.6 3.5 3.5 3.5 27.6 36.1 12.4<br />
5 Bellary 27.3 31.5 20.6 39.3 25.7 60.5 2.8 2.3 3.5 30.7 40.4 15.4<br />
6 Bidar 24.9 27.7 19.6 37.5 26.1 59.3 2.5 2.3 2.9 35.1 44.0 18.2<br />
7 Bijapur 30.2 36.5 18.5 39.9 26.3 65.4 2.9 3.1 2.7 26.9 34.2 13.4<br />
8 Chamarajnagar 27.7 33.6 15.8 43.0 34.9 59.7 4.4 3.1 6.9 24.9 28.4 17.6<br />
9 Chikmaglur 28.6 34.2 17.7 21.1 14.8 33.5 2.3 2.2 2.7 47.9 48.8 46.2<br />
10 Chitradurga 38.4 43.6 30.2 33.4 21.6 52.2 3.3 2.9 4.0 24.8 31.9 13.6<br />
11 Dakshina Kannada 5.2 6.5 3.6 4.5 5.1 3.6 21.2 2.9 46.1 69.1 85.5 46.7<br />
12 Davangere 30.8 36.2 20.0 34.5 23.6 56.1 3.9 2.6 6.3 30.8 37.5 17.6<br />
13 Dharwad 25.8 26.2 24.9 27.3 16.5 49.5 2.9 2.6 3.5 44.1 54.7 22.1<br />
14 Gadag 30.4 35.3 23.0 39.2 24.6 61.7 3.7 3.6 3.7 26.7 36.5 11.6<br />
15 Gulbarga 27.1 34.3 16.1 40.0 23.7 64.7 2.5 2.3 2.9 30.4 39.7 16.4<br />
16 Hassan 55.0 55.5 54.3 14.6 8.4 24.1 1.6 1.6 1.7 28.7 34.5 19.9<br />
17 Haveri 30.5 37.4 18.1 43.7 31.1 66.8 4.1 3.2 5.9 21.6 28.4 9.2<br />
18 Kodagu 7.9 8.9 6.2 4.3 3.6 5.5 0.9 0.8 1.1 86.8 86.7 87.1<br />
19 Kolar 36.7 37.9 34.8 27.4 18.9 40.3 3.2 2.6 4.2 32.7 40.6 20.6<br />
20 Koppal 30.4 38.5 18.9 42.4 26.0 65.3 3.3 3.4 3.2 24.0 32.1 12.6<br />
21 Mandya 48.9 53.3 41.0 24.5 17.0 38.4 2.1 1.5 3.1 24.4 28.2 17.5<br />
22 Mysore 35.8 36.7 33.8 22.5 16.2 37.7 1.9 1.1 3.9 39.7 46.0 24.6<br />
23 Raichur 28.2 37.1 14.4 44.8 28.2 70.7 2.0 2.0 1.9 25.0 32.7 13.1<br />
24 Shimoga 30.5 33.3 24.3 31.4 21.7 52.1 2.5 2.2 3.4 35.6 42.8 20.2<br />
25 Tumkur 45.7 48.9 41.0 23.8 14.9 37.3 4.6 3.1 7.0 25.8 33.1 14.7<br />
26 Udupi 19.9 18.5 22.0 18.0 13.0 25.2 12.7 3.3 26.1 49.4 65.3 26.6<br />
27 Uttara Kannada 24.7 23.8 26.5 14.5 9.6 25.2 2.2 2.3 2.1 58.5 64.3 46.2<br />
<strong>Karnataka</strong> 29.2 31.7 24.7 26.5 17.2 43.4 4.1 2.7 6.7 40.2 48.4 25.2<br />
Source: Worked out based on PCA 1991 and 2001.<br />
433
Appendix: Statistical Tables<br />
7. Employment<br />
District Sector share of employment: main and marginal workers 2001<br />
Percentage to total workers - rural<br />
Cultivators Agricultural labourers Workers in household<br />
industries<br />
Other workers<br />
Total Male Female Total Male Female Total Male Female Total Male Female<br />
1 83 84 85 86 87 88 89 90 91 92 93 94<br />
1 Bagalkot 33.5 43.3 20.0 45.4 29.7 67.1 4.4 4.7 4.1 16.7 22.3 8.8<br />
2 Bangalore Rural 49.4 53.6 42.6 23.8 16.5 35.6 2.9 2.4 3.6 24.0 27.5 18.2<br />
3 Bangalore Urban 22.3 23.6 19.2 16.8 12.1 28.1 3.4 2.6 5.4 57.5 61.7 47.3<br />
4 Belgaum 44.3 49.7 36.1 36.3 24.8 53.7 2.9 3.1 2.7 16.5 22.4 7.5<br />
5 Bellary 35.3 44.4 23.9 48.4 34.1 66.4 2.1 2.1 2.1 14.2 19.4 7.6<br />
6 Bidar 29.3 34.3 21.1 43.5 31.7 63.1 2.3 2.3 2.4 24.8 31.7 13.4<br />
7 Bijapur 35.0 44.3 19.9 45.7 31.4 69.1 2.8 3.1 2.3 16.5 21.3 8.7<br />
8 Chamarajnagar 30.9 38.1 17.2 47.5 38.9 64.0 3.3 2.6 4.8 18.3 20.4 14.1<br />
9 Chikmaglur 33.0 40.9 19.3 23.7 17.0 35.3 2.2 2.1 2.4 41.2 40.1 43.0<br />
10 Chitradurga 43.5 51.7 32.0 37.7 25.5 54.9 3.1 2.8 3.5 15.7 20.0 9.6<br />
11 Dakshina Kannada 7.1 9.3 4.5 6.2 7.7 4.5 21.9 3.1 44.1 64.8 79.9 46.9<br />
12 Davangere 39.2 48.7 23.3 43.7 31.5 64.3 2.3 2.2 2.6 14.7 17.6 9.8<br />
13 Dharwad 41.2 47.8 31.9 41.2 28.2 59.2 2.2 2.5 1.9 15.4 21.5 7.0<br />
14 Gadag 37.7 46.3 26.6 46.2 31.1 65.7 2.7 3.1 2.2 13.4 19.5 5.6<br />
15 Gulbarga 32.3 43.9 17.5 47.1 29.6 69.5 2.2 2.3 2.0 18.4 24.2 11.0<br />
16 Hassan 61.9 65.3 57.4 16.3 9.8 25.2 1.3 1.4 1.2 20.4 23.6 16.2<br />
17 Haveri 35.0 44.3 19.8 48.7 35.0 71.2 3.0 2.8 3.3 13.3 17.8 5.7<br />
18 Kodagu 8.8 10.1 6.6 4.7 4.1 5.8 0.9 0.8 1.1 85.6 85.0 86.4<br />
19 Kolar 43.7 47.9 38.2 32.3 23.6 43.7 2.5 2.2 2.8 21.6 26.4 15.3<br />
20 Koppal 33.8 44.8 19.9 46.1 29.2 67.3 3.0 3.3 2.7 17.1 22.7 10.1<br />
21 Mandya 54.6 60.9 44.0 26.7 18.8 40.2 1.9 1.6 2.4 16.8 18.8 13.4<br />
22 Mysore 50.0 54.2 41.8 31.0 23.5 45.9 1.0 0.9 1.3 17.9 21.4 11.0<br />
23 Raichur 33.4 46.9 15.5 52.4 34.9 75.5 1.7 1.8 1.6 12.5 16.4 7.4<br />
24 Shimoga 40.6 47.5 28.7 39.8 29.0 58.4 2.1 2.0 2.4 17.5 21.5 10.5<br />
25 Tumkur 52.5 58.5 44.5 27.2 17.7 40.1 3.8 2.8 5.1 16.5 21.1 10.4<br />
26 Udupi 23.1 22.0 24.5 20.4 15.3 27.1 13.0 3.4 25.6 43.5 59.3 22.8<br />
27 Uttara Kannada 30.5 30.8 29.9 17.8 12.2 27.9 1.8 1.9 1.7 50.0 55.1 40.5<br />
<strong>Karnataka</strong> 39.0 45.6 29.3 34.5 23.9 50.1 3.5 2.4 5.1 23.0 28.1 15.5<br />
Source: Worked out based on PCA 1991 and 2001.<br />
434
<strong>Karnataka</strong> <strong>Human</strong> <strong>Development</strong> <strong>Report</strong> <strong>2005</strong><br />
7. Employment<br />
District Sector share of employment: main and marginal workers 2001<br />
Percentage to total workers - urban<br />
Cultivators Agricultural labourers Workers in household<br />
industries<br />
Other workers<br />
Total Male Female Total Male Female Total Male Female Total Male Female<br />
1 95 96 97 98 99 100 101 102 103 104 105 106<br />
1 Bagalkot 5.1 5.8 2.9 12.4 7.8 27.1 18.0 14.9 28.3 64.5 71.5 41.7<br />
2 Bangalore Rural 3.7 4.1 2.7 4.4 3.2 8.5 13.7 10.0 25.4 78.2 82.7 63.4<br />
3 Bangalore Urban 0.4 0.3 0.6 0.4 0.4 0.6 2.6 1.8 5.6 96.6 97.5 93.3<br />
4 Belgaum 7.3 6.7 10.1 8.7 5.6 21.6 6.0 4.9 10.9 78.0 82.9 57.4<br />
5 Bellary 5.7 6.0 4.8 14.7 9.2 31.6 4.7 2.9 10.3 74.9 81.9 53.2<br />
6 Bidar 2.5 2.4 2.9 6.8 4.6 17.5 3.4 2.4 8.2 87.3 90.6 71.4<br />
7 Bijapur 5.3 5.7 3.6 9.9 6.4 25.9 3.9 3.2 6.8 80.9 84.7 63.7<br />
8 Chamarajnagar 4.8 5.8 1.6 11.6 9.9 16.9 11.7 6.3 28.6 71.9 78.0 52.8<br />
9 Chikmaglur 4.8 5.5 2.1 7.1 5.1 14.8 3.1 2.5 5.7 85.0 86.9 77.4<br />
10 Chitradurga 2.8 2.9 2.4 3.2 2.2 7.6 4.9 3.3 12.3 89.1 91.6 77.7<br />
11 Dakshina Kannada 1.5 1.7 1.3 1.1 0.8 1.4 19.8 2.6 51.2 77.6 94.8 46.1<br />
12 Davangere 3.6 4.1 1.8 5.1 3.6 10.7 8.7 3.8 26.8 82.5 88.5 60.8<br />
13 Dharwad 5.2 5.0 5.7 8.6 5.0 22.8 3.8 2.7 8.0 82.5 87.3 63.5<br />
14 Gadag 12.0 13.2 9.1 21.5 11.6 46.2 6.1 4.6 9.8 60.4 70.6 34.9<br />
15 Gulbarga 3.7 3.8 3.6 8.6 4.8 22.0 4.2 2.3 10.9 83.5 89.1 63.4<br />
16 Hassan 3.5 3.6 3.1 2.1 1.4 5.2 3.9 2.5 9.6 90.5 92.5 82.1<br />
17 Haveri 6.6 7.7 2.4 16.8 14.2 25.9 10.4 4.9 30.3 66.2 73.2 41.4<br />
18 Kodagu 0.7 0.8 0.4 0.7 0.4 1.5 1.2 1.2 1.4 97.4 97.5 96.8<br />
19 Kolar 2.9 2.8 3.0 3.6 2.4 8.0 7.1 4.1 17.6 86.5 90.7 71.4<br />
20 Koppal 5.0 5.4 3.7 15.0 8.9 36.7 5.3 3.8 10.5 74.7 81.9 49.2<br />
21 Mandya 7.2 8.3 3.5 8.4 6.1 16.3 3.7 1.4 11.9 80.6 84.2 68.3<br />
22 Mysore 2.4 2.6 2.0 2.6 2.0 4.9 4.1 1.7 13.9 90.9 93.7 79.3<br />
23 Raichur 4.9 5.2 4.0 10.8 6.1 27.4 3.1 2.6 4.8 81.2 86.1 63.8<br />
24 Shimoga 3.8 4.3 1.8 9.1 6.7 19.5 3.6 2.5 8.3 83.4 86.5 70.4<br />
25 Tumkur 5.4 5.5 5.0 3.8 2.5 7.5 9.8 4.2 27.1 81.1 87.8 60.3<br />
26 Udupi 3.7 3.5 4.1 5.7 3.2 11.5 10.9 2.8 29.9 79.7 90.6 54.5<br />
27 Uttara Kannada 4.4 4.1 5.7 3.4 2.2 8.1 3.8 3.5 4.8 88.4 90.1 81.4<br />
<strong>Karnataka</strong> 3.1 3.2 2.7 5.1 3.3 11.2 5.7 3.1 14.5 86.1 90.3 71.5<br />
Source: Worked out based on PCA 1991 and 2001.<br />
435
Appendix: Statistical Tables<br />
8. Gender Disparities<br />
District<br />
Female population as<br />
percentage of total population<br />
Percentage of child population (0-14 years)<br />
1991 2001<br />
1991 2001 Boys Girls Boys Girls<br />
1 2 3 4 5 6 7<br />
1 Bagalkot 49.54 49.42 36.5 35.5<br />
2 Bangalore Rural 48.59 48.79 35.0 36.4 29.7 29.7<br />
3 Bangalore Urban 47.45 47.53 30.5 33.2 26.1 27.5<br />
4 Belgaum 48.82 48.95 36.0 36.5 34.2 33.1<br />
5 Bellary 49.14 49.22 40.5 40.5 37.3 36.6<br />
6 Bidar 48.78 48.67 41.0 41.6 38.2 38.3<br />
7 Bijapur 48.66 48.67 39.3 39.1 37.1 36.5<br />
8 Chamarajnagar 48.79 49.20 28.8 28.6<br />
9 Chikmaglur 49.42 49.59 32.9 33.2 28.6 28.2<br />
10 Chitradurga 48.74 48.84 36.0 36.8 31.7 31.6<br />
11 Dakshina Kannada 50.50 50.56 33.9 31.6 28.9 27.2<br />
12 Davangere 48.49 48.74 31.9 32.1<br />
13 Dharwad 48.31 48.66 37.2 37.8 31.5 31.6<br />
14 Gadag 49.21 49.20 33.6 33.1<br />
15 Gulbarga 49.03 49.07 40.7 40.4 40.1 39.2<br />
16 Hassan 49.98 50.12 34.6 34.8 28.9 28.0<br />
17 Haveri 48.36 48.51 33.3 33.7<br />
18 Kodagu 49.46 49.90 32.4 31.9 28.8 28.3<br />
19 Kolar 49.10 49.23 35.6 36.3 31.8 31.6<br />
20 Koppal 49.51 49.56 40.0 38.9<br />
21 Mandya 49.06 49.63 33.5 34.6 29.0 28.1<br />
22 Mysore 48.80 49.11 33.7 34.8 29.2 29.6<br />
23 Raichur 49.46 49.50 41.0 40.7 39.9 38.9<br />
24 Shimoga 49.08 49.42 34.4 35.0 29.7 29.3<br />
25 Tumkur 48.95 49.14 34.0 34.8 29.6 29.0<br />
26 Udupi 53.14 52.99 28.4 24.4<br />
27 Uttara Kannada 49.13 49.23 36.7 34.4 29.9 29.3<br />
<strong>Karnataka</strong> 48.97 49.07 35.8 36.3 32.0 31.7<br />
Source: Population Census (primary census abstract - PCA) 1991 and 2001.<br />
436
<strong>Karnataka</strong> <strong>Human</strong> <strong>Development</strong> <strong>Report</strong> <strong>2005</strong><br />
8. Gender Disparities<br />
District Sex ratio in age group 0-6 years Sex ratio - females per 1000 males<br />
1991 2001 1961 1971 1981 1991 2001<br />
1 8 9 10 11 12 13 14<br />
1 Bagalkot 960 940 987 987 997 982 980<br />
2 Bangalore Rural 957 942 960 954 955 945 955<br />
3 Bangalore Urban 950 943 890 886 900 903 908<br />
4 Belgaum 955 921 952 947 957 954 960<br />
5 Bellary 956 947 960 966 975 966 969<br />
6 Bidar 962 941 971 963 968 952 949<br />
7 Bijapur 952 928 967 963 970 948 950<br />
8 Chamarajnagar 961 964 968 955 956 953 971<br />
9 Chikmaglur 978 959 903 937 953 977 984<br />
10 Chitradurga 967 946 942 946 952 951 955<br />
11 Dakshina Kannada 962 952 1027 1006 1015 1020 1022<br />
12 Davangere 953 946 948 947 944 942 952<br />
13 Dharwad 947 943 941 928 938 935 949<br />
14 Gadag 955 952 981 983 981 969 969<br />
15 Gulbarga 959 938 989 981 981 962 966<br />
16 Hassan 967 958 969 974 987 999 1004<br />
17 Haveri 954 957 939 938 937 936 944<br />
18 Kodagu 957 977 862 910 933 979 996<br />
19 Kolar 971 959 968 961 971 965 972<br />
20 Koppal 961 953 973 979 989 981 983<br />
21 Mandya 959 934 967 960 960 963 986<br />
22 Mysore 967 962 942 936 948 953 964<br />
23 Raichur 968 964 994 982 988 978 983<br />
24 Shimoga 964 956 879 919 944 964 978<br />
25 Tumkur 970 949 956 957 961 959 967<br />
26 Udupi 972 958 1165 1140 1130 1134 1130<br />
27 Uttara Kannada 949 946 946 957 958 966 971<br />
<strong>Karnataka</strong> 960 946 959 957 963 960 965<br />
Source: Col. 8 and 10 to 13: Population Census (provisional paper I ) 2001.<br />
437
Appendix: Statistical Tables<br />
8. Gender Disparities<br />
District<br />
Female literacy rate<br />
1991 2001<br />
Total Rural Urban Total Rural Urban<br />
1 15 16 17 18 19 20<br />
1 Bagalkot 37.13 43.56 37.11 60.82<br />
2 Bangalore Rural 38.15 33.43 59.68 54.99 51.05 70.12<br />
3 Bangalore Urban 68.81 44.09 72.68 77.48 60.81 81.40<br />
4 Belgaum 38.69 31.07 62.99 52.32 45.99 72.75<br />
5 Bellary 32.24 24.34 49.32 45.28 37.45 62.08<br />
6 Bidar 30.53 24.51 55.91 48.81 44.88 67.42<br />
7 Bijapur 41.57 35.29 55.27 43.47 40.54 65.87<br />
8 Chamarajnagar 28.60 42.48 39.10 64.57<br />
9 Chikmaglur 51.31 47.19 72.03 64.01 61.19 78.16<br />
10 Chitradurga 39.38 31.42 65.05 53.78 49.97 75.39<br />
11 Dakshina Kannada 68.84 58.16 77.76 77.21 72.94 84.53<br />
12 Davangere 44.41 64.00 78.21 58.04 52.52 72.06<br />
13 Dharwad 50.41 61.92 47.91 73.59<br />
14 Gadag 39.68 37.13 59.93 52.52 46.36 63.94<br />
15 Gulbarga 24.49 37.90 29.67 61.70<br />
16 Hassan 44.90 16.06 51.87 59.00 55.03 79.74<br />
17 Haveri 43.28 39.56 71.08 57.37 54.74 68.43<br />
18 Kodagu 61.22 72.26 70.37 86.31<br />
19 Kolar 37.75 29.06 66.15 52.23 45.93 73.57<br />
20 Koppal 22.78 39.61 37.02 59.18<br />
21 Mandya 36.70 32.12 60.66 51.53 47.64 72.91<br />
22 Mysore 42.60 25.53 66.91 55.81 42.93 77.34<br />
23 Raichur 21.70 16.48 43.59 35.93 29.38 58.50<br />
24 Shimoga 54.33 44.24 71.35 66.88 61.07 78.76<br />
25 Tumkur 41.93 36.98 67.79 56.94 52.63 76.12<br />
26 Udupi 66.64 75.19 71.60 85.03<br />
27 Uttara Kannada 56.77 51.31 73.79 68.47 63.57 80.51<br />
<strong>Karnataka</strong> 44.34 34.76 65.74 56.87 48.50 74.87<br />
Note: Rural and Urban break-up for 1991 available for old 20 districts.<br />
Source: Population Census (PCA) 1991 and 2001.<br />
438
<strong>Karnataka</strong> <strong>Human</strong> <strong>Development</strong> <strong>Report</strong> <strong>2005</strong><br />
8. Gender Disparities<br />
District<br />
Gap in male and female literacy<br />
1991 2001<br />
Total Rural Urban Total Rural Urban<br />
1 21 22 23 24 25 26<br />
1 Bagalkot 30.59 27.33 29.68 21.53<br />
2 Bangalore Rural 23.36 25.18 14.88 19.00 20.94 11.65<br />
3 Bangalore Urban 14.13 23.88 12.60 10.44 18.04 9.42<br />
4 Belgaum 27.96 30.16 20.55 23.38 25.73 15.90<br />
5 Bellary 26.87 28.39 22.61 23.92 26.66 18.72<br />
6 Bidar 28.44 29.34 22.85 23.66 25.58 16.67<br />
7 Bijapur 28.69 30.80 25.61 26.47 28.63 18.97<br />
8 Chamarajnagar 18.71 16.55 17.05 13.83<br />
9 Chikmaglur 19.25 20.40 12.70 16.27 17.72 9.99<br />
10 Chitradurga 25.12 29.94 16.15 20.89 22.73 12.47<br />
11 Dakshina Kannada 16.04 17.65 12.66 12.49 14.39 9.31<br />
12 Davangere 22.41 18.33 21.02 12.01<br />
13 Dharwad 23.81 29.57 19.89 18.90 25.44 13.72<br />
14 Gadag 31.95 26.80 30.12 20.72<br />
15 Gulbarga 27.59 28.26 23.99 23.87 25.50 18.68<br />
16 Hassan 23.97 25.95 12.94 19.37 21.22 9.99<br />
17 Haveri 24.77 20.24 22.09 13.27<br />
18 Kodagu 14.13 14.63 10.67 11.44 12.04 7.08<br />
19 Kolar 24.94 27.73 15.48 20.94 23.88 11.91<br />
20 Koppal 30.69 28.81 30.29 21.33<br />
21 Mandya 22.48 23.77 15.09 18.97 20.18 12.05<br />
22 Mysore 18.11 20.48 12.78 15.07 18.69 9.21<br />
23 Raichur 25.05 27.78 24.94 25.60 27.23 20.22<br />
24 Shimoga 18.79 22.14 12.88 15.13 17.79 10.04<br />
25 Tumkur 24.56 26.02 14.72 19.84 21.96 10.56<br />
26 Udupi 16.94 13.04 13.88 8.51<br />
27 Uttara Kannada 19.62 21.27 14.33 16.07 18.04 11.20<br />
<strong>Karnataka</strong> 22.92 25.54 16.30 19.23 22.44 12.53<br />
Note: Rural and Urban break-up for 1991 available for old 20 districts.<br />
Source: Population Census (PCA) 1991 and 2001.<br />
439
Appendix: Statistical Tables<br />
8. Gender Disparities<br />
District Ratio of female to male literacy Enrolment of girls in primary schools (standard I - VIII)<br />
as % of enrolment of boys<br />
1991 2001 1990-91<br />
(I - VII)<br />
2000-01 2003-04<br />
1 27 28 29 30 31<br />
1 Bagalkot 0.55 0.62 75.44 84.64 89.65<br />
2 Bangalore Rural 0.62 0.74 84.86 113.72 94.23<br />
3 Bangalore Urban 0.83 0.89 95.92 100.41 102.39<br />
4 Belgaum 0.58 0.69 86.07 91.09 87.13<br />
5 Bellary 0.55 0.66 83.99 84.02 91.57<br />
6 Bidar 0.52 0.68 63.03 95.84 91.66<br />
7 Bijapur 0.59 0.68 84.77 93.17 87.30<br />
8 Chamarajnagar 0.60 0.73 88.01 97.88 92.62<br />
9 Chikmaglur 0.73 0.80 93.61 93.25 92.05<br />
10 Chitradurga 0.61 0.73 92.01 94.37 89.78<br />
11 Dakshina Kannada 0.82 0.86 98.81 86.83 89.32<br />
12 Davangere 0.66 0.76 93.50 76.01 92.94<br />
13 Dharwad 0.68 0.77 87.20 81.91 92.26<br />
14 Gadag 0.55 0.66 93.69 89.51 92.94<br />
15 Gulbarga 0.47 0.61 66.39 83.80 89.77<br />
16 Hassan 0.65 0.76 89.98 92.95 95.48<br />
17 Haveri 0.64 0.74 79.34 94.41 93.36<br />
18 Kodagu 0.81 0.87 86.84 94.30 96.32<br />
19 Kolar 0.60 0.72 84.32 93.12 93.17<br />
20 Koppal 0.43 0.59 82.18 83.42 88.36<br />
21 Mandya 0.62 0.73 86.85 102.71 93.42<br />
22 Mysore 0.71 0.78 91.09 92.47 92.74<br />
23 Raichur 0.46 0.59 70.59 78.09 89.63<br />
24 Shimoga 0.74 0.82 95.01 86.22 91.89<br />
25 Tumkur 0.63 0.74 86.38 90.83 89.73<br />
26 Udupi 0.80 0.85 70.07 97.91 93.20<br />
27 Uttara Kannada 0.74 0.81 88.43 83.80 95.28<br />
<strong>Karnataka</strong> 0.66 0.75 85.29 91.16 92.17<br />
Note: For 1990-91, information available for old 20 districts.<br />
Source: Commissioner for Public Instruction, <strong>Karnataka</strong>.<br />
440
<strong>Karnataka</strong> <strong>Human</strong> <strong>Development</strong> <strong>Report</strong> <strong>2005</strong><br />
8. Gender Disparities<br />
District<br />
Enrolment of girls in high schools (standard IX - X) as % of enrolment of boys<br />
1990 -91 (VIII - X) 2000-01 2003-04<br />
1 32 33 34<br />
1 Bagalkot 53.85 59.86 69.93<br />
2 Bangalore Rural 57.34 123.94 99.43<br />
3 Bangalore Urban 91.93 107.96 103.11<br />
4 Belgaum 52.18 75.21 71.80<br />
5 Bellary 59.47 68.15 70.15<br />
6 Bidar 41.11 79.64 94.41<br />
7 Bijapur 59.52 43.87 77.89<br />
8 Chamarajnagar 78.39 119.36 84.79<br />
9 Chikmaglur 88.17 93.77 98.82<br />
10 Chitradurga 74.97 94.85 89.92<br />
11 Dakshina Kannada 83.55 99.01 95.43<br />
12 Davangere 92.91 72.86 93.90<br />
13 Dharwad 79.28 50.30 92.02<br />
14 Gadag 58.81 79.92 71.73<br />
15 Gulbarga 51.79 56.97 74.21<br />
16 Hassan 76.98 75.97 109.67<br />
17 Haveri 58.55 79.11 81.64<br />
18 Kodagu 89.04 129.89 98.11<br />
19 Kolar 65.10 39.51 89.42<br />
20 Koppal 63.08 60.31 66.86<br />
21 Mandya 67.65 84.40 96.93<br />
22 Mysore 69.06 109.99 70.07<br />
23 Raichur 47.77 56.82 77.82<br />
24 Shimoga 120.99 74.76 90.58<br />
25 Tumkur 63.80 57.38 83.07<br />
26 Udupi 95.89 105.31 109.14<br />
27 Uttara Kannada 80.68 77.82 96.27<br />
<strong>Karnataka</strong> 71.45 75.79 86.95<br />
Source: Commissioner for Public Instruction, <strong>Karnataka</strong>.<br />
441
Appendix: Statistical Tables<br />
8. Gender Disparities<br />
District<br />
Enrolment of girls in PUC (standard XI - XII) as % of<br />
enrolment of boys<br />
Total fertility rate<br />
1998-99 2000-01 2003-04 1991 2001<br />
1 35 36 37 38 39<br />
1 Bagalkot 46.02 50.26 43.40 3.1<br />
2 Bangalore Rural 75.48 76.28 77.42 3.8 2.2<br />
3 Bangalore Urban 101.18 103.95 97.56 3.5 1.9<br />
4 Belgaum 47.93 55.15 46.57 3.6 2.7<br />
5 Bellary 65.80 61.70 60.71 4.9 3.1<br />
6 Bidar 69.52 66.12 65.35 4.8 3.4<br />
7 Bijapur 49.75 45.26 46.34 4.3 3.0<br />
8 Chamarajnagar 58.96 51.98 62.21 2.0<br />
9 Chikmaglur 109.37 109.65 91.82 3.1 1.9<br />
10 Chitradurga 67.09 66.46 57.78 3.6 2.3<br />
11 Dakshina Kannada 114.62 114.44 121.80 3.6 1.7<br />
12 Davangere 112.74 114.36 103.66 2.4<br />
13 Dharwad 80.42 81.93 72.94 3.9 2.5<br />
14 Gadag 75.78 78.06 77.42 2.6<br />
15 Gulbarga 60.35 55.16 47.68 4.8 3.5<br />
16 Hassan 66.00 66.72 61.69 2.9 1.9<br />
17 Haveri 90.05 89.81 86.95 2.6<br />
18 Kodagu 63.43 62.18 63.13 2.8 2.0<br />
19 Kolar 60.37 64.17 64.53 3.9 2.5<br />
20 Koppal 69.62 68.44 54.39 3.4<br />
21 Mandya 71.49 78.50 74.24 3.1 1.9<br />
22 Mysore 71.75 81.67 76.91 3.6 2.1<br />
23 Raichur 63.24 63.38 57.58 4.7 3.3<br />
24 Shimoga 92.07 92.67 101.78 3.7 2.0<br />
25 Tumkur 82.73 81.48 76.36 3.5 2.2<br />
26 Udupi 114.45 116.83 107.44 1.5<br />
27 Uttara Kannada 123.56 120.25 101.78 3.7 2.2<br />
<strong>Karnataka</strong> 78.39 78.18 74.28 3.9 2.4<br />
Source: Col. 35 to 37: PUC Board, <strong>Karnataka</strong> and Col. 8 : SRS <strong>Report</strong> RGI.<br />
442
<strong>Karnataka</strong> <strong>Human</strong> <strong>Development</strong> <strong>Report</strong> <strong>2005</strong><br />
8. Gender Disparities<br />
District Indicators of reproductive and child health (RCH) 1998-99<br />
Mean age at marriage 1998-99<br />
Percentage marrying below<br />
legal age 1998-99<br />
Boys Girls Boys Girls<br />
Percentage of<br />
birth orders 3<br />
and above<br />
Percentage<br />
receiving full<br />
ANC<br />
1 40 41 42 43 44 45<br />
1 Bagalkot<br />
2 Bangalore Rural 25.8 18.9 2.0 21.5 16.4 69.1<br />
3 Bangalore Urban 26.0 20.9 4.2 12.0 23.3 78.4<br />
4 Belgaum 23.0 17.0 21.0 55.0 36.7 45.6<br />
5 Bellary 24.6 18.5 13.9 44.2 48.6 26.5<br />
6 Bidar 22.5 16.3 30.2 67.6 52.9 37.9<br />
7 Bijapur 23.5 16.2 26.9 64.8 43.0 34.4<br />
8 Chamarajnagar<br />
9 Chikmaglur 26.4 20.5 9.1 13.6 32.0 68.2<br />
10 Chitradurga 25.2 18.6 13.3 30.5 37.4 67.8<br />
11 Dakshina Kannada 27.7 22.2 3.4 4.5 32.0 84.9<br />
12 Davangere<br />
13 Dharwad 24.9 19.4 12.2 36.5 37.4 60.4<br />
14 Gadag<br />
15 Gulbarga 22.7 17.6 30.9 47.7 53.7 28.1<br />
16 Hassan 25.5 19.8 9.6 15.2 19.7 70.2<br />
17 Haveri<br />
18 Kodagu 26.8 19.9 8.5 22.0 18.8 88.4<br />
19 Kolar 24.3 18.6 15.7 33.5 29.7 75.3<br />
20 Koppal<br />
21 Mandya 25.5 18.3 6.0 37.0 26.1 67.2<br />
22 Mysore 26.2 17.9 3.4 47.9 23.9 75.8<br />
23 Raichur 22.8 17.4 30.7 57.1 52.8 32.6<br />
24 Shimoga 26.4 20.5 6.3 16.5 22.8 82.2<br />
25 Tumkur 25.2 18.9 5.9 27.1 27.3 76.5<br />
26 Udupi<br />
27 Uttara Kannada 27.9 21.4 3.3 15.0 27.2 76.4<br />
<strong>Karnataka</strong> 26.2 19.5 14.3 35.3 35.3 60.1<br />
Source: Rapid Household Survey <strong>Report</strong> (RCH) 1998-99, ISEC, Bangalore and IIPS, Mumbai.<br />
443
Appendix: Statistical Tables<br />
8. Gender Disparities<br />
District Indicators of reproductive and child health (RCH) 1998-99<br />
Percentage<br />
Institutional<br />
deliveries<br />
Percentage safe<br />
deliveries<br />
Percentage<br />
children receiving<br />
full immunisation<br />
Percentage women<br />
having at least<br />
one of RTI/STI<br />
symptoms<br />
Percentage men<br />
having at least<br />
one of RTI/STI<br />
symptoms<br />
1 46 47 48 49 50<br />
1 Bagalkot<br />
2 Bangalore Rural 64.8 73.9 83.7 14.0 2.2<br />
3 Bangalore Urban 78.3 81.6 77.7 19.2 5.4<br />
4 Belgaum 50.6 62.9 64.8 14.3 0.0<br />
5 Bellary 17.9 30.1 52.6 18.1 9.7<br />
6 Bidar 32.9 43.3 50.3 14.7 17.6<br />
7 Bijapur 38.9 48.4 53.2 6.3 7.5<br />
8 Chamarajnagar<br />
9 Chikmaglur 62.4 75.5 83.5 20.5 5.5<br />
10 Chitradurga 39.1 52.5 88.4 12.8 1.3<br />
11 Dakshina Kannada 76.6 87.2 86.0 24.2 2.8<br />
12 Davangere<br />
13 Dharwad 44.8 58.7 74.8 11.6 9.3<br />
14 Gadag<br />
15 Gulbarga 27.9 35.5 25.3 5.8 11.0<br />
16 Hassan 60.4 67.4 92.8 13.0 2.2<br />
17 Haveri<br />
18 Kodagu 67.7 74.1 94.8 21.1 4.2<br />
19 Kolar 41.3 52.7 90.6 19.6 0.6<br />
20 Koppal<br />
21 Mandya 48.8 60.8 88.0 32.5 1.2<br />
22 Mysore 59.5 64.9 92.7 11.0 2<br />
23 Raichur 22.7 36.5 37.2 24.0 13.4<br />
24 Shimoga 62.1 74.1 92.9 23.0 2.8<br />
25 Tumkur 48.4 62.5 88.0 17.4 2.3<br />
26 Udupi<br />
27 Uttara Kannada 78.2 82.2 89.9 14.4 2.5<br />
<strong>Karnataka</strong> 50.0 60.0 71.8 16.3 4.4<br />
Source: Rapid Household Survey <strong>Report</strong> (RCH) 1998-99, ISEC, Bangalore and IIPS, Mumbai.<br />
444
<strong>Karnataka</strong> <strong>Human</strong> <strong>Development</strong> <strong>Report</strong> <strong>2005</strong><br />
8. Gender Disparities<br />
District Sterilisation cases Work participation rates (total of main and marginal)<br />
% female sterilisation<br />
to total<br />
Males Females Percentage increase/<br />
decrease over 1991<br />
1998-99 2003-04 1991 2001 1991 2001 Male Female<br />
1 51 52 53 54 55 56 57 58<br />
1 Bagalkot 99.8 99.9 52.0 53.7 32.2 33.3 3.3 3.4<br />
2 Bangalore Rural 100.0 100.0 56.1 59.6 29.2 34.7 6.2 18.8<br />
3 Bangalore Urban 99.7 99.6 53.3 58.0 13.2 18.7 8.8 41.7<br />
4 Belgaum 100.0 99.5 54.4 55.9 29.7 32.7 2.8 10.1<br />
5 Bellary 99.9 99.8 53.6 54.6 35.5 35.9 1.9 1.1<br />
6 Bidar 100.0 100.0 48.8 47.5 30.5 26.2 -2.7 -14.1<br />
7 Bijapur 100.0 100.0 49.9 50.5 31.9 28.5 1.2 -10.7<br />
8 Chamarajnagar 100.0 100.0 59.7 61.4 27.3 31.1 2.8 13.9<br />
9 Chikmaglur 100.0 99.9 57.5 59.4 32.1 30.9 3.3 -3.7<br />
10 Chitradurga 100.0 100.0 54.4 57.0 34.6 37.7 4.8 9.0<br />
11 Dakshina Kannada 99.8 99.2 53.1 58.2 37.6 41.7 9.6 10.9<br />
12 Davangere 100.0 99.9 54.0 56.7 30.2 30.1 5.0 -0.3<br />
13 Dharwad 99.9 98.7 52.2 56.0 25.0 28.6 7.3 14.4<br />
14 Gadag 100.0 100.0 53.1 56.2 36.3 37.7 5.8 3.9<br />
15 Gulbarga 100.0 99.9 51.2 51.1 34.6 34.9 -0.2 0.9<br />
16 Hassan 99.9 99.8 56.1 60.8 32.4 39.7 8.4 22.5<br />
17 Haveri 100.0 100.0 55.0 58.2 31.6 33.7 5.8 6.6<br />
18 Kodagu 100.0 99.8 58.7 60.9 35.3 36.2 3.7 2.5<br />
19 Kolar 100.0 100.0 55.0 58.1 31.4 39.0 5.6 24.2<br />
20 Koppal 100.0 100.0 54.1 53.7 38.5 38.9 -0.7 1.0<br />
21 Mandya 100.0 100.0 57.5 61.2 31.0 33.9 6.4 9.4<br />
22 Mysore 99.9 99.9 55.9 58.2 20.8 25.3 4.1 21.6<br />
23 Raichur 100.0 100.0 53.3 52.9 32.6 34.7 -0.8 6.4<br />
24 Shimoga 99.9 99.5 55.1 58.7 24.4 28.0 6.5 14.8<br />
25 Tumkur 100.0 100.0 56.9 60.2 38.1 41.3 5.8 8.4<br />
26 Udupi 99.8 99.7 49.4 55.1 31.3 33.9 11.5 8.3<br />
27 Uttara Kannada 99.9 99.9 53.3 57.6 23.7 27.8 8.1 17.3<br />
<strong>Karnataka</strong> 99.9 99.8 54.1 56.6 29.4 32.0 4.6 8.8<br />
Source: Col. 51 and 52: Directorate of Health and Family Welfare Services, <strong>Karnataka</strong>.<br />
445
Appendix: Statistical Tables<br />
8. Gender Disparities<br />
District<br />
Proportion of female workers to male workers (%)<br />
Women work participation<br />
Percentage of women<br />
cultivators to all<br />
cultivators<br />
Percentage of women<br />
agricultural labourers<br />
to all agricultural<br />
labourers<br />
1991 2001 2001 2001<br />
1 59 60 61 62<br />
1 Bagalkot 60.7 60.7 24.5 61.2<br />
2 Bangalore Rural 49.2 55.6 32.8 56.8<br />
3 Bangalore Urban 22.4 29.2 25.9 46.8<br />
4 Belgaum 52.1 56.2 32.1 58.2<br />
5 Bellary 63.9 63.8 29.5 60.0<br />
6 Bidar 59.4 52.3 27.0 54.3<br />
7 Bijapur 60.7 53.6 21.4 57.1<br />
8 Chamarajnagar 54.5 49.2 18.8 45.7<br />
9 Chikmaglur 60.4 51.2 20.9 53.7<br />
10 Chitradurga 43.6 63.2 30.5 60.4<br />
11 Dakshina Kannada 52.7 73.2 28.9 34.1<br />
12 Davangere 44.7 50.5 21.8 54.5<br />
13 Dharwad 72.3 48.4 31.5 59.3<br />
14 Gadag 66.2 65.0 29.8 61.9<br />
15 Gulbarga 65.0 66.0 23.7 64.3<br />
16 Hassan 57.6 65.6 39.1 65.2<br />
17 Haveri 53.9 54.6 20.9 54.0<br />
18 Kodagu 58.8 59.1 29.3 47.4<br />
19 Kolar 55.0 65.3 37.5 58.2<br />
20 Koppal 69.8 71.3 25.9 64.2<br />
21 Mandya 52.0 54.6 29.6 55.3<br />
22 Mysore 35.5 41.9 27.9 49.3<br />
23 Raichur 59.9 64.6 20.0 61.8<br />
24 Shimoga 42.6 46.6 25.4 52.8<br />
25 Tumkur 64.1 66.4 35.8 62.4<br />
26 Udupi 71.9 69.5 45.4 57.5<br />
27 Uttara Kannada 42.9 46.8 34.3 55.2<br />
<strong>Karnataka</strong> 52.1 54.5 29.8 57.9<br />
Source: Population Census - PCA 1991 and 2001.<br />
446
<strong>Karnataka</strong> <strong>Human</strong> <strong>Development</strong> <strong>Report</strong> <strong>2005</strong><br />
8. Gender Disparities<br />
District<br />
Percentage of women in<br />
household industries to<br />
all workers in household<br />
industries<br />
Women work participation<br />
Percentage of women<br />
other worker to all other<br />
workers<br />
Percentage of women employees in<br />
organised sector<br />
2001 2001 1998-99 2003-04<br />
1 63 64 65 66<br />
1 Bagalkot 38.0 18.5 20.6 23.3<br />
2 Bangalore Rural 46.0 25.1<br />
3 Bangalore Urban 46.3 21.1 24.8 26.3<br />
4 Belgaum 36.4 16.2 15.3 20.2<br />
5 Bellary 48.7 19.5 17.7 20.2<br />
6 Bidar 39.6 17.8 19.5 23.7<br />
7 Bijapur 31.8 17.4 19.7 100.1<br />
8 Chamarajnagar 52.2 23.3 31.8 32.7<br />
9 Chikmaglur 38.8 32.6 33.6 33.6<br />
10 Chitradurga 46.8 21.2 22.7 28.3<br />
11 Dakshina Kannada 92.0 28.6 69.1 69.1<br />
12 Davangere 54.6 19.2 28.3 28.9<br />
13 Dharwad 39.6 16.4 14.8 17.7<br />
14 Gadag 40.4 17.1 18.8 25.7<br />
15 Gulbarga 44.8 21.4 21.3 25.3<br />
16 Hassan 41.7 27.4 23.2 29.5<br />
17 Haveri 50.5 15.0 14.7 22.8<br />
18 Kodagu 45.1 37.3 39.2 43.1<br />
19 Kolar 51.2 24.9 21.8 27.7<br />
20 Koppal 40.4 21.8 26.2 25.5<br />
21 Mandya 52.2 25.3 23.6 25.4<br />
22 Mysore 58.4 18.3 19.6 22.5<br />
23 Raichur 37.7 20.5 17.8 21.5<br />
24 Shimoga 42.3 18.1 20.6 23.4<br />
25 Tumkur 60.3 22.8 23.5 24.9<br />
26 Udupi 84.6 22.1 48.3 52.9<br />
27 Uttara Kannada 30.1 25.2 21.5 24.8<br />
<strong>Karnataka</strong> 57.8 22.1 29.5 31.5<br />
Sources:<br />
1. Col. 63 and 64: Population Census - PCA 1991 and 2001.<br />
2. Col. 65 and 66: Directorate of Employment and Training, <strong>Karnataka</strong>.<br />
447
Appendix: Statistical Tables<br />
8. Gender Disparities<br />
District<br />
Women’s hardships<br />
Type of fuel for cooking – percentage<br />
1991 2001<br />
Rural Urban Total Rural Urban Total<br />
1 67 68 69 70 71 72<br />
1 Bagalkot 97 68 88<br />
2 Bangalore Rural 99 70 96 95 72 90<br />
3 Bangalore Urban 98 80 69 82 46 50<br />
4 Belgaum 94 74 85 88 44 77<br />
5 Bellary 99 84 94 96 68 86<br />
6 Bidar 99 73 97 98 72 93<br />
7 Bijapur 99 65 95 97 64 90<br />
8 Chamarajnagar 96 74 93<br />
9 Chikmaglur 97 85 93 91 52 83<br />
10 Chitradurga 95 87 93 97 66 91<br />
11 Dakshina Kannada 99 82 88 90 48 73<br />
12 Davangere 94 57 82<br />
13 Dharwad 91 87 89 95 46 68<br />
14 Gadag 97 71 88<br />
15 Gulbarga 99 66 94 98 66 90<br />
16 Hassan 99 89 95 94 52 86<br />
17 Haveri 96 68 90<br />
18 Kodagu 97 81 91 85 33 78<br />
19 Kolar 99 87 95 96 64 88<br />
20 Koppal 96 76 93<br />
21 Mandya 95 80 96 95 68 90<br />
22 Mysore 98 69 91 95 49 78<br />
23 Raichur 99 70 96 97 73 91<br />
24 Shimoga 96 73 69 86 49 73<br />
25 Tumkur 99 70 96 97 58 89<br />
26 Udupi 82 45 75<br />
27 Uttara Kannada 99 79 88 83 46 72<br />
<strong>Karnataka</strong> 98 84 90 93 54 80<br />
Source: Computed based on data of Population Census 2001 (Housing tables).<br />
448
<strong>Karnataka</strong> <strong>Human</strong> <strong>Development</strong> <strong>Report</strong> <strong>2005</strong><br />
8. Gender Disparities<br />
District<br />
Women’s hardships<br />
Percentage of households without access to safe drinking water<br />
1991 2001<br />
Rural Urban Total Rural Urban Total<br />
1 73 74 75 76 77 78<br />
1 Bagalkot 17 6 14<br />
2 Bangalore Rural 13 14 11 3 3 3<br />
3 Bangalore Urban 18 11 19 2 4 4<br />
4 Belgaum 36 39 24 28 14 25<br />
5 Bellary 16 18 11 8 2 6<br />
6 Bidar 40 40 36 18 30 20<br />
7 Bijapur 27 31 13 23 8 20<br />
8 Chamarajnagar 8 0 7<br />
9 Chikmaglur 31 35 7 21 2 17<br />
10 Chitradurga 12 14 7 2 0 2<br />
11 Dakshina Kannada 80 88 59 75 39 61<br />
12 Davangere 5 3 4<br />
13 Dharwad 18 22 12 24 5 13<br />
14 Gadag 17 4 12<br />
15 Gulbarga 37 43 15 24 6 19<br />
16 Hassan 20 23 8 8 1 7<br />
17 Haveri 2 4 3<br />
18 Kodagu 55 62 16 50 13 45<br />
19 Kolar 10 10 12 3 3 3<br />
20 Koppal 8 2 7<br />
21 Mandya 29 30 21 7 4 7<br />
22 Mysore 17 20 10 7 1 5<br />
23 Raichur 35 39 16 27 4 21<br />
24 Shimoga 34 41 14 36 9 27<br />
25 Tumkur 19 20 13 3 1 3<br />
26 Udupi 83 68 80<br />
27 Uttara Kannada 70 76 51 71 51 65<br />
<strong>Karnataka</strong> 28 33 19 19 8 15<br />
Source: Computed based on data of Population Census 2001 (Housing tables).<br />
449
Appendix: Statistical Tables<br />
8. Gender Disparities<br />
District<br />
Women’s hardships<br />
Percentage of households without access to toilet<br />
1991 2001<br />
Rural Urban Total Rural Urban Total<br />
1 79 80 81 82 83 84<br />
1 Bagalkot 95 66 86<br />
2 Bangalore Rural 94 34 83 79 17 66<br />
3 Bangalore Urban 81 19 27 59 9 15<br />
4 Belgaum 96 52 86 90 42 78<br />
5 Bellary 97 65 87 87 46 73<br />
6 Bidar 97 52 90 92 38 81<br />
7 Bijapur 99 74 93 97 57 88<br />
8 Chamarajnagar 89 43 82<br />
9 Chikmaglur 86 33 77 67 20 58<br />
10 Chitradurga 96 48 83 89 35 79<br />
11 Dakshina Kannada 80 31 66 53 14 37<br />
12 Davangere 81 33 66<br />
13 Dharwad 92 53 78 84 30 55<br />
14 Gadag 93 66 84<br />
15 Gulbarga 98 53 88 95 43 81<br />
16 Hassan 94 35 84 83 21 72<br />
17 Haveri 82 39 74<br />
18 Kodagu 75 28 68 51 25 48<br />
19 Kolar 93 37 80 80 25 67<br />
20 Koppal 91 61 86<br />
21 Mandya 94 45 86 84 26 75<br />
22 Mysore 95 27 75 83 10 56<br />
23 Raichur 98 72 93 94 57 84<br />
24 Shimoga 90 34 74 67 24 52<br />
25 Tumkur 96 36 86 86 24 74<br />
26 Udupi 50 16 44<br />
27 Uttara Kannada 88 44 77 78 36 65<br />
<strong>Karnataka</strong> 93 37 76 83 25 63<br />
Source: Computed based on data of Population Census 2001(Housing tables).<br />
450
<strong>Karnataka</strong> <strong>Human</strong> <strong>Development</strong> <strong>Report</strong> <strong>2005</strong><br />
8. Gender Disparities<br />
District<br />
Crime against women<br />
Molestation and rape per lakh female population Dowry deaths per lakh female population<br />
1991 1998 2003 1991 1998 2003<br />
1 85 86 87 88 89 90<br />
1 Bagalkot 5.79 6.63 0.13 0.24<br />
2 Bangalore Rural 9.48 14.35 3.27 3.32<br />
3 Bangalore Urban 11.86 7.41 7.49 4.23 1.57 1.03<br />
4 Belgaum 17.87 3.81 2.64 2.68 0.15 0.57<br />
5 Bellary 10.07 7.22 6.97 1.06 0.96 0.19<br />
6 Bidar 5.47 4.75 6.78 1.37 0.86 0.66<br />
7 Bijapur 14.93 8.68 8.52 1.49 0.24 0.44<br />
8 Chamarajnagar 3.24 8.96 0.87 0.83<br />
9 Chikmaglur 1.33 9.33 10.54 0.00 0.91 0.69<br />
10 Chitradurga 6.03 8.61 8.22 0.54 0.56 0.80<br />
11 Dakshina Kannada 1.79 2.39 2.64 0.30 0.00 0.20<br />
12 Davangere 5.84 8.10 0.36 1.13<br />
13 Dharwad 5.48 2.95 2.74 0.53 0.80 0.75<br />
14 Gadag 2.38 2.66 0.65 0.20<br />
15 Gulbarga 22.48 10.94 10.32 6.08 1.03 0.31<br />
16 Hassan 6.64 7.62 10.77 0.00 0.83 0.34<br />
17 Haveri 2.67 5.07 0.30 0.14<br />
18 Kodagu 3.62 7.21 13.73 0.16 0.00 0.36<br />
19 Kolar 14.67 9.27 5.66 1.81 0.67 1.34<br />
20 Koppal 2.88 4.86 0.00 0.81<br />
21 Mandya 1.50 6.30 8.86 1.36 1.05 0.57<br />
22 Mysore 18.55 8.72 6.48 1.78 1.21 0.91<br />
23 Raichur 10.82 5.57 8.67 0.00 0.26 0.83<br />
24 Shimoga 15.36 9.07 10.63 2.23 1.66 0.48<br />
25 Tumkur 1.37 2.93 7.06 0.23 0.33 0.78<br />
26 Udupi 4.34 4.38 0.00 0.00<br />
27 Uttara Kannada 2.36 4.33 5.75 0.09 0.77 0.15<br />
<strong>Karnataka</strong> 7.31 6.36 7.16 1.15 0.81 0.73<br />
Source: Computed based on data of State Crimes Record Bureau, <strong>Karnataka</strong>. and Census Population 1991.<br />
451
Appendix: Statistical Tables<br />
8. Gender Disparities<br />
District<br />
Crime against women<br />
Suicides per lakh population<br />
Female suicides as % of male<br />
1991 1998 2003<br />
Male Female Male Female Male Female 1991 1998 2003<br />
1 91 92 93 94 95 96 97 98 99<br />
1 Bagalkot 28.02 12.09 25.80 17.05 47.24 64.57<br />
2 Bangalore Rural 66.56 28.78 63.15 29.76 65.89 44.91<br />
3 Bangalore Urban 37.39 23.97 27.33 25.28 23.72 18.45 64.11 77.16 70.45<br />
4 Belgaum 112.31 66.14 23.19 9.76 21.52 8.96 58.89 56.64 39.92<br />
5 Bellary 9.54 13.52 24.89 15.50 22.69 14.70 141.67 66.67 62.81<br />
6 Bidar 27.94 18.37 14.19 4.61 13.11 6.12 65.73 44.44 44.23<br />
7 Bijapur 43.00 29.86 20.41 15.94 18.98 9.51 69.44 62.33 47.51<br />
8 Chamarajnagar 17.38 8.00 16.75 8.34 38.14 48.19<br />
9 Chikmaglur 12.69 5.11 46.24 35.30 43.67 29.02 40.30 61.66 65.37<br />
10 Chitradurga 52.02 43.11 42.97 36.83 40.39 19.23 82.87 74.79 45.45<br />
11 Dakshina Kannada 42.31 22.35 46.34 14.53 43.44 11.89 52.82 32.52 27.99<br />
12 Davangere 48.99 31.96 46.22 26.77 63.96 55.09<br />
13 Dharwad 29.71 19.38 33.62 15.93 31.30 14.08 65.25 49.38 42.64<br />
14 Gadag 24.55 8.45 23.18 12.48 44.83 52.14<br />
15 Gulbarga 136.10 118.48 12.73 5.99 11.64 7.67 87.05 63.97 63.54<br />
16 Hassan 33.63 21.68 34.45 17.62 33.15 13.17 64.47 67.27 39.93<br />
17 Haveri 23.38 11.59 22.18 9.30 43.58 39.52<br />
18 Kodagu 40.46 19.41 90.30 38.70 86.00 37.93 47.97 31.00 43.93<br />
19 Kolar 37.85 26.62 23.65 18.13 22.27 11.80 70.34 79.49 51.37<br />
20 Koppal 25.07 4.31 22.61 11.67 100.00 50.70<br />
21 Mandya 11.55 4.08 30.70 13.19 29.90 8.86 35.29 52.07 29.21<br />
22 Mysore 83.62 57.19 40.83 23.90 38.52 17.90 68.39 63.38 44.85<br />
23 Raichur 11.68 9.81 11.56 5.96 10.60 5.23 83.95 64.79 48.35<br />
24 Shimoga 134.93 82.41 48.19 26.33 45.54 24.15 61.08 52.42 51.81<br />
25 Tumkur 13.60 11.77 26.30 14.91 25.03 13.58 86.55 68.54 52.40<br />
26 Udupi 47.90 14.92 46.51 17.68 38.57 42.86<br />
27 Uttara Kannada 13.42 7.56 91.34 13.92 87.13 19.62 56.34 30.82 21.84<br />
<strong>Karnataka</strong> 35.29 23.58 32.62 17.40 30.31 14.97 66.81 58.33 47.59<br />
Source: Computed based on data of State Crimes Record Bureau, <strong>Karnataka</strong>. and Census Population 1991.<br />
452
<strong>Karnataka</strong> <strong>Human</strong> <strong>Development</strong> <strong>Report</strong> <strong>2005</strong><br />
8. Gender Disparities<br />
District<br />
Empowerment of women<br />
Gram panchayat - 2000<br />
No. of seats Seats won by women Total no. of<br />
presidents<br />
Women presidents<br />
No. % No. %<br />
1 100 101 102 103 104 105<br />
1 Bagalkot 2505 985 39 163 65 40<br />
2 Bangalore Rural 3479 1421 41 228 90 39<br />
3 Bangalore Urban 1707 740 43 112 41 37<br />
4 Belgaum 7253 3137 43 485 172 35<br />
5 Bellary 2763 1182 43 189 76 40<br />
6 Bidar 2551 1120 44 175 64 37<br />
7 Bijapur 3165 1371 43 199 74 37<br />
8 Chamarajnagar 1922 584 30 120 48 40<br />
9 Chikmaglur 2181 1046 48 226 85 38<br />
10 Chitradurga 2831 829 29 185 70 38<br />
11 Dakshina Kannada 2927 1317 45 203 75 37<br />
12 Davangere 2911 1218 42 230 85 37<br />
13 Dharwad 1646 849 52 127 51 40<br />
14 Gadag 1456 631 43 106 44 42<br />
15 Gulbarga 5021 2178 43 337 127 38<br />
16 Hassan 3451 1488 43 258 97 38<br />
17 Haveri 2667 1138 43 206 81 39<br />
18 Kodagu 1143 516 45 98 38 39<br />
19 Kolar 4372 2025 46 307 120 39<br />
20 Koppal 2101 895 43 134 50 37<br />
21 Mandya 3580 1530 43 232 87 38<br />
22 Mysore 3812 1606 42 235 87 37<br />
23 Raichur 2673 1120 42 164 60 37<br />
24 Shimoga 2495 1210 48 260 98 38<br />
25 Tumkur 4932 2074 42 321 121 38<br />
26 Udupi 2238 992 44 146 52 36<br />
27 Uttara Kannada 2332 1135 49 207 86 42<br />
<strong>Karnataka</strong> 80114 34337 43 5653 2144 38<br />
Source: Rural <strong>Development</strong> and Panchayat Raj Department, <strong>Karnataka</strong>.<br />
453
Appendix: Statistical Tables<br />
8. Gender Disparities<br />
District<br />
Empowerment of women<br />
Taluka panchayats - 2000<br />
No. of seats Seats won by women Total no. of<br />
presidents<br />
Women presidents<br />
No. % No. %<br />
1 106 107 108 109 110 111<br />
1 Bagalkot 99 41 41 6 2 33<br />
2 Bangalore Rural 139 57 41 8 3 38<br />
3 Bangalore Urban 68 28 41 4 1 25<br />
4 Belgaum 287 110 38 10 3 30<br />
5 Bellary 112 47 42 7 2 29<br />
6 Bidar 101 43 43 5 1 20<br />
7 Bijapur 124 49 40 5 2 40<br />
8 Chamarajnagar 81 33 41 4 1 25<br />
9 Chikmaglur 103 50 49 7 2 29<br />
10 Chitradurga 115 48 42 6 2 33<br />
11 Dakshina Kannada 115 48 42 5 2 40<br />
12 Davangere 115 46 40 6 2 33<br />
13 Dharwad 66 33 50 5 1 20<br />
14 Gadag 66 32 48 5 2 40<br />
15 Gulbarga 198 82 41 10 3 30<br />
16 Hassan 139 58 42 8 3 38<br />
17 Haveri 109 47 43 7 3 43<br />
18 Kodagu 46 19 41 3 1 33<br />
19 Kolar 181 78 43 11 4 36<br />
20 Koppal 83 33 40 4 1 25<br />
21 Mandya 144 60 42 7 2 29<br />
22 Mysore 152 62 41 7 3 43<br />
23 Raichur 107 43 40 5 2 40<br />
24 Shimoga 99 47 47 7 3 43<br />
25 Tumkur 195 80 41 10 3 30<br />
26 Udupi 88 34 39 3 1 33<br />
27 Uttara Kannada 123 67 54 11 4 36<br />
<strong>Karnataka</strong> 3255 1375 42 176 59 34<br />
Source: Rural <strong>Development</strong> and Panchayat Raj Department, <strong>Karnataka</strong>.<br />
454
<strong>Karnataka</strong> <strong>Human</strong> <strong>Development</strong> <strong>Report</strong> <strong>2005</strong><br />
8. Gender Disparities<br />
District<br />
Empowerment of women<br />
Zilla panchayats<br />
No. of seats Seats won by women Total no. of<br />
presidents<br />
Women presidents<br />
No. % No. %<br />
1 112 113 114 115 116 117<br />
1 Bagalkot 26 10 38 1 0 0<br />
2 Bangalore Rural 38 16 42 1 0 0<br />
3 Bangalore Urban 17 7 41 1 0 0<br />
4 Belgaum 76 28 37 1 0 0<br />
5 Bellary 32 12 38 1 0 0<br />
6 Bidar 26 10 38 1 0 0<br />
7 Bijapur 32 13 41 1 1 100<br />
8 Chamarajnagar 21 9 43 1 1 100<br />
9 Chikmaglur 30 12 40 1 0 0<br />
10 Chitradurga 31 12 39 1 1 100<br />
11 Dakshina Kannada 31 13 42 1 0 0<br />
12 Davangere 31 13 42 1 1 100<br />
13 Dharwad 18 8 44 1 0 0<br />
14 Gadag 17 7 41 1 0 0<br />
15 Gulbarga 55 20 36 1 1 100<br />
16 Hassan 37 14 38 1 1 100<br />
17 Haveri 29 12 41 1 0 0<br />
18 Kodagu 26 9 35 1 1 100<br />
19 Kolar 47 18 38 1 0 0<br />
20 Koppal 23 9 39 1 0 0<br />
21 Mandya 39 15 38 1 0 0<br />
22 Mysore 41 16 39 1 0 0<br />
23 Raichur 29 11 38 1 0 0<br />
24 Shimoga 27 10 37 1 0 0<br />
25 Tumkur 52 19 37 1 1 100<br />
26 Udupi 24 10 42 1 1 100<br />
27 Uttara Kannada 35 13 37 1 0 0<br />
<strong>Karnataka</strong> 890 346 39 27 9 33<br />
Source: Rural <strong>Development</strong> and Panchayat Raj Department, <strong>Karnataka</strong>.<br />
455
Appendix: Statistical Tables<br />
9. Housing and Amenities<br />
District<br />
Percentage distribution of census houses according to type<br />
1991 2001<br />
All areas<br />
Pucca Semi-pucca Kutcha Not stated Permanent Semipermanent<br />
All areas<br />
Temporary<br />
Unclassified<br />
1 2 3 4 5 6 7 8 9<br />
1 Bagalkot 25.15 66.89 7.92 0.04<br />
2 Bangalore Rural 42.52 34.12 19.63 3.74 56.59 29.37 14.03 0.01<br />
3 Bangalore Urban 82.79 10.66 3.44 3.10 89.72 8.52 1.75 0.01<br />
4 Belgaum 48.35 39.46 9.11 3.09 54.60 38.34 7.05 0.01<br />
5 Bellary 34.48 38.25 25.42 1.85 42.03 33.48 24.47 0.03<br />
6 Bidar 68.69 21.79 5.18 4.34 75.17 22.49 2.29 0.05<br />
7 Bijapur 23.06 66.29 8.62 2.03 26.96 63.77 9.21 0.06<br />
8 Chamarajnagar 46.88 41.58 11.50 0.03<br />
9 Chikmaglur 36.00 43.19 16.48 4.34 44.81 49.15 6.02 0.02<br />
10 Chitradurga 48.75 33.44 13.64 4.17 51.83 35.60 12.53 0.04<br />
11 Dakshina Kannada 33.18 41.43 23.22 2.17 48.06 47.29 4.63 0.02<br />
12 Davangere 60.13 34.19 5.66 0.02<br />
13 Dharwad 33.74 39.75 21.54 4.97 47.37 35.40 17.21 0.02<br />
14 Gadag 32.94 38.93 28.08 0.04<br />
15 Gulbarga 56.81 34.63 5.45 3.11 59.49 35.34 5.13 0.04<br />
16 Hassan 23.34 67.58 6.98 2.09 32.84 64.52 2.63 0.02<br />
17 Haveri 39.13 52.33 8.52 0.03<br />
18 Kodagu 38.82 43.99 13.47 3.72 49.16 46.81 4.03 0.00<br />
19 Kolar 58.23 22.00 16.19 3.59 69.19 19.98 10.82 0.01<br />
20 Koppal 25.95 40.18 33.81 0.07<br />
21 Mandya 45.76 36.18 14.37 3.70 56.93 34.18 8.88 0.01<br />
22 Mysore 39.71 43.83 12.28 4.19 53.73 41.12 5.14 0.01<br />
23 Raichur 20.80 40.56 36.44 2.20 24.01 44.28 31.68 0.03<br />
24 Shimoga 37.84 35.81 21.08 5.26 45.27 47.27 7.46 0.00<br />
25 Tumkur 47.66 28.82 19.69 3.83 61.23 24.91 13.79 0.07<br />
26 Udupi 53.18 39.96 6.85 0.01<br />
27 Uttara Kannada 38.11 33.01 21.84 7.04 48.65 42.78 8.55 0.02<br />
<strong>Karnataka</strong> 45.15 36.40 14.97 3.49 54.94 35.52 9.51 0.02<br />
Notes:<br />
1. The terms used in 1991 Census such as kutcha, semi-pucca and pucca.<br />
2. In 2001 these have been changed to temporary, semi-permanent and permanent respectively.<br />
3. The information pertaining to Census 1991 relates to undivided 20 distircts.<br />
Source: Primary Census Abstract (H-Series) - 1991 and 2001.<br />
456
<strong>Karnataka</strong> <strong>Human</strong> <strong>Development</strong> <strong>Report</strong> <strong>2005</strong><br />
9. Housing and Amenities<br />
District<br />
Percentage distribution of census houses according to type<br />
1991 2001<br />
Rural<br />
Pucca Semi-pucca Kutcha Not stated Permanent Semipermanent<br />
Rural<br />
Temporary<br />
Unclassified<br />
1 10 11 12 13 14 15 16 17<br />
1 Bagalkot 16.91 73.96 9.08 0.05<br />
2 Bangalore Rural 36.57 37.89 21.76 3.78 51.18 33.00 15.81 0.01<br />
3 Bangalore Urban 55.86 34.32 6.90 2.92 71.32 24.86 3.81 0.01<br />
4 Belgaum 44.51 41.96 10.87 2.65 51.38 40.16 8.46 0.01<br />
5 Bellary 27.68 44.55 26.23 1.53 32.81 39.30 27.86 0.03<br />
6 Bidar 66.49 22.97 6.01 4.52 74.46 22.94 2.55 0.05<br />
7 Bijapur 14.17 73.99 10.14 1.70 15.59 73.53 10.84 0.04<br />
8 Chamarajnagar 43.40 44.27 12.29 0.04<br />
9 Chikmaglur 30.09 47.09 18.92 3.90 38.43 54.45 7.09 0.03<br />
10 Chitradurga 40.95 40.49 16.00 2.57 47.65 39.20 13.11 0.04<br />
11 Dakshina Kannada 24.78 43.17 29.96 2.08 32.87 60.25 6.87 0.01<br />
12 Davangere 55.24 37.64 7.10 0.02<br />
13 Dharwad 22.79 46.31 26.95 3.95 23.93 45.87 30.19 0.02<br />
14 Gadag 28.53 40.79 30.67 0.02<br />
15 Gulbarga 48.78 41.81 6.65 2.76 50.30 43.35 6.31 0.03<br />
16 Hassan 14.08 76.05 7.78 2.08 23.90 73.18 2.89 0.02<br />
17 Haveri 35.35 55.36 9.26 0.03<br />
18 Kodagu 33.28 47.70 15.26 3.76 44.88 50.59 4.52 0.00<br />
19 Kolar 52.49 24.44 19.37 3.71 63.54 23.01 13.44 0.01<br />
20 Koppal 21.12 43.26 35.55 0.07<br />
21 Mandya 41.12 40.79 14.15 3.95 53.27 38.12 8.60 0.01<br />
22 Mysore 25.67 54.86 15.44 4.03 36.65 56.53 6.81 0.01<br />
23 Raichur 14.24 45.69 38.26 1.81 13.66 50.10 36.21 0.03<br />
24 Shimoga 26.70 41.06 27.78 4.45 31.28 57.81 10.90 0.00<br />
25 Tumkur 41.56 32.07 22.47 3.89 56.50 27.38 16.05 0.07<br />
26 Udupi 48.06 43.97 7.96 0.01<br />
27 Uttara Kannada 29.26 36.20 27.64 6.90 39.94 48.77 11.26 0.02<br />
<strong>Karnataka</strong> 33.32 44.62 18.86 3.20 42.71 44.94 12.32 0.02<br />
Note: The information pertaining to Census 1991 relates to undivided 20 distircts.<br />
Source: Primary Census Abstract (H-Series) - 1991 and 2001.<br />
457
Appendix: Statistical Tables<br />
9. Housing and Amenities<br />
District<br />
Percentage distribution of census houses according to type<br />
1991 2001<br />
Urban<br />
Pucca Semi-pucca Kutcha Not stated Permanent Semipermanent<br />
Urban<br />
Temporary<br />
Unclassified<br />
1 18 19 20 21 22 23 24 25<br />
1 Bagalkot 45.42 49.49 5.07 0.03<br />
2 Bangalore Rural 67.80 18.08 10.53 3.59 76.97 15.70 7.32 0.00<br />
3 Bangalore Urban 87.04 6.93 2.90 3.13 92.13 6.38 1.48 0.01<br />
4 Belgaum 61.14 31.11 3.21 4.54 64.67 32.67 2.63 0.03<br />
5 Bellary 49.74 24.08 23.60 2.58 58.74 22.93 18.31 0.03<br />
6 Bidar 78.26 16.62 1.54 3.59 77.89 20.75 1.31 0.05<br />
7 Bijapur 50.42 42.62 3.95 3.02 67.96 28.56 3.34 0.15<br />
8 Chamarajnagar 66.88 26.11 7.00 0.01<br />
9 Chikmaglur 66.96 22.74 3.67 6.62 70.94 27.43 1.63 0.00<br />
10 Chitradurga 69.36 14.82 7.42 8.40 70.47 19.55 9.92 0.06<br />
11 Dakshina Kannada 56.09 36.68 4.84 2.39 71.63 27.19 1.16 0.03<br />
12 Davangere 71.23 26.38 2.38 0.01<br />
13 Dharwad 52.79 28.35 12.12 6.75 65.95 27.11 6.92 0.02<br />
14 Gadag 41.30 35.43 23.19 0.08<br />
15 Gulbarga 82.88 11.34 1.54 4.24 85.89 12.32 1.72 0.07<br />
16 Hassan 68.02 26.70 3.14 2.14 74.61 24.01 1.38 0.00<br />
17 Haveri 54.17 40.26 5.58 0.00<br />
18 Kodagu 71.31 22.25 2.93 3.51 76.43 22.69 0.88 0.00<br />
19 Kolar 78.39 13.41 5.01 3.18 86.54 10.68 2.76 0.02<br />
20 Koppal 49.48 25.16 25.30 0.07<br />
21 Mandya 67.14 14.94 15.38 2.54 76.27 13.38 10.34 0.00<br />
22 Mysore 72.79 17.83 4.81 4.56 82.23 15.40 2.36 0.01<br />
23 Raichur 44.35 22.12 29.90 3.62 54.32 27.24 18.39 0.05<br />
24 Shimoga 66.59 22.26 3.79 7.37 70.85 27.99 1.16 0.00<br />
25 Tumkur 77.35 12.99 6.12 3.54 80.84 14.66 4.42 0.07<br />
26 Udupi 75.33 22.61 2.03 0.03<br />
27 Uttara Kannada 64.36 23.54 4.63 7.48 69.98 28.08 1.91 0.03<br />
<strong>Karnataka</strong> 70.99 18.45 6.45 4.11 77.92 17.82 4.23 0.02<br />
Note: The information pertaining to Census 1991 relates to undivided 20 distircts.<br />
Source: Primary Census Abstract (H-Series) - 1991 and 2001.<br />
458
<strong>Karnataka</strong> <strong>Human</strong> <strong>Development</strong> <strong>Report</strong> <strong>2005</strong><br />
9. Housing and Amenities<br />
District<br />
Percentage distribution of households by no. of rooms (all areas)<br />
1991<br />
No. of households occupied<br />
1 room 2 rooms 3 rooms 4 rooms and<br />
above<br />
Unspecified<br />
rooms<br />
Total no. of<br />
households<br />
1 26 27 28 29 30 31<br />
1 Bagalkot<br />
2 Bangalore Rural 36.55 35.85 12.87 8.14 6.58 308550<br />
3 Bangalore Urban 39.45 31.59 14.47 11.95 2.54 927425<br />
4 Belgaum 38.22 38.18 12.85 7.71 3.03 614610<br />
5 Bellary 42.87 37.93 10.00 6.44 2.76 324515<br />
6 Bidar 46.43 32.63 9.94 9.84 1.15 <strong>2005</strong>70<br />
7 Bijapur 41.54 38.91 11.46 7.56 0.54 491925<br />
8 Chamarajnagar<br />
9 Chikmaglur 18.15 38.51 20.57 20.83 1.94 192995<br />
10 Chitradurga 40.73 35.39 12.14 8.05 3.70 382435<br />
11 Dakshina Kannada 19.36 29.76 21.37 28.61 0.89 452900<br />
12 Davangere<br />
13 Dharwad 35.21 39.13 13.09 9.32 3.25 586125<br />
14 Gadag<br />
15 Gulbarga 41.63 35.48 11.37 10.99 0.52 442755<br />
16 Hassan 26.57 37.58 15.92 11.19 8.74 291605<br />
17 Haveri<br />
18 Kodagu 9.37 28.45 21.14 40.79 0.25 105630<br />
19 Kolar 40.96 27.53 9.99 8.85 12.67 396755<br />
20 Koppal<br />
21 Mandya 35.79 32.89 12.39 8.71 10.22 302675<br />
22 Mysore 41.04 31.31 10.20 7.04 10.41 585390<br />
23 Raichur 49.51 33.70 9.21 5.57 2.01 406495<br />
24 Shimoga 12.21 38.14 24.34 24.42 0.88 344685<br />
25 Tumkur 37.70 35.00 12.45 7.96 6.88 441875<br />
26 Udupi<br />
27 Uttara Kannada 15.76 39.49 21.72 22.62 0.40 218535<br />
<strong>Karnataka</strong> 35.69 34.80 13.73 11.66 4.12 8018450<br />
Note: The information pertaining to Census 1991 relates to undivided 20 distircts.<br />
Source: Primary Census Abstract (H-Series) - 1991 and 2001.<br />
459
Appendix: Statistical Tables<br />
9. Housing and Amenities<br />
District Percentage distribution of households by no. of rooms (all areas)<br />
No. of<br />
exclusive<br />
rooms<br />
2001<br />
No. of households occupied<br />
1 room 2 rooms 3 rooms 4 rooms and<br />
above<br />
Total no. of<br />
households<br />
1 32 33 34 35 36 37<br />
1 Bagalkot 2.70 36.91 36.70 13.16 10.53 293347<br />
2 Bangalore Rural 18.01 41.44 23.87 9.62 7.06 383592<br />
3 Bangalore Urban 7.09 37.28 28.84 15.98 10.80 1418289<br />
4 Belgaum 3.48 36.00 33.53 14.84 12.15 761914<br />
5 Bellary 10.12 43.91 27.86 10.49 7.61 368360<br />
6 Bidar 1.16 41.61 32.19 12.23 12.81 247350<br />
7 Bijapur 1.53 41.86 34.37 12.15 10.08 323275<br />
8 Chamarajnagar 21.56 45.58 21.71 6.93 4.22 202913<br />
9 Chikmaglur 5.61 23.06 27.80 19.75 23.78 239728<br />
10 Chitradurga 10.44 44.87 27.39 10.52 6.78 294724<br />
11 Dakshina Kannada 1.85 12.18 22.10 22.87 41.00 349695<br />
12 Davangere 9.31 33.12 28.39 16.80 12.38 333888<br />
13 Dharwad 7.79 33.90 28.48 14.72 15.11 289789<br />
14 Gadag 20.36 43.31 23.06 7.72 5.55 180351<br />
15 Gulbarga 1.68 42.85 32.16 11.54 11.77 542937<br />
16 Hassan 9.56 33.70 27.28 15.50 13.96 360089<br />
17 Haveri 13.99 30.58 29.49 14.63 11.31 255761<br />
18 Kodagu 0.82 11.60 24.57 19.48 43.53 124098<br />
19 Kolar 19.51 40.61 22.15 9.50 8.23 499535<br />
20 Koppal 12.36 50.64 24.09 7.62 5.30 210649<br />
21 Mandya 21.72 40.37 21.81 9.20 6.89 368794<br />
22 Mysore 16.29 40.55 24.58 10.63 7.94 535927<br />
23 Raichur 5.07 51.10 27.36 9.66 6.81 298100<br />
24 Shimoga 3.16 15.16 29.09 23.95 28.64 330832<br />
25 Tumkur 13.25 33.63 29.79 13.40 9.93 545493<br />
26 Udupi 1.80 14.19 27.03 23.97 33.02 206222<br />
27 Uttara Kannada 1.51 18.85 32.59 22.12 24.93 266481<br />
<strong>Karnataka</strong> 8.90 35.84 28.15 14.00 13.11 10232133<br />
Source: Primary Census Abstract (H-Series) - 1991 and 2001.<br />
460
<strong>Karnataka</strong> <strong>Human</strong> <strong>Development</strong> <strong>Report</strong> <strong>2005</strong><br />
9. Housing and Amenities<br />
District<br />
Percentage distribution of households by no. of rooms (rural)<br />
1991<br />
No. of households occupied<br />
1 room 2 rooms 3 rooms 4 rooms and<br />
above<br />
Unspecified<br />
rooms<br />
Total no. of<br />
households<br />
1 38 39 40 41 42 43<br />
1 Bagalkot<br />
2 Bangalore Rural 37.16 36.17 12.62 7.03 7.02 253445<br />
3 Bangalore Urban 42.81 33.45 11.33 5.69 6.72 127020<br />
4 Belgaum 39.77 39.66 11.73 5.42 3.42 471935<br />
5 Bellary 47.93 35.84 8.46 4.28 3.50 226325<br />
6 Bidar 50.43 32.20 8.78 7.26 1.33 167110<br />
7 Bijapur 45.15 38.81 10.28 5.17 0.59 378585<br />
8 Chamarajnagar<br />
9 Chikmaglur 18.10 39.21 20.50 19.98 2.21 160490<br />
10 Chitradurga 46.30 33.90 9.97 5.25 4.58 281380<br />
11 Dakshina Kannada 20.28 30.80 21.16 26.84 0.92 325035<br />
12 Davangere<br />
13 Dharwad 39.63 38.42 11.29 6.41 4.24 384050<br />
14 Gadag<br />
15 Gulbarga 45.13 35.49 10.31 8.47 0.60 343325<br />
16 Hassan 26.71 38.58 15.62 9.96 9.13 240965<br />
17 Haveri<br />
18 Kodagu 9.30 29.84 21. 34 39.26 0.27 89435<br />
19 Kolar 45.40 26.40 8.03 5.50 14.66 305850<br />
20 Koppal<br />
21 Mandya 35.69 32.90 12.17 8.20 11.05 252605<br />
22 Mysore 42.90 31.67 9.04 4.89 11.49 416155<br />
23 Raichur 52.39 32.66 8.13 4.37 2.45 321835<br />
24 Shimoga 13.11 39.58 24.55 21.73 1.03 249505<br />
25 Tumkur 38.94 35.55 12.10 6.54 6.87 370200<br />
26 Udupi<br />
27 Uttara Kannada 17.58 42.15 20.40 19.46 0.40 164490<br />
<strong>Karnataka</strong> 37.74 35.28 12.63 9.43 4.92 5529740<br />
Note: The information pertaining to Census 1991 relates to undivided 20 distircts.<br />
Source: Primary Census Abstract (H-Series) - 1991.<br />
461
Appendix: Statistical Tables<br />
9. Housing and Amenities<br />
District<br />
No. exclusive<br />
room<br />
Percentage distribution of households by no. of rooms (rural)<br />
2001<br />
No. of households occupied<br />
1 room 2 rooms 3 rooms 4 rooms and<br />
above<br />
Total no. of<br />
households<br />
1 44 45 46 47 48 49<br />
1 Bagalkot 3.27 39.96 37.45 11.91 7.40 208499<br />
2 Bangalore Rural 20.15 41.30 23.29 8.99 6.27 302905<br />
3 Bangalore Urban 14.72 42.48 25.83 10.74 6.23 163932<br />
4 Belgaum 4.04 39.34 34.36 13.30 8.96 578259<br />
5 Bellary 13.76 49.18 25.56 7.57 3.93 237028<br />
6 Bidar 1.34 46.77 32.27 10.61 9.01 195936<br />
7 Bijapur 1.72 46.55 34.21 10.54 6.98 253138<br />
8 Chamarajnagar 23.02 45.63 21.10 6.45 3.79 173032<br />
9 Chikmaglur 6.45 24.40 27.58 18.92 22.65 192629<br />
10 Chitradurga 11.80 47.40 26.72 9.05 5.02 240594<br />
11 Dakshina Kannada 1.81 11.70 22.14 21.89 42.46 211879<br />
12 Davangere 11.31 37.10 26.58 14.45 10.55 231641<br />
13 Dharwad 14.05 48.62 23.57 8.46 5.30 129465<br />
14 Gadag 25.64 49.13 19.03 4.11 2.09 118054<br />
15 Gulbarga 1.95 47.62 32.13 10.05 8.25 402306<br />
16 Hassan 10.58 35.69 27.45 14.31 11.96 296318<br />
17 Haveri 15.94 32.57 28.98 13.23 9.28 204645<br />
18 Kodagu 0.80 11.66 25.36 19.04 43.14 107331<br />
19 Kolar 22.92 44.01 20.27 7.41 5.39 376491<br />
20 Koppal 14.10 53.57 22.53 6.00 3.81 174796<br />
21 Mandya 23.54 40.60 20.88 8.60 6.38 310296<br />
22 Mysore 22.08 42.48 21.63 8.30 5.51 334632<br />
23 Raichur 5.97 57.19 24.96 7.61 4.26 222168<br />
24 Shimoga 3.95 16.50 29.63 23.39 26.52 213611<br />
25 Tumkur 14.94 34.18 29.78 12.54 8.55 439243<br />
26 Udupi 1.96 15.16 27.90 23.61 31.37 167361<br />
27 Uttara Kannada 1.65 21.05 34.83 21.15 21.33 188984<br />
<strong>Karnataka</strong> 11.06 38.72 27.38 12.01 10.83 6675173<br />
Source: Primary Census Abstract (H-Series) - 2001.<br />
462
<strong>Karnataka</strong> <strong>Human</strong> <strong>Development</strong> <strong>Report</strong> <strong>2005</strong><br />
9. Housing and Amenities<br />
District<br />
Percentage distribution of households by no. of rooms (urban)<br />
1991<br />
No. of households occupied<br />
1 room 2 rooms 3 rooms 4 rooms and<br />
above<br />
Unspecified<br />
rooms<br />
Total no.of<br />
households<br />
1 50 51 52 53 54 55<br />
1 Bagalkot<br />
2 Bangalore Rural 33.74 34.39 14.06 13.27 4.55 55105<br />
3 Bangalore Urban 38.91 31.30 14.97 12.94 1.87 800405<br />
4 Belgaum 33.12 33.31 16.57 15.28 1.72 142675<br />
5 Bellary 31.23 42.75 13.55 11.42 1.06 98190<br />
6 Bidar 26.48 34.77 15.77 22.76 0.22 33460<br />
7 Bijapur 29.46 39.23 15.40 15.55 0.37 113340<br />
8 Chamarajnagar<br />
9 Chikmaglur 18.37 35.03 20.94 25.07 0.60 32505<br />
10 Chitradurga 25.20 39.52 18.18 15.86 1.23 101055<br />
11 Dakshina Kannada 17.01 27.13 21.92 33.11 0.83 127865<br />
12 Davangere<br />
13 Dharwad 26.82 40.48 16.50 14.84 1.36 202075<br />
14 Gadag<br />
15 Gulbarga 29.56 35.45 15.03 19.71 0.26 99430<br />
16 Hassan 25.91 32.81 17.37 17.03 6.88 50640<br />
17 Haveri<br />
18 Kodagu 9.76 20.81 20.01 49.27 0.15 16195<br />
19 Kolar 26.01 31.32 16.58 20.11 5.98 90905<br />
20 Koppal<br />
21 Mandya 36.32 32.85 13.47 11.30 6.05 50070<br />
22 Mysore 36.46 30.41 13.04 12.34 7.75 169235<br />
23 Raichur 38.57 37.64 13.31 10.15 0.32 84660<br />
24 Shimoga 9.86 34.37 23.80 31.49 0.48 95180<br />
25 Tumkur 31.27 32.18 14.28 15.33 6.93 71675<br />
26 Udupi<br />
27 Uttara Kannada 10.21 31.39 25.76 32.25 0.39 54045<br />
<strong>Karnataka</strong> 31.15 33.72 16.18 16.62 2.33 2488710<br />
Note: The information pertaining to Census 1991 relates to undivided 20 distircts.<br />
Source: Primary Census Abstract (H-Series) - 1991.<br />
463
Appendix: Statistical Tables<br />
9. Housing and Amenities<br />
District<br />
No. exclusive<br />
room<br />
Percentage distribution of households by no. of rooms (urban)<br />
2001<br />
No. of households occupied<br />
1 room 2 rooms 3 rooms 4 rooms and<br />
above<br />
Total no. of<br />
households<br />
1 56 57 58 59 60 61<br />
1 Bagalkot 1.32 29.41 34.85 16.23 18.19 84848<br />
2 Bangalore Rural 9.96 41.99 26.05 11.98 10.01 80687<br />
3 Bangalore Urban 6.10 36.60 29.24 16.67 11.40 1254357<br />
4 Belgaum 1.70 25.49 30.93 19.70 22.18 183655<br />
5 Bellary 3.54 34.41 32.03 15.77 14.25 131332<br />
6 Bidar 0.49 21.94 31.90 18.37 27.30 51414<br />
7 Bijapur 0.84 24.96 34.95 17.96 21.28 70137<br />
8 Chamarajnagar 13.12 45.30 25.21 9.70 6.67 29881<br />
9 Chikmaglur 2.17 17.57 28.69 23.14 28.42 47099<br />
10 Chitradurga 4.38 33.65 30.35 17.06 14.57 54130<br />
11 Dakshina Kannada 1.92 12.92 22.02 24.37 38.77 137816<br />
12 Davangere 4.77 24.10 32.49 22.13 16.51 102247<br />
13 Dharwad 2.72 22.02 32.45 19.79 23.03 160324<br />
14 Gadag 10.36 32.26 30.70 14.58 12.10 62297<br />
15 Gulbarga 0.89 29.19 32.24 15.82 21.87 140631<br />
16 Hassan 4.86 24.41 26.48 21.00 23.25 63771<br />
17 Haveri 6.19 22.62 31.52 20.23 19.45 51116<br />
18 Kodagu 0.94 11.25 19.50 22.32 46.00 16767<br />
19 Kolar 9.09 30.20 27.89 15.88 16.94 123044<br />
20 Koppal 3.87 36.34 31.68 15.50 12.61 35853<br />
21 Mandya 12.05 39.19 26.77 12.38 9.62 58498<br />
22 Mysore 6.69 37.34 29.49 14.51 11.97 201295<br />
23 Raichur 2.44 33.28 34.38 15.63 14.27 75932<br />
24 Shimoga 1.71 12.72 28.11 24.97 32.50 117221<br />
25 Tumkur 6.25 31.36 29.84 16.93 15.62 106250<br />
26 Udupi 1.08 10.04 23.24 25.51 40.12 38861<br />
27 Uttara Kannada 1.17 13.47 27.15 24.49 33.73 77497<br />
<strong>Karnataka</strong> 4.85 30.44 29.59 17.73 17.39 3556960<br />
Source: Primary Census Abstract (H-Series) - 2001.<br />
464
<strong>Karnataka</strong> <strong>Human</strong> <strong>Development</strong> <strong>Report</strong> <strong>2005</strong><br />
9. Housing and Amenities<br />
District<br />
Percentage distribution of households by size of households (all areas)<br />
1991 2001<br />
1-2 members 3-5 members more than 6 1-2 members 3-5 members more than 6<br />
1 62 63 64 65 66 67<br />
1 Bagalkot 11.80 44.64 43.56<br />
2 Bangalore Rural 10.71 47.72 41.58 12.07 58.16 29.77<br />
3 Bangalore Urban 11.94 54.08 33.99 13.99 64.31 21.69<br />
4 Belgaum 11.56 44.56 43.87 11.32 51.23 37.45<br />
5 Bellary 11.00 41.90 47.11 10.40 47.19 42.41<br />
6 Bidar 8.29 37.23 54.48 7.90 38.60 53.50<br />
7 Bijapur 11.61 38.09 50.31 10.30 42.87 46.83<br />
8 Chamarajnagar 12.57 59.52 27.91<br />
9 Chikmaglur 11.24 51.03 37.73 11.36 62.86 25.78<br />
10 Chitradurga 9.98 45.56 44.45 10.14 54.44 35.42<br />
11 Dakshina Kannada 10.14 40.85 49.01 10.88 52.49 36.63<br />
12 Davangere 8.92 54.01 37.08<br />
13 Dharwad 10.60 41.83 47.57 10.77 52.48 36.75<br />
14 Gadag 11.66 48.46 39.88<br />
15 Gulbarga 10.62 39.26 50.12 9.60 39.02 51.38<br />
16 Hassan 9.71 49.49 40.81 10.05 61.79 28.16<br />
17 Haveri 8.90 50.51 40.59<br />
18 Kodagu 15.89 57.28 26.83 16.43 64.73 18.84<br />
19 Kolar 11.35 45.52 43.13 11.93 54.26 33.81<br />
20 Koppal 11.05 43.39 45.56<br />
21 Mandya 10.06 49.87 40.06 11.28 61.31 27.40<br />
22 Mysore 10.77 50.13 39.10 11.03 60.73 28.24<br />
23 Raichur 12.25 41.91 45.84 11.12 43.59 45.29<br />
24 Shimoga 9.75 48.24 42.01 10.54 60.79 28.67<br />
25 Tumkur 12.06 49.59 38.35 12.57 59.02 28.40<br />
26 Udupi 11.15 48.30 40.55<br />
27 Uttara Kannada 13.32 43.29 43.39 12.89 53.23 33.88<br />
<strong>Karnataka</strong> 11.08 45.86 43.05 11.42 54.26 34.32<br />
Note: The information pertaining to Census 1991 relates to undivided 20 distircts.<br />
Source: Primary Census Abstract (H-Series) - 1991 and 2001.<br />
465
Appendix: Statistical Tables<br />
9. Housing and Amenities<br />
District<br />
Percentage distribution of households by size of households (rural)<br />
1991 2001<br />
1-2 members 3-5 members more than 6 1-2 members 3-5 members more than 6<br />
1 68 69 70 71 72 73<br />
1 Bagalkot 11.71 43.65 44.65<br />
2 Bangalore Rural 10.60 47.93 41.46 12.18 58.07 29.75<br />
3 Bangalore Urban 13.29 48.88 37.83 14.40 60.01 25.59<br />
4 Belgaum 11.26 43.75 44.99 11.18 49.83 38.98<br />
5 Bellary 10.97 40.87 48.16 10.17 44.58 45.25<br />
6 Bidar 8.12 37.81 54.07 7.94 38.07 54.00<br />
7 Bijapur 11.29 37.46 51.25 10.26 41.50 48.23<br />
8 Chamarajnagar 12.72 59.68 27.60<br />
9 Chikmaglur 10.82 51.12 38.06 11.08 62.58 26.34<br />
10 Chitradurga 9.87 45.29 44.83 10.13 53.58 36.29<br />
11 Dakshina Kannada 9.47 39.04 51.49 9.17 50.14 40.69<br />
12 Davangere 8.56 53.06 38.38<br />
13 Dharwad 10.31 41.20 48.49 10.48 50.35 39.17<br />
14 Gadag 11.49 47.81 40.69<br />
15 Gulbarga 10.51 39.36 50.13 9.49 37.78 52.74<br />
16 Hassan 9.21 49.56 41.23 9.84 61.34 28.82<br />
17 Haveri 8.64 50.86 40.50<br />
18 Kodagu 15.48 57.62 26.90 16.34 64.66 19.00<br />
19 Kolar 11.63 45.74 42.63 12.22 53.51 34.27<br />
20 Koppal 11.00 42.70 46.30<br />
21 Mandya 9.71 49.72 40.58 11.20 61.14 27.66<br />
22 Mysore 10.47 50.00 39.53 10.52 59.73 29.75<br />
23 Raichur 12.16 41.68 46.16 11.09 42.53 46.38<br />
24 Shimoga 9.13 47.17 43.70 9.89 59.71 30.41<br />
25 Tumkur 11.94 49.30 38.76 12.61 58.16 29.23<br />
26 Udupi 10.71 46.70 42.58<br />
27 Uttara Kannada 13.01 42.17 44.82 12.22 52.25 35.52<br />
<strong>Karnataka</strong> 10.79 44.59 44.62 10.93 51.98 37.10<br />
Note: The information pertaining to Census 1991 relates to undivided 20 distircts.<br />
Source: Primary Census Abstract (H-Series) - 1991 and 2001.<br />
466
<strong>Karnataka</strong> <strong>Human</strong> <strong>Development</strong> <strong>Report</strong> <strong>2005</strong><br />
9. Housing and Amenities<br />
District<br />
Percentage distribution of households by size of households (urban)<br />
1991 2001<br />
1-2 members 3-5 members more than 6 1-2 members 3-5 members more than 6<br />
1 74 75 76 77 78 79<br />
1 Bagalkot 12.03 47.09 40.88<br />
2 Bangalore Rural 11.19 46.72 42.09 11.64 58.51 29.85<br />
3 Bangalore Urban 11.72 54.90 33.38 13.94 64.88 21.18<br />
4 Belgaum 12.55 47.26 40.18 11.75 55.63 32.62<br />
5 Bellary 11.05 44.26 44.69 10.80 51.91 37.29<br />
6 Bidar 9.16 34.31 56.53 7.77 40.64 51.59<br />
7 Bijapur 12.66 40.18 47.15 10.42 47.80 41.78<br />
8 Chamarajnagar 11.74 58.60 29.66<br />
9 Chikmaglur 13.31 50.61 36.09 12.50 64.01 23.48<br />
10 Chitradurga 10.29 46.33 43.39 10.15 58.29 31.55<br />
11 Dakshina Kannada 11.84 45.46 42.70 13.50 56.11 30.39<br />
12 Davangere 9.72 56.14 34.14<br />
13 Dharwad 11.13 43.05 45.82 11.00 54.21 34.79<br />
14 Gadag 11.98 49.69 38.33<br />
15 Gulbarga 11.02 38.92 50.06 9.93 42.57 47.50<br />
16 Hassan 12.06 49.14 38.80 10.99 63.91 25.11<br />
17 Haveri 9.93 49.13 40.93<br />
18 Kodagu 18.15 55.42 26.43 16.97 65.19 17.83<br />
19 Kolar 10.43 44.76 44.82 11.05 56.57 32.38<br />
20 Koppal 11.28 46.77 41.95<br />
21 Mandya 11.86 50.66 37.48 11.72 62.24 26.04<br />
22 Mysore 11.49 50.45 38.06 11.88 62.38 25.74<br />
23 Raichur 12.61 42.79 44.60 11.22 46.66 42.11<br />
24 Shimoga 11.37 51.04 37.59 11.72 62.78 25.51<br />
25 Tumkur 12.68 51.08 36.25 12.42 62.59 24.99<br />
26 Udupi 13.03 55.16 31.81<br />
27 Uttara Kannada 14.27 46.72 39.01 14.51 55.62 29.87<br />
<strong>Karnataka</strong> 11.72 48.71 39.58 12.35 58.55 29.10<br />
Note: The information pertaining to Census 1991 relates to undivided 20 distircts.<br />
Source: Primary Census Abstract (H-Series) - 1991 and 2001.<br />
467
Appendix: Statistical Tables<br />
9. Housing and Amenities<br />
District<br />
Percentage distribution of households by tenure status<br />
Total<br />
1991 2001<br />
Owned Rented Others Owned Rented Others<br />
1 80 81 82 83 84 85<br />
1 Bagalkot 82.96 13.58 3.46<br />
2 Bangalore Rural 87.40 11.26 1.34 84.40 13.92 1.68<br />
3 Bangalore Urban 47.52 50.00 2.48 45.69 50.73 3.58<br />
4 Belgaum 84.54 13.46 2.01 85.02 12.55 2.43<br />
5 Bellary 83.32 14.24 2.44 80.56 16.56 2.88<br />
6 Bidar 91.24 7.39 1.38 90.19 8.58 1.23<br />
7 Bijapur 85.27 12.70 2.02 85.79 11.37 2.83<br />
8 Chamarajnagar 90.94 7.32 1.74<br />
9 Chikmaglur 77.77 15.47 6.76 78.10 14.35 7.55<br />
10 Chitradurga 82.76 15.47 1.77 87.61 11.20 1.19<br />
11 Dakshina Kannada 85.92 11.36 2.71 85.58 11.55 2.88<br />
12 Davangere 80.45 17.04 2.51<br />
13 Dharwad 80.84 16.80 2.36 75.29 21.56 3.15<br />
14 Gadag 83.16 13.87 2.97<br />
15 Gulbarga 84.13 13.46 2.41 84.47 13.62 1.91<br />
16 Hassan 86.23 11.61 2.16 85.51 11.95 2.55<br />
17 Haveri 87.55 10.22 2.23<br />
18 Kodagu 62.84 20.22 16.94 65.60 14.22 20.18<br />
19 Kolar 83.62 15.25 1.13 83.18 15.37 1.45<br />
20 Koppal 84.60 12.47 2.93<br />
21 Mandya 88.04 10.53 1.43 87.49 10.53 1.99<br />
22 Mysore 83.29 14.89 1.83 79.71 17.39 2.90<br />
23 Raichur 84.91 12.24 2.85 84.12 12.10 3.77<br />
24 Shimoga 80.61 17.74 1.66 78.11 19.28 2.61<br />
25 Tumkur 87.38 11.62 1.00 85.49 12.88 1.63<br />
26 Udupi 90.42 7.37 2.21<br />
27 Uttara Kannada 84.07 13.34 2.59 84.38 12.55 3.07<br />
<strong>Karnataka</strong> 79.83 17.83 2.34 78.46 18.66 2.88<br />
Note: The information pertaining to Census 1991 relates to undivided 20 distircts.<br />
Source: Primary Census Abstract (H-Series) - 1991 and 2001.<br />
468
<strong>Karnataka</strong> <strong>Human</strong> <strong>Development</strong> <strong>Report</strong> <strong>2005</strong><br />
9. Housing and Amenities<br />
District<br />
Percentage distribution of households by tenure status (rural)<br />
1991 2001<br />
Owned Rented Others Owned Rented Others<br />
1 86 87 88 89 90 91<br />
1 Bagalkot 89.13 7.94 2.94<br />
2 Bangalore Rural 93.50 5.32 1.18 91.68 6.82 1.50<br />
3 Bangalore Urban 78.27 18.23 3.50 69.01 26.77 4.22<br />
4 Belgaum 91.77 6.19 2.05 91.24 6.41 2.35<br />
5 Bellary 91.40 6.24 2.36 90.54 7.16 2.30<br />
6 Bidar 95.59 3.11 1.30 95.68 3.22 1.10<br />
7 Bijapur 91.37 6.98 1.65 91.34 6.22 2.44<br />
8 Chamarajnagar 94.58 3.75 1.66<br />
9 Chikmaglur 83.56 8.61 7.82 84.28 7.13 8.59<br />
10 Chitradurga 92.73 5.47 1.80 93.68 5.14 1.17<br />
11 Dakshina Kannada 91.79 5.10 3.12 93.24 3.78 2.97<br />
12 Davangere 91.89 5.90 2.21<br />
13 Dharwad 91.76 6.03 2.21 92.17 4.91 2.92<br />
14 Gadag 90.73 7.08 2.19<br />
15 Gulbarga 92.54 5.42 2.04 93.47 4.80 1.73<br />
16 Hassan 93.31 4.39 2.29 92.61 5.04 2.35<br />
17 Haveri 92.55 5.38 2.07<br />
18 Kodagu 66.55 14.08 19.37 68.27 9.49 22.24<br />
19 Kolar 94.32 4.60 1.08 94.03 4.77 1.21<br />
20 Koppal 89.03 8.39 2.58<br />
21 Mandya 93.67 5.04 1.29 93.05 5.12 1.83<br />
22 Mysore 94.69 3.69 1.61 94.26 4.34 1.39<br />
23 Raichur 90.91 6.14 2.95 92.14 4.65 3.21<br />
24 Shimoga 91.92 6.40 1.68 91.36 6.59 2.04<br />
25 Tumkur 93.63 5.46 0.92 92.54 6.04 1.42<br />
26 Udupi 92.84 4.90 2.26<br />
27 Uttara Kannada 91.06 6.05 2.89 90.45 6.24 3.32<br />
<strong>Karnataka</strong> 91.64 5.97 2.39 91.16 6.23 2.61<br />
Note: The information pertaining to Census 1991 relates to undivided 20 distircts.<br />
Source: Primary Census Abstract (H-Series) - 1991 and 2001.<br />
469
Appendix: Statistical Tables<br />
9. Housing and Amenities<br />
District<br />
Percentage distribution of households by tenure status (urban)<br />
1991 2001<br />
Owned Rented Others Owned Rented Others<br />
1 92 93 94 95 96 97<br />
1 Bagalkot 67.82 27.43 4.75<br />
2 Bangalore Rural 59.32 38.58 2.10 57.08 40.56 2.36<br />
3 Bangalore Urban 42.64 55.04 2.32 42.64 53.86 3.50<br />
4 Belgaum 60.62 37.52 1.87 65.43 31.88 2.69<br />
5 Bellary 64.69 32.70 2.62 62.56 33.52 3.91<br />
6 Bidar 69.52 28.72 1.76 69.26 29.01 1.74<br />
7 Bijapur 64.92 31.81 3.27 65.77 29.98 4.25<br />
8 Chamarajnagar 69.86 27.95 2.19<br />
9 Chikmaglur 49.18 49.33 1.49 52.82 43.89 3.29<br />
10 Chitradurga 54.99 43.33 1.69 60.61 38.10 1.28<br />
11 Dakshina Kannada 71.01 27.29 1.69 73.78 23.49 2.73<br />
12 Davangere 54.51 42.27 3.21<br />
13 Dharwad 60.09 37.26 2.65 61.66 35.00 3.34<br />
14 Gadag 68.81 26.75 4.44<br />
15 Gulbarga 55.12 41.18 3.70 58.72 38.86 2.42<br />
16 Hassan 52.53 45.95 1.52 52.51 44.02 3.47<br />
17 Haveri 67.55 29.57 2.88<br />
18 Kodagu 42.36 54.12 3.52 48.52 44.52 6.96<br />
19 Kolar 47.63 51.08 1.29 49.98 47.82 2.20<br />
20 Koppal 63.00 32.40 4.60<br />
21 Mandya 59.61 38.24 2.16 58.01 39.18 2.81<br />
22 Mysore 55.23 42.41 2.36 55.50 39.08 5.41<br />
23 Raichur 62.08 35.44 2.48 60.68 33.91 5.41<br />
24 Shimoga 50.95 47.45 1.60 53.96 42.40 3.64<br />
25 Tumkur 55.10 43.45 1.44 56.33 41.18 2.49<br />
26 Udupi 80.02 17.98 2.00<br />
27 Uttara Kannada 62.82 35.51 1.67 69.59 27.94 2.47<br />
<strong>Karnataka</strong> 53.60 44.16 2.24 54.62 41.98 3.39<br />
Note: The information pertaining to Census 1991 relates to undivided 20 distircts.<br />
Source: Primary Census Abstract (H-Series) - 1991 and 2001.<br />
470
<strong>Karnataka</strong> <strong>Human</strong> <strong>Development</strong> <strong>Report</strong> <strong>2005</strong><br />
9. Housing and Amenities<br />
District<br />
Percentage of households having access to<br />
Safe drinking water<br />
1991 2001<br />
Total Rural Urban Total Rural Urban<br />
1 98 99 100 101 102 103<br />
1 Bagalkot 86.11 82.90 94.00<br />
2 Bangalore Rural 86.51 85.96 89.04 97.48 97.49 97.41<br />
3 Bangalore Urban 81.97 88.57 80.92 96.24 97.73 96.04<br />
4 Belgaum 64.23 60.70 75.92 75.31 71.90 86.03<br />
5 Bellary 84.21 82.00 89.29 94.40 92.47 97.87<br />
6 Bidar 60.47 59.72 64.16 79.70 82.12 70.49<br />
7 Bijapur 73.30 69.13 87.25 80.31 77.15 91.71<br />
8 Chamarajnagar 93.26 92.15 99.65<br />
9 Chikmaglur 69.46 64.63 93.31 82.79 79.13 97.74<br />
10 Chitradurga 88.11 86.35 93.00 98.29 97.99 99.63<br />
11 Dakshina Kannadat 20.01 11.78 40.90 38.96 24.54 61.13<br />
12 Davangere 96.09 95.48 97.46<br />
13 Dharwad 81.51 78.01 88.14 86.62 76.38 94.90<br />
14 Gadag 87.53 83.07 95.98<br />
15 Gulbarga 62.99 56.68 84.78 81.13 76.47 94.47<br />
16 Hassan 79.53 76.82 92.43 93.17 92.01 98.55<br />
17 Haveri 97.49 97.87 95.97<br />
18 Kodagu 44.83 37.76 83.88 54.78 49.70 87.34<br />
19 Kolar 89.78 90.44 87.58 97.23 97.45 96.56<br />
20 Koppal 92.75 91.72 97.80<br />
21 Mandya 71.16 69.55 79.27 93.26 92.74 96.04<br />
22 Mysore 82.70 79.80 89.83 95.27 93.20 98.70<br />
23 Raichur 65.41 60.52 83.99 79.08 73.36 95.82<br />
24 Shimoga 66.25 58.87 85.61 73.41 63.55 91.37<br />
25 Tumkur 80.79 79.53 87.32 97.00 96.57 98.80<br />
26 Udupi 19.69 16.92 31.61<br />
27 Uttara Kannada 30.20 24.14 48.64 34.52 28.72 48.69<br />
<strong>Karnataka</strong> 71.68 67.31 81.38 84.85 80.95 92.18<br />
Note: The information pertaining to Census 1991 relates to undivided 20 distircts.<br />
Source: Primary Census Abstract (H-Series) - 1991 and 2001.<br />
471
Appendix: Statistical Tables<br />
9. Housing and Amenities<br />
District<br />
Percentage of households having access to<br />
Electricity<br />
1991 2001<br />
Total Rural Urban Total Rural Urban<br />
1 104 105 106 107 108 109<br />
1 Bagalkot 69.50 65.24 79.95<br />
2 Bangalore Rural 55.86 51.38 76.46 85.95 84.55 91.22<br />
3 Bangalore Urban 79.40 63.97 81.84 94.53 88.65 95.30<br />
4 Belgaum 59.37 51.95 83.88 77.56 73.58 90.07<br />
5 Bellary 41.23 32.69 60.90 72.97 66.62 84.44<br />
6 Bidar 39.92 33.65 71.24 73.10 69.22 87.88<br />
7 Bijapur 41.19 32.96 68.70 65.64 60.35 84.75<br />
8 Chamarajnagar 64.48 61.48 81.89<br />
9 Chikmaglur 50.67 44.72 80.03 76.57 73.62 88.62<br />
10 Chitradurga 53.68 46.54 73.56 78.29 76.22 87.49<br />
11 Dakshina Kannadat 43.75 31.55 74.73 71.45 58.65 91.11<br />
12 Davangere 81.62 78.05 89.72<br />
13 Dharwad 54.81 46.65 70.31 82.54 79.58 84.93<br />
14 Gadag 78.72 78.04 80.01<br />
15 Gulbarga 35.91 25.85 70.64 67.56 60.40 88.03<br />
16 Hassan 54.70 49.26 80.59 83.52 81.53 92.78<br />
17 Haveri 75.34 73.47 82.84<br />
18 Kodagu 36.28 29.08 76.04 61.23 56.86 89.18<br />
19 Kolar 57.96 50.76 82.20 85.72 83.30 93.12<br />
20 Koppal 67.11 65.24 76.24<br />
21 Mandya 51.68 48.17 69.43 78.69 77.66 84.12<br />
22 Mysore 48.27 36.76 76.57 78.45 69.88 92.71<br />
23 Raichur 32.51 26.47 55.48 64.32 59.31 78.98<br />
24 Shimoga 53.89 45.45 76.02 78.25 71.75 90.11<br />
25 Tumkur 53.01 47.57 81.08 79.92 77.29 90.78<br />
26 Udupi 69.73 64.88 90.59<br />
27 Uttara Kannada 53.33 45.39 77.49 80.53 76.36 90.71<br />
<strong>Karnataka</strong> 52.47 41.75 76.27 78.55 72.16 90.53<br />
Note: The information pertaining to Census 1991 relates to undivided 20 distircts.<br />
Source: Primary Census Abstract (H-Series) - 1991 and 2001.<br />
472
<strong>Karnataka</strong> <strong>Human</strong> <strong>Development</strong> <strong>Report</strong> <strong>2005</strong><br />
9. Housing and Amenities<br />
District<br />
Percentage of households having access to<br />
Toilet<br />
1991 2001<br />
Total Rural Urban Total Rural Urban<br />
1 110 111 112 113 114 115<br />
1 Bagalkot 13.56 5.38 33.66<br />
2 Bangalore Rural 16.79 6.02 66.32 33.79 20.66 83.05<br />
3 Bangalore Urban 72.87 18.82 81.44 85.28 40.98 91.07<br />
4 Belgaum 14.37 4.25 47.85 21.67 10.12 58.03<br />
5 Bellary 12.92 3.34 34.98 27.18 12.51 53.65<br />
6 Bidar 10.28 2.66 48.37 19.44 8.19 62.31<br />
7 Bijapur 6.95 1.34 25.69 11.99 3.35 43.20<br />
8 Chamarajnagar 18.11 11.48 56.50<br />
9 Chikmaglur 23.15 14.34 66.65 42.02 32.85 79.53<br />
10 Chitradurga 16.97 4.47 51.80 21.10 11.14 65.35<br />
11 Dakshina Kannadat 34.06 20.12 69.47 62.52 47.21 86.05<br />
12 Davangere 33.53 18.85 66.77<br />
13 Dharwad 21.63 8.28 47.01 45.48 15.55 69.66<br />
14 Gadag 16.20 7.05 33.53<br />
15 Gulbarga 12.16 2.17 46.66 18.62 5.15 57.16<br />
16 Hassan 16.06 5.75 65.10 27.77 16.68 79.29<br />
17 Haveri 26.37 17.60 61.50<br />
18 Kodagu 32.12 24.90 72.00 52.06 48.54 74.60<br />
19 Kolar 19.82 7.05 62.79 33.35 19.82 74.76<br />
20 Koppal 13.79 8.52 39.46<br />
21 Mandya 14.27 6.18 55.09 25.41 16.31 73.68<br />
22 Mysore 24.88 5.30 72.99 44.13 16.72 89.71<br />
23 Raichur 7.31 1.92 27.81 15.51 6.12 42.98<br />
24 Shimoga 25.52 10.07 66.02 48.19 33.01 75.84<br />
25 Tumkur 13.99 4.27 64.17 26.00 13.91 76.00<br />
26 Udupi 56.29 49.88 83.89<br />
27 Uttara Kannada 22.80 11.92 55.90 34.59 22.49 64.09<br />
<strong>Karnataka</strong> 24.13 6.85 62.52 37.50 17.40 75.23<br />
Note: The information pertaining to Census 1991 relates to undivided 20 distircts.<br />
Source: Primary Census Abstract (H-Series) - 1991 and 2001.<br />
473
Appendix: Statistical Tables<br />
9. Housing and Amenities<br />
District<br />
Percentage of households having access to<br />
All 3 facilities<br />
1991 2001<br />
Total Rural Urban Total Rural Urban<br />
1 116 117 118 119 120 121<br />
1 Bagalkot 12.09 4.05 31.85<br />
2 Bangalore Rural 13.32 4.29 54.86 31.78 19.20 79.00<br />
3 Bangalore Urban 55.76 14.96 62.24 82.88 38.81 88.65<br />
4 Belgaum 10.90 2.89 37.39 20.74 9.35 56.61<br />
5 Bellary 11.28 2.59 31.31 24.76 10.07 51.26<br />
6 Bidar 6.30 1.31 31.22 17.27 6.37 58.80<br />
7 Bijapur 5.70 0.83 21.96 11.00 2.53 41.56<br />
8 Chamarajnagar 15.52 9.10 52.69<br />
9 Chikmaglur 17.44 8.93 59.48 38.41 29.12 76.41<br />
10 Chitradurga 14.58 3.27 46.05 19.66 10.03 62.48<br />
11 Dakshina Kannadat 9.60 2.01 28.90 55.63 38.04 82.68<br />
12 Davangere 31.87 17.28 64.93<br />
13 Dharwad 17.93 6.32 39.98 43.00 14.10 66.33<br />
14 Gadag 14.89 5.93 31.87<br />
15 Gulbarga 10.15 1.32 40.66 16.96 3.74 54.79<br />
16 Hassan 13.49 3.97 58.80 26.24 15.28 77.17<br />
17 Haveri 24.00 15.65 57.43<br />
18 Kodagu 15.29 7.65 57.52 40.32 35.75 69.58<br />
19 Kolar 16.35 5.52 52.81 31.39 18.00 72.37<br />
20 Koppal 12.14 7.00 37.21<br />
21 Mandya 9.80 3.65 40.79 23.30 14.74 68.66<br />
22 Mysore 20.05 3.61 60.46 41.28 14.27 86.20<br />
23 Raichur 6.05 1.19 24.50 13.89 4.75 40.64<br />
24 Shimoga 19.18 5.38 55.34 45.07 29.55 73.36<br />
25 Tumkur 11.50 3.05 55.15 24.24 12.35 73.39<br />
26 Udupi 51.26 44.44 80.62<br />
27 Uttara Kannada 8.74 2.76 26.92 33.46 21.37 62.94<br />
<strong>Karnataka</strong> 17.63 3.69 48.59 35.18 15.22 72.64<br />
Note: The information pertaining to Census 1991 relates to undivided 20 distircts.<br />
Source: Primary Census Abstract (H-Series) - 1991 and 2001.<br />
474
<strong>Karnataka</strong> <strong>Human</strong> <strong>Development</strong> <strong>Report</strong> <strong>2005</strong><br />
9. Housing and Amenities<br />
District<br />
Percentage of households having access to<br />
None of the 3 facilities<br />
1991 2001<br />
Total Rural Urban Total Rural Urban<br />
1 122 123 124 125 126 127<br />
1 Bagalkot 29.03 33.42 18.24<br />
2 Bangalore Rural 5.73 6.51 2.12 12.04 13.99 4.72<br />
3 Bangalore Urban 2.88 4.30 2.65 3.07 9.18 2.28<br />
4 Belgaum 17.92 21.83 5.02 21.52 25.66 8.50<br />
5 Bellary 10.07 12.25 5.06 24.61 30.95 13.17<br />
6 Bidar 23.25 25.60 11.55 24.73 28.96 8.60<br />
7 Bijapur 17.18 21.16 3.87 33.36 38.84 13.61<br />
8 Chamarajnagar 32.93 36.14 14.29<br />
9 Chikmaglur 18.86 22.51 0.82 19.82 22.65 8.26<br />
10 Chitradurga 5.34 6.78 1.32 20.28 22.67 9.65<br />
11 Dakshina Kannadat 45.53 58.06 13.68 21.67 32.18 5.51<br />
12 Davangere 16.73 20.38 8.44<br />
13 Dharwad 8.80 11.58 3.53 14.97 18.97 11.74<br />
14 Gadag 19.97 20.84 18.32<br />
15 Gulbarga 26.47 32.55 5.45 30.78 38.18 9.60<br />
16 Hassan 10.30 12.11 1.67 14.94 17.06 5.10<br />
17 Haveri 22.29 24.58 13.09<br />
18 Kodagu 35.67 41.46 3.70 27.03 30.35 5.80<br />
19 Kolar 3.99 4.62 1.87 12.32 14.88 4.49<br />
20 Koppal 31.24 33.24 21.51<br />
21 Mandya 12.38 13.74 5.51 19.20 20.77 10.87<br />
22 Mysore 9.24 12.15 2.10 18.70 27.67 3.78<br />
23 Raichur 25.11 29.29 9.24 34.06 39.32 18.68<br />
24 Shimoga 18.35 23.98 3.60 18.63 24.79 7.42<br />
25 Tumkur 9.29 10.62 2.41 18.32 21.15 6.61<br />
26 Udupi 25.25 29.69 6.13<br />
27 Uttara Kannada 33.55 41.00 10.88 18.34 22.53 8.14<br />
<strong>Karnataka</strong> 15.03 19.93 4.13 19.13 25.66 6.88<br />
Note: The information pertaining to Census 1991 relates to undivided 20 distircts.<br />
Source: Primary Census Abstract (H-Series) - 1991 and 2001.<br />
475
Appendix: Statistical Tables<br />
9. Housing and Amenities<br />
District<br />
No. of<br />
households<br />
Percentage of households by location of drinking water<br />
2001<br />
Within the premises Outside the premises Away from premises<br />
Total Rural Urban Total Rural Urban Total Rural Urban<br />
1 128 129 130 131 132 133 134 135 136 137<br />
1 Bagalkot 293347 21 15 36 52 57 40 27 28 24<br />
2 Bangalore Rural 1418289 61 20 66 28 59 24 11 21 10<br />
3 Bangalore Urban 383592 19 13 42 60 65 44 21 23 15<br />
4 Belgaum 761914 26 16 56 49 55 29 25 29 15<br />
5 Bellary 268360 21 12 36 50 56 39 29 31 25<br />
6 Bidar 247350 25 18 55 45 50 26 30 33 19<br />
7 Bijapur 323275 18 10 48 49 54 30 33 36 22<br />
8 Chamarajnagar 202913 22 19 44 58 61 41 20 21 14<br />
9 Chikmaglur 239728 26 21 47 52 55 41 22 24 12<br />
10 Chitradurga 294724 17 13 37 62 65 47 21 22 16<br />
11 Dakshina Kannada 349695 61 54 70 27 31 21 12 15 9<br />
12 Davangere 333888 20 12 37 58 64 44 22 24 19<br />
13 Dharwad 289789 41 17 60 38 55 24 21 28 16<br />
14 Gadag 180351 21 14 34 51 55 44 28 31 22<br />
15 Gulbarga 542937 20 10 41 45 49 33 36 41 21<br />
16 Hassan 360089 23 17 55 59 64 36 17 19 9<br />
17 Haveri 255761 18 14 38 53 59 33 28 28 30<br />
18 Kodagu 124098 35 31 63 44 46 27 21 23 10<br />
19 Kolar 499535 21 12 48 53 59 35 25 28 17<br />
20 Koppal 210649 14 11 27 57 59 47 29 30 26<br />
21 Mandya 368794 27 21 57 60 64 34 13 14 9<br />
22 Mysore 535927 42 25 71 44 56 22 14 19 7<br />
23 Raichur 298100 15 9 33 46 48 40 39 43 27<br />
24 Shimoga 330832 34 23 54 46 53 34 20 24 12<br />
25 Tumkur 545493 19 13 47 59 64 42 21 24 12<br />
26 Udupi 206222 59 56 73 23 25 16 17 19 11<br />
27 Uttara Kannada 266481 49 42 67 32 37 22 18 21 12<br />
<strong>Karnataka</strong> 10232000 31.7 18.5 56.5 46.4 55.4 29.6 21.8 26.1 13.8<br />
Source: Census of India 2001, Housing Profi le, <strong>Karnataka</strong>, Table: H 8.<br />
476
<strong>Karnataka</strong> <strong>Human</strong> <strong>Development</strong> <strong>Report</strong> <strong>2005</strong><br />
9. Housing and Amenities<br />
District<br />
Percentage of households by source of drinking water<br />
2001<br />
Tap Handpump Tube well Well Others<br />
Total Rural Urban Total Rural Urban Total Rural Urban Total Rural Urban Total Rural Urban<br />
1 138 139 140 141 142 143 144 145 146 147 148 149 150 151 152<br />
1 Bagalkot 54 48 69 22 24 19 10 11 6 10 13 3 4 4 3<br />
2 Bangalore Rural 78 63 80 5 13 4 13 21 12 3 2 3 1 1 1<br />
3 Bangalore Urban 70 65 87 17 20 5 10 12 5 2 2 2 1 1 1<br />
4 Belgaum 49 42 73 17 20 7 8 9 6 21 23 12 4 5 2<br />
5 Bellary 76 70 88 12 15 6 5 7 3 3 4 1 4 5 2<br />
6 Bidar 52 50 59 21 25 7 7 7 5 18 16 26 2 2 4<br />
7 Bijapur 38 29 68 36 42 16 6 6 8 17 20 7 2 3 2<br />
8 Chamarajnagar 47 40 87 40 46 11 6 7 2 6 7 N 1 1 N<br />
9 Chikmaglur 55 48 84 19 22 8 7 8 6 11 14 2 7 8 N<br />
10 Chitradurga 59 52 87 28 33 5 11 12 7 1 2 N N N N<br />
11 Dakshina Kannadat 31 14 57 2 3 2 5 7 3 57 70 38 4 7 1<br />
12 Davangere 67 62 79 18 23 8 11 10 11 3 4 N 1 1 2<br />
13 Dharwad 73 59 85 8 10 5 6 7 4 2 4 1 11 20 4<br />
14 Gadag 71 61 89 12 16 5 4 6 1 5 7 2 7 10 2<br />
15 Gulbarga 46 37 71 29 34 14 7 6 9 16 20 4 3 4 2<br />
16 Hassan 55 47 88 29 34 7 9 11 4 5 6 1 2 2 1<br />
17 Haveri 70 69 75 16 18 10 11 12 10 1 1 1 2 2 3<br />
18 Kodagu 34 27 80 9 10 3 10 11 4 37 42 12 9 11 1<br />
19 Kolar 71 66 86 13 15 5 13 16 6 2 2 2 1 N 2<br />
20 Koppal 61 57 78 25 28 13 6 6 6 4 5 1 3 4 2<br />
21 Mandya 66 63 85 22 24 8 6 6 3 6 6 4 1 1 N<br />
22 Mysore 71 59 91 18 26 5 6 8 3 3 5 N 2 2 1<br />
23 Raichur 52 41 84 18 21 8 7 8 4 11 14 2 13 16 2<br />
24 Shimoga 58 43 84 10 13 4 5 6 3 23 32 8 4 6 1<br />
25 Tumkur 55 48 86 30 36 6 12 13 7 3 3 1 1 N 1<br />
26 Udupi 13 10 24 3 3 4 4 4 4 77 80 68 3 4 N<br />
27 Uttara Kannada 25 17 43 7 8 4 2 3 2 61 65 51 6 8 1<br />
<strong>Karnataka</strong> 58.9 48.5 78.4 17.1 22.9 6.2 8.6 9.1 7.5 12.4 15.6 6.5 3.0 3.9 1.4<br />
Note: N - Neglible<br />
Source: Census of India 2001, Housing Profi le, <strong>Karnataka</strong>, Table: H 8.<br />
477
Appendix: Statistical Tables<br />
9. Housing and Amenities<br />
District<br />
District-wise distribution of households by latrines<br />
2001<br />
No. of households Availability Non-availability<br />
Total Rural Urban Total Rural Urban Total Rural Urban<br />
1 153 154 155 156 157 158 159 160 161<br />
1 Bagalkot 293347 208499 84848 13.6 5.4 33.7 86.4 94.6 66.3<br />
2 Bangalore Rural 1418289 302905 80687 33.8 20.7 83.1 66.2 79.3 16.9<br />
3 Bangalore Urban 383592 163932 1254357 85.3 41.0 91.1 14.7 59.0 8.9<br />
4 Belgaum 761914 578259 183655 21.7 10.1 58.0 78.3 89.9 42.0<br />
5 Bellary 268360 237028 131332 27.2 12.5 53.7 72.8 87.5 46.3<br />
6 Bidar 247350 195936 51414 19.4 8.2 62.3 80.6 91.8 37.7<br />
7 Bijapur 323275 253138 70137 12.0 3.3 43.2 88.0 96.7 56.8<br />
8 Chamarajnagar 202913 173032 29881 18.1 11.5 56.5 81.9 88.5 43.5<br />
9 Chikmaglur 239728 192629 47099 42.0 32.9 79.5 58.0 67.1 20.5<br />
10 Chitradurga 294724 240594 54130 21.1 11.1 65.3 78.9 88.9 34.7<br />
11 Dakshina Kannadat 349695 211879 137816 62.5 47.2 86.1 37.5 52.8 13.9<br />
12 Davangere 333888 231641 102247 33.5 18.9 66.8 66.5 81.1 33.2<br />
13 Dharwad 289789 129465 160324 45.5 15.5 69.7 54.5 84.5 30.3<br />
14 Gadag 180351 118054 62297 16.2 7.0 33.5 83.8 93.0 66.5<br />
15 Gulbarga 542937 402306 140631 18.6 5.1 57.2 81.4 94.9 42.8<br />
16 Hassan 360089 296318 63771 27.8 16.7 79.3 72.2 83.3 20.7<br />
17 Haveri 255761 204645 51116 26.4 17.6 61.5 73.6 82.4 38.5<br />
18 Kodagu 124098 107331 16767 52.1 48.5 74.6 47.9 51.5 25.4<br />
19 Kolar 499535 376491 123044 33.4 19.8 74.8 66.6 80.2 25.2<br />
20 Koppal 210649 174796 35853 13.8 8.5 39.5 86.2 91.5 60.5<br />
21 Mandya 368794 310296 58498 25.4 16.3 73.7 74.6 83.7 26.3<br />
22 Mysore 535927 334632 201295 44.1 16.7 89.7 55.9 83.3 10.3<br />
23 Raichur 298100 222168 75932 15.5 6.1 43.0 84.5 93.9 57.0<br />
24 Shimoga 330832 213611 117221 48.2 33.0 75.8 51.8 67.0 24.2<br />
25 Tumkur 545493 439243 106250 26.0 13.9 76.0 74.0 86.1 24.0<br />
26 Udupi 206222 167361 38861 56.3 49.9 83.9 43.7 50.1 16.1<br />
27 Uttara Kannada 266481 188984 77497 34.6 22.5 64.1 65.4 77.5 35.9<br />
<strong>Karnataka</strong> 10232133 6675173 3556960 37.5 17.4 75.2 62.5 82.6 24.8<br />
Source: Census of India 2001, Housing Profi le, <strong>Karnataka</strong>, Table: H 8.<br />
478
<strong>Karnataka</strong> <strong>Human</strong> <strong>Development</strong> <strong>Report</strong> <strong>2005</strong><br />
10. Profile of Scheduled Castes and Scheduled Tribes<br />
District<br />
Scheduled Caste population<br />
1991 2001<br />
Male Female Total Male Female Total<br />
1 2 3 4 5 6 7<br />
1 Bagalkot 107690 110124 217814 124009 126595 250604<br />
2 Bangalore Rural 167087 159512 326599 191831 185848 377679<br />
3 Bangalore Urban 367478 344297 711775 435162 415885 851047<br />
4 Belgaum 206526 200429 406955 233431 228589 462020<br />
5 Bellary 156944 154308 311252 188536 185682 374218<br />
6 Bidar 133099 126934 260033 153649 145163 298812<br />
7 Bijapur 150078 141970 292048 171108 163146 334254<br />
8 Chamarajnagar 106504 99637 206141 121434 116190 237624<br />
9 Chikmaglur 99513 96339 195852 116796 116338 233134<br />
10 Chitradurga 147160 138461 285621 172092 164395 336487<br />
11 Dakshina Kannada 59336 57628 116964 65818 65342 131160<br />
12 Davangere 155375 146969 302344 170365 162862 333227<br />
13 Dharwad 63778 60867 124645 67007 64962 131969<br />
14 Gadag 60186 58664 118850 69796 67618 137414<br />
15 Gulbarga 312677 297964 610641 365974 351621 717595<br />
16 Hassan 137293 136086 273379 155409 156317 311726<br />
17 Haveri 86308 80696 167004 90108 85252 175360<br />
18 Kodagu 29723 29286 59009 33384 34038 67422<br />
19 Kolar 288366 282034 570400 338459 333233 671692<br />
20 Koppal 74581 74194 148775 92736 92473 185209<br />
21 Mandya 115296 111330 226626 123695 123518 247213<br />
22 Mysore 200054 191726 391780 237476 230164 467640<br />
23 Raichur 125264 123884 249148 159340 157936 317276<br />
24 Shimoga 121274 115252 236526 136299 133220 269519<br />
25 Tumkur 208911 199613 408524 241177 232867 474044<br />
26 Udupi 28956 29628 58584 33345 34344 67689<br />
27 Uttara Kannada 46612 45378 91990 51309 50587 101896<br />
<strong>Karnataka</strong> 3756069 3613210 7369279 4339745 4224185 8563930<br />
Sources:<br />
1. Col. 2-4: Computed based on taluk-wise data of Primary Census Abstract 1991.<br />
2. Col. 5-7: Primary Census Abstract 2001.<br />
479
Appendix: Statistical Tables<br />
10. Profile of Scheduled Castes and Scheduled Tribes<br />
District Decadal growth rate of SC population (%) Percentage of SC population to total<br />
population of the district<br />
1991-2001 1991 2001<br />
Male Female Total<br />
1 8 9 10 11 12<br />
1 Bagalkot 15.2 15.0 15.1 15.7 15.2<br />
2 Bangalore Rural 14.8 16.5 15.6 19.5 20.1<br />
3 Bangalore Urban 18.4 20.8 19.6 14.7 13.0<br />
4 Belgaum 13.0 14.1 13.5 11.4 11.0<br />
5 Bellary 20.1 20.3 20.2 18.8 18.5<br />
6 Bidar 15.4 14.4 14.9 20.7 19.9<br />
7 Bijapur 14.0 14.9 14.5 19.0 18.5<br />
8 Chamarajnagar 14.0 16.6 15.3 23.3 24.6<br />
9 Chikmaglur 17.4 20.8 19.0 19.3 20.5<br />
10 Chitradurga 16.9 18.7 17.8 21.8 22.3<br />
11 Dakshina Kannada 10.9 13.4 12.1 7.1 6.9<br />
12 Davangere 9.6 10.8 10.2 19.4 18.6<br />
13 Dharwad 5.1 6.7 5.9 9.1 8.2<br />
14 Gadag 16.0 15.3 15.6 13.8 14.1<br />
15 Gulbarga 17.0 18.0 17.5 23.6 23.0<br />
16 Hassan 13.2 14.9 14.0 17.4 18.1<br />
17 Haveri 4.4 5.6 5.0 13.2 12.2<br />
18 Kodagu 12.3 16.2 14.3 12.1 12.4<br />
19 Kolar 17.4 18.2 17.8 25.7 26.6<br />
20 Koppal 24.3 24.6 24.5 15.5 15.5<br />
21 Mandya 7.3 10.9 9.1 13.8 14.0<br />
22 Mysore 18.7 20.0 19.4 17.2 17.8<br />
23 Raichur 27.2 27.5 27.3 18.4 19.3<br />
24 Shimoga 12.4 15.6 13.9 16.3 16.4<br />
25 Tumkur 15.4 16.7 16.0 17.7 18.4<br />
26 Udupi 15.2 15.9 15.5 5.6 6.1<br />
27 Uttara Kannada 10.1 11.5 10.8 7.5 7.5<br />
<strong>Karnataka</strong> 15.5 16.9 16 .2 16.4 16.2<br />
Sources: Primary Census Abstract 2001.<br />
480
<strong>Karnataka</strong> <strong>Human</strong> <strong>Development</strong> <strong>Report</strong> <strong>2005</strong><br />
10. Profile of Scheduled Castes and Scheduled Tribes<br />
District<br />
Scheduled Tribe population<br />
1991 2001<br />
Male Female Total Male Female Total<br />
1 13 14 15 16 17 18<br />
1 Bagalkot 11165 11009 22174 40171 40010 80181<br />
2 Bangalore Rural 25475 23830 49305 31537 30018 61555<br />
3 Bangalore Urban 27938 25693 53631 44971 41047 86018<br />
4 Belgaum 42143 40933 83076 122979 120472 243451<br />
5 Bellary 74402 73467 147869 183662 180976 364638<br />
6 Bidar 53465 50750 104215 93455 88764 182219<br />
7 Bijapur 8997 8364 17361 15455 14596 30051<br />
8 Chamarajnagar 19670 19033 38703 53205 52906 106111<br />
9 Chikmaglur 13446 13088 26534 20570 20449 41019<br />
10 Chitradurga 113975 108788 222763 136194 130041 266235<br />
11 Dakshina Kannada 32659 32146 64805 31579 31357 62936<br />
12 Davangere 79895 75705 155600 106932 102769 209701<br />
13 Dharwad 12125 11271 23396 36234 34208 70442<br />
14 Gadag 10533 10001 20534 27739 26671 54410<br />
15 Gulbarga 54774 52161 106935 77926 76269 154195<br />
16 Hassan 8328 8253 16581 13297 13154 26451<br />
17 Haveri 31739 29430 61169 65498 61665 127163<br />
18 Kodagu 20552 19760 40312 23109 23006 46115<br />
19 Kolar 77796 75223 153019 104278 101433 205711<br />
20 Koppal 30435 29393 59828 70063 68525 138588<br />
21 Mandya 6129 5807 11936 8693 8500 17193<br />
22 Mysore 32197 31202 63399 136831 134520 271351<br />
23 Raichur 60439 60005 120444 152080 150962 303042<br />
24 Shimoga 16873 16075 32948 28435 27562 55997<br />
25 Tumkur 85858 81774 167632 98795 95024 193819<br />
26 Udupi 20515 20839 41354 20572 21041 41613<br />
27 Uttara Kannada 5221 4947 10168 11978 11803 23781<br />
<strong>Karnataka</strong> 976744 938947 1915691 1756238 1707748 3463986<br />
Source: Col. 13 to 15: Computed based on taluk-wise data of Primary Census Abstract 2001.<br />
481
Appendix: Statistical Tables<br />
10. Profile of Scheduled Castes and Scheduled Tribes<br />
District Decadal growth rate of ST population (%) Percentage of ST population to total<br />
population<br />
1991-2001 1991 2001<br />
Male Female Total<br />
1 19 20 21 22 23<br />
1 Bagalkot 259.8 263.4 261.6 1.6 4.9<br />
2 Bangalore Rural 23.8 26.0 24.8 2.9 3.3<br />
3 Bangalore Urban 61.0 59.8 60.4 1.1 1.3<br />
4 Belgaum 191.8 194.3 193.0 2.3 5.8<br />
5 Bellary 146.9 146.3 146.6 8.9 18.0<br />
6 Bidar 74.8 74.9 74.9 8.3 12.1<br />
7 Bijapur 71.8 74.5 73.1 1.1 1.7<br />
8 Chamarajnagar 170.5 178.0 174.2 4.4 11.0<br />
9 Chikmaglur 53.0 56.2 54.6 2.6 3.6<br />
10 Chitradurga 19.5 19.5 19.5 17.0 17.5<br />
11 Dakshina Kannada -3.3 -2.5 -2.9 3.9 3.3<br />
12 Davangere 33.8 35.8 34.8 10.0 11.7<br />
13 Dharwad 198.8 203.5 201.1 1.7 4.4<br />
14 Gadag 163.4 166.7 165.0 2.4 5.6<br />
15 Gulbarga 42.3 46.2 44.2 4.1 4.9<br />
16 Hassan 59.7 59.4 59.5 1.1 1.5<br />
17 Haveri 106.4 109.5 107.9 4.8 8.8<br />
18 Kodagu 12.4 16.4 14.4 8.3 8.4<br />
19 Kolar 34.0 34.8 34.4 6.9 8.1<br />
20 Koppal 130.2 133.1 131.6 6.2 11.6<br />
21 Mandya 41.8 46.4 44.0 0.7 1.0<br />
22 Mysore 325.0 331.1 328.0 2.8 10.3<br />
23 Raichur 151.6 151.6 151.6 8.9 18.1<br />
24 Shimoga 68.5 71.5 70.0 2.3 3.4<br />
25 Tumkur 15.1 16.2 15.6 7.3 7.5<br />
26 Udupi 0.3 1.0 0.6 4.0 3.7<br />
27 Uttara Kannada 129.4 138.6 133.9 0.8 1.8<br />
<strong>Karnataka</strong> 79.8 81.9 80.8 4.3 6.6<br />
Source: Registrar General of India, Census 1991 and 2001, GoI.<br />
482
<strong>Karnataka</strong> <strong>Human</strong> <strong>Development</strong> <strong>Report</strong> <strong>2005</strong><br />
10. Profile of Scheduled Castes and Scheduled Tribes<br />
District Percentage of SC population to the state SC population and ranking of districts<br />
Total<br />
Rank<br />
1991 2001 1991 2001<br />
1 24 25 26 27<br />
1 Bagalkot 3.0 2.9 17 16<br />
2 Bangalore Rural 4.4 4.4 7 7<br />
3 Bangalore Urban 9.7 9.9 1 1<br />
4 Belgaum 5.5 5.4 5 6<br />
5 Bellary 4.2 4.4 8 8<br />
6 Bidar 3.5 3.5 13 14<br />
7 Bijapur 4.0 3.9 10 10<br />
8 Chamarajnagar 2.8 2.8 18 18<br />
9 Chikmaglur 2.7 2.7 19 19<br />
10 Chitradurga 3.9 3.9 11 9<br />
11 Dakshina Kannada 1.6 1.5 24 24<br />
12 Davangere 4.1 3.9 9 11<br />
13 Dharwad 1.7 1.5 22 23<br />
14 Gadag 1.6 1.6 23 22<br />
15 Gulbarga 8.3 8.4 2 2<br />
16 Hassan 3.7 3.6 12 13<br />
17 Haveri 2.3 2.0 20 21<br />
18 Kodagu 0.8 0.8 26 27<br />
19 Kolar 7.7 7.8 3 3<br />
20 Koppal 2.0 2.2 21 20<br />
21 Mandya 3.1 2.9 16 17<br />
22 Mysore 5.3 5.5 6 5<br />
23 Raichur 3.4 3.7 14 12<br />
24 Shimoga 3.2 3.1 15 15<br />
25 Tumkur 5.5 5.5 4 4<br />
26 Udupi 0.8 0.8 27 26<br />
27 Uttara Kannada 1.2 1.2 25 25<br />
<strong>Karnataka</strong> 100.0 100.0<br />
Source: Registrar General of India, Census 1991 and 2001, GoI.<br />
483
Appendix: Statistical Tables<br />
10. Profile of Scheduled Castes and Scheduled Tribes<br />
District Percentage of ST population to the state ST<br />
population and ranking of districts<br />
Sex ratio of SCs<br />
Sex ratio of STs<br />
Total Rank 1991 2001 1991 2001<br />
1991 2001 1991 2001<br />
1 28 29 30 31 32 33 34 35<br />
1 Bagalkot 1.2 2.3 22 15 1023 1021 986 996<br />
2 Bangalore Rural 2.6 1.8 15 18 955 969 935 952<br />
3 Bangalore Urban 2.8 2.5 14 14 937 956 920 913<br />
4 Belgaum 4.3 7.1 9 5 970 979 971 980<br />
5 Bellary 7.7 10.6 5 1 983 985 987 985<br />
6 Bidar 5.4 5.3 8 9 954 945 949 950<br />
7 Bijapur 0.9 0.9 24 24 946 953 930 944<br />
8 Chamarajnagar 2.0 3.1 18 13 936 957 968 994<br />
9 Chikmaglur 1.4 1.2 20 23 968 996 973 994<br />
10 Chitradurga 11.6 7.7 1 4 941 955 954 955<br />
11 Dakshina Kannada 3.4 1.8 10 17 971 993 984 993<br />
12 Davangere 8.1 6.1 3 6 946 956 948 961<br />
13 Dharwad 1.2 2.0 21 16 954 969 930 944<br />
14 Gadag 1.1 1.6 23 20 975 969 949 961<br />
15 Gulbarga 5.6 3.9 7 11 953 961 952 979<br />
16 Hassan 0.9 0.8 25 25 991 1006 991 989<br />
17 Haveri 3.2 3.7 12 12 935 946 927 941<br />
18 Kodagu 2.1 1.3 17 21 985 1020 961 996<br />
19 Kolar 8.0 6.0 4 7 978 985 967 973<br />
20 Koppal 3.1 4.0 13 10 995 997 966 978<br />
21 Mandya 0.6 0.5 26 27 966 999 947 978<br />
22 Mysore 3.3 7.9 11 3 958 969 969 983<br />
23 Raichur 6.3 8.8 6 2 989 991 993 993<br />
24 Shimoga 1.7 1.6 19 19 950 977 953 969<br />
25 Tumkur 8.8 5.6 2 8 955 966 952 962<br />
26 Udupi 2.2 1.2 16 22 1023 1030 1016 1023<br />
27 Uttara Kannada 0.5 0.7 27 26 974 986 948 985<br />
<strong>Karnataka</strong> 100.0 100.0 962 973 961 972<br />
Sources:<br />
1. Col. 32 and 34: Computed based on taluk-wise data of Primary Census Abstract: SC and ST Part II - B (ii) - 1991.<br />
2. Col. 33 and 35: Primary Census Abstract 2001.<br />
484
<strong>Karnataka</strong> <strong>Human</strong> <strong>Development</strong> <strong>Report</strong> <strong>2005</strong><br />
10. Profile of Scheduled Castes and Scheduled Tribes<br />
District Estimated birth rate (2004) Estimated death rate (2004)<br />
SC ST SC ST<br />
1 36 37 38 39<br />
1 Bagalkot 25 23 10 10<br />
2 Bangalore Rural 21 19 10 8<br />
3 Bangalore Urban 17 23 8 9<br />
4 Belgaum 18 20 9 8<br />
5 Bellary 28 24 10 7<br />
6 Bidar 31 23 9 8<br />
7 Bijapur 23 29 11 11<br />
8 Chamarajnagar 18 20 9 12<br />
9 Chikmaglur 21 26 8 9<br />
10 Chitradurga 21 22 9 7<br />
11 Dakshina Kannada 14 25 11 10<br />
12 Davangere 24 20 9 7<br />
13 Dharwad 22 28 12 10<br />
14 Gadag 23 26 9 9<br />
15 Gulbarga 30 25 10 9<br />
16 Hassan 20 27 9 15<br />
17 Haveri 22 19 10 9<br />
18 Kodagu 23 19 14 13<br />
19 Kolar 20 21 8 9<br />
20 Koppal 25 34 14 9<br />
21 Mandya 22 23 7 9<br />
22 Mysore 17 21 8 8<br />
23 Raichur 19 26 9 7<br />
24 Shimoga 18 18 8 8<br />
25 Tumkur 20 22 8 8<br />
26 Udupi 15 19 8 12<br />
27 Uttara Kannada 24 29 12 15<br />
<strong>Karnataka</strong> 22 23 9 9<br />
Source: Survey on SCs and STs, DES, <strong>Karnataka</strong>, 2004B.<br />
485
Appendix: Statistical Tables<br />
10. Profile of Scheduled Castes and Scheduled Tribes<br />
District<br />
Literacy rate (%) of SCs<br />
1991 2001<br />
Male Female Total Male Female Total Rural Urban<br />
1 40 41 42 43 44 45 46 47<br />
1 Bagalkot 54.30 25.30 39.60 56.61 28.75 42.44 38.41 55.74<br />
2 Bangalore Rural 47.70 22.80 35.60 65.80 44.56 55.35 53.91 63.96<br />
3 Bangalore Urban 67.00 46.80 57.30 78.12 61.98 70.23 59.00 73.49<br />
4 Belgaum 56.60 25.80 41.40 69.30 41.63 55.57 51.61 70.75<br />
5 Bellary 42.60 17.40 30.10 55.47 29.04 42.31 36.93 55.80<br />
6 Bidar 46.10 21.40 34.10 63.85 40.22 52.37 49.86 68.00<br />
7 Bijapur 60.60 30.40 45.90 61.72 31.95 47.16 43.85 63.68<br />
8 Chamarajnagar 44.20 22.80 33.80 57.32 42.22 49.94 47.38 67.33<br />
9 Chikmaglur 45.40 24.60 35.20 64.43 44.76 54.58 52.28 69.84<br />
10 Chitradurga 47.70 21.70 35.10 64.05 40.92 52.75 50.09 70.93<br />
11 Dakshina Kannada 63.60 45.90 54.90 73.89 58.36 66.14 61.95 78.81<br />
12 Davangere 48.20 19.20 32.70 61.25 38.16 49.96 46.65 65.50<br />
13 Dharwad 63.20 36.80 50.30 72.76 49.26 61.19 45.40 71.91<br />
14 Gadag 50.20 24.90 38.00 62.74 33.69 48.45 44.02 60.76<br />
15 Gulbarga 37.00 12.80 25.20 50.65 27.02 39.05 33.53 59.53<br />
16 Hassan 46.50 23.50 35.00 64.20 43.14 53.61 51.09 72.40<br />
17 Haveri 53.50 31.00 42.50 62.75 36.94 50.25 47.69 66.97<br />
18 Kodagu 55.40 36.00 45.70 73.49 56.56 64.93 63.26 77.15<br />
19 Kolar 48.60 25.20 37.00 63.70 42.09 52.98 46.46 78.09<br />
20 Koppal 58.40 35.90 47.50 52.02 25.62 38.78 36.09 54.40<br />
21 Mandya 49.90 27.80 39.10 65.64 46.25 55.92 53.01 71.19<br />
22 Mysore 45.00 26.10 35.70 62.15 45.52 53.98 47.09 73.71<br />
23 Raichur 32.10 11.00 21.50 51.37 26.09 38.76 33.31 57.36<br />
24 Shimoga 51.00 28.00 39.80 66.92 46.40 56.78 52.21 69.49<br />
25 Tumkur 48.80 24.60 37.00 64.91 43.39 54.33 51.98 69.72<br />
26 Udupi 57.40 34.20 46.20 77.72 62.81 70.13 68.30 79.07<br />
27 Uttara Kannada 61.40 38.70 50.20 75.24 55.55 65.45 60.49 76.39<br />
<strong>Karnataka</strong> 49.70 26.00 38.10 63.75 41.72 52.87 47.25 69.27<br />
Sources:<br />
1. Col. 40 to 42: Computed based on taluk-wise data of Primary Census Abstract: SC and ST Part II - B (ii) - 1991.<br />
2. Col. 43-47: Primary Census Abstract.<br />
486
<strong>Karnataka</strong> <strong>Human</strong> <strong>Development</strong> <strong>Report</strong> <strong>2005</strong><br />
10. Profile of Scheduled Castes and Scheduled Tribes<br />
District<br />
Literacy rate (%) of STs<br />
1991 2001<br />
Male Female Total Male Female Total Rural Urban<br />
1 48 49 50 51 52 53 54 55<br />
1 Bagalkot 61.2 27.2 44.3 57.32 28.49 42.87 40.91 56.42<br />
2 Bangalore Rural 49.2 25.0 37.6 65.94 46.03 56.22 54.23 70.87<br />
3 Bangalore Urban 71.6 51.5 62.0 80.11 64.80 72.83 58.42 76.58<br />
4 Belgaum 48.4 19.2 34.0 57.75 29.50 43.72 40.90 62.79<br />
5 Bellary 38.8 15.2 27.0 53.39 28.75 41.12 37.89 51.70<br />
6 Bidar 42.8 14.9 29.2 61.09 35.61 48.68 47.51 65.04<br />
7 Bijapur 55.8 31.7 44.3 59.68 31.88 46.19 43.48 68.15<br />
8 Chamarajnagar 37.4 20.2 29.0 50.24 32.77 41.53 37.15 58.67<br />
9 Chikmaglur 49.4 30.1 39.9 68.21 49.44 58.84 56.90 77.47<br />
10 Chitradurga 53.9 25.6 24.1 65.76 41.54 53.93 51.57 71.85<br />
11 Dakshina Kannada 71.5 53.7 62.7 80.20 65.69 72.95 71.75 80.68<br />
12 Davangere 51.5 26.1 39.2 64.78 42.98 54.11 52.16 64.20<br />
13 Dharwad 63.4 33.9 49.3 66.27 41.95 54.46 47.73 65.63<br />
14 Gadag 62.2 27.0 45.0 72.89 42.08 57.73 55.56 69.15<br />
15 Gulbarga 33.3 9.4 21.6 43.82 20.77 32.40 29.45 52.15<br />
16 Hassan 52.7 27.4 40.1 67.25 45.56 56.43 53.96 82.65<br />
17 Haveri 62.2 29.8 46.7 71.34 45.16 58.67 57.61 69.41<br />
18 Kodagu 29.3 21.5 25.5 46.12 34.61 40.37 39.26 78.88<br />
19 Kolar 43.7 18.7 31.4 59.07 36.23 47.80 46.09 68.25<br />
20 Koppal 36.9 8.7 23.0 57.55 26.48 42.11 41.08 55.10<br />
21 Mandya 47.9 26.7 37.5 63.68 45.42 54.63 50.77 68.62<br />
22 Mysore 42.0 23.9 33.1 55.09 37.47 46.35 41.93 66.98<br />
23 Raichur 23.4 5.4 14.4 41.05 16.91 29.01 27.84 41.80<br />
24 Shimoga 59.0 36.5 48.0 71.45 52.51 62.11 57.73 77.08<br />
25 Tumkur 56.5 30.5 43.8 70.25 48.70 59.69 57.68 73.92<br />
26 Udupi 65.3 48.2 56.6 76.70 62.78 69.63 68.05 79.27<br />
27 Uttara Kannada 45.7 23.8 35.1 71.79 53.61 62.74 60.22 72.77<br />
<strong>Karnataka</strong> 47.9 23.6 36.0 59.66 36.57 48.27 45.26 64.57<br />
Sources:<br />
1. Col. 48 to 50: Computed based on taluk-wise data of Primary Census Abstract: SC and ST Part II - B (ii) - 1991.<br />
2. Col. 51 to 55: Primary Census Abstract 2001.<br />
487
Appendix: Statistical Tables<br />
10. Profile of Scheduled Castes and Scheduled Tribes<br />
District<br />
Percentage of enrolment of SC students to students of all castes in primary schools<br />
(standards I-VIII)<br />
1998-99 2003-04<br />
Boys Girls Total Boys Girls Total<br />
1 56 57 58 59 60 61<br />
1 Bagalkot 17.0 12.6 14.8 18.4 18.4 18.4<br />
2 Bangalore Rural 22.1 21.9 22.0 27.7 23.7 25.7<br />
3 Bangalore Urban 18.9 18.9 18.9 23.8 22.2 23.0<br />
4 Belgaum 13.5 13.2 13.4 11.8 11.2 11.5<br />
5 Bellary 19.6 17.8 18.8 26.5 21.3 24.1<br />
6 Bidar 22.6 23.4 22.9 26.2 24.3 25.3<br />
7 Bijapur 21.0 19.8 20.4 24.3 20.4 22.5<br />
8 Chamarajnagar 27.7 31.7 29.5 26.7 27.6 27.1<br />
9 Chikmaglur 21.7 22.2 21.9 24.4 24.1 24.2<br />
10 Chitradurga 24.4 24.4 24.4 25.9 26.1 26.0<br />
11 Dakshina Kannada 7.4 7.6 7.5 7.0 6.7 6.9<br />
12 Davangere 24.9 22.7 23.8 19.3 18.0 18.6<br />
13 Dharwad 8.2 9.4 8.8 10.8 10.3 10.5<br />
14 Gadag 17.6 15.6 16.6 20.5 16.3 18.5<br />
15 Gulbarga 27.5 28.1 27.8 25.0 23.6 24.3<br />
16 Hassan 21.7 19.2 20.4 22.0 20.9 21.5<br />
17 Haveri 19.5 20.0 19.7 15.3 13.8 14.6<br />
18 Kodagu 12.4 12.2 12.3 16.5 15.1 15.8<br />
19 Kolar 29.8 29.6 29.7 31.9 29.7 30.8<br />
20 Koppal 16.1 15.6 15.9 17.7 16.9 17.3<br />
21 Mandya 15.4 15.8 15.6 18.1 18.9 18.5<br />
22 Mysore 21.0 21.9 21.5 19.0 18.6 18.8<br />
23 Raichur 19.6 22.3 20.7 26.7 24.5 25.7<br />
24 Shimoga 24.0 19.9 21.9 19.8 20.0 19.9<br />
25 Tumkur 21.0 19.7 20.4 25.4 21.4 23.5<br />
26 Udupi 5.5 6.9 6.1 7.7 7.1 7.4<br />
27 Uttara Kannada 9.1 8.8 9.0 9.8 9.3 9.6<br />
<strong>Karnataka</strong> 19.2 18.9 19.1 20.8 19.4 20.1<br />
Source: Computed based on data of CPI, <strong>Karnataka</strong>.<br />
488
<strong>Karnataka</strong> <strong>Human</strong> <strong>Development</strong> <strong>Report</strong> <strong>2005</strong><br />
10. Profile of Scheduled Castes and Scheduled Tribes<br />
District<br />
Percentage of enrolment of ST students to students of all castes in primary schools<br />
(standard I-VIII)<br />
1998-99 2003-04<br />
Boys Girls Total Boys Girls Total<br />
1 62 63 64 65 66 67<br />
1 Bagalkot 4.1 3.0 3.5 5.3 5.3 5.3<br />
2 Bangalore Rural 3.7 3.7 3.7 3.9 4.0 4.0<br />
3 Bangalore Urban 4.3 4.2 4.2 3.7 3.4 3.6<br />
4 Belgaum 6.3 5.9 6.1 6.2 6.4 6.3<br />
5 Bellary 17.1 16.5 16.8 21.3 18.8 20.1<br />
6 Bidar 3.3 3.1 3.2 9.0 9.9 9.4<br />
7 Bijapur 2.3 2.4 2.4 2.1 1.9 2.0<br />
8 Chamarajnagar 10.1 10.4 10.3 10.2 9.5 9.9<br />
9 Chikmaglur 4.3 3.7 4.1 4.1 4.2 4.1<br />
10 Chitradurga 18.4 17.8 18.1 17.8 18.5 18.1<br />
11 Dakshina Kannada 3.9 3.9 3.9 3.9 4.1 4.0<br />
12 Davangere 11.9 12.4 12.1 9.5 10.7 10.1<br />
13 Dharwad 3.5 3.8 3.7 5.2 5.5 5.3<br />
14 Gadag 8.4 8.0 8.2 6.6 6.1 6.4<br />
15 Gulbarga 1.9 2.0 2.0 4.3 3.3 3.8<br />
16 Hassan 2.1 1.9 2.0 1.9 1.9 1.9<br />
17 Haveri 14.3 16.3 15.1 9.1 9.1 9.1<br />
18 Kodagu 4.3 5.1 4.6 9.4 8.3 8.8<br />
19 Kolar 8.8 8.5 8.6 8.7 8.8 8.8<br />
20 Koppal 13.4 11.6 12.6 12.1 12.9 12.5<br />
21 Mandya 1.5 1.5 1.5 1.5 1.7 1.6<br />
22 Mysore 9.9 9.7 9.8 11.2 10.7 11.0<br />
23 Raichur 17.1 15.4 16.4 24.9 19.9 22.5<br />
24 Shimoga 4.4 4.2 4.3 4.1 4.4 4.2<br />
25 Tumkur 8.6 8.3 8.5 6.8 6.4 6.6<br />
26 Udupi 3.9 3.9 3.9 5.0 5.2 5.1<br />
27 Uttara Kannada 1.5 1.4 1.4 2.1 2.1 2.1<br />
<strong>Karnataka</strong> 6.7 6.4 6.5 7.5 7.2 7.4<br />
Source: Computed based on data of CPI, <strong>Karnataka</strong>.<br />
489
Appendix: Statistical Tables<br />
10. Profile of Scheduled Castes and Scheduled Tribes<br />
District<br />
Percentage of enrolment of SC students to students of all castes in high schools (standard IX-X)<br />
1998-99 2003-04<br />
Boys Girls Total Boys Girls Total<br />
1 68 69 70 71 72 73<br />
1 Bagalkot 13.2 8.9 11.7 15.9 13.9 15.1<br />
2 Bangalore Rural 19.3 18.2 18.8 20.2 18.8 19.5<br />
3 Bangalore Urban 27.8 23.8 25.7 23.3 22.5 22.9<br />
4 Belgaum 10.5 8.8 9.8 9.1 7.6 8.5<br />
5 Bellary 12.7 10.5 11.9 16.4 12.0 14.6<br />
6 Bidar 22.6 20.7 21.7 24.6 19.2 21.9<br />
7 Bijapur 16.9 18.7 17.6 14.3 9.3 12.1<br />
8 Chamarajnagar 25.3 47.8 35.2 30.3 34.1 32.0<br />
9 Chikmaglur 12.8 11.4 12.2 16.8 15.3 16.1<br />
10 Chitradurga 20.2 21.5 20.8 18.1 19.9 18.9<br />
11 Dakshina Kannada 5.6 5.4 5.5 5.1 5.5 5.3<br />
12 Davangere 36.7 26.6 32.1 15.4 12.8 14.1<br />
13 Dharwad 7.2 5.8 6.6 8.7 9.0 8.8<br />
14 Gadag 11.1 11.0 11.0 11.2 8.9 10.2<br />
15 Gulbarga 18.4 10.7 15.0 20.0 17.5 19.0<br />
16 Hassan 17.2 14.0 15.8 18.3 15.2 16.7<br />
17 Haveri 21.0 21.6 21.2 11.4 8.6 10.1<br />
18 Kodagu 7.7 6.4 7.0 11.3 10.8 11.0<br />
19 Kolar 23.8 21.9 23.0 18.2 19.0 18.6<br />
20 Koppal 9.3 7.4 8.5 29.3 11.8 22.3<br />
21 Mandya 14.9 12.2 13.6 13.4 16.3 14.8<br />
22 Mysore 16.0 19.3 17.4 51.3 69.3 58.7<br />
23 Raichur 4.8 2.5 4.1 17.0 20.1 18.4<br />
24 Shimoga 16.5 8.7 11.9 12.9 12.9 12.9<br />
25 Tumkur 13.4 10.8 12.2 13.9 10.5 12.4<br />
26 Udupi 3.1 3.0 3.1 4.8 4.8 4.8<br />
27 Uttara Kannada 6.6 5.9 6.2 18.4 7.9 13.2<br />
<strong>Karnataka</strong> 16.3 15.0 15.7 18.1 16.9 17.5<br />
Source: Computed based on data of CPI, <strong>Karnataka</strong>.<br />
490
<strong>Karnataka</strong> <strong>Human</strong> <strong>Development</strong> <strong>Report</strong> <strong>2005</strong><br />
10. Profile of Scheduled Castes and Scheduled Tribes<br />
District Percentage of enrolment of ST students to students of all castes in high schools (IX to X)<br />
1998-99 2003-04<br />
Boys Girls Total Boys Girls Total<br />
1 74 75 76 77 78 79<br />
1 Bagalkot 3.7 2.4 3.3 4.7 4.1 4.4<br />
2 Bangalore Rural 4.4 3.8 4.1 15.3 3.7 9.5<br />
3 Bangalore Urban 6.9 7.3 7.1 5.5 5.8 5.7<br />
4 Belgaum 2.2 2.1 2.2 3.8 3.3 3.6<br />
5 Bellary 11.4 8.8 10.4 14.6 11.7 13.4<br />
6 Bidar 5.0 4.8 4.9 5.3 6.4 5.8<br />
7 Bijapur 2.8 2.3 2.6 2.8 2.2 2.6<br />
8 Chamarajnagar 6.1 5.6 5.9 8.4 7.8 8.1<br />
9 Chikmaglur 2.6 2.9 2.8 3.5 3.4 3.5<br />
10 Chitradurga 18.1 17.4 17.8 13.3 15.9 14.5<br />
11 Dakshina Kannada 2.7 2.8 2.7 3.7 4.0 3.9<br />
12 Davangere 16.8 18.5 17.6 10.9 10.7 10.8<br />
13 Dharwad 1.4 0.8 1.1 2.0 1.6 1.8<br />
14 Gadag 7.2 8.0 7.5 5.9 6.0 5.9<br />
15 Gulbarga 3.5 2.3 3.0 5.2 2.4 4.0<br />
16 Hassan 2.1 2.0 2.0 1.9 1.7 1.8<br />
17 Haveri 11.2 13.8 12.1 8.5 9.0 8.7<br />
18 Kodagu 3.2 2.3 2.8 4.5 4.1 4.3<br />
19 Kolar 6.3 4.7 5.6 5.8 5.0 5.4<br />
20 Koppal 7.8 7.1 7.5 9.6 10.3 9.9<br />
21 Mandya 1.2 0.9 1.1 0.8 1.0 0.9<br />
22 Mysore 8.1 6.5 7.5 11.9 14.1 12.8<br />
23 Raichur 19.8 14.0 17.9 13.7 8.5 11.4<br />
24 Shimoga 5.0 3.7 4.2 3.1 3.2 3.1<br />
25 Tumkur 7.2 6.3 6.8 4.5 4.6 4.5<br />
26 Udupi 1.7 1.6 1.6 3.5 3.9 3.7<br />
27 Uttara Kannada 0.9 0.7 0.8 1.6 1.6 1.6<br />
<strong>Karnataka</strong> 6.0 5.3 5.7 6.3 5.5 6.0<br />
Source: Computed based on data of CPI, <strong>Karnataka</strong>.<br />
491
Appendix: Statistical Tables<br />
10. Profile of Scheduled Castes and Scheduled Tribes<br />
District<br />
Percentage of enrolment of SC students to students of all castes in PUC (standard XI-XII)<br />
1998-99 2003-04<br />
Boys Girls Total Boys Girls Total<br />
1 80 81 82 83 84 85<br />
1 Bagalkot 13.2 9.7 12.1 11.5 8.5 10.6<br />
2 Bangalore Rural 14.9 12.0 13.7 15.9 15.1 15.5<br />
3 Bangalore Urban 11.0 10.7 10.8 11.0 11.3 11.1<br />
4 Belgaum 10.8 8.6 10.1 9.5 9.2 9.4<br />
5 Bellary 11.3 7.0 9.6 11.1 8.1 10.0<br />
6 Bidar 21.1 13.9 18.1 21.9 21.7 21.8<br />
7 Bijapur 25.4 14.9 21.9 21.2 15.2 19.3<br />
8 Chamarajnagar 38.0 36.9 37.6 28.7 34.3 30.8<br />
9 Chikmaglur 11.5 7.3 9.3 12.0 11.6 11.8<br />
10 Chitradurga 16.5 14.6 15.7 14.1 14.9 14.4<br />
11 Dakshina Kannada 9.2 7.1 8.1 11.2 8.2 9.5<br />
12 Davangere 2.7 3.3 3.0 3.6 3.7 3.6<br />
13 Dharwad 16.2 8.0 12.5 15.6 9.7 13.1<br />
14 Gadag 9.6 5.2 7.7 9.4 8.9 9.2<br />
15 Gulbarga 12.1 7.0 10.2 10.0 6.3 8.8<br />
16 Hassan 19.8 14.2 17.6 20.2 17.7 19.3<br />
17 Haveri 11.8 7.0 9.5 12.7 12.4 12.6<br />
18 Kodagu 9.1 5.4 7.6 11.5 7.5 10.0<br />
19 Kolar 16.8 15.5 16.3 20.6 19.6 20.2<br />
20 Koppal 9.7 6.1 8.2 9.0 7.5 8.5<br />
21 Mandya 14.4 11.7 14.3 12.7 15.7 14.0<br />
22 Mysore 14.9 16.0 16.6 16.6 15.6 16.1<br />
23 Raichur 13.3 10.7 13.1 16.0 17.2 16.5<br />
24 Shimoga 10.3 8.1 10.4 13.2 10.7 11.9<br />
25 Tumkur 13.1 8.0 15.8 16.6 14.2 15.6<br />
26 Udupi 3.3 3.5 3.5 3.6 4.4 4.0<br />
27 Uttara Kannada 6.2 5.1 6.4 6.2 6.3 6.2<br />
<strong>Karnataka</strong> 13.3 9.8 12.1 13.3 11.9 12.7<br />
Source: Computed based on data of PUC Board, <strong>Karnataka</strong>.<br />
492
<strong>Karnataka</strong> <strong>Human</strong> <strong>Development</strong> <strong>Report</strong> <strong>2005</strong><br />
10. Profile of Scheduled Castes and Scheduled Tribes<br />
District<br />
Percentage of enrolment of ST students to students of all castes in PUC (standard XI-XII)<br />
1998-99 2003-04<br />
Boys Girls Total Boys Girls Total<br />
1 86 87 88 89 90 91<br />
1 Bagalkot 4.0 2.4 3.5 3.3 2.7 3.1<br />
2 Bangalore Rural 3.1 1.7 2.5 2.3 2.4 2.3<br />
3 Bangalore Urban 1.7 1.5 1.6 1.6 1.6 1.6<br />
4 Belgaum 2.5 2.2 2.4 3.0 2.3 2.8<br />
5 Bellary 9.4 6.8 8.4 9.1 7.4 8.5<br />
6 Bidar 4.6 2.4 3.7 3.9 4.2 4.0<br />
7 Bijapur 2.0 1.1 1.7 1.2 1.5 1.3<br />
8 Chamarajnagar 5.9 4.9 5.5 5.5 6.2 5.8<br />
9 Chikmaglur 2.6 1.4 2.0 2.5 2.0 2.3<br />
10 Chitradurga 13.5 10.1 12.1 9.2 10.9 9.8<br />
11 Dakshina Kannada 1.9 1.8 1.9 1.1 2.4 1.8<br />
12 Davangere 2.6 2.8 2.7 2.1 3.2 2.7<br />
13 Dharwad 11.4 6.0 9.0 9.6 7.4 8.7<br />
14 Gadag 3.0 1.9 2.5 3.8 2.9 3.4<br />
15 Gulbarga 7.5 3.6 6.0 5.8 3.7 5.1<br />
16 Hassan 2.5 1.2 2.0 2.1 1.3 1.8<br />
17 Haveri 1.2 1.0 1.1 1.3 1.2 1.2<br />
18 Kodagu 6.9 4.8 6.1 10.0 7.2 8.9<br />
19 Kolar 3.5 2.7 3.2 5.3 3.9 4.7<br />
20 Koppal 5.7 4.3 5.1 6.4 4.8 5.8<br />
21 Mandya 1.1 0.9 1.1 0.9 0.9 0.9<br />
22 Mysore 4.8 4.0 4.8 6.0 4.9 5.5<br />
23 Raichur 6.6 3.2 5.6 9.1 4.9 7.6<br />
24 Shimoga 2.3 2.2 2.5 2.8 2.6 2.7<br />
25 Tumkur 5.6 3.4 6.7 6.0 6.2 6.1<br />
26 Udupi 2.3 1.7 2.0 2.6 2.9 2.8<br />
27 Uttara Kannada 1.5 0.7 1.2 0.8 1.0 0.9<br />
<strong>Karnataka</strong> 4.1 2.7 3.6 3.9 3.3 3.7<br />
Source: Computed based on data of PUC Board, <strong>Karnataka</strong>.<br />
493
Appendix: Statistical Tables<br />
10. Profile of Scheduled Castes and Scheduled Tribes<br />
District Gross enrolment ratio (standard I-VIII) - Scheduled Castes (2001)<br />
Population (6 to less than 14)<br />
Gross enrolment ratio<br />
Boys Girls Total Boys Girls Total<br />
1 92 93 94 95 96 97<br />
1 Bagalkot 29217 27692 56909 104.05 94.36 99.33<br />
2 Bangalore Rural 36733 35226 71959 94.41 95.02 94.71<br />
3 Bangalore Urban 77362 75352 152714 139.42 134.50 137.00<br />
4 Belgaum 47492 44218 91710 104.36 100.10 102.30<br />
5 Bellary 46133 43243 89376 90.95 78.37 84.87<br />
6 Bidar 35910 33842 69752 127.38 108.38 118.16<br />
7 Bijapur 40950 37377 78327 111.09 96.57 104.16<br />
8 Chamarajnagar 21511 20551 42062 100.89 97.65 99.31<br />
9 Chikmaglur 21559 20897 42456 97.52 89.16 93.40<br />
10 Chitradurga 35134 33730 68864 100.45 103.32 101.85<br />
11 Dakshina Kannada 10797 10219 21016 113.12 101.61 107.52<br />
12 Davangere 35190 33357 68547 104.97 71.47 88.67<br />
13 Dharwad 13410 12648 26058 113.49 112.47 113.00<br />
14 Gadag 16031 15114 31145 99.14 122.25 110.35<br />
15 Gulbarga 89902 83335 173237 99.07 89.06 94.26<br />
16 Hassan 29332 28994 58326 99.85 96.32 98.09<br />
17 Haveri 19058 17713 36771 102.63 99.43 101.09<br />
18 Kodagu 5731 5663 11394 141.54 95.51 118.66<br />
19 Kolar 65456 63069 128525 107.70 104.57 106.16<br />
20 Koppal 23051 22147 45198 97.13 78.27 87.89<br />
21 Mandya 22792 22062 44854 93.23 91.74 92.50<br />
22 Mysore 43908 43471 87379 100.86 92.82 96.86<br />
23 Raichur 39614 37456 77070 92.50 64.66 78.97<br />
24 Shimoga 25456 24967 50423 158.77 150.44 154.65<br />
25 Tumkur 44842 42654 87496 100.25 93.45 96.93<br />
26 Udupi 5759 5578 11337 333.88 312.30 323.27<br />
27 Uttara Kannada 9352 9066 18418 109.10 116.31 112.65<br />
<strong>Karnataka</strong> 891682 849641 1741323 108.77 100.16 104.57<br />
Sources:<br />
1. Col. 92 to 94: Census 2001 PCA.<br />
2. Col. 95 to 97: Computed based on enrolment fi gures of CPI and age group population of Census 2001.<br />
494
<strong>Karnataka</strong> <strong>Human</strong> <strong>Development</strong> <strong>Report</strong> <strong>2005</strong><br />
10. Profile of Scheduled Castes and Scheduled Tribes<br />
District Gross enrolment ratio: (standard I-VIII) - Scheduled Tribes (2001)<br />
Population (6 to less than 14)<br />
Gross enrolment ratio<br />
Boys Girls Total Boys Girls Total<br />
1 98 99 100 101 102 103<br />
1 Bagalkot 8422 8350 16772 105.03 87.66 96.38<br />
2 Bangalore Rural 5897 5649 11546 108.02 103.01 105.57<br />
3 Bangalore Urban 7290 7028 14318 325.33 312.65 319.10<br />
4 Belgaum 26243 24518 50761 75.47 76.58 76.01<br />
5 Bellary 43673 42069 85742 82.06 70.67 76.47<br />
6 Bidar 21410 20587 41997 49.43 48.05 48.76<br />
7 Bijapur 3448 3205 6653 283.70 256.62 270.65<br />
8 Chamarajnagar 9262 8961 18223 92.54 79.29 86.02<br />
9 Chikmaglur 3687 3628 7315 95.68 91.35 93.53<br />
10 Chitradurga 26786 25870 52656 90.34 83.59 87.03<br />
11 Dakshina Kannada 4960 4998 9958 142.34 113.26 127.74<br />
12 Davangere 20862 20410 41272 105.18 46.63 76.23<br />
13 Dharwad 6984 6630 13614 111.88 106.82 109.41<br />
14 Gadag 5454 5282 10736 140.18 160.04 149.95<br />
15 Gulbarga 19079 18294 37373 40.85 34.20 37.59<br />
16 Hassan 2299 2424 4723 106.78 102.39 104.53<br />
17 Haveri 12757 12128 24885 90.13 86.62 88.42<br />
18 Kodagu 3882 3742 7624 75.47 71.26 73.41<br />
19 Kolar 20166 19358 39524 119.61 120.21 119.90<br />
20 Koppal 17030 16213 33243 82.30 69.62 76.11<br />
21 Mandya 1559 1539 3098 139.75 124.37 132.13<br />
22 Mysore 24791 24868 49659 120.56 104.05 112.29<br />
23 Raichur 38138 36360 74498 64.88 51.21 58.21<br />
24 Shimoga 5222 5001 10223 119.27 151.38 134.97<br />
25 Tumkur 17321 16585 33906 103.30 94.21 98.85<br />
26 Udupi 3537 3408 6945 109.82 136.27 122.80<br />
27 Uttara Kannada 2274 2115 4389 66.81 62.12 64.55<br />
<strong>Karnataka</strong> 362433 349220 711653 95.15 84.91 90.12<br />
Sources:<br />
1. Col. 98 to 100: Census 2001 PCA.<br />
2. Col. 101 to 103: Computed based on enrolment fi gures of CPI and age group population of Census 2001.<br />
495
Appendix: Statistical Tables<br />
10. Profile of Scheduled Castes and Scheduled Tribes<br />
District Gross enrolment ratio: (standard I-X) - Scheduled Castes (2001)<br />
Population (6 to less than 16)<br />
Gross enrolment ratio<br />
Boys Girls Total Boys Girls Total<br />
1 104 105 106 107 108 109<br />
1 Bagalkot 35592 33088 68680 91.33 86.01 88.77<br />
2 Bangalore Rural 46184 43894 90078 83.22 85.07 84.12<br />
3 Bangalore Urban 97232 94659 191891 125.27 121.52 123.42<br />
4 Belgaum 58683 53366 112049 92.98 90.06 91.59<br />
5 Bellary 55843 51522 107365 80.53 68.65 74.83<br />
6 Bidar 43927 40604 84531 111.58 96.03 104.11<br />
7 Bijapur 50087 44625 94712 99.78 88.73 94.57<br />
8 Chamarajnagar 27344 25847 53191 92.01 89.13 90.61<br />
9 Chikmaglur 26968 26206 53174 84.46 79.90 82.21<br />
10 Chitradurga 43528 41174 84702 91.29 92.21 91.73<br />
11 Dakshina Kannada 13791 13154 26945 96.19 83.41 89.95<br />
12 Davangere 43942 40934 84876 91.17 63.61 77.88<br />
13 Dharwad 16850 15606 32456 99.86 98.93 99.41<br />
14 Gadag 19862 18206 38068 87.29 113.59 99.87<br />
15 Gulbarga 108801 98804 207605 86.13 78.29 82.40<br />
16 Hassan 37012 36494 73506 87.37 86.31 86.84<br />
17 Haveri 23808 21596 45404 94.49 90.78 92.73<br />
18 Kodagu 7246 7159 14405 119.14 82.73 101.04<br />
19 Kolar 80822 76703 157525 98.45 97.59 98.03<br />
20 Koppal 27696 26106 53802 85.43 68.97 77.44<br />
21 Mandya 28779 27757 56536 86.85 83.17 85.04<br />
22 Mysore 55688 54542 110230 99.99 89.07 94.59<br />
23 Raichur 47861 44609 92470 78.49 55.24 67.27<br />
24 Shimoga 32015 31098 63113 160.74 153.12 156.99<br />
25 Tumkur 56088 52635 108723 90.75 84.05 87.51<br />
26 Udupi 7337 7228 14565 271.37 250.76 261.14<br />
27 Uttara Kannada 11794 11414 23208 95.65 102.54 99.04<br />
<strong>Karnataka</strong> 1104780 1039031 2143811 97.63 90.77 94.31<br />
Sources:<br />
1. Col. 104 to 106: Census 2001 PCA.<br />
2. Col. 107 to 109: Computed based on enrolment fi gures of CPI and age group population of Census 2001.<br />
496
<strong>Karnataka</strong> <strong>Human</strong> <strong>Development</strong> <strong>Report</strong> <strong>2005</strong><br />
10. Profile of Scheduled Castes and Scheduled Tribes<br />
District Gross enrolment ratio: (standard I-X) - Scheduled Tribes (2001)<br />
Population (6 to less than 16)<br />
Gross enrolment ratio<br />
Boys Girls Total Boys Girls Total<br />
1 110 111 112 113 114 115<br />
1 Bagalkot 10336 10000 20336 94.55 84.64 89.68<br />
2 Bangalore Rural 7331 6959 14290 100.58 92.46 96.63<br />
3 Bangalore Urban 9184 8804 17988 287.95 279.45 283.78<br />
4 Belgaum 32160 29518 61678 68.40 67.90 68.16<br />
5 Bellary 53024 50366 103390 72.18 61.89 67.16<br />
6 Bidar 26167 24629 50796 43.85 42.21 43.06<br />
7 Bijapur 4219 3810 8029 254.87 228.75 242.48<br />
8 Chamarajnagar 11681 11194 22875 83.43 70.41 77.06<br />
9 Chikmaglur 4604 4545 9149 83.48 79.66 81.58<br />
10 Chitradurga 33349 31707 65056 81.23 74.47 77.93<br />
11 Dakshina Kannada 6353 6405 12758 118.64 96.35 107.45<br />
12 Davangere 26178 25226 51404 91.51 42.17 67.30<br />
13 Dharwad 8757 8107 16864 99.17 95.65 97.48<br />
14 Gadag 6910 6445 13355 129.29 145.53 137.13<br />
15 Gulbarga 23006 21603 44608 35.63 29.91 32.86<br />
16 Hassan 2906 3048 5954 98.87 92.13 95.42<br />
17 Haveri 16114 14935 31049 78.76 81.15 79.91<br />
18 Kodagu 4779 4605 9384 65.12 61.58 63.38<br />
19 Kolar 24758 23391 48149 112.95 111.51 112.25<br />
20 Koppal 20492 19155 39648 73.92 62.03 68.17<br />
21 Mandya 1967 1909 3876 120.64 114.37 117.55<br />
22 Mysore 31195 31030 62225 110.93 94.52 102.74<br />
23 Raichur 45817 43027 88844 55.30 43.89 49.77<br />
24 Shimoga 6545 6236 12781 113.40 141.91 127.31<br />
25 Tumkur 21841 20668 42509 96.02 86.10 91.20<br />
26 Udupi 4472 4398 8870 97.96 116.44 107.12<br />
27 Uttara Kannada 2840 2658 5498 58.03 55.30 56.71<br />
<strong>Karnataka</strong> 446984 424378 871362 85.59 76.51 81.17<br />
Sources:<br />
1. Col. 110 to 112: Census 2001 PCA.<br />
2. Col. 113 to 115: Computed based on enrolment fi gures of CPI and age group population of Census 2001.<br />
497
Appendix: Statistical Tables<br />
10. Profile of Scheduled Castes and Scheduled Tribes<br />
District Gross enrolment ratio: (standard I-XII) Scheduled Castes (2001)<br />
Population (6 to less than 18)<br />
Gross enrolment ratio<br />
Boys Girls Total Boys Girls Total<br />
1 116 117 118 119 120 121<br />
1 Bagalkot 41134 37315 78449 82.76 77.68 80.34<br />
2 Bangalore Rural 54871 51506 106377 73.58 74.63 74.09<br />
3 Bangalore Urban 116629 113503 230132 109.02 106.07 107.56<br />
4 Belgaum 68828 60747 129575 84.14 81.32 82.82<br />
5 Bellary 63842 57685 121527 72.18 62.25 67.47<br />
6 Bidar 50733 45565 96298 102.06 88.62 95.70<br />
7 Bijapur 57866 49855 107721 91.87 81.21 86.94<br />
8 Chamarajnagar 32996 30744 63740 82.40 78.55 80.54<br />
9 Chikmaglur 32056 31195 63251 73.60 69.00 71.33<br />
10 Chitradurga 50998 47223 98221 81.94 82.52 82.22<br />
11 Dakshina Kannada 16871 16284 33155 80.83 70.57 75.79<br />
12 Davangere 52045 47376 99421 81.84 57.19 70.10<br />
13 Dharwad 20129 18200 38329 90.15 89.63 89.90<br />
14 Gadag 23318 20629 43947 77.50 101.39 88.71<br />
15 Gulbarga 124332 109888 234220 78.71 71.98 75.55<br />
16 Hassan 44079 43414 87493 76.47 74.33 75.41<br />
17 Haveri 28171 24754 52925 82.75 80.30 81.60<br />
18 Kodagu 8702 8627 17329 102.54 71.96 87.31<br />
19 Kolar 94266 87893 182159 87.43 87.24 87.34<br />
20 Koppal 31510 28972 60482 76.32 62.75 69.82<br />
21 Mandya 34244 32947 67191 77.78 73.71 75.78<br />
22 Mysore 67002 64642 131644 86.86 78.12 82.57<br />
23 Raichur 54569 49991 104560 70.93 50.41 61.12<br />
24 Shimoga 38353 36747 75100 137.38 132.06 134.78<br />
25 Tumkur 66416 61235 127651 80.82 74.37 77.73<br />
26 Udupi 8897 8953 17850 227.26 206.81 217.00<br />
27 Uttara Kannada 14131 13670 27801 82.85 89.09 85.91<br />
<strong>Karnataka</strong> 1296988 1199560 2496548 86.94 80.99 84.08<br />
Sources:<br />
1. Col. 116 to 118: Population Census 2001 PCA.<br />
2. Col. 119 to 121: Computed based on enrolment fi gures of CPI and age group population of Census 2001.<br />
498
<strong>Karnataka</strong> <strong>Human</strong> <strong>Development</strong> <strong>Report</strong> <strong>2005</strong><br />
10. Profile of Scheduled Castes and Scheduled Tribes<br />
District Gross enrolment ratio: (standard I-XII) - Scheduled Tribes (2001)<br />
Population (6 to less than 18)<br />
Gross enrolment ratio<br />
Boys Girls Total Boys Girls Total<br />
1 122 123 124 125 126 127<br />
1 Bagalkot 12063 11294 23357 84.82 76.08 80.59<br />
2 Bangalore Rural 8621 8083 16704 88.97 81.18 85.20<br />
3 Bangalore Urban 11091 10579 21670 244.82 238.53 241.75<br />
4 Belgaum 37332 33513 70845 60.99 60.73 60.87<br />
5 Bellary 60855 56613 117468 64.45 55.86 60.31<br />
6 Bidar 30212 27583 57795 39.59 38.31 38.98<br />
7 Bijapur 4880 4234 9114 224.58 207.18 216.48<br />
8 Chamarajnagar 14029 13279 27308 71.74 60.48 66.26<br />
9 Chikmaglur 5476 5433 10909 83.24 68.87 76.08<br />
10 Chitradurga 39392 36625 76017 73.52 66.76 70.26<br />
11 Dakshina Kannada 7791 7839 15630 101.41 84.29 92.82<br />
12 Davangere 31238 29457 60695 81.87 38.50 60.82<br />
13 Dharwad 10450 9356 19806 87.87 85.21 86.62<br />
14 Gadag 8351 7380 15731 111.33 128.56 119.42<br />
15 Gulbarga 26225 23935 50160 33.42 27.76 30.72<br />
16 Hassan 3493 3611 7104 85.72 80.09 82.85<br />
17 Haveri 19310 17297 36607 69.05 71.61 70.26<br />
18 Kodagu 5631 5450 11081 56.03 53.06 54.57<br />
19 Kolar 28706 26626 55332 100.32 99.26 99.81<br />
20 Koppal 23339 21269 44608 66.10 56.51 61.53<br />
21 Mandya 2345 2241 4586 105.12 99.74 102.49<br />
22 Mysore 37395 36633 74028 94.72 81.40 88.13<br />
23 Raichur 51885 47786 99671 49.67 39.79 44.93<br />
24 Shimoga 7800 7380 15180 98.25 122.72 110.14<br />
25 Tumkur 26158 24352 50510 84.70 75.47 80.25<br />
26 Udupi 5377 5454 10831 86.84 98.53 92.72<br />
27 Uttara Kannada 3368 3179 6547 51.63 47.94 49.84<br />
<strong>Karnataka</strong> 522812 486482 1009294 76.10 68.24 72.31<br />
Source:<br />
1. Col. 122 to 124: Population Census 2001 PCA.<br />
2. Col. 125 to 127: Computed based on enrolment fi gures of CPI and age group population of Census 2001.<br />
499
Appendix: Statistical Tables<br />
10. Profile of Scheduled Castes and Scheduled Tribes<br />
District<br />
Percentage of SC out-of-school children (6 to less<br />
than 14 years) as per Children Census<br />
Percentage of ST out-of-school children (6 to less<br />
than 14 years) as per Children Census<br />
2002 2002<br />
Children’s<br />
Population<br />
Out-of-school<br />
children<br />
% of out-ofschool<br />
children<br />
Children’s<br />
Population<br />
Out-of-school<br />
children<br />
% of out-ofschool<br />
children<br />
1 128 129 130 131 132 133<br />
1 Bagalkot 53877 8326 15.45 16087 2533 15.75<br />
2 Bangalore Rural 67961 3556 5.23 11496 624 5.43<br />
3 Bangalore Urban 178061 5554 3.12 30481 656 2.15<br />
4 Belgaum 91583 7775 8.49 48013 5345 11.13<br />
5 Bellary 77706 13231 17.03 73325 13533 18.46<br />
6 Bidar 70564 6188 8.77 34868 2669 7.65<br />
7 Bijapur 79571 13181 16.57 4956 664 13.40<br />
8 Chamarajnagar 39291 2478 6.31 17236 1937 11.24<br />
9 Chikmaglur 41466 4158 10.03 7795 633 8.12<br />
10 Chitradurga 64338 6430 9.99 48123 5655 11.75<br />
11 Dakshina Kannada 22001 1225 5.57 11671 360 3.08<br />
12 Davangere 65920 8074 12.25 38677 3956 10.23<br />
13 Dharwad 26519 2327 8.77 13372 1287 9.62<br />
14 Gadag 38149 7143 18.72 25335 5835 23.03<br />
15 Gulbarga 168960 34536 20.44 27424 7428 27.09<br />
16 Hassan 54970 4087 7.44 4972 289 5.81<br />
17 Haveri 34250 4122 12.04 23609 2158 9.14<br />
18 Kodagu 11363 303 2.67 7004 928 13.25<br />
19 Kolar 127815 8368 6.55 44549 2995 6.72<br />
20 Koppal 37782 7955 21.06 29176 5519 18.92<br />
21 Mandya 40801 1635 4.01 2916 165 5.66<br />
22 Mysore 79063 3961 5.01 45700 2921 6.39<br />
23 Raichur 64095 11935 18.62 59730 15978 26.75<br />
24 Shimoga 48629 3918 8.06 11030 720 6.53<br />
25 Tumkur 82206 6332 7.70 32759 2082 6.36<br />
26 Udupi 10626 221 2.08 8061 238 2.95<br />
27 Uttara Kannada 18333 1814 9.89 4102 358 8.73<br />
<strong>Karnataka</strong> 1695900 178833 10.55 682467 87466 12.82<br />
Source: Computed based on data of CPI, <strong>Karnataka</strong>.<br />
500
<strong>Karnataka</strong> <strong>Human</strong> <strong>Development</strong> <strong>Report</strong> <strong>2005</strong><br />
10. Profile of Scheduled Castes and Scheduled Tribes<br />
District<br />
Percentage of SC/ST teachers to all teachers in primary schools<br />
% of SC teachers % of ST teachers<br />
1998-99 2003-04 1998-99 2003-04<br />
1 134 135 136 137<br />
1 Bagalkot 10.35 10.20 3.22 4.94<br />
2 Bangalore Rural 9.59 11.36 1.49 4.02<br />
3 Bangalore Urban 8.37 7.00 1.31 2.18<br />
4 Belgaum 19.43 13.80 3.39 3.47<br />
5 Bellary 11.96 12.89 4.66 6.22<br />
6 Bidar 8.95 16.80 1.26 4.97<br />
7 Bijapur 17.62 17.44 1.10 2.21<br />
8 Chamarajnagar 22.23 28.32 2.53 4.75<br />
9 Chikmaglur 11.37 11.00 1.61 2.83<br />
10 Chitradurga 15.92 16.05 6.14 7.39<br />
11 Dakshina Kannada 12.84 8.91 3.93 3.62<br />
12 Davangere 10.75 11.85 5.98 7.11<br />
13 Dharwad 14.20 11.00 7.39 3.69<br />
14 Gadag 18.39 12.31 7.78 5.39<br />
15 Gulbarga 17.70 12.09 2.39 2.74<br />
16 Hassan 14.84 12.05 2.59 3.00<br />
17 Haveri 13.27 12.02 5.62 5.84<br />
18 Kodagu 11.62 8.77 2.02 2.55<br />
19 Kolar 16.71 15.33 3.89 4.95<br />
20 Koppal 16.58 10.17 14.88 4.80<br />
21 Mandya 17.70 16.42 2.80 3.78<br />
22 Mysore 9.62 12.31 1.37 4.78<br />
23 Raichur 16.93 16.09 4.33 4.70<br />
24 Shimoga 8.76 12.78 2.92 4.48<br />
25 Tumkur 10.13 13.23 3.07 4.93<br />
26 Udupi 8.19 10.14 1.81 2.97<br />
27 Uttara Kannada 3.88 9.71 0.32 1.95<br />
<strong>Karnataka</strong> 12.87 12.64 3.23 4.10<br />
Source: Computed based on data of CPI, <strong>Karnataka</strong>.<br />
501
Appendix: Statistical Tables<br />
10. Profile of Scheduled Castes and Scheduled Tribes<br />
District<br />
SC teachers in primary schools<br />
1998-99 2003-04<br />
Male Female Total % of<br />
Female<br />
Male Female Total % of<br />
Female<br />
1 138 139 140 141 142 143 144 145<br />
1 Bagalkot 475 242 717 33.8 518 238 756 31.5<br />
2 Bangalore Rural 615 293 908 32.3 713 426 1139 37.4<br />
3 Bangalore Urban 563 1133 1696 66.8 484 1060 1544 68.7<br />
4 Belgaum 1254 681 1935 35.2 1575 997 2572 38.8<br />
5 Bellary 687 201 888 22.6 774 305 1079 28.3<br />
6 Bidar 455 248 703 35.3 837 578 1415 40.8<br />
7 Bijapur 1074 372 1446 25.7 1097 471 1568 30.0<br />
8 Chamarajnagar 467 369 836 44.1 608 520 1128 46.1<br />
9 Chikmaglur 494 225 719 31.3 474 253 727 34.8<br />
10 Chitradurga 776 394 1170 33.7 757 457 1214 37.6<br />
11 Dakshina Kannada 423 384 807 47.6 394 302 696 43.4<br />
12 Davangere 535 323 858 37.6 668 365 1033 35.3<br />
13 Dharwad 313 381 694 54.9 272 381 653 58.3<br />
14 Gadag 497 245 742 33.0 351 197 548 35.9<br />
15 Gulbarga 1318 891 2209 40.3 994 610 1604 38.0<br />
16 Hassan 852 521 1373 37.9 805 354 1159 30.5<br />
17 Haveri 507 237 744 31.9 541 266 807 33.0<br />
18 Kodagu 154 116 270 43.0 116 114 230 49.6<br />
19 Kolar 1320 709 2029 34.9 1378 906 2284 39.7<br />
20 Koppal 373 293 666 44.0 347 162 509 31.8<br />
21 Mandya 916 379 1295 29.3 846 475 1321 36.0<br />
22 Mysore 555 310 865 35.8 748 636 1384 46.0<br />
23 Raichur 615 297 912 32.6 707 321 1028 31.2<br />
24 Shimoga 350 208 558 37.3 679 410 1089 37.7<br />
25 Tumkur 954 451 1405 32.1 1149 641 1790 35.8<br />
26 Udupi 136 252 388 64.9 287 222 509 43.6<br />
27 Uttara Kannada 194 101 295 34.2 465 316 781 40.5<br />
<strong>Karnataka</strong> 16872 10256 27128 37.8 18584 11983 30567 39.2<br />
Source: Computed based on data of CPI, <strong>Karnataka</strong>.<br />
502
<strong>Karnataka</strong> <strong>Human</strong> <strong>Development</strong> <strong>Report</strong> <strong>2005</strong><br />
10. Profile of Scheduled Castes and Scheduled Tribes<br />
District<br />
ST teachers in primary schools<br />
1998-99 2003-04<br />
Male Female Total % of Female Male Female Total % of Female<br />
1 146 147 148 149 150 151 152 153<br />
1 Bagalkot 149 74 223 33.2 248 118 366 32.2<br />
2 Bangalore Rural 74 67 141 47.5 262 141 403 35.0<br />
3 Bangalore Urban 120 145 265 54.7 134 347 481 72.1<br />
4 Belgaum 277 61 338 18.0 381 266 647 41.1<br />
5 Bellary 225 121 346 35.0 295 226 521 43.4<br />
6 Bidar 68 31 99 31.3 271 148 419 35.3<br />
7 Bijapur 60 30 90 33.3 132 67 199 33.7<br />
8 Chamarajnagar 56 39 95 41.1 109 80 189 42.3<br />
9 Chikmaglur 73 29 102 28.4 128 59 187 31.6<br />
10 Chitradurga 291 160 451 35.5 347 212 559 37.9<br />
11 Dakshina Kannada 145 102 247 41.3 165 118 283 41.7<br />
12 Davangere 315 162 477 34.0 416 204 620 32.9<br />
13 Dharwad 178 183 361 50.7 108 111 219 50.7<br />
14 Gadag 226 88 314 28.0 153 87 240 36.3<br />
15 Gulbarga 194 104 298 34.9 264 100 364 27.5<br />
16 Hassan 167 73 240 30.4 174 115 289 39.8<br />
17 Haveri 233 82 315 26.0 256 136 392 34.7<br />
18 Kodagu 29 18 47 38.3 28 39 67 58.2<br />
19 Kolar 331 141 472 29.9 435 303 738 41.1<br />
20 Koppal 354 244 598 40.8 169 71 240 29.6<br />
21 Mandya 152 53 205 25.9 176 128 304 42.1<br />
22 Mysore 74 49 123 39.8 313 224 537 41.7<br />
23 Raichur 137 96 233 41.2 217 83 300 27.7<br />
24 Shimoga 110 76 186 40.9 217 165 382 43.2<br />
25 Tumkur 273 153 426 35.9 370 297 667 44.5<br />
26 Udupi 38 48 86 55.8 95 54 149 36.2<br />
27 Uttara Kannada 16 8 24 33.3 81 76 157 48.4<br />
<strong>Karnataka</strong> 4365 2437 6802 35.8 5944 3975 9919 40.1<br />
Source: Computed based on data of CPI, <strong>Karnataka</strong>.<br />
503
Appendix: Statistical Tables<br />
10. Profile of Scheduled Castes and Scheduled Tribes<br />
District<br />
Work participation rate of SCs<br />
1991 2001<br />
Total Total Rural Urban<br />
Persons Persons Male Female Persons Male Female Persons Male Female<br />
1 154 155 156 157 158 159 160 161 162 163<br />
1 Bagalkot 39.9 44.3 50.2 38.5 47.1 51.1 43.2 34.6 47.0 22.3<br />
2 Bangalore Rural 44.3 47.9 56.6 39.0 49.4 57.2 41.3 39.4 52.9 25.3<br />
3 Bangalore Urban 34.2 39.1 54.2 23.3 44.0 56.3 31.2 37.6 53.5 20.9<br />
4 Belgaum 42.8 45.2 53.4 36.7 48.3 55.0 41.5 32.8 47.4 18.0<br />
5 Bellary 48.1 47.9 52.1 43.7 51.5 53.1 49.8 38.6 49.4 27.5<br />
6 Bidar 44.2 41.1 46.4 35.5 43.0 47.5 38.3 29.2 39.9 17.6<br />
7 Bijapur 39.0 40.3 46.6 33.6 42.2 47.4 36.8 30.4 42.6 17.5<br />
8 Chamarajnagar 44.3 45.9 56.4 34.9 47.6 57.7 37.1 34.1 47.6 19.6<br />
9 Chikmaglur 50.7 50.2 57.7 42.6 52.2 58.7 45.7 36.5 51.2 21.3<br />
10 Chitradurga 47.8 48.4 54.1 42.4 50.8 55.3 46.1 31.5 45.6 16.6<br />
11 Dakshina Kannada 52.7 58.1 61.5 54.5 60.7 63.1 58.3 49.9 56.7 43.2<br />
12 Davangere 43.8 48.1 54.7 41.2 50.9 56.2 45.5 34.5 47.7 20.2<br />
13 Dharwad 38.9 43.2 52.5 33.6 56.5 60.1 52.9 33.7 47.0 19.9<br />
14 Gadag 43.6 49.3 53.3 45.2 53.0 55.5 50.5 39.0 47.2 30.5<br />
15 Gulbarga 46.1 45.5 49.8 40.9 49.5 52.4 46.6 29.8 40.4 18.3<br />
16 Hassan 46.8 51.4 58.0 44.8 53.8 59.3 48.3 33.5 48.8 17.7<br />
17 Haveri 48.6 51.2 56.7 45.5 53.5 57.8 49.0 35.8 48.7 22.5<br />
18 Kodagu 52.8 54.7 60.4 49.1 56.9 61.5 52.4 38.7 52.5 24.7<br />
19 Kolar 46.0 49.1 55.9 42.2 54.1 58.6 49.5 29.5 45.3 13.5<br />
20 Koppal 49.3 47.6 51.3 43.8 49.6 52.1 47.0 35.6 46.6 24.6<br />
21 Mandya 45.4 47.0 56.6 37.4 49.4 58.3 40.4 34.6 47.9 21.0<br />
22 Mysore 38.4 43.3 55.3 30.9 47.2 57.8 36.2 32.1 48.1 15.3<br />
23 Raichur 43.7 45.4 50.7 40.0 49.0 52.4 45.6 32.3 44.6 19.7<br />
24 Shimoga 44.7 47.4 57.4 37.1 51.1 58.9 43.1 36.7 52.9 20.3<br />
25 Tumkur 50.1 51.9 58.3 45.2 54.3 59.5 48.9 36.0 50.9 20.0<br />
26 Udupi 46.1 49.9 57.5 42.5 50.6 57.4 43.9 46.7 57.9 35.6<br />
27 Uttara Kannada 41.8 44.7 56.8 32.5 48.9 59.4 38.3 35.2 50.8 19.4<br />
<strong>Karnataka</strong> 44.7 46.3 54.0 38.4 50.1 55.7 44.3 35.1 49.2 20.5<br />
Sources:<br />
1. Col. 154: Computed for 27 districts based on taluk-wise data of Primary Census Abstract SC and ST Part II - B (ii) - 1991.<br />
2. Col. 155 to 163: Primary Census Abstract 2001.<br />
504
<strong>Karnataka</strong> <strong>Human</strong> <strong>Development</strong> <strong>Report</strong> <strong>2005</strong><br />
10. Profile of Scheduled Castes and Scheduled Tribes<br />
District<br />
Work participation rate of STs<br />
1991 2001<br />
Total Total Rural Urban<br />
Persons Persons Male Female Persons Male Female Persons Male Female<br />
1 164 165 166 167 168 169 170 171 172 173<br />
1 Bagalkot 46.0 48.9 54.9 43.0 50.8 55.8 45.8 35.8 48.6 22.9<br />
2 Bangalore Rural 45.5 49.6 58.4 40.2 50.5 58.7 42.0 42.2 56.3 26.8<br />
3 Bangalore Urban 35.3 41.2 57.2 23.7 47.7 59.4 35.3 39.5 56.7 20.6<br />
4 Belgaum 45.9 49.9 55.6 44.2 52.3 56.5 48.1 33.4 49.4 16.9<br />
5 Bellary 49.6 49.7 54.9 44.4 52.7 55.7 49.7 39.6 52.4 26.7<br />
6 Bidar 47.0 42.3 49.5 34.6 43.2 50.0 36.1 28.9 42.9 13.7<br />
7 Bijapur 44.9 41.6 50.7 32.0 43.1 51.5 34.1 29.0 43.7 13.9<br />
8 Chamarajnagar 43.4 47.8 61.1 34.4 49.6 61.7 37.3 40.7 58.7 23.0<br />
9 Chikmaglur 51.5 50.5 59.2 41.8 51.8 59.5 44.0 38.4 56.0 19.6<br />
10 Chitradurga 31.1 49.3 56.1 42.1 51.4 56.9 45.5 32.9 49.5 15.2<br />
11 Dakshina Kannada 48.2 57.5 63.4 51.6 59.3 64.3 54.2 46.2 57.5 34.0<br />
12 Davangere 48.4 49.5 58.2 40.3 51.9 59.5 44.0 36.8 51.8 20.8<br />
13 Dharwad 43.3 49.9 57.7 41.7 57.5 61.8 52.9 37.1 50.6 22.9<br />
14 Gadag 49.8 51.5 56.3 46.6 54.0 57.9 50.0 38.4 47.8 28.4<br />
15 Gulbarga 48.6 48.0 53.3 42.6 50.1 54.4 45.6 33.8 45.3 21.9<br />
16 Hassan 46.7 52.6 61.5 43.7 54.0 62.1 45.9 37.7 54.7 18.6<br />
17 Haveri 46.9 50.9 58.3 43.0 52.2 58.9 44.9 37.7 51.4 23.0<br />
18 Kodagu 58.4 61.1 64.9 57.3 61.7 65.2 58.2 40.0 54.2 24.9<br />
19 Kolar 50.1 54.4 59.7 49.0 55.8 60.3 51.1 38.2 53.0 22.6<br />
20 Koppal 51.7 49.6 53.4 45.8 50.7 53.7 47.7 35.1 49.4 20.7<br />
21 Mandya 47.7 49.5 60.0 38.7 52.1 60.5 43.4 39.8 58.3 22.1<br />
22 Mysore 41.5 46.6 59.7 33.2 48.4 60.5 36.2 37.6 55.7 19.2<br />
23 Raichur 48.3 49.1 54.7 43.4 50.1 55.1 45.0 38.1 49.9 25.8<br />
24 Shimoga 42.3 46.6 58.0 34.9 49.4 59.1 39.5 36.8 54.3 18.7<br />
25 Tumkur 50.1 53.6 60.7 46.3 55.8 61.6 49.7 38.5 54.3 21.6<br />
26 Udupi 46.5 50.4 58.9 42.2 51.5 59.1 44.0 44.0 57.3 31.3<br />
27 Uttara Kannada 38.6 44.8 56.7 32.6 47.6 58.4 36.8 33.5 50.4 16.0<br />
<strong>Karnataka</strong> 47.8 49.4 58.3 41.7 51.5 57.6 45.3 37.6 52.6 21.9<br />
Sources:<br />
1. Col. 164: Computed for 27 districts based on taluk-wise data of Primary Census Abstract SC and ST Part II - B (ii) - 1991.<br />
2. Col. 165 to 173: Primary Census Abstract 2001.<br />
505
Appendix: Statistical Tables<br />
10. Profile of Scheduled Castes and Scheduled Tribes<br />
District<br />
Percentage distribution of census houses according to<br />
Type - SCs<br />
Percentage distribution of census houses according to<br />
Type - STs<br />
2001 2001<br />
All areas<br />
All areas<br />
Permanent Semi-permanent Temporary Un-classified Permanent Semi-permanent Temporary Un-classified<br />
1 174 175 176 177 178 179 180 181<br />
1 Bagalkot 31.25 58.59 10.11 0.04 19.19 71.62 9.16 0.04<br />
2 Bangalore Rural 74.29 20.39 5.31 0.01 83.99 11.83 4.18 0.01<br />
3 Bangalore Urban 48.23 37.02 14.74 0.01 49.24 32.23 18.49 0.05<br />
4 Belgaum 59.13 33.51 7.34 0.02 56.19 35.67 8.13 0.01<br />
5 Bellary 41.01 28.77 30.18 0.05 30.26 36.20 33.52 0.02<br />
6 Bidar 77.82 18.69 3.42 0.07 74.36 23.07 2.44 0.13<br />
7 Bijapur 30.45 59.29 10.16 0.10 27.04 59.42 13.54 0.00<br />
8 Chamarajnagar 46.73 43.64 9.58 0.04 41.07 41.93 16.92 0.07<br />
9 Chikmaglur 32.86 56.55 10.54 0.05 40.24 50.08 9.66 0.03<br />
10 Chitradurga 49.16 33.11 17.66 0.07 46.57 38.33 15.06 0.05<br />
11 Dakshina Kannada 27.00 56.85 16.07 0.08 26.10 63.71 10.19 0.00<br />
12 Davangere 55.50 34.04 10.43 0.03 54.38 36.71 8.88 0.03<br />
13 Dharwad 51.83 37.88 10.28 0.00 39.14 40.44 20.39 0.03<br />
14 Gadag 49.78 30.30 19.90 0.02 31.08 40.13 28.74 0.05<br />
15 Gulbarga 63.28 30.82 5.86 0.04 36.22 51.54 12.21 0.03<br />
16 Hassan 22.90 71.64 5.43 0.03 29.73 65.29 4.98 0.00<br />
17 Haveri 52.93 40.49 6.56 0.02 37.71 51.46 10.81 0.03<br />
18 Kodagu 39.28 55.67 5.05 0.00 32.62 53.25 14.11 0.01<br />
19 Kolar 62.01 23.47 14.51 0.01 60.22 22.62 17.16 0.01<br />
20 Koppal 30.53 33.70 35.68 0.09 18.06 40.56 41.34 0.04<br />
21 Mandya 53.31 31.70 14.97 0.02 49.53 29.68 20.74 0.05<br />
22 Mysore 44.03 48.61 7.35 0.01 37.90 50.59 11.49 0.02<br />
23 Raichur 23.96 41.85 34.16 0.04 10.59 48.60 40.79 0.03<br />
24 Shimoga 38.70 50.09 11.21 0.00 40.22 48.35 11.43 0.00<br />
25 Tumkur 59.15 25.15 15.55 0.15 54.97 25.91 19.06 0.05<br />
26 Udupi 35.71 50.21 14.04 0.04 27.90 58.37 13.72 0.01<br />
27 Uttara Kannada 50.17 41.45 8.36 0.01 35.27 50.46 14.26 0.00<br />
<strong>Karnataka</strong> 51.09 36.65 12.22 0.04 43.70 39.02 17.25 0.03<br />
Source: Primary Census Abstract 2001, (Housing Tables: SC and ST).<br />
506
<strong>Karnataka</strong> <strong>Human</strong> <strong>Development</strong> <strong>Report</strong> <strong>2005</strong><br />
10. Profile of Scheduled Castes and Scheduled Tribes<br />
District<br />
Percentage distribution of census houses<br />
according to Type - SCs<br />
Percentage distribution of census houses<br />
according to Type - STs<br />
2001 2001<br />
Rural<br />
Rural<br />
Permanent Semi-permanent Temporary Un-classified Permanent Semi-permanent Temporary Un-classified<br />
1 182 183 184 185 186 187 188 189<br />
1 Bagalkot 25.88 63.21 10.87 0.04 55.36 35.69 8.95 0.01<br />
2 Bangalore Rural 59.60 34.98 5.42 0.00 15.50 74.89 9.61 0.01<br />
3 Bangalore Urban 46.16 38.87 14.96 0.01 17.24 66.97 15.79 0.00<br />
4 Belgaum 58.03 33.58 8.38 0.01 27.82 58.46 13.71 0.01<br />
5 Bellary 39.74 30.06 30.16 0.04 74.10 23.18 2.58 0.14<br />
6 Bidar 77.53 18.79 3.62 0.06 8.38 49.85 41.75 0.02<br />
7 Bijapur 23.58 65.53 10.87 0.03 15.87 42.16 41.93 0.04<br />
8 Chamarajnagar 44.26 45.71 9.98 0.05 29.30 41.44 29.22 0.04<br />
9 Chikmaglur 29.84 58.93 11.17 0.06 24.99 44.07 30.89 0.05<br />
10 Chitradurga 47.88 34.37 17.70 0.05 29.67 52.96 17.38 0.00<br />
11 Dakshina Kannada 19.05 61.60 19.25 0.10 35.58 53.09 11.30 0.03<br />
12 Davangere 54.80 33.80 11.37 0.02 25.58 39.78 34.61 0.02<br />
13 Dharwad 39.63 43.80 16.57 0.01 44.32 40.55 15.09 0.03<br />
14 Gadag 51.97 28.92 19.10 0.02 52.59 37.64 9.74 0.03<br />
15 Gulbarga 57.33 35.94 6.69 0.04 31.45 54.22 14.34 0.00<br />
16 Hassan 19.04 75.34 5.58 0.03 23.96 60.75 15.28 0.01<br />
17 Haveri 52.65 40.56 6.77 0.02 36.72 52.55 10.70 0.03<br />
18 Kodagu 37.03 57.64 5.33 0.00 51.75 27.55 20.66 0.04<br />
19 Kolar 56.84 25.91 17.24 0.01 57.67 23.76 18.57 0.01<br />
20 Koppal 28.53 34.65 36.71 0.11 66.65 24.63 8.72 0.00<br />
21 Mandya 51.04 34.62 14.33 0.02 44.76 35.39 19.80 0.05<br />
22 Mysore 35.55 56.62 7.82 0.01 47.28 34.54 18.13 0.06<br />
23 Raichur 16.74 46.68 36.56 0.03 21.64 73.01 5.35 0.00<br />
24 Shimoga 31.78 54.29 13.93 0.00 20.07 68.75 11.18 0.00<br />
25 Tumkur 57.88 25.56 16.39 0.17 31.58 53.88 14.54 0.01<br />
26 Udupi 32.57 52.55 14.85 0.03 31.49 55.95 12.54 0.02<br />
27 Uttara Kannada 46.82 42.99 10.17 0.01 38.21 43.47 18.23 0.09<br />
<strong>Karnataka</strong> 45.12 41.18 13.66 0.04 37.25 43.44 19.28 0.03<br />
Source: Primary Census Abstract 2001, (Housing Tables: SC and ST).<br />
507
Appendix: Statistical Tables<br />
10. Profile of Scheduled Castes and Scheduled Tribes<br />
District<br />
Percentage distribution of census houses<br />
according to Type - SCs<br />
Percentage distribution of census houses<br />
according to Type - STs<br />
2001 2001<br />
Urban<br />
Urban<br />
Permanent Semi-permanent Temporary Un-classified Permanent Semi-permanent Temporary Un-classified<br />
1 190 191 192 193 194 195 196 197<br />
1 Bagalkot 49.15 43.19 7.61 0.05 60.76 35.59 3.65 0.00<br />
2 Bangalore Rural 78.29 16.43 5.28 0.01 37.52 55.36 6.90 0.21<br />
3 Bangalore Urban 61.59 25.08 13.33 0.00 70.55 25.89 3.56 0.00<br />
4 Belgaum 63.43 33.25 3.29 0.04 70.59 23.20 6.08 0.13<br />
5 Bellary 44.31 25.40 30.23 0.06 76.56 22.20 1.24 0.00<br />
6 Bidar 79.68 18.03 2.14 0.15 30.23 37.50 32.22 0.05<br />
7 Bijapur 65.44 27.55 6.57 0.44 40.36 24.24 35.36 0.04<br />
8 Chamarajnagar 65.24 28.15 6.61 0.00 39.76 33.76 26.37 0.11<br />
9 Chikmaglur 55.84 38.42 5.72 0.02 57.48 35.74 6.78 0.00<br />
10 Chitradurga 58.12 24.27 17.40 0.21 51.74 43.14 5.12 0.00<br />
11 Dakshina Kannada 54.30 40.54 5.16 0.00 58.06 35.80 6.15 0.00<br />
12 Davangere 59.14 35.23 5.57 0.06 44.10 25.62 30.28 0.01<br />
13 Dharwad 60.47 33.69 5.84 0.00 62.66 22.35 14.85 0.15<br />
14 Gadag 43.86 34.05 22.08 0.01 62.77 32.34 4.85 0.04<br />
15 Gulbarga 87.90 9.68 2.40 0.03 62.30 33.58 4.12 0.00<br />
16 Hassan 55.77 40.09 4.13 0.01 52.87 43.30 3.83 0.00<br />
17 Haveri 54.86 39.99 5.16 0.00 64.43 33.10 2.47 0.00<br />
18 Kodagu 60.77 36.82 2.41 0.00 75.54 15.41 8.88 0.17<br />
19 Kolar 83.63 13.29 3.06 0.02 82.74 12.53 4.73 0.00<br />
20 Koppal 42.66 27.96 29.38 0.00 86.20 10.19 3.60 0.01<br />
21 Mandya 67.38 13.64 18.96 0.01 73.49 15.11 11.40 0.00<br />
22 Mysore 69.72 24.34 5.94 0.00 55.37 17.07 27.51 0.05<br />
23 Raichur 49.21 24.96 25.77 0.06 69.81 27.04 3.15 0.00<br />
24 Shimoga 59.98 37.18 2.84 0.00 60.74 34.76 4.50 0.00<br />
25 Tumkur 68.34 22.15 9.45 0.06 64.84 34.07 1.10 0.00<br />
26 Udupi 53.05 37.26 9.58 0.11 64.51 28.35 7.14 0.00<br />
27 Uttara Kannada 58.31 37.72 3.95 0.02 53.11 35.48 11.41 0.00<br />
<strong>Karnataka</strong> 68.83 23.17 7.96 0.04 66.91 23.10 9.97 0.03<br />
Source: Primary Census Abstract 2001, (Housing Tables: SC and ST).<br />
508
<strong>Karnataka</strong> <strong>Human</strong> <strong>Development</strong> <strong>Report</strong> <strong>2005</strong><br />
10. Profile of Scheduled Castes and Scheduled Tribes<br />
District<br />
Percentage of households having access to safe drinking water<br />
2001<br />
SCs<br />
STs<br />
Total Rural Urban Total Rural Urban<br />
1 198 199 200 201 202 203<br />
1 Bagalkot 90.60 89.25 95.08 87.56 85.94 95.60<br />
2 Bangalore Rural 97.90 97.97 97.43 96.74 96.47 98.20<br />
3 Bangalore Urban 96.34 97.70 95.97 95.08 96.92 94.85<br />
4 Belgaum 81.16 79.40 88.05 75.94 74.19 85.56<br />
5 Bellary 94.85 94.12 96.76 92.47 91.32 95.88<br />
6 Bidar 82.73 84.40 72.19 80.80 82.83 63.79<br />
7 Bijapur 85.63 84.56 91.10 80.50 78.24 90.54<br />
8 Chamarajnagar 96.20 95.70 99.98 91.41 89.62 98.95<br />
9 Chikmaglur 83.20 81.08 99.27 72.02 68.37 97.04<br />
10 Chitradurga 98.89 98.79 99.61 98.14 97.92 99.67<br />
11 Dakshina Kannada 48.07 39.32 78.15 28.67 22.23 65.66<br />
12 Davangere 96.54 96.83 95.06 95.53 95.11 97.51<br />
13 Dharwad 87.71 78.88 93.95 84.28 75.97 95.04<br />
14 Gadag 90.56 88.01 97.48 82.72 80.12 95.44<br />
15 Gulbarga 84.45 82.13 94.06 77.91 74.42 92.18<br />
16 Hassan 92.48 91.75 98.70 93.31 92.20 98.80<br />
17 Haveri 98.43 98.58 97.46 97.21 98.34 86.33<br />
18 Kodagu 63.28 60.31 91.67 39.89 38.40 85.71<br />
19 Kolar 97.76 97.88 97.24 96.70 96.75 96.26<br />
20 Koppal 95.30 94.69 98.98 91.84 91.27 97.61<br />
21 Mandya 96.85 96.61 98.32 92.42 90.70 96.88<br />
22 Mysore 96.50 95.46 99.66 90.50 88.54 98.63<br />
23 Raichur 81.32 76.91 96.72 73.93 72.08 90.39<br />
24 Shimoga 83.30 79.98 93.48 82.59 77.84 94.56<br />
25 Tumkur 97.98 97.87 98.76 96.14 95.90 97.68<br />
26 Udupi 39.66 38.68 45.11 20.67 18.72 33.01<br />
27 Uttara Kannada 50.84 44.03 67.39 48.24 39.72 73.26<br />
<strong>Karnataka</strong> 90.26 88.79 94.64 86.00 83.90 93.53<br />
Source: Primary Census Abstract 2001, (Housing Tables: SC and ST).<br />
509
Appendix: Statistical Tables<br />
10. Profile of Scheduled Castes and Scheduled Tribes<br />
District<br />
Percentage of households having access to electricity<br />
2001<br />
SCs<br />
STs<br />
Total Rural Urban Total Rural Urban<br />
1 204 205 206 207 208 209<br />
1 Bagalkot 68.73 70.94 61.35 59.97 58.28 68.35<br />
2 Bangalore Rural 77.01 76.87 77.93 78.89 77.07 88.77<br />
3 Bangalore Urban 86.72 80.41 88.44 88.94 81.67 89.87<br />
4 Belgaum 72.03 70.06 79.77 63.95 61.51 77.35<br />
5 Bellary 60.27 55.82 71.86 61.59 57.83 72.72<br />
6 Bidar 62.65 60.17 78.28 66.80 65.20 80.21<br />
7 Bijapur 68.12 66.97 74.00 62.01 58.06 79.56<br />
8 Chamarajnagar 59.87 57.48 77.78 51.62 46.86 71.66<br />
9 Chikmaglur 63.21 61.62 75.30 59.12 55.87 81.44<br />
10 Chitradurga 67.23 66.21 74.41 70.26 68.91 79.99<br />
11 Dakshina Kannada 39.23 29.81 71.61 46.84 41.37 78.28<br />
12 Davangere 67.54 65.77 76.70 72.21 70.33 81.08<br />
13 Dharwad 74.20 76.01 72.92 71.80 73.55 69.53<br />
14 Gadag 67.67 69.24 63.41 72.51 73.45 67.95<br />
15 Gulbarga 59.13 54.26 79.26 49.27 42.63 76.49<br />
16 Hassan 70.16 68.75 82.18 74.35 71.74 87.28<br />
17 Haveri 61.55 60.41 69.40 67.74 67.07 74.22<br />
18 Kodagu 51.77 48.85 79.70 28.81 27.07 82.42<br />
19 Kolar 76.54 74.52 85.02 77.17 75.79 89.34<br />
20 Koppal 57.80 57.77 57.95 56.03 55.19 64.60<br />
21 Mandya 68.60 67.88 73.02 60.80 61.09 60.05<br />
22 Mysore 67.54 61.43 86.04 60.26 54.52 84.09<br />
23 Raichur 56.09 52.99 66.90 46.51 45.49 55.52<br />
24 Shimoga 67.47 63.36 80.12 68.75 63.34 82.38<br />
25 Tumkur 66.70 65.29 76.91 71.33 69.18 85.10<br />
26 Udupi 51.17 47.44 71.79 43.55 38.82 73.52<br />
27 Uttara Kannada 74.09 71.25 80.99 70.77 67.73 79.69<br />
<strong>Karnataka</strong> 68.51 64.47 80.51 64.69 60.27 80.60<br />
Source: Primary Census Abstract 2001, (Housing Tables: SC and ST).<br />
510
<strong>Karnataka</strong> <strong>Human</strong> <strong>Development</strong> <strong>Report</strong> <strong>2005</strong><br />
10. Profile of Scheduled Castes and Scheduled Tribes<br />
District<br />
Percentage of households having access to toilets<br />
2001<br />
SCs<br />
STs<br />
Total Rural Urban Total Rural Urban<br />
1 210 211 212 213 214 215<br />
1 Bagalkot 9.89 6.68 20.60 8.18 5.02 23.89<br />
2 Bangalore Rural 19.63 13.51 59.16 26.10 16.57 77.70<br />
3 Bangalore Urban 60.66 21.73 71.25 78.61 32.09 84.54<br />
4 Belgaum 10.75 4.73 34.39 8.72 4.23 33.39<br />
5 Bellary 15.27 9.32 30.77 14.98 8.87 33.08<br />
6 Bidar 10.78 5.88 41.68 10.75 5.91 51.31<br />
7 Bijapur 6.95 2.82 27.96 9.89 3.10 40.05<br />
8 Chamarajnagar 14.49 10.55 43.98 10.90 6.82 28.10<br />
9 Chikmaglur 22.11 17.59 56.39 29.15 23.19 70.08<br />
10 Chitradurga 10.30 5.44 44.27 11.48 6.32 48.51<br />
11 Dakshina Kannada 29.25 20.05 60.85 34.44 28.39 69.23<br />
12 Davangere 15.38 8.98 48.66 16.25 9.32 48.82<br />
13 Dharwad 34.45 8.21 53.00 25.91 8.49 48.48<br />
14 Gadag 9.74 4.91 22.85 8.33 4.62 26.42<br />
15 Gulbarga 10.61 3.72 39.12 12.50 5.04 43.05<br />
16 Hassan 13.76 9.26 52.19 21.69 12.02 69.61<br />
17 Haveri 12.56 8.03 43.66 13.09 9.63 46.28<br />
18 Kodagu 38.61 36.94 54.58 29.96 29.03 58.52<br />
19 Kolar 19.20 11.96 49.46 17.69 12.32 65.08<br />
20 Koppal 7.67 5.95 18.12 6.96 4.92 27.74<br />
21 Mandya 19.99 13.52 60.06 22.52 13.87 44.98<br />
22 Mysore 29.74 12.48 82.01 22.02 10.49 69.88<br />
23 Raichur 9.36 4.29 27.08 4.82 3.19 19.27<br />
24 Shimoga 27.51 18.50 55.22 34.26 22.38 64.18<br />
25 Tumkur 14.61 9.20 53.66 17.68 11.21 59.11<br />
26 Udupi 33.69 29.71 55.68 24.96 19.37 60.37<br />
27 Uttara Kannada 21.55 12.99 42.35 19.36 11.97 41.06<br />
<strong>Karnataka</strong> 21.18 9.99 54.46 20.26 9.68 58.31<br />
Source: Primary Census Abstract 2001, (Housing Tables: SC and ST).<br />
511
Technical Note - Computing Indices<br />
I. Computing the <strong>Human</strong> <strong>Development</strong> Index (HDI)<br />
The methodology followed in computation of HDI for the districts and the state of <strong>Karnataka</strong> is more or<br />
less similar to the one used by UNDP in its recent <strong>Human</strong> <strong>Development</strong> <strong>Report</strong>s (1999 onwards). The<br />
HDI is a composite index, consisting of three indicators: longevity as measured by life expectancy at birth<br />
(LEB); education attainment as measured by a combination of literacy rate (UNDP adopts adult literacy<br />
rate) with two-third weight and combined primary and secondary enrolment ratio with one-third weight<br />
(whereas UNDP uses combined enrolment ratio of primary, secondary and tertiary education levels) and<br />
standard of living as measured by the real GDP per capita expressed as PPP$ (in Purchasing Power<br />
Parity dollars). For the construction of the index, minimum and maximum values have been fi xed for<br />
each of these indicators and they are as follows:<br />
Life expectancy at birth: 25 years and 85 years;<br />
Adult literacy rate: 0 per cent and 100 per cent;<br />
Combined gross enrolment ratio: 0 per cent and 100 per cent;<br />
Real GDP per capita (PPP$): $100 and $40,000 (PPP$).<br />
For each component of the HDI, the individual index was computed on the basis of the following<br />
formula:<br />
Actual X i<br />
value - minimum X i<br />
value<br />
Index =<br />
Maximum X i<br />
Value - minimum X i<br />
value<br />
The HDI value of the j th district (I j<br />
) for the i th variable is defi ned as the average of these variables. The<br />
HDR assigns equal weight to each of the dimensions included in the human development index, as each<br />
component is equally important for a meaningful evaluation of an individual’s well being.<br />
I j<br />
= ∑I ij<br />
/ 3 i=1, 2, 3 j= 1 to 27 district<br />
Treatment of income<br />
The construction of the income index is a little more complex. Over the years, the HDR has used a particular<br />
formula, known as Atkinson’s formula. The basic approach in the treatment of income has been driven by<br />
the fact that achieving a respectable level of human development does not require unlimited income.<br />
In many cases, income loses its relevance as a proxy for all dimensions of human development other<br />
than a long and healthy life and knowledge. In HDR 1999, a thorough review of the treatment of income<br />
in the HDI was done, based on the work of Anand and Sen. This refi nement in the treatment of income<br />
attempts to rectify this problem by putting the methodology on a more solid analytical foundation. The<br />
income is treated by using the following formula:<br />
W(y) =<br />
Log y – Log y min<br />
Log y max<br />
– Log y min<br />
For the computation of the income index for the districts, per capita district GDP has been converted to its<br />
PPP$ equivalent by taking the ratio of per capita district GDP to that of the country in rupees (Rs.12,215)<br />
and multiplying this by the per capita GDP for the country in PPP$ ($ 2,670 for 2001-02).<br />
513
Technical Note - Computing Indices<br />
Per capita GDP for <strong>Karnataka</strong> (2001-02) at constant prices = Rs.13,057<br />
Per capita GDP for India (2001-02) at constant prices = Rs.12,215<br />
Per capita GDP for India (2001-02) in PPP$ = $ 2,670<br />
Real District GDP per capita in PPP$ =<br />
PC GDP of District in Rs.<br />
PC GDP of India in Rs.<br />
X PC GDP of India in PPP$<br />
Log (Real District GDP) – Log 100<br />
Then Income Index =<br />
Log 40,000 – Log 100<br />
Illustration of the HDI methodology<br />
The construction of HDI is illustrated with the help of <strong>Karnataka</strong> state statistics.<br />
(i) Life expectancy index or health index =<br />
65.80 - 25<br />
= 0.680<br />
85 - 25<br />
Literacy index =<br />
66.64 - 0<br />
= 0.670<br />
100 - 0<br />
(ii) Combined gross enrolment ratio =<br />
80.28 - 0<br />
= 0.803<br />
100 - 0<br />
Education index = 2/3 (literacy index + 1/3 (combined gross enrolment ratio)<br />
= 2/3 (0.670) + 1/3 (0.803) = 0.712<br />
Log 2,854 - Log 100<br />
(iii) Adjusted real GDP Per capita (PPP$) index = = 0.559<br />
Log 40,000 - Log 100<br />
HDI for <strong>Karnataka</strong> = (0.680+0.712+0.559) / 3 = 0.650<br />
II Computing Gender Related <strong>Development</strong> Index<br />
The GDI uses the same variables as the HDI but adjusts the average achievement of each district in<br />
life expectancy, educational attainment and income in accordance with disparities in the achievement<br />
between women and men. The discounting is done with respect to aversion to gender inequality.<br />
Moderate gender aversion is represented in the index by the epsilon ε which takes the value of 2 in the<br />
construction of the GDI. The epsilon is the harmonic mean of male and female values.<br />
Computation of the GDI is based on computation of the equally distributed index of life expectancy at birth,<br />
the equally distributed index of educational attainment and the equally distributed index of income. The<br />
GDI is the average of these three equally distributed indices and takes a value between 0 and 1.<br />
The UNDP has selected maximum and minimum values for life expectancy, taking into account the fact<br />
that women tend to live longer than men. For women, the maximum value is taken as 87.5 years and<br />
minimum value 27.5 years, for men the corresponding values are 82.5 years and 22.5 years. The same<br />
maximum and minimum values are used in computing the GDI at the district level.<br />
Variables for the educational attainment index include the combined literacy rate with two-thirds weight<br />
and the combined enrolment ratio (primary and secondary levels i.e. class I to XII ) with one-third weight as<br />
in the case of the HDI. Each of these indices has a maximum value of 100 and a minimum value of 0.<br />
514
<strong>Karnataka</strong> <strong>Human</strong> <strong>Development</strong> <strong>Report</strong> <strong>2005</strong><br />
Calculating the index for income is fairly complex. For computing the income index, female and male<br />
shares in earned income are arrived at from data about the ratio of the average female wage to the<br />
average male wage and the female and male percentages of economically active population. Before the<br />
income index is calculated, the average adjusted real GDP per capita of a district is discounted on the<br />
basis of disparities in female and male shares of earned income in proportion to female and male shares<br />
of the population.<br />
Here, we attempt to construct the GDI for the districts in <strong>Karnataka</strong> to evaluate the average achievement of<br />
each district in accordance with disparities in achievement between women and men. The sources of data<br />
at the district level for computing the values of index are the same as those used in computing HDI.<br />
Illustration of the GDI methodology<br />
Computation of GDI for <strong>Karnataka</strong> is as shown below. The value of inequality aversion ε is taken as 2.<br />
Percentage share of total population : Female = 49.10 Male = 50.90<br />
Life expectancy at birth (years) : Female = 67.00 Male = 64.50<br />
Literacy rate (%) : Female = 56.87 Male = 76.10<br />
Combined gross enrolment ratio : Female = 77.65 Male = 82.77<br />
Share in economically active population : Female = 35.26 Male = 64.74<br />
Agricultural wage rates : Female = 35.15 Male = 54.07<br />
STEP ONE<br />
Computing the equally distributed life expectancy index<br />
LEB Index: Female (67.0 – 27.50) / (87.50 – 27.50) = 0.66<br />
Male (64.5 – 22.50) / (82.50 – 27.50) = 0.70<br />
The equally distributed life expectancy index = [(female population share) × (female LEB index) -1 +<br />
(male population share) × (male LEB index) -1 ] -1<br />
= [ 0.491(0.660) -1 + 0.509(0.700) -1 ] -1 = 0.679<br />
STEP TWO<br />
Computing the equally distributed educational attainment index<br />
Literacy index: Female<br />
56.87 - 0<br />
= 0.569, Male<br />
76.10 - 0<br />
= 0.761<br />
100 - 0 100 - 0<br />
Combined gross enrolment ratio: Female<br />
77.65 - 0<br />
= 0.776, Male<br />
82.77 - 0<br />
= 0.828<br />
100 - 0 100 - 0<br />
Educational attainment index =2/3(Literacy index)+1/3(combined enrolment Index)<br />
Female = 2/3(0.569)+1/3(0.776) = 0.638<br />
Male = 2/3(0.761)+1/3(0.828) = 0.783<br />
The equally distributed educational attainment index<br />
= [(female population share) × (female educational attainment index) -1 +<br />
(male population share) × (male educational attainment index) -1 ] -1<br />
= [0.491(0.638) -1 + 0.509(0.783) -1 ] -1 = 0.704<br />
515
Technical Note - Computing Indices<br />
STEP THREE<br />
Computing the equally distributed income index:<br />
Calculating the index for income is fairly complex. Values of per capita GDP (PPP$) for women and men<br />
are calculated from the female share (s f<br />
) and male share (s m<br />
) of earned income. These shares, in turn,<br />
are estimated from the ratio of the female wage (w f<br />
) to the male wage (w m<br />
) and the percentage shares<br />
of women (ea f<br />
) and men (ea m<br />
) in the economically active population. Ratio of female agriculture wage<br />
to male agriculture wage (w f<br />
/ w m<br />
) is computed. The estimates of female and male per capita income<br />
(PPP$) are treated in the same way as income is treated in the HDI and then used to compute the<br />
equally distributed income index.<br />
Percentage shares of economically active population: Female = 35.26, Male = 64.74<br />
<strong>United</strong> <strong>Nations</strong> <strong>Development</strong> Programme adopts the ratio of female non-agricultural wage to male<br />
non-agricultural wage. Since <strong>Karnataka</strong>’s population is predominantly agrarian, here we use the ratio of<br />
female agricultural wage to male agricultural wage.<br />
Female agricultural wage= Rs. 35.15, Male agricultural wage = Rs. 54.07<br />
Ratio of female agricultural wage to male agricultural wage = w f<br />
/ w m<br />
= 0.650<br />
Percentage share of women in economically active population (ea f<br />
) = 35.26<br />
Percentage share of men in economically active population (ea m<br />
) = 64.74<br />
Computing proportional income share<br />
Female share of income (s f<br />
) =<br />
(w f<br />
/w m<br />
) × ea f<br />
=<br />
0.650x35.26<br />
[w f<br />
/wm × ea f<br />
] + ea m<br />
(0.650x35.26)+64.74<br />
= 0.262<br />
Per capita GDP (PPP$) of women is y f<br />
= (s f<br />
× y) / N f<br />
where N f<br />
is the total female population<br />
y f<br />
= (0.262 × 150835503948) / 25951644 = 520<br />
Per capita GDP (PPP$) of men is y m<br />
=[y - (s f<br />
× y)] / N m<br />
Where N m<br />
is the total male population<br />
y m<br />
=[150835503948 - (0.262 × 150835503948) / 26898918 = 4141<br />
Treating income the same way as in the construction of HDI, the adjusted income for women W (y f<br />
) is<br />
given by<br />
Log y f<br />
– Log y min<br />
Log 1,520 – Log 100<br />
W ( y f<br />
) = = = 0.454<br />
Log y max<br />
– Log y min<br />
Log 40,000 – Log 100<br />
the adjusted income for men W( y m<br />
) is given by<br />
W ( y m<br />
) =<br />
Log y m<br />
– Log y min =<br />
Log 4,141 – Log 100<br />
= 0.621<br />
Log y max<br />
– Log y min<br />
Log 40,000 – Log 100<br />
516
<strong>Karnataka</strong> <strong>Human</strong> <strong>Development</strong> <strong>Report</strong> <strong>2005</strong><br />
Computing the equally distributed income index<br />
For computing the equally distributed income index, the weighing parameter (ε = 2) is applied.<br />
[(female population share) × (adjusted female per capita GDP in PPP$) -1 + (male population share) ×<br />
(adjusted male per capita GDP in PPP$) -1 ] -1<br />
= [0.491 × (0.454) -1 + 0.509 × (0.621) -1 ] -1 = 0.526<br />
STEP FOUR<br />
The GDI = 1/3 (equally distributed LEB index + equally distributed educational index + equally<br />
distributed income index)<br />
= 1/3 (0.679 + 0.704 + 0.526) = 0.637<br />
Data Source:<br />
1. Computation of various indices for districts and state<br />
Since adult literacy rates are not yet available from the census, the literacy rates of Census 2001 (PCA)<br />
have been used. The gross combined enrolment ratios have been worked out based on enrolment data<br />
(from class I to XII) from the offi ces of the Commissioner Public Instruction and PUC Board and the age<br />
group data of 6 years to less than 18 years from the Census 2001(PCA). The estimates of life expectancy<br />
at birth worked out by Dr. P.J. Bhattacharjee, have been used. The Directorate of Economics and Statistics<br />
(DES), <strong>Karnataka</strong> is the source for the estimates of per capita income (GDP) for the districts of <strong>Karnataka</strong>,<br />
2001-02. The source for the per capita GDP (in Rs.) for India and the real per capita GDP in PPP$ for<br />
the years 2001-02 for India is the Central Statistical Organisation, and UNDP HDR 2004 respectively.<br />
Agricultural wage rates are used from the Directorate of Economics and Statistics.<br />
HDI and GDI for 27 districts of <strong>Karnataka</strong> for the year 1991 have been computed afresh based<br />
on taluk-wise data (as there were only 20 districts in 1991) and following the latest methodology<br />
(HDR 1999), so as to enable a comparison of the HDI and GDI values for 27 districts for the year 2001.<br />
As such the values of HDI and GDI for the districts and the state for 1991 worked out in KHDR (1999)<br />
have undergone a revision. The source of data for working out various indices of HDI and GDI for 1991<br />
is the same as given above.<br />
2. Computation of HDI and GDI for the Scheduled Castes and Tribes<br />
The methodology for the computation of HDI and GDI is the same as the one used for the districts and<br />
the state in the earlier section. But the data source is the special socio-economic survey of the SC and ST<br />
population in 2004 conducted by the Directorate of Economics and Statistics, <strong>Karnataka</strong>. The estimates<br />
of life expectancy at birth for female, male and persons have been worked out by Dr. P.J. Bhattacharjee<br />
based on age group and mortality data of the survey. The data of literacy rates and combined enrolment<br />
ratio (class I to XII) have been taken from the 2001 Census and the Commissioner of Public Instruction,<br />
<strong>Karnataka</strong>. Estimates of per capita net income for the SC and ST population are from the survey. The<br />
estimates of per capita net income have been converted to per capita GDP by applying the ratio of per<br />
capita NDP to per capita GDP of the state. The real per capita GDP in PPP$ is computed by using the<br />
ratio of per capita GDP for SC/ST in rupees to per capita GDP of India in rupees and multiplied by per<br />
capita GDP of India in PPP$. Agriculture wage rates for females and males worked out by the DES<br />
have been made use of since the majority of agricultural workers are SCs and STs. The formula used for<br />
computation of health (LEB) index, education index and income index by UNDP has been adopted for<br />
computing the HDI and GDI for the SCs and STs.<br />
517
Technical Note - Computing Indices<br />
3. Computation of HDI and GDI for major 15 states and India<br />
UNDP methodology (HDR 1999) is the basis for computation of HDI and GDI for major states and India.<br />
Literacy rates of 2001 Census have been used in lieu of adult literacy rates since data on adult literacy is not<br />
available at the time of writing this <strong>Report</strong>. The combined enrolment ratios have been worked out based<br />
on the enrolment data (class I to XII) made available in the publication Selected Educational Statistics<br />
for 2001-02 brought out by the Ministry of <strong>Human</strong> Resource <strong>Development</strong>, GoI and age group data<br />
(6 to less than 18 years) from the Census 2001 (PCA). LEB estimates (2001-06) as worked out by the<br />
Technical Group of Registrar General India have been used. The Central Statistical Organisation is the<br />
source for estimates of per capita GDP for the states and India. Agricultural wages have been computed by<br />
taking the average of 3 main activities of agricultural operations namely sowing, weeding and harvesting<br />
from Wage Rate for Rural India for the year 2001-02 released by the Labour Bureau, GoI.<br />
Equity Index<br />
Definitions<br />
Equity Index of participation (Enrolment): Equity in terms of share of target group in Enrolment as<br />
against share of target group in population.<br />
Tribal Equity Index =<br />
ST as % of total enrolment<br />
x 100<br />
ST as % of target population<br />
Gender Equity Index =<br />
Girls as % of total enrolment<br />
x 100<br />
Girls as % of target population<br />
Social Equity Index =<br />
SC+ST as % of total enrolment<br />
x 100<br />
SC+ST as % of target population<br />
Methodology: Estimation of different vital rates<br />
The unadjusted survival ratios for all age groups (10-14) to 65+ are used for estimating population for<br />
each district. The difference between the estimated population and actual provides the quantum of net<br />
migration of these age groups. The net migration for the age group (0-9) during the intercensal period<br />
is approximately estimated by assuming the relationship.<br />
Mo – 9 = ½ {M w 15-44<br />
C q<br />
– 9}<br />
W 15-44<br />
Where C q<br />
– 9 is the child women ratio and M 15-44<br />
is the estimated<br />
W 15-44<br />
female migrants in the age group (15-44).<br />
The magnitude of natural increase at district level is estimated by adjusting the volume of net migration<br />
in different intercensal periods. Therefore, if one of the vital rates is made known, the other can be<br />
estimated from the rate of natural increase. Crude birth rate can be estimated by Reverse Survival<br />
Method (RSM). In the RSM, the number of children in (0-4) age group is reverse survived by appropriate<br />
survival ratios (Model life tables rest at different mortality levels).<br />
518
<strong>Karnataka</strong> <strong>Human</strong> <strong>Development</strong> <strong>Report</strong> <strong>2005</strong><br />
The average annual birth =<br />
1 {Po – 4}<br />
5 S<br />
Where S is the survival ratios choosing appropriate mortality level.<br />
After estimating birth rates, the death rates are estimated from the difference between natural increase<br />
and birth rates. These rates are further adjusted for required year with SRS rates. The adjustment is also<br />
done for the newly created districts from the rates of their parent districts.<br />
The IMR is then estimated from the relationship between IMR and CDR at state level data of SRS with<br />
assumption that the relation holds for district level also.<br />
i. Assumption for estimating migration;<br />
ii. The population for the state as a whole is closed during intercensal period;<br />
iii. The age specifi c mortality rates are same for each district as for the state; and<br />
iv. The degree of enumeration in an age-sex group in a district is the same as that of state. 1<br />
Estimation of e o , at District Level<br />
o<br />
The estimation is based on the regression equation.<br />
y= A+B 1<br />
X 1<br />
+B 2<br />
X 2<br />
+B 3<br />
X 3<br />
+B 4<br />
X 4<br />
Where Y is the e o o ,<br />
X l<br />
= CBR, X 2<br />
= CDR, X 3<br />
= r (natural increase), X 4<br />
=IMR<br />
The values of the constant of the above equation are estimated from the SRS data on variables for 15<br />
major states and all-india for the year 2001-02. The correlation co-effi cient are calculated and found<br />
signifi cant.<br />
The estimated values of the constants are<br />
B 1<br />
= -1.2522, B 2<br />
= 0.7191, B 3<br />
= 1.350, B 4<br />
= -0.1486 Multiple R = 0.8745<br />
The e o is calculated for total population for each district considering the corresponding values of the<br />
o<br />
variables. The e o by sex are then estimated from the differentials of o eo between sexes for the states as<br />
o<br />
refl ected in SRS estimates.<br />
It is observed from the various data that females’ e o is about three years higher than males o eo is 65<br />
o<br />
years or more, about two years if it is between 62 years and 65 years and about one year it is 60 to 62<br />
years.<br />
The same methodology is used for estimating e o for 1991-92. The estimated values of constants are<br />
o<br />
B 1<br />
= -2.6137, B 2<br />
= 0.9634, B 3<br />
= 2.4228, B 4<br />
= -0.0324, A= 82.0313 Multiple R = 0.8866.<br />
1<br />
For details refer to the UN Manual VI, Population Studies, No. 47.<br />
519
Glossary (Statistical Terms)<br />
1. Birth attended by trained health personnel: The percentage of births attended by physicians, nurses,<br />
midwives, trained primary healthcare workers or trained traditional birth attendants.<br />
2. Child labourers: Working children between 5 and 14 years.<br />
3. Crude birth rate: Number of births per 1,000 population in a given year.<br />
4. Crude death rate: Number of deaths per 1,000 population in a given year.<br />
5. Dropout rate: The percentage of the number of children to total enrolment dropping out of the<br />
school system in a particular level in a particular year.<br />
6. Enrolment:<br />
i. Primary education enrolment: Enrolment of students in classes 1 to 7.<br />
ii. Secondary education enrolment: Enrolment of students in classes 8 to 10.<br />
iii. Higher secondary education: enrolment of students in classes in PUC level (11 to 12).<br />
iv. Tertiary education enrolment: Enrolment of students in graduate courses, teacher training<br />
courses, universities, and other professional courses.<br />
7. Enrolment ratios (gross and net): The gross enrolment ratio is the number of students enrolled<br />
in a level of education whether or not they belong to the relevant age group for that level – as a<br />
percentage of the population in the relevant age group for that level.<br />
8. The net enrolment ratio is the number of students enrolled in a level of education who belong in the<br />
relevant age group as a percentage of the population in the age group.<br />
9. Gross domestic product (GDP): This represents the sum of the economic value of all goods and<br />
services produced within the geographical boundaries of a state or district during a given year,<br />
from which are deducted raw material, fuels, lubricants etc. consumed in the process of production<br />
counted without duplication. Production originates in the state or district and therefore GDP is said<br />
to be “by origin”.<br />
10. Head count ratio (poverty): The ratio of population living below the poverty line to total<br />
population.<br />
11. Immunisation: Vaccination coverage of children against six serious but preventable diseases viz.<br />
tuberculosis, diphtheria, pertussis, tetanus, poliomyelitis and measles under one year of age for the<br />
antigens used in the universal child immunisation programme.<br />
12. Infant mortality rate (IMR): The number of infants dying under one year of age in a year per 1,000<br />
live births of the same year.<br />
13. Labour force: It is defi ned as the total persons working (or employed) and seeking or available for<br />
work (or unemployed).<br />
14. Labour force participation rate: The proportion of main and marginal workers and job seekers to<br />
total population.<br />
15. Life expectancy at birth: Average number of years a new born child is expected to live under current<br />
mortality conditions.<br />
520
<strong>Karnataka</strong> <strong>Human</strong> <strong>Development</strong> <strong>Report</strong> <strong>2005</strong><br />
16. Literacy rate: The ratio of the number of literates above seven years to total population. Literacy is<br />
defi ned as the ability to read and write with understanding in any language. Till the 1991 Census,<br />
literacy was canvassed for all persons above fi ve years of age. A signifi cant departure was made in<br />
1991 by canvassing the question of literacy only for the population aged 7 and above. A person can<br />
merely read but cannot write is taken to be as illiterate.<br />
17. Maternal mortality rate: The number of deaths of women while pregnant or within 42 days of<br />
termination of pregnancy from any cause related to pregnancy and child birth.<br />
18. Mortality rates:<br />
(i) Crude Death rate = No. of deaths during the year X 1,000<br />
Mid year population<br />
(ii) Infant mortality rate = No. of infant deaths of age 1 during the year X 1,000<br />
No. of live births during the year<br />
(iii) Neonatal mortality rate =<br />
No. of deaths of infant of less than 29 days during the year<br />
No. of live births during the year<br />
X 1,000<br />
(iv) Post neonatal mortality rate =<br />
No. of deaths of infants between 1 month to 12 months of life<br />
No. of live births during the year<br />
X 1,000<br />
(v) Under fi ve mortality rate: =<br />
No. of deaths of children under fi ve years of age<br />
No. of live births of the same year<br />
X 1,000<br />
19. Natural increase rate: It is the difference between crude birth rate and crude death rate.<br />
20. Net domestic product (GDP): Net domestic product is derived by deducting depreciation from the<br />
GDP.<br />
21. Purchasing power parity (PPP$): The purchasing power of a country’s currency. The number of units<br />
of that currency required to purchase the same representative basket of goods and services (or a<br />
similar basket of goods and services) that the US dollar (the reference currency) would buy in the<br />
<strong>United</strong> States.<br />
22. Real GDP per capita (PPP$): The GDP per capita of a country converted into US dollars on the basis<br />
of the purchasing power parity of the country’s currency.<br />
23. Safe drinking water access: If a household has access to drinking water supply from taps, hand<br />
pumps, bore wells or tube wells within or outside the premises, it is deemed to have access to safe<br />
drinking water.<br />
24. Sanitation access: households with reasonable access to sanitary means of excreta and waste<br />
disposal including outdoor latrines are deemed to have access to sanitation.<br />
25. Sex ratio: It is the number of females per thousand males.<br />
26. Slum: Slum is a compact area with a collection of poorly built tenements crowded together usually<br />
with inadequate sanitary and drinking water facilities.<br />
521
Glossary (Statistical Terms)<br />
27. Work participation rate (WPR): the proportion of total workers (main workers and marginal<br />
workers) expressed as percentage of total population is the Work Participation Rate (WPR). This<br />
is considered a very crude measure since it does not take into account the age structure of the<br />
population. For making specifi c comparisons, the age specifi c WPR would be ideal.<br />
28. Workers: Workers could be main and marginal.<br />
(i) Main workers: Those who have worked for 6 months (183 days or more a year) are termed<br />
main workers.<br />
(ii) Marginal workers: Those who have worked for less than 183 days in a year are marginal<br />
workers.<br />
522
Glossary (Regional Terms)<br />
Adalat<br />
Adhyakshya<br />
Adishakti Mahila Sangha<br />
Agarbathi<br />
Akshara Dasoha<br />
Anganwadi<br />
Arogya Raksha Samithis<br />
Ashraya programme<br />
Baa Baale Shalege<br />
Bahumukhi<br />
Beedi<br />
Beediyinda Shalege<br />
Bhoomi<br />
Chinnara Angala<br />
Chulhas<br />
Coolienda Shalege<br />
Dais<br />
Ambedkar programme<br />
E-Khajane<br />
Ganga Kalyana<br />
Gram Sabha<br />
Gutka<br />
Hakku Patra<br />
Hengassara Hakkina Sangha<br />
Local level grievance courts at district, taluk and gram panchayat<br />
level to deal with local problems<br />
President of Zilla Panchayat<br />
Women’s self-help group<br />
Incense stick<br />
Mid-day meal programme for school children<br />
Creche established in villages under the ICDS programme<br />
Healthcare committee in district and taluk hospitals to oversee<br />
hospital maintenance<br />
Housing programme for economically weaker sections of<br />
society<br />
Programme to bring girl children back to school<br />
A training module on multi-grade and multi-level learning<br />
Tobacco rolled in a leaf, to be smoked (country cigarette)<br />
Programme to bring street children back to school<br />
Programme for computerisation of land records in <strong>Karnataka</strong><br />
Programme to bring out-of-school children back to school<br />
A stove; hearth<br />
Programme aiming to bring child labour back to school<br />
Traditional birth attendants<br />
Housing programme for SCs/STs<br />
The online treasury project in <strong>Karnataka</strong>.<br />
Ganga Kalyana aiming to provide irrigation facilities to the<br />
fi elds of the Scheduled Castes/Tribes<br />
A Gram Sabha may exercise such powers and perform such<br />
functions at the village level as the Legislature of the State may,<br />
by law, provide<br />
A product containing tobacco, areca nut sold in small aluminium<br />
foil sachets<br />
Title-deed of house/site<br />
An NGO working on human rights and women’s issues<br />
Indira Awaas Yojana Indira Awaas Yojana (IAY) was launched during 1985-86<br />
as a sub-scheme of Rural Landless Employment Guarantee<br />
Programme (RLEGP) and continued as a sub-scheme of<br />
Jawahar Rozgar Yojana (JRY) since its launching from April,<br />
1989. It has been delinked from the JRY and has been made<br />
an independent scheme with effect from January 1, 1996.<br />
Indira Mahila Kendra<br />
Women’s self-help group<br />
523
Glossary (Regional Terms)<br />
Indira Mahila Yojana<br />
Jal Nirmal<br />
Jalarakshana<br />
Jatha<br />
<strong>Karnataka</strong> Mahila Abhivrudhi<br />
Yojane<br />
Keli Kali<br />
Khajane<br />
Kishori Kendra<br />
Kutcha<br />
Mahila Samakhya<br />
Maidan<br />
Malnad<br />
Mandal Panchayat<br />
Mane Belaku<br />
Navagrama<br />
Neralina Bhagya<br />
Nirmala Grama<br />
Okkutta<br />
Pradhan<br />
Pucca<br />
Punchamas<br />
Sachivalaya Vahini<br />
Samanaya Mahiti<br />
Sampoorna Grameen Rozgar<br />
Yojana<br />
A programme aiming to make rural women economically<br />
self-suffi cient<br />
A World-Bank aided programme that aims to provide a<br />
sustainable community based water supply system<br />
State project aimed at recharging ground water level<br />
Group which creates awareness among the community<br />
A women component plan launched in 1995-96 under which<br />
one-third of resources are earmarked for women in individual<br />
benefi ciary-oriented schemes and labour intensive schemes of<br />
the department of Women and Child <strong>Development</strong> and other<br />
departments.<br />
Radio lessons: ‘hear and learn’<br />
Treasury<br />
Residential bridge courses for girls in Bellary and Koppal<br />
districts<br />
House made of dried mud<br />
A GoI programme for education and empowerment of women<br />
in rural areas<br />
Plateau<br />
Hilly area that covers the districts of Chikmaglur, Hassan,<br />
Kodagu, Shimoga and uplands of Dakshina Kannada and<br />
Uttara Kannada, Udupi, Belgaum and Dharwad districts<br />
Block level local government<br />
Programme aiming to strengthen women economically<br />
The Navagrama housing scheme aims to radically change<br />
the lives of the poor by facilitating them to move into new<br />
habitations or village extensions developed through community<br />
action.<br />
A scheme for the upgradation of a thatched roof to a tiled roof<br />
Village sanitation programme<br />
Panchayat women’s association<br />
President of Mandal Panchayat<br />
House made of bricks and stones with mortar<br />
Scheduled Castes were known as punchamas in the then<br />
Mysore state<br />
It is <strong>Karnataka</strong>’s e-governance project. It has a vast online<br />
knowledge system that connects 40 secretariat departments<br />
of the state.<br />
General information system on the basic amenities available in<br />
the villages of <strong>Karnataka</strong>.<br />
A GoI programme launched in 2001 to provide gainful<br />
employment for the rural poor<br />
524
<strong>Karnataka</strong> <strong>Human</strong> <strong>Development</strong> <strong>Report</strong> <strong>2005</strong><br />
Samudayadatta Shale<br />
Sangha<br />
Santhwana<br />
Saraswathi Mahila Sangha<br />
Sarva Kutumb Sameekshe<br />
Sarva Siksha Abhiyan<br />
Shramadana<br />
Stree Shakti<br />
Swachcha Grama<br />
Swajaldhara<br />
Swarnajayanti Gram Swarozgar<br />
Yojana (SGSY)<br />
Swarna Jayanti Shahari Rozgar<br />
Yojana<br />
Swashakti<br />
Swasthi Grama<br />
Swavalambana<br />
Swayam Sidha<br />
Taluk Panchayat<br />
Taluk Panchayat Samithis<br />
Udyogini<br />
Venkateshwara Mahila Sangha<br />
Vidya Vikas Programme<br />
Ward/Vasati Sabhas<br />
Yashaswini<br />
Zamindars<br />
Zilla Panchayat<br />
Community rallies: A scheme to take the school to the<br />
community<br />
Organisation<br />
A rehabilitation programme for the women who are victims of<br />
various atrocities<br />
Women’s self-help group<br />
House-to-house survey to create a database that is useful for<br />
monitoring human development indicators<br />
Universal Elementary Education Programme<br />
Voluntary Labour<br />
A programme aiming at women’s empowerment of those<br />
belonging to the economically weaker sections of the society<br />
A comprehensive rural sanitation programme<br />
A GoI programme aiming to provide drinking water facilities in<br />
rural areas<br />
SGSY is a self-employment programme that aims at promoting<br />
micro-enterprises and poor in rural area<br />
SJSRY seeks to provide gainful employment to the urban poor<br />
(living below the urban poverty line) unemployed or underemployed,<br />
through setting up of self-employment ventures or<br />
provision of wage employment.<br />
A programme promoting women’s self-help groups<br />
It aims to develop model villages with the help of corporate/<br />
donors<br />
To provide self-employment opportunities to educated young<br />
men from rural areas<br />
Centrally sponsored scheme (formerly known as Indira Mahila<br />
Yojana) to form SHGs through the facilitation of anganwadi<br />
workers<br />
Taluk level local government<br />
Taluk panchayat committees<br />
Programme for women entrepreneurs<br />
Women’s self-help group<br />
An education programme for provision of uniforms and text<br />
books to students of classes I–VII in government schools<br />
Meeting to discuss local issues in the constituencies of village<br />
panchayats<br />
A health insurance programme for farmers launched in June<br />
2003<br />
Landlords<br />
District level local government<br />
525
References<br />
Alex Tuscano (1999), “Praxis’s Experience in Gram<br />
Panchayat Elections”, in D Rajasekhar (ed.),<br />
Decentralised Government and NGOs: Issues,<br />
Strategies and Ways Forward, Concept, New<br />
Delhi.<br />
Alexander, Jeffrey C (ed.) (1998), Real Civil<br />
Societies: Dilemmas of Institutionalisation, New<br />
Delhi, Sage.<br />
Atkinson, A.B. (2004), New Sources of <strong>Development</strong><br />
Finances – Funding the Millennium <strong>Development</strong><br />
Goals, Policy Brief No.10, <strong>United</strong> <strong>Nations</strong><br />
University, World Institute for <strong>Development</strong><br />
Economics Research [UNU-WIDER], (Hensinki).<br />
Azim Premji Foundation (2004), A <strong>Report</strong> on Quality<br />
Universal Education, Processed.<br />
Aziz, Abdul (1993), Decentralised Planning: The<br />
<strong>Karnataka</strong> Experiment, Sage Publications, New<br />
Delhi.<br />
___, (1994), Decentralised Governance in <strong>Karnataka</strong>:<br />
The Mandal Panchayat System, (NIRD) National<br />
Institute of Rural <strong>Development</strong>, Hyderabad.<br />
___, (1998), “An Overview” in Abdul Aziz et. al:<br />
Utilisation of Ford Foundation Untied Grant by<br />
the Selected Grama Panchayats: A Concurrent<br />
Evaluation (Mimeo), Institute for Social and<br />
Economic Change, Bangalore.<br />
___, (1999), “Interface between NGOs and<br />
Decentralised Government” in D Rajasekhar (ed.),<br />
Decentralised Government and NGOs: Issues,<br />
Strategies and Ways Forward, Concept, New<br />
Delhi.<br />
___, (2002), “A Comparative Analysis of Governance<br />
and Planning” in Abdul Aziz et. al., Decentralised<br />
Governance and Planning: A Comparative Study<br />
of Three South Indian States, Macmillan, New<br />
Delhi.<br />
___, (September 23, 2000) “Democratic<br />
Decentralisation: Experience of <strong>Karnataka</strong>”,<br />
Economic and Political Weekly.<br />
Badari, V.S., Bhat Ahalya. S, Kolhar Suman, Sharma<br />
Deepa, (2003), Women’s Empowerment:<br />
Innovations of the Singamma Sreenivasan<br />
Foundation’, presented at the Workshop on<br />
Women’s Empowerment in the context of Local<br />
Government in India: An Assessment, October 20-<br />
21, 2003, Institute of Social Sciences, New Delhi.<br />
Bahl, Roy (1999), “Implementation Rules for<br />
Decentralisation”, ISP Working Paper No.99-01,<br />
Georgia State University.<br />
Balasubramanian, N and Ramakrishna Panigrahi<br />
(2003), A Measure of Inequality of <strong>Human</strong><br />
<strong>Development</strong> for Funding and Management: Case<br />
Study of <strong>Karnataka</strong> State, India, ICFAI Journal of<br />
Applied Economics, vol. II (2), 46-66.<br />
Bardhan, P (1996), “Decentralised <strong>Development</strong>”,<br />
Indian Economic Review, Vol. XXXI, No.2.<br />
Batliwala, Srilatha, (1994), the Meaning of Women’s<br />
Empowerment: New Concepts from Action, in<br />
Gita Sen, Adrienne Germain and Linclon Chen<br />
(eds), Population Policies Reconsidered: Health<br />
Empowerment and Rights, Cambridge, Mass:<br />
Harvard University Press, 127-38.<br />
Bhat, Ahalya S. (2003), “Building Budgets from<br />
Below”, UNIFEM, Bangalore.<br />
Bhupendra Sing and Neeti Mahanti, “Tribal Health<br />
in India”.<br />
Centre for Women and Law – National Law School<br />
of India University, (1999), ‘Patterns and Trends<br />
of Domestic Violence in India: An Examination<br />
of Court Records’, Final end-of-project report for<br />
PROWID to the International Centre for Research<br />
on Women.<br />
Chandrashekar, B K (Ed.), (March 2000), Panchayat<br />
Raj in India: Status <strong>Report</strong>, 1999, Rajiv Gandhi<br />
Foundation, New Delhi.<br />
Chandra S, Subbarathna A.R, M.B Sudha, S.<br />
Deepthivarma, Krishna V.A.S, Manjula. V., (2002),<br />
Psychosocial and Sexual Adjustment among<br />
526
<strong>Karnataka</strong> <strong>Human</strong> <strong>Development</strong> <strong>Report</strong> <strong>2005</strong><br />
Persons Living with HIV-A Study Conducted at<br />
NIMHANS, Bangalore.<br />
Dennison, Edward (1961), The Source of Economic<br />
Growth in the <strong>United</strong> States and the Alternative<br />
Before Us, Committee for Economic <strong>Development</strong>,<br />
New York.<br />
Fernandes Aloysius P. (2003), “Putting Institutions<br />
First Even in Microfi nance”, MYRADA, Bangalore.<br />
Fox Piven, Frances and Cloward, Richard, (1979),<br />
Poor People’s Movements, Vintage Books.<br />
Galanter Mark, (1984), “Competing Equalities: Law<br />
and Backward Classes in India” Oxford University<br />
Press, New Delhi.<br />
Gayathri Devi. K.G, (no date), Evaluation of<br />
Manebelaku and Udyogini schemes in <strong>Karnataka</strong>,<br />
Draft Final <strong>Report</strong>, Institute for Social Economic<br />
Change, Bangalore.<br />
Gender based Analysis: A Guide for Policy-Making,<br />
1998.<br />
Gopalan Sarala, (2002), Towards Equality – The<br />
Unfi nished Agenda, Status of Women in India<br />
2001, National Commission for Women.<br />
Government of India, Accountant General of India,<br />
Accounts at a Glance (2002-03).<br />
(1997), “A Note on Economic Activities and School<br />
Attendance by Children of India: NSS 50th Round<br />
(July 1993-June 1994)”, Sarvekshana, 21(2),<br />
73rd Issue, October-December.<br />
___, (2003a), Department of Secondary and<br />
Higher Education, Ministry of <strong>Human</strong> Resource<br />
<strong>Development</strong>, Selected Educational Statistics<br />
2001-02 (as on 30th September, 2001), Planning,<br />
Monitoring and Statistics Division, New Delhi.<br />
___, (2003b), Department of Secondary and<br />
Higher Education, Ministry of <strong>Human</strong> Resource<br />
<strong>Development</strong>, Analysis of Budgeted Expenditure<br />
on Education 2001-02 to 2002-03, Planning,<br />
Monitoring and Statistics Division, New Delhi.<br />
___, (1999), Expert Group <strong>Report</strong> on Financial<br />
Requirements for Making Elementary Education A<br />
Fundamental Right, Ministry of <strong>Human</strong> Resource<br />
<strong>Development</strong>, Department of Education, New<br />
Delhi.<br />
___, (2002a), Ministry of Finance, Economic Survey<br />
2001-2002, New Delhi.<br />
___, Ministry of Health and Family Welfare, Annual<br />
<strong>Report</strong> 2000-01, New Delhi.<br />
___, Ministry of Tribal Affairs, Annual <strong>Report</strong><br />
2000-01, New Delhi.<br />
___, Ministry of Tribal Welfare, Department<br />
of Fisheries, Annual <strong>Report</strong> (1998-99),<br />
(1999-2000) and 2000-01, New Delhi.<br />
___, Ministry of Water Resources, National Water<br />
Policy.<br />
___, National Agricultural Census 1991 and 2001,<br />
New Delhi.<br />
___, National Commission on Population (no date),<br />
District-wise Social Economic and Demographic<br />
Indicators.<br />
___, NSSO, National Sample Survey Organisation,<br />
(1996), “Results on Employment and<br />
Unemployment Situation in India”, Fifth<br />
Quinquennial Survey, NSS 50th Round (July<br />
1993- June 1994)”, Sarvekshana, Vol. XX, No. 1.<br />
___, (1997), NSSO, Land and Livestock Holdings<br />
Survey NSS Forty-Eighth Round, (January-<br />
December 1992) <strong>Report</strong> 2, Operational Land<br />
Holdings in India 1991-92, Salient Features,<br />
Department of Statistics, Ministry of Planning and<br />
Programme Implementation, New Delhi.<br />
___, (2000b), NSSO, “Results on Attending an<br />
Education Institution in India: Its Level, Nature<br />
and Cost”, Sarvekshana, XXIII, S1-S159.<br />
___, (2000), NSSO, Employment and Unemployment<br />
in India 1999-2000 Key Results, NSS 55th Round<br />
(July 1999- June 2000), New Delhi.<br />
___, (2001), NSSO, “Levels and Pattern of Consumer<br />
Expenditure in India 1999-2000”, NSS 55th<br />
Round (July 1999-June 2000), Department of<br />
Statistics, Ministry of Planning and Programme<br />
Implementation, New Delhi.<br />
527
References<br />
___, (2001), National Statistical Commission,<br />
Vol. I and Vol. II, Ministry of Statistics and Plan<br />
Implementation, New Delhi, available on: http://<br />
mospi.nic.in/nscr/mp.html<br />
___, (2004), Planning Commission, INDIA<br />
Vision 2020 – The <strong>Report</strong> of the Committee<br />
on India Vision 2020, Academic Foundation,<br />
New Delhi.<br />
___, (2002b), Planning Commission, National<br />
<strong>Human</strong> <strong>Development</strong> <strong>Report</strong> 2001, Oxford<br />
University Press, New Delhi.<br />
___, (2002a), Planning Commission, Tenth Five Year<br />
Plan (2002-2007), Volume III, State Plans: Trends,<br />
Concerns and Strategies, Volume III (Draft), New<br />
Delhi, p. 42 & 58.<br />
___, (2001C): Poverty Estimates for 1999-2000,<br />
Press Information Bureau, New Delhi.<br />
___, (1981), Registrar General of India, Census of<br />
India New Delhi.<br />
___, (1991), Registrar General of India, Census of<br />
India, New Delhi.<br />
___, (2001), Registrar General of India, Census of<br />
India, New Delhi.<br />
___, (2001b), Registrar General of India, Census of<br />
India 2001: Final Population Totals, India, New<br />
Delhi.<br />
___, (2004c), Registrar General of India, Census of<br />
India 2001: Final Population Totals: <strong>Karnataka</strong>,<br />
Director of Census of Operations, <strong>Karnataka</strong>,<br />
Bangalore.<br />
___, (<strong>2005</strong>), Registrar General of India, Sample<br />
Registration System Bulletin, Volume 31 No.1,<br />
New Delhi, April <strong>2005</strong>.<br />
___, (1957), <strong>Report</strong> of the Team for the Study of<br />
Community <strong>Development</strong> Projects and National<br />
Extension Service, Vol.1, New Delhi.<br />
___, (1978), <strong>Report</strong> of the Committee on Panchayat<br />
Raj Institutions, New Delhi.<br />
___, (1993), <strong>Report</strong> of the Expert Group on<br />
Estimation of Proportion and Number of<br />
Poor, Perspective Planning Division, Planning<br />
Commission, New Delhi.<br />
___, (2002c), Statistical Abstract India 2001, Central<br />
Statistical Organisation, Ministry of Statistics and<br />
Programme Implementation, New Delhi.<br />
Government of <strong>Karnataka</strong>, Annual Administration<br />
<strong>Report</strong>s 1990-91, 1991-92, Department of<br />
Sericulture, Bangalore.<br />
___, Annual <strong>Report</strong>s 1991-92 to 2003-04,<br />
Department of Animal Husbandry and Veterinary<br />
Services, Bangalore.<br />
___, Annual <strong>Report</strong>s 1993-94 to 1998-99,<br />
Department of Horticulture, Bangalore.<br />
___, Annual <strong>Report</strong>s 1999-2000 to 2003-04,<br />
Department of Health and Family Welfare<br />
Bangalore.<br />
___, Annual <strong>Report</strong>s 1999-2000, Department of<br />
Sericulture, Bangalore.<br />
___, Annual <strong>Report</strong>s 1999-2000 to 2002-03,<br />
Directorate of Social Welfare, Bangalore.<br />
___, (2002), Annual <strong>Report</strong> 2001-02, chapter 11,<br />
Department of Women and Child <strong>Development</strong>,<br />
Gender Budget Initiative, http://wcd.nic.in/<br />
chap11.htm.<br />
___, (2004), Annual <strong>Report</strong> 2003-04, Department<br />
of Women and Child <strong>Development</strong>, Bangalore.<br />
___, (2003b), Annual <strong>Report</strong> 2002-03, Education<br />
Department, Bangalore.<br />
___, Annual <strong>Report</strong> 2002-03, Rural <strong>Development</strong><br />
and Panchayat Raj Department Bangalore.<br />
___, Annual <strong>Report</strong> 2002-03, Vishveshwaraiah<br />
Technical University, Belgaum.<br />
___, Annual <strong>Report</strong>s 1996-2000, 2002-03,<br />
Department of Technical Education, Bangalore.<br />
___, Annual <strong>Report</strong>s 2001-<strong>2005</strong>, <strong>Karnataka</strong> State<br />
Secondary Education Board, Bangalore.<br />
___, (<strong>2005</strong>), Children’s Census, Department of<br />
Public Instruction, Bangalore,<br />
528
<strong>Karnataka</strong> <strong>Human</strong> <strong>Development</strong> <strong>Report</strong> <strong>2005</strong><br />
___, (2004), Department of Forests, Ecology and<br />
Environment, State of the Environment <strong>Report</strong><br />
and Action Plan-2003.<br />
___, (1999), Department of Health and Family<br />
Welfare, <strong>Karnataka</strong> State Integrated Health Policy,<br />
p.10, Banglaore.<br />
___, (2001), Department of Health and Family<br />
Welfare, <strong>Karnataka</strong> State Integrated Health Policy,<br />
p.10, Banglaore.<br />
___, (2003), Department of Health and Family<br />
Welfare, Departmental Medium Term Fiscal Plan:<br />
2003-04 to 2006-07, Bangalore.<br />
___, (2001), Department of Health and Family<br />
Welfare, Task Force on Health and Family Welfare:<br />
<strong>Karnataka</strong> - Towards Equity, Quality and Integrity<br />
In Health, Bangalore.<br />
___, (2004), Department of Health and Family<br />
Welfare Services, Data on prevalence rate of T.B.,<br />
Leprosy, Bangalore.<br />
___, (2004), Department of Health and Family<br />
Welfare Services, Data under National anti malaria<br />
programme, Bangalore.<br />
___, (2002c), Department of Primary and<br />
Secondary Education, Departmental Medium<br />
Term Fiscal Plan (DMTFP): 2002-03 to <strong>2005</strong>-<br />
06, Bangalore.<br />
___, (2003a), Department of Primary and<br />
Secondary Education, Departmental Medium<br />
Term Fiscal Plan (DMTFP): 2003-04 to 2006-<br />
07, Bangalore.<br />
___, (2001), Department of Rural <strong>Development</strong><br />
and Panchayat Raj, Panchayat Karyakramagala<br />
Margadarshi (in Kannada) [or guidelines for<br />
Panchayat Programmes], Bangalore.<br />
___, (2002d), Department of Rural <strong>Development</strong><br />
and Panchayat Raj, <strong>Report</strong> of the Working Group<br />
on Decentralisation, Bangalore.<br />
___, (2004), Department of Rural <strong>Development</strong><br />
and Panchayat Raj, Note on Activities, Progress,<br />
Ongoing Limitations and Future Challenges,<br />
Bangalore (17.5.2004).<br />
___, Department of Women and Child <strong>Development</strong>,<br />
Progress <strong>Report</strong> under <strong>Karnataka</strong> Mahila<br />
Abhivrudhi Yojane - Various Years.<br />
___, (2001), Directorate of Economics and Statistics,<br />
An Economic-cum-Purpose Classifi cation of<br />
the <strong>Karnataka</strong> Government Budget 2000-01,<br />
Bangalore.<br />
___, (2003), Directorate of Economics and Statistics,<br />
State Domestic Product 2001-02, Bangalore.<br />
___, (2003), Directorate of Economics and Statistics,<br />
Agricultural Census: <strong>Karnataka</strong> 2001, Bangalore.<br />
___, (2004A) Directorate of Economics and Statistics,<br />
‘A Sample Survey: Status of Scheduled Castes and<br />
Scheduled Tribes in <strong>Karnataka</strong>’, Bangalore.<br />
___, (2004B) Directorate of Economics and Statistics,<br />
‘A Survey: Stree Shakti and Swashakti Women’s<br />
Self-Help Groups in <strong>Karnataka</strong>’, Bangalore.<br />
___, Directorate of Scheduled Tribes Welfare,<br />
Annual Plan 1993-94, 2000-01, Tribal Sub-Plan,<br />
Bangalore.<br />
___, Directorate of Social Welfare, Annual Plan<br />
2000-01, Special Component Plan, Bangalore.<br />
___, (2004), Education Department, <strong>Report</strong> of Task<br />
Force on Higher Education, Bangalore.<br />
___, (2004b), Education Department: A <strong>Report</strong> on<br />
Mid-Day Meal Scheme – Akshaya Patra, District<br />
Institute of Education and Training, Bangalore,<br />
available on: http://www/akshayapatra.org/<br />
government.html.<br />
___, (2003c), Finance Department, Medium Term<br />
Fiscal Plan for <strong>Karnataka</strong> 2003-04 to 2006-07,<br />
Bangalore.<br />
___, (2002), Finance Department, Accounts<br />
Reckoner for 1960-2004, Bangalore.<br />
___, (2003), Finance Department, Accounts<br />
Reckoner for 1994-2004, Bangalore.<br />
___, (2003), Finance Department, Medium-Term<br />
Fiscal Plan for <strong>Karnataka</strong>: 2003-04 to 2006-07,<br />
Bangalore.<br />
529
References<br />
___, Finance Department, Plan Monitoring and<br />
Information Division, Detailed Estimates of<br />
Expenditure, Volume-V, Various Years, Bangalore.<br />
___, Housing Department, A 50 Month Success<br />
Story – <strong>Karnataka</strong> Housing Programme 1999-<br />
2003, Bangalore.<br />
___, (1987), <strong>Karnataka</strong> Act No.20 of 1985: The<br />
<strong>Karnataka</strong> Zilla Parishads, Taluk Panchayat<br />
Samithis, Mandal Panchayats and Nyaya<br />
Panchayats Act, 1983, p.17-24, Bangalore.<br />
___, (2003), <strong>Karnataka</strong> State AIDS Prevention<br />
Society, <strong>Karnataka</strong> meets the challenge of HIV/<br />
AIDS.<br />
___, (2004), <strong>Karnataka</strong> State AIDS Prevention<br />
Society, HIV Epidemic in <strong>Karnataka</strong>.<br />
___, (2004), <strong>Karnataka</strong> State Women’s <strong>Development</strong><br />
Corporation, 2004, Swashakti – Rural Women’s<br />
<strong>Development</strong> and Empowerment Project.<br />
___, (2004b), Literacy in <strong>Karnataka</strong> – A Bird’s<br />
Eye View, State Resource Centre – <strong>Karnataka</strong>,<br />
<strong>Karnataka</strong> State Literacy Mission Authority<br />
(Mysore).<br />
___, (1987), Planning and Statistics Department,<br />
Annual Plan (Draft) 1988-89, Bangalore.<br />
___, (1994), Planning and Statistics Department,<br />
Annual Plan 1993-94, Bangalore.<br />
___, (1999): Planning and Statistics Department,<br />
<strong>Human</strong> <strong>Development</strong> in <strong>Karnataka</strong> 1999,<br />
Bangalore.<br />
___, (2001), Planning and Statistics Department,<br />
Economic Survey 2000-01, Bangalore.<br />
___, (2002), Planning and Statistics Department,<br />
Economic Survey 2001-02, Bangalore.<br />
___, (2002), Planning and Statistics Department,<br />
<strong>Report</strong> of the High Power Committee for Redressal<br />
of Regional Imbalances: Final <strong>Report</strong>, Bangalore,<br />
June 2002.<br />
___, (2002), Planning and Statistics Department,<br />
Women In <strong>Karnataka</strong>, Manpower and Employment<br />
Division, Bangalore, March 2002.<br />
___, (2003), Planning and Statistics Department,<br />
Economic Survey 2002-03, Bangalore.<br />
___, (2004), Planning and Statistics Department,<br />
Economic Survey 2003-04, Bangalore.<br />
___, (2004), Planning and Statistics Department,<br />
“Inter-State Economic Indicators”, Plan Finance<br />
and Resource division, Bangalore.<br />
___, Programmes for Women’s <strong>Development</strong>, http://<br />
www.kar.nic.in/dwcd/womde.pdf.<br />
___, (July 1996), <strong>Report</strong> of the State Finance<br />
Commission, Relating to Panchayat Raj<br />
Institutions, Bangalore.<br />
___, (March 1989), <strong>Report</strong> of the Zilla Parishad<br />
and Mandal Panchayat Evaluation Committee,<br />
Bangalore.<br />
___, (1996), <strong>Report</strong> of the Expert Committee on<br />
<strong>Karnataka</strong> Panchayat Raj Act, 1993, Bangalore,<br />
March 1996.<br />
___, (2002), <strong>Report</strong> of the Task Force on Women<br />
Empowerment.<br />
___, (2002b), <strong>Report</strong> of the Tax Reforms Commission<br />
(Chairman: Veerappa Moily), Bangalore.<br />
___, (2002b), Shaping Education in <strong>Karnataka</strong>:<br />
Goals and Strategies, Bangalore.<br />
Himanshu (2004), “Estimates of School Attendance<br />
based on the Unit level Data from the 55th Round<br />
of Employment-Unemployment Survey”, mimeo.,<br />
Centre for Economic Studies and Planning,<br />
Jawaharlal Nehru University, New Delhi.<br />
Hirach and Waghmare, Why Power To Grama<br />
Sabha?<br />
Hofbauer Balmori, Helena (2003), ‘Gender and<br />
Budgets – Overview <strong>Report</strong>’ BRIDGE Cutting<br />
Edge Packs, http://www.bridge.ids.ac.uk/reports_<br />
gend_CEP.html#Budgets.<br />
Hussar, William J. (2004), chapter 7, “Expenditure<br />
of Institutions of Higher Education” (especially,<br />
Appendix A6) in Projections of Education Statistics<br />
to 2008, a report prepared by Debra E. Gerald<br />
and William J. Hussar for the National Centre<br />
530
<strong>Karnataka</strong> <strong>Human</strong> <strong>Development</strong> <strong>Report</strong> <strong>2005</strong><br />
for Education Statistics, Research and Statistics<br />
Division, US Department of Education, accessed<br />
on April 20, 2004, http://nces.ed.gov/pubs98/<br />
pj2008/p98x01a6.asp.<br />
Hutchins, R M, (1970), The Learning Society, Penguin<br />
Books.<br />
ICHAP, (2003a), The Hidden Epidemic, HIV/AIDS in<br />
rural <strong>Karnataka</strong>.<br />
___, (2003b), The Urban Vulnerable, HIV/AIDS in<br />
Urban <strong>Karnataka</strong>.<br />
___, (2003c), Female Sex Work in <strong>Karnataka</strong> –<br />
Patterns and Implications for HIV Prevention.<br />
___, (2004), Community based HIV Prevalence<br />
Study in ICHAP, Demonstration Project Area, Key<br />
Findings.<br />
Inabanathan Anand, (2003), “Affi rmative Action and<br />
Dalits: Political Representation in Panchayats”<br />
Institute for Social and Economic Change,<br />
Bangalore.<br />
Indhu. S, and Nagamani S.N., (2000), Sexual<br />
Harassment at the Workplace, Hengasara Hakkina<br />
Sangha with Sakshi.<br />
Infosys Foundation, (2004), http://www/infy.com/<br />
infosys_foundation/Learn.html.<br />
International Institute for Population Sciences<br />
(1993), National Family Health Survey NFHS-1<br />
India <strong>Report</strong> (1992-93), Mumbai.<br />
___, (2000), National Family Health Survey – 2<br />
India <strong>Report</strong> (1998-99), Mumbai, November<br />
2000.<br />
___, (1995), National Family Health Survey –1,<br />
<strong>Karnataka</strong> <strong>Report</strong> (1992-93), Mumbai, February<br />
1995.<br />
___, (2001), National Family Health Survey –2,<br />
<strong>Karnataka</strong> <strong>Report</strong> (1998-99), Mumbai, November,<br />
2001.<br />
___, (2001), Reproductive and Child Health Project,<br />
Rapid Household Survey, Phase I and II – INDIA,<br />
1998-99, Mumbai.<br />
Internet site: http://www:bln0018.worldbank.org/<br />
essd/essd.nsf/NGOs/home. (accessed on June 8,<br />
2001 - No longer available).<br />
___, (2002), Institute for Social and Economic<br />
Change, Implicit and Explicit Subsidies in<br />
<strong>Karnataka</strong>, Bangalore.<br />
Isaac, Thomas T.M., Williams, Michelle, Chakraborthy,<br />
Pinaki, and Thampi, Binitha V., (2002), ‘Women’s<br />
Neighbourhood Groups: Towards a New<br />
Perspective’, the Maraikualm Seminar Papers,<br />
http://www.maraidevelopment.org/marinhgs.<br />
htm, accessed on October 14th 2004.<br />
Iyengar N S, M.B Nanjappa and P Sudarshan (1981),<br />
a note on Inter District Differentials in <strong>Karnataka</strong><br />
<strong>Development</strong>, Journal of Income and Wealth, Vol<br />
15(1), pp79-83.<br />
Jain, Devaki (2001), Towards Gender Responsive<br />
Budgeting: Recreating the Budgetary Process,<br />
October 2001, www.dgic.be/en/topics/gender/<br />
devaki.html.<br />
___, (2004), Synthesising the Papers: A discussion<br />
note’, A paper presented at Reconstructing<br />
Governance: The Other Voices, A Conference on<br />
Grassroots Participation in Governance, February<br />
20-21, 2004, Bangalore.<br />
Johnstone, Bruce (2004), “The economics and politics<br />
of cost sharing in higher education: comparative<br />
perspectives”, Economics of Education Review,<br />
23, pp 403-410.<br />
Joseph, Ammu, (2004), ‘Acid Test For Being Women’<br />
The Hindu, 16 August, 2004 http://www.<br />
countercurrents.org/gender-joseph160804.htm.<br />
Kadekodi, G. K, (2004), Common Property Resource<br />
Management: Refl ections on Theory and Indian<br />
Experience, Oxford University Press, New Delhi.<br />
___, (2000), Regional Disparity Revisited: The case<br />
of <strong>Karnataka</strong>, CMDR Monograph Series No.31.<br />
Kalam, Abdul, A P J and Y S Rajan (1998), India<br />
2020: A Vision for the New Millennium, Viking<br />
Press, New Delhi.<br />
Kamath, S U (1982), <strong>Karnataka</strong> State Gazetteer,<br />
Bangalore.<br />
531
References<br />
Kanbargi Ramesh, (2002), “Equity in Education”<br />
Education Department, <strong>Karnataka</strong>, Bangalore.<br />
Kapp W. K, (1963), Hindu Culture, Economic<br />
<strong>Development</strong> and Economic Planning in India”,<br />
Asia Publishing House, Mumbai.<br />
Krishnamurthy, Lakshmi and Dave, Anjali, (2000),<br />
Home and The World-Sangha Women’s Perceptions<br />
of “Empowerment”: Some Refl ections.<br />
Kurian, N J (2000), “Widening Regional Disparities<br />
in India: Some Indicators” Economic and Political<br />
Weekly, February, p.538-55.<br />
Lewin, Keith M (2001), “Are higher secondary<br />
enrolment rates achievable?” in Keith Lewin and<br />
Francoise Caillods (eds). Financing Secondary<br />
Education in Developing Countries, UNESCO<br />
Publishing: International Institute for Educational<br />
Planning, Paris.<br />
Linda Mayoux, (1997), “The Magic Ingredient?<br />
Microfi nance and Women’s Empowerment”:<br />
http://www.gdrc.org/icm/wind/magic.html.<br />
M. Devendra Babu (June 1999), Functional<br />
and Financial Devolution to PRIs: A Study of<br />
<strong>Karnataka</strong> State, (Unpublished), Institute for<br />
Social and Economic Change, Bangalore.<br />
Marschall Miklos (1999), Civil Society at the<br />
Millennium – From States to People: Civil Society<br />
and its Role in Governance.<br />
Mathrani, Vinalini, (2003), Kishori Sangha Processes<br />
– Snapshots and Statements, Mahila Samakhya,<br />
<strong>Karnataka</strong>.<br />
Mathrani, Vinalini, (2004a), Maternity Provisions:<br />
Entitlements, Benefi ts and Maternal, Healthcare<br />
Services, FORCES-<strong>Karnataka</strong> Chapter, Sutradhar,<br />
Bangalore.<br />
Mathrani, Vinalini, (2004b), Santhwana Project: A<br />
Review of the 19 centres run by MSK, Mahila<br />
Samakhya, <strong>Karnataka</strong>.<br />
MAYA, (2000), Which Silk Route This?<br />
Menon, Parvathi, (1999), ‘dowry deaths in Bangalore,<br />
Frontline, Volume 16 – Issue 17, August 14<br />
– 27, 1999, http://www.frontlineonnet.com/<br />
fl 1617/16170640.htm, accessed Nov 24, 2004.<br />
Menon Achutha, Workshop on National, State and<br />
Tribal Health policies, Centre for Health Sciences,<br />
Place.<br />
Mooij, J. and Mahendra Dev, S. (2004), “Social<br />
Sector Priorities: An analysis of Budgets and<br />
Expenditures in India in the 1990s”, <strong>Development</strong><br />
Policy Review, 22 (1): 97-120.<br />
Murgai, R., Suryanarayana, M.H. and Zaidi, S.<br />
(2003): “Measuring Poverty in India: <strong>Karnataka</strong>:<br />
The Regional Dimension”, Economic and Political<br />
Weekly, Vol. XXXVIII, No. 4, pp. 404-408 January<br />
25, 2003.<br />
MYRADA, (2003), Stree Shakti Self-Help Groups-<br />
Basic Quality Assessment, Study commissioned<br />
by the Department of Women and Child<br />
<strong>Development</strong>, Bangalore.<br />
Narayana M.R. (2001), “Budgetary Subsidies of<br />
the State Government to Higher Education;<br />
Evidence from <strong>Karnataka</strong> State (India)”, Journal<br />
of Indian School of Political Economy, XIII,<br />
443-470.<br />
Narasimhan, Sakuntala, (2002), ‘Self-Help Activism<br />
in Adolescents’, in inianest.com, May 14, 2002,<br />
http://www/boloji.com/wfs/wfs028.htm.<br />
National Bank for Agricultural and Rural <strong>Development</strong><br />
(NABARD) (2002), Impact of Self-Help Groups<br />
(Group Processes) on the Social/Empowerment<br />
Status of Women members in Southern India,<br />
New Delhi.<br />
___, (2004), Bank Linkage in <strong>Karnataka</strong> [not<br />
conclusive].<br />
NCAER, National Council of Applied Economic<br />
Research (1999): India <strong>Human</strong> <strong>Development</strong><br />
<strong>Report</strong>, Oxford University Press, New Delhi.<br />
___, (1999), South India <strong>Human</strong> <strong>Development</strong><br />
<strong>Report</strong>, New Delhi.<br />
___, (2001), South India <strong>Human</strong> <strong>Development</strong><br />
<strong>Report</strong>, New Delhi.<br />
532
<strong>Karnataka</strong> <strong>Human</strong> <strong>Development</strong> <strong>Report</strong> <strong>2005</strong><br />
Ostrom, Elinor (1990), Governing the Commons:<br />
The evolution of institutions of collective action,<br />
Cambridge University Press, New York.<br />
Ostrom, E., J Walker and R.Gardner (1992),<br />
‘Government with and without a sword: Self-<br />
Government is possible’, American Political<br />
Science Review, 86(2), p.404-17.<br />
Panchamukhi, P.R., Sailabala Debi and Annigeri V.B.<br />
(2004a), “Public Financing of Secondary Education<br />
in <strong>Karnataka</strong> State with special reference to Grants<br />
in Aid from the Government”, paper presented<br />
for National Workshop on Financing of Secondary<br />
Education with a focus on Grants-in-aid Policies and<br />
Practices, January 21-23, 2004: Centre for Multi-<br />
Disciplinary <strong>Development</strong> Research, Dharwad.<br />
Panchamukhi P.R. (ed) (2004b), - Bulletin of<br />
Educational Data Bank (Elementary Education),<br />
Himalaya Publishing House, Mumbai.<br />
Prabhu, S. (1999), “Expenditure for <strong>Human</strong><br />
<strong>Development</strong> and Public Provisioning for Poverty<br />
Alleviation” in Chelliah, Raja J. and Sudarshan,<br />
R. (eds.), Income Poverty and Beyond: <strong>Human</strong><br />
<strong>Development</strong> in India, Social Science Press, New<br />
Delhi.<br />
Prabhu, S. and Chatterjee, S. (1993), “Social Sector<br />
Expenditures and <strong>Human</strong> <strong>Development</strong>: A Study<br />
of Indian States”, <strong>Development</strong> Research Group,<br />
Study 6, Department of Economic Analysis and<br />
Policy, Reserve Bank of India, Mumbai.<br />
Prasad S.N., and Govinda Rao, A.V. (2002), ‘Role<br />
of Private Sector in Education’, Education<br />
Department, Bangalore.<br />
Public Affairs Committee, Bangalore, http://www.<br />
transparency.org/working_papers/gopakumar/<br />
kgopakumar.html.<br />
Puhazhendi V. and Sai Sathya (2000), Microfi nance<br />
- A Lead to Empowerment of the Rural Poor,<br />
National Bank for Agricultural and Rural<br />
<strong>Development</strong>, New Delhi.<br />
Purushothaman, Sangeetha, Anil Kumar, Padma,<br />
Purohit, Simone, (1999), Engendering Local<br />
Governance: The <strong>Karnataka</strong> Experience. <strong>Report</strong><br />
submitted to the Hunger Project., Best Practices<br />
Foundation, October 1999, Bangalore.<br />
Purushothaman, Sangeetha, M.S. Subhas and<br />
Nagrecha, Mitali, (2004), Building Women’s<br />
Capacities to Access Markets in the Peri Urban<br />
Interface: The Hardware and Software Required<br />
– Urban Agriculture Magazine, No 12, May 2004,<br />
Resources Centre on Urban Agriculture and<br />
Forestry, http://www.ruaf.org/uam_12.html.<br />
Rajan, Anuradha and Bhatla, Nandita, (2004),<br />
Panchayat Involvement on Violence against<br />
Women-Formative Research on Interventions in<br />
the State of <strong>Karnataka</strong>.<br />
Raman, Vasanthi, 2002, ‘The Implementation of<br />
Quotas for Women: The Indian Experience’ in The<br />
Implementation of Quotas: Asian experiences,<br />
Quota Workshop <strong>Report</strong> Series, International<br />
Institute for Democracy and Electoral Assistance,<br />
http://www.idea.int/publications/quotas/Asia_<br />
<strong>Report</strong>.pdf.<br />
Rama Prasad (1987), “Drought Hydrology in<br />
<strong>Karnataka</strong>”, appeared in <strong>Karnataka</strong> State of<br />
Environment <strong>Report</strong>, Centre of Taxonomic Studies,<br />
Bangalore.<br />
Rao, Govinda. M., “Poverty Alteration under Fiscal<br />
Decentralisation”, (Unpublished).<br />
Rao, Govinda. M., Amar Nath, H.K. and Vani, B.P<br />
(2004), “ Fiscal Decentralization in <strong>Karnataka</strong>”, in<br />
Sethi, Geeta (ed.), Fiscal Decentralisation to Rural<br />
Governments in India, The World Bank, Oxford<br />
University Press, New Delhi.<br />
Rao, Hemlata, (1984), Regional Disparity and<br />
<strong>Development</strong> in India, Ashish Publications, New<br />
Delhi.<br />
Rao, K R, (2000), “Imagining Unimaginable<br />
Communities” Prasaranga, Kannada University,<br />
Hampi.<br />
Rao, Sandhya, Chopra, Ashima, Indhu S, Nagamani<br />
S.N, Dr Rupande Padaki., (1999), Domestic<br />
violence-A Study of Organizational Data,<br />
Hengasara Ahkkina Sangha.<br />
Ray, Amal and Jayalakshmi, K (1987), “Zilla Parishad<br />
Presidents in <strong>Karnataka</strong>: Their Social Background<br />
and Implications for <strong>Development</strong>”, Economic<br />
and Political Weekly, October 17-18, 1987.<br />
533
References<br />
Rayappa P H and Sekhar T.V., “<strong>Development</strong> and<br />
Disparities Among Backward and Scheduled<br />
Groups in <strong>Karnataka</strong>”.<br />
Remy Prod’homme (1995), “Dangers of<br />
Decentralisation”, The World Bank Research<br />
Observer, Vol.10, No.28, August 1995.<br />
Rowman and Littlefi eld, (1998), “Stepsisters:<br />
Feminist Movement Activism in Different<br />
Institutional Spaces”, in David Meyer and Sidney<br />
Tarrow eds. The Social Movement Society.<br />
Rtn. Row G.M., Murray Culshaw, Satish S. and<br />
Abraham Sunil. Bangalore Cares, 2000.<br />
Saxena N.C., Madhu Sarin, Singh R.V., and Tushar<br />
Shah (1995), Western Ghats Forest <strong>Development</strong><br />
– An independent Study.<br />
Seetaharamu A.S., (1985), “Planning and<br />
Management of Education Within Integrated<br />
Rural <strong>Development</strong> Projects in India” in Dieter<br />
Berstecher Ed, Education and <strong>Development</strong>:<br />
Issues for Planning and Research, UNESCO.<br />
___, (2001), Function Review <strong>Report</strong>: Education<br />
in Government of <strong>Karnataka</strong>, Functional Review<br />
<strong>Report</strong>s, <strong>Karnataka</strong> Administrative Reforms<br />
Commission, pp. 141-280.<br />
Sen, A. and Himanshu (2004), “Poverty and Inequality<br />
in India: Getting Closer to the Truth”, http://www.<br />
macroscan.org/fet/may04/pdf/Poverty_WC.pdf.<br />
Sen, Amartya, (1992), The Concept of Well Being,<br />
Oxford University Press, New Delhi.<br />
Sen, Gita and Batliwala, Srilatha, (2000),<br />
‘Empowering Women for Reproductive Rights’,<br />
in Harriet B. Presser and Gita Sen (ed), Women’s<br />
Empowerment and Demographic Processes<br />
– Moving Beyond Cairo, Oxford University Press,<br />
2000.<br />
Sen, Gita and Sen, Chiranjib, (1985), ‘Women’s<br />
Domestic Work and Economic Activity: Results<br />
from the National Sample Survey’, Economic and<br />
Political Weekly, Review of Women’s Studies, April<br />
27, 1985.<br />
Sen, Gita, (1997), ‘Empowerment as an Approach<br />
to Poverty’, <strong>Human</strong> <strong>Development</strong> Papers 1997,<br />
Poverty and <strong>Human</strong> <strong>Development</strong>, UNDP, New<br />
York.<br />
Singamma Sreenivasan Foundation, (2003), In<br />
Search of a Thavara Mane In Politics: Engaging<br />
local Women Politicians in Public/Macro Policy<br />
Making; A Project <strong>Report</strong> Submitted to The<br />
Canadian High Commission.<br />
Sivanna, N, (1990), Panchayati Raj Reforms and<br />
Rural <strong>Development</strong>, Chugh, New Delhi.<br />
___, (2002), “Process and Performance of<br />
Panchayats” in Abdul Aziz et. al. Decentralised<br />
Governance and Planning: A Comparative Study<br />
in Three South Indian States, Macmillan, New<br />
Delhi.<br />
F. Stephen and Rajasekaran N., (2001), ‘Sheep<br />
and Lambs – An Empirical Study of Women in<br />
Local Self Governance in <strong>Karnataka</strong>’, SEARCH,<br />
Bangalore.<br />
SNDT Women’s University, (1999), ‘Responses to<br />
Domestic Violence in India: A Study in <strong>Karnataka</strong><br />
and Gujarat’, Final end-of-project report for<br />
PROWID to International Center for Research on<br />
Women.<br />
Solow, Robert, (1957), ‘Technical Change and<br />
Aggregate Productivity Function’, Review of<br />
Economic Studies, vol.39, p.312-20.<br />
Sopher, D.K., (1974), ‘Measurement of Disparity’,<br />
The Professional Geographer, 26/2, November<br />
1974, p.380-92.<br />
Status of Women in Canada: http://www.swc-cfc.<br />
gc.ca/pubs/gbaguide/gbaguide_e.html.<br />
Suryanarayana, M. H., (2004), ‘Measuring Poverty<br />
and Policy targeting in <strong>Karnataka</strong>’ The Regional<br />
Dimension’ mimeograph.<br />
Susanne Dam Hansen (1999), “NGO’s Role<br />
in Increasing People’s Participation in Local<br />
Decentralised Government”, in D Rajasekhar<br />
(ed.), Decentralised Government and NGOs:<br />
Issues, Strategies and Ways Forward, Concept,<br />
New Delhi.<br />
Tambiah, Yasmin, (2003), ‘Impact of Gender<br />
Inequality on Governance’, in Essays on Gender<br />
534
<strong>Karnataka</strong> <strong>Human</strong> <strong>Development</strong> <strong>Report</strong> <strong>2005</strong><br />
and Governance, <strong>Human</strong> <strong>Development</strong> Resource<br />
Centre, UNDP, New Delhi.<br />
Tilak J.B.G. (2003), “Public expenditure on education<br />
in India: A review of Trends and Emerging Issues”,<br />
in Tilak Jandhyala B.G. (ed). Financing Education<br />
in India, Ravi Books for National Institute for<br />
Educational Planning and Administration, New<br />
Delhi, pp 156-178.<br />
Ul-Haq Mahbub (1998), Refl ections on <strong>Human</strong><br />
<strong>Development</strong>, Oxford University Press, Second<br />
Ed. New Delhi.<br />
U.N Declaration on the Elimination of Violence<br />
against Women (1993).<br />
UNDP (<strong>United</strong> <strong>Nations</strong> <strong>Development</strong> Programme),<br />
(1991), <strong>Human</strong> <strong>Development</strong> <strong>Report</strong> 1991,<br />
Oxford University Press, New York.<br />
___, (2001), ‘<strong>Human</strong> <strong>Development</strong> <strong>Report</strong>’, New<br />
Delhi, 2001.<br />
___, (2003), ‘<strong>Human</strong> <strong>Development</strong> <strong>Report</strong>’, New<br />
Delhi, 2003.<br />
___, India: The Road to <strong>Human</strong> <strong>Development</strong>.<br />
UNESCO (1990), World Conference on Education for<br />
All: Meeting Basic Learning Needs, Jomtion.<br />
Vijaya K, (2003), <strong>Karnataka</strong> to Implement State<br />
Nutrition Policy, Healthcare Management, Issue<br />
dated 16th to 30th November 2003, http://<br />
www.expresshealthcaremgmt.com/20031130/<br />
hospinews01.shtml.<br />
V. Vijayalakshmi and B K Chandrashekar (2000):<br />
“Gender Inequality, Differences, and Identities:<br />
Women and Local Governance in <strong>Karnataka</strong>”,<br />
Working Paper No.72, Institute for Social and<br />
Economic Change, Bangalore.<br />
___, (2002), “Authority, Powerlessness and<br />
Dependence: Women and Political Participation”,<br />
Working Paper No.106, Institute for Social and<br />
Economic Change, Bangalore.<br />
Vimochana, (1999a), Unnatural Deaths Of Women<br />
In Marriage: A Campaign Diary.<br />
___, (1999b), Truth Commission, 15-17 August<br />
1999.<br />
Vyasulu, Poornima and Vyasulu, Vinod, (1999),<br />
‘Women in Panchayat Raj: Grassroots Democracy<br />
in India, Experience from Malgudi’, for a Meeting<br />
on Women and Political Participation: 21st<br />
Century Challenges, <strong>United</strong> <strong>Nations</strong> <strong>Development</strong><br />
Programme, 24-26 March 1999, New Delhi,<br />
India, Background Paper No.4, <strong>United</strong> <strong>Nations</strong><br />
<strong>Development</strong> Programme and <strong>United</strong> <strong>Nations</strong><br />
Offi ce of Project Services.<br />
Vito Tanzi, (2001), “Pitfalls on the Road to Fiscal<br />
Decentralisation”, Working Paper No.19,<br />
Washington DC Carneige Endowment for<br />
International Peace.<br />
World Bank, (1997), Primary Education in India,<br />
Allied Publishers Limited, New Delhi.<br />
___, (2000a), Overview of Rural Decentralization in<br />
India, Vol. I, The World Bank, New Delhi.<br />
___, (2000b), Overview of Rural Decentralization<br />
in India: Approaches to Rural Decentralization in<br />
Seven States, Vol. II, The World Bank, New Delhi.<br />
___, (2002), India: <strong>Karnataka</strong>: Financing Education<br />
in the Context of Economic Restructuring, <strong>Report</strong><br />
No.24207-IN, <strong>Human</strong> <strong>Development</strong> Sector Unit,<br />
South Asia Region, The World Bank, Washington.<br />
___, (2002), <strong>Karnataka</strong>: Secondary Education and<br />
the New Agenda for Economic Growth, <strong>Report</strong><br />
No. 24208-IN, <strong>Human</strong> <strong>Development</strong> Sector Unit,<br />
South Asia Region, The World Bank, Washington.<br />
___, (2004), Snakes and Ladders: Factors Infl uencing<br />
Successful Primary School Completion for<br />
Children in Poverty Contexts, South Asia <strong>Human</strong><br />
<strong>Development</strong> Sector, <strong>Report</strong> No.6, Discussion<br />
Paper Series, September 22, 2004.<br />
___, (2004), Teacher Absence in India Michael<br />
Kremer et al, June 2004.<br />
Yadav, Manohar (2003), Socio-Economic Survey<br />
of Scheduled Castes in <strong>Karnataka</strong> - A Critical<br />
Analysis, Institute for Social and Economic<br />
Change, submitted to Department of Social<br />
Welfare, <strong>Karnataka</strong>, Bangalore.<br />
535