solid waste characterization and quantification of bahir dar city for ...
solid waste characterization and quantification of bahir dar city for ...
solid waste characterization and quantification of bahir dar city for ...

You also want an ePaper? Increase the reach of your titles
YUMPU automatically turns print PDFs into web optimized ePapers that Google loves.
SOLID WASTE CHARACTERIZATION AND QUANTIFICATION OF BAHIR DAR CITY June 2010<br />
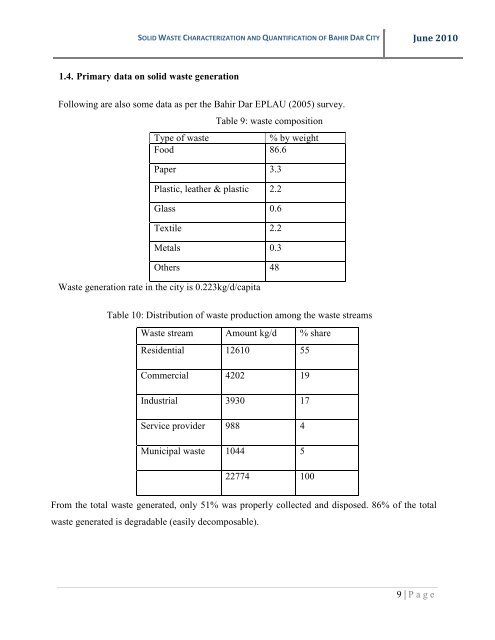
1.4. Primary data on <strong>solid</strong> <strong>waste</strong> generation<br />
Following are also some data as per the Bahir Dar EPLAU (2005) survey.<br />
Table 9: <strong>waste</strong> composition<br />
Type <strong>of</strong> <strong>waste</strong><br />
% by weight<br />
Food 86.6<br />
Paper 3.3<br />
Plastic, leather & plastic 2.2<br />
Glass 0.6<br />
Textile 2.2<br />
Metals 0.3<br />
Others 48<br />
Waste generation rate in the <strong>city</strong> is 0.223kg/d/capita<br />
Table 10: Distribution <strong>of</strong> <strong>waste</strong> production among the <strong>waste</strong> streams<br />
Waste stream Amount kg/d % share<br />
Residential 12610 55<br />
Commercial 4202 19<br />
Industrial 3930 17<br />
Service provider 988 4<br />
Municipal <strong>waste</strong> 1044 5<br />
22774 100<br />
From the total <strong>waste</strong> generated, only 51% was properly collected <strong>and</strong> disposed. 86% <strong>of</strong> the total<br />
<strong>waste</strong> generated is degradable (easily decomposable).<br />
9 | P a g e