Review of Australian Higher Education The Bradley Review
Review of Australian Higher Education The Bradley Review
Review of Australian Higher Education The Bradley Review

You also want an ePaper? Increase the reach of your titles
YUMPU automatically turns print PDFs into web optimized ePapers that Google loves.
4. Funding <strong>of</strong> student places<br />
<strong>The</strong> current system <strong>of</strong> setting funding per place<br />
is unsatisfactory. <strong>The</strong> discussion paper correctly<br />
described funding arrangements for students<br />
as ‘anomalous, inconsistent and irrational’. <strong>The</strong><br />
same applies to the Commonwealth-controlled<br />
component <strong>of</strong> university funding. Figure 4 shows<br />
how funding per Commonwealth-supported place<br />
has changed since 1989. From 1994 to 2002 real<br />
cuts to per student funding were applied every<br />
year. A below-inflation indexation system was<br />
the main cause <strong>of</strong> this trend. At no point in this<br />
period was the capacity <strong>of</strong> universities to deliver<br />
quality higher education on this level <strong>of</strong> funding<br />
examined. Indeed, no such exercise has ever been<br />
undertaken. Twice—in the late 1980s and 2007—<br />
existing spending patterns have been investigated.<br />
However, this reflects what universities can<br />
spend, rather than what it costs to meet standards<br />
appropriate to each course. Though the increase<br />
in funding since 2003 is welcome, it was primarily<br />
based on funding increments and programs<br />
without any direct relationship to current costs,<br />
quality standards, or student preferences. From<br />
2008, universities return to the below-inflation<br />
indexation <strong>of</strong> their core per student funding, partly<br />
<strong>of</strong>fset with a once-<strong>of</strong>f $500 million payment for<br />
campus infrastructure renewal. In subsequent<br />
years, the <strong>Education</strong> Investment Fund will provide<br />
some additional capital funding.<br />
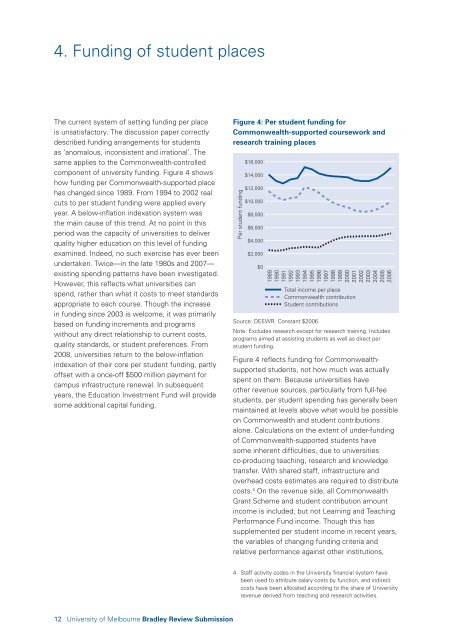
Figure 4: Per student funding for<br />
Commonwealth-supported coursework and<br />
research training places<br />
Per student funding<br />
$16,000<br />
$14,000<br />
$12,000<br />
$10,000<br />
$8,000<br />
$6,000<br />
$4,000<br />
$2,000<br />
$0<br />
1989<br />
1990<br />
1991<br />
1992<br />
1993<br />
1994<br />
1995<br />
1996<br />
1997<br />
1998<br />
1999<br />
2000<br />
2001<br />
2002<br />
2003<br />
2004<br />
2005<br />
2006<br />
Source: DEEWR. Constant $2006.<br />
Total income per place<br />
Commonwealth contribution<br />
Student contributions<br />
Note: Excludes research except for research training. Includes<br />
programs aimed at assisting students as well as direct per<br />
student funding.<br />
Figure 4 reflects funding for Commonwealthsupported<br />
students, not how much was actually<br />
spent on them. Because universities have<br />
other revenue sources, particularly from full-fee<br />
students, per student spending has generally been<br />
maintained at levels above what would be possible<br />
on Commonwealth and student contributions<br />
alone. Calculations on the extent <strong>of</strong> under-funding<br />
<strong>of</strong> Commonwealth-supported students have<br />
some inherent difficulties, due to universities<br />
co-producing teaching, research and knowledge<br />
transfer. With shared staff, infrastructure and<br />
overhead costs estimates are required to distribute<br />
costs. 4 On the revenue side, all Commonwealth<br />
Grant Scheme and student contribution amount<br />
income is included, but not Learning and Teaching<br />
Performance Fund income. Though this has<br />
supplemented per student income in recent years,<br />
the variables <strong>of</strong> changing funding criteria and<br />
relative performance against other institutions,<br />
4 Staff activity codes in the University financial system have<br />
been used to attribute salary costs by function, and indirect<br />
costs have been allocated according to the share <strong>of</strong> University<br />
revenue derived from teaching and research activities.<br />
12 University <strong>of</strong> Melbourne <strong>Bradley</strong> <strong>Review</strong> Submission