Sustainable Transport and the Environment Guide - Unite the Union
Sustainable Transport and the Environment Guide - Unite the Union
Sustainable Transport and the Environment Guide - Unite the Union

You also want an ePaper? Increase the reach of your titles
YUMPU automatically turns print PDFs into web optimized ePapers that Google loves.
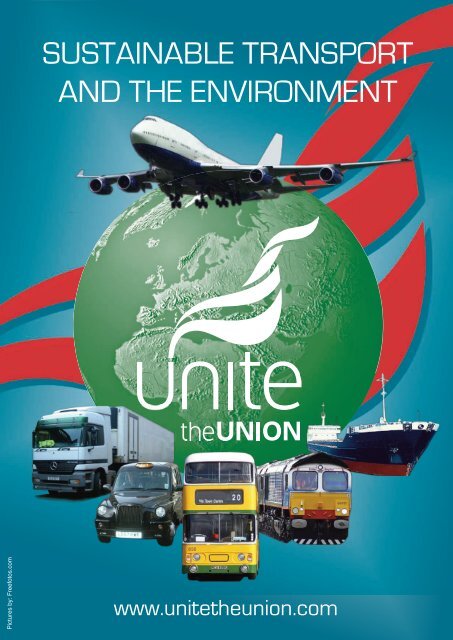
SUSTAINABLE TRANSPORT<br />
AND THE ENVIRONMENT<br />
Pictures by: Freefotos.com<br />
www.unite<strong>the</strong>union.com
Acknowledgements<br />
The <strong>Transport</strong> Sector National Committee; <strong>the</strong> Civil Air <strong>Transport</strong> National Trade<br />
Group Committee; <strong>the</strong> Docks, Inl<strong>and</strong> Waterways <strong>and</strong> Fisheries National Trade Group<br />
Committee; <strong>the</strong> Passenger <strong>Transport</strong> National Trade Group Committee; <strong>and</strong> <strong>the</strong> Road<br />
<strong>Transport</strong> National Trade Group Committee would like to thank Caroline Molloy;<br />
John Neal; Colin Potter; <strong>and</strong> Roger Sealey from <strong>the</strong> <strong>Unite</strong> <strong>the</strong> <strong>Union</strong> Research<br />
Department for <strong>the</strong>ir contributions to this report.<br />
1
Table of Contents<br />
Page<br />
Acknowledgements................................................................................. 1<br />
Contents .............................................................................................. 2<br />
Tables .............................................................................................. 3<br />
Figures .............................................................................................. 3<br />
1 <strong>Sustainable</strong> <strong>Transport</strong> <strong>and</strong> <strong>the</strong> <strong>Transport</strong> Worker – An<br />
Introduction.........................................................................5<br />
2 <strong>Unite</strong> <strong>the</strong> <strong>Union</strong> <strong>and</strong> sustainable transport<br />
2.1 Introduction.......................................................................... 11<br />
2.2 Can we afford sustainable transport?................................... 11<br />
2.3. Impacts................................................................................. 12<br />
2.4 Scientific concerns worsening ............................................. 15<br />
2.5 The impact of <strong>the</strong> transport sector........................................ 16<br />
2.6 Sustainability <strong>and</strong> economic impacts – especially in a<br />
downturn .............................................................................. 17<br />
2.7 What Can We Do? ............................................................... 18<br />
2. 8 Conclusion ........................................................................... 28<br />
3 Civil Air <strong>Transport</strong>, Climate Change <strong>and</strong> <strong>the</strong> Economy<br />
3.1 Introduction.......................................................................... 28<br />
3.2 European Emissions Trading Scheme.................................. 30<br />
3.3 Future Aviation Growth....................................................... 31<br />
3.4 European Emissions Trading Scheme Background............. 35<br />
3.5 Technical Solutions.............................................................. 37<br />
3.6 What can staff do?................................................................ 44<br />
3.7 Conclusions.......................................................................... 46<br />
4 Docks, Inl<strong>and</strong> Waterways, <strong>and</strong> Fisheries <strong>and</strong> <strong>Sustainable</strong><br />
<strong>Transport</strong><br />
4.1: Introduction.......................................................................... 47<br />
4.2 Rising Sea levels .................................................................. 47<br />
4.3: Greenhouse gas emissions ................................................... 49<br />
4.4 Ports ..................................................................................... 50<br />
4.5: What can ports <strong>and</strong> terminals do to significantly improve<br />
<strong>the</strong>ir environmental profile?................................................. 51<br />
4.6: Inl<strong>and</strong> Waterways ................................................................ 55<br />
4.7: Shipping ............................................................................... 58<br />
4.8: What can shipping lines do? ................................................ 64<br />
5 Passenger Services Trade Group: Towards <strong>Sustainable</strong><br />
<strong>Transport</strong><br />
5.1: Introduction <strong>and</strong> Overview of <strong>the</strong> Sector............................. 66<br />
5.2: Climate Change – Greenhouse Gas Emissions (GGE) ........ 67<br />
5.3: Policy Options...................................................................... 75<br />
2
6 Road <strong>Transport</strong> Commercial <strong>and</strong> <strong>Sustainable</strong> <strong>Transport</strong><br />
6.1 Introduction <strong>and</strong> Overview of <strong>the</strong> Road <strong>Transport</strong><br />
Commercial Sector............................................................... 78<br />
6.2 Greenhouse gas emissions <strong>and</strong> freight transport in <strong>the</strong><br />
<strong>Unite</strong>d Kingdom................................................................... 81<br />
6.3 Van Traffic........................................................................... 83<br />
6.4 Some policy options to be considered by <strong>the</strong> RTC National<br />
Committee............................................................................ 84<br />
7 Conference Report ................................................................. 87<br />
7.1 Passenger <strong>Transport</strong> Trade Group ......................................... 87<br />
7.2 Road <strong>Transport</strong> Commercial Trade Group .............................. 88<br />
7.3 Civil Air <strong>Transport</strong> Trade Group ........................................... 88<br />
7.4 Docks <strong>and</strong> Inl<strong>and</strong> Waterways Trade Group.............................. 88<br />
7.5 Day 2 of Conference .............................................................. 89<br />
7.6 Yellow Group ........................................................................ 90<br />
7.7 Green Group ......................................................................... 91<br />
7.8 Blue Group................................................................................ 91<br />
7.9 Orange Group ........................................................................... 92<br />
Appendices<br />
Appendix 1...............................................................................................93<br />
Appendix 2.............................................................................................. 94<br />
Appendix 3.............................................................................................. 95<br />
Tables<br />
Table 5.1 Buses <strong>and</strong> coaches <strong>and</strong> <strong>the</strong>ir contribution to <strong>the</strong> total<br />
GGE ..................................................................................... 69<br />
Table 5.2 Buses <strong>and</strong> coaches <strong>and</strong> <strong>the</strong>ir contribution to <strong>the</strong><br />
total GGE for <strong>the</strong> <strong>Transport</strong> Industry................................... 70<br />
Table 5.3 Taxi operations <strong>and</strong> <strong>the</strong>ir contribution to <strong>the</strong> total GGE...... 73<br />
Table 5.4 Taxi operations <strong>and</strong> <strong>the</strong>ir contribution to <strong>the</strong> <strong>Transport</strong><br />
Industry total GGE .............................................................. 74<br />
Table 5.1 Percentage of drivers usually working 48 hrs or more ........ 78<br />
Table 5.2 Percentage empty running lorries ........................................ 85<br />
Figures<br />
Figure 2.1 Carbon Emissions by end user in 2006................................ 16<br />
Figure 2.2: Emissions from UK <strong>Transport</strong> Industry – trends since<br />
1990...................................................................................... 17<br />
Figure 2.3: Greenhouse Gas Emissions in <strong>the</strong> <strong>Transport</strong> Sector ............ 17<br />
Figure 3.1 Air Passengers ‘000 <strong>and</strong> Air Freight tonnage 1987 – 2007 . 32<br />
Figure 3.2 UK transport CO 2 emissions 1970 – 2005 (by source).........32<br />
Figure 3.3 UK domestic greenhouse gas emissions 2007 ..................... 33<br />
Figure 3.4: Composition of emissions from a typical aircraft jet<br />
engine................................................................................... 34<br />
Figure 3.5 <strong>Sustainable</strong> Aviation’s CO2 Roadmap - projected future<br />
3
emissions of CO2 from UK aviation.................................... 35<br />
Figure 3.6 Comparison of <strong>the</strong> volume to weight parameters of<br />
currently available aviation fuel sources................................37<br />
Figure 3.7 Relative yield per hectare of various sources of biofuel........38<br />
Figure 3.8 Dependence of Ozone radiative forcing on location of<br />
emissions................................................................................42<br />
Figure 3.9 Comparison between ideal vertical flight path <strong>and</strong> current<br />
practices .................................................................................43<br />
Figure 4.1 Water <strong>Transport</strong> Total Greenhouse Gas Emissions<br />
1990 – 2006............................................................................50<br />
Figure 4.2 Inl<strong>and</strong> water traffic 1999-2007 billion tonnes kilometres......56<br />
Figure 4.3 Major inl<strong>and</strong> waterway routes – total goods moved 2007<br />
billion tonne kilometres .........................................................57<br />
Figure 4.4 Greenhouse gases from UK-based international shipping<br />
1990-2006 ..............................................................................58<br />
Figure 5.1 Percentage of Total Greenhouse Gas Emissions in UK<br />
1990 - 2006 ......................................................................... 69<br />
Figure 5.2 Total Greenhouse Gases by Buses <strong>and</strong> Coaches<br />
1990 -2006 ........................................................................... 70<br />
Figure 5.3 Taxi operations <strong>and</strong> <strong>the</strong>ir contribution to total UK<br />
Greenhouse Gas Emissions.................................................. 70<br />
Figure 5.4 Greenhouse Gas Emissions by taxi operations<br />
1990 – 2006.......................................................................... 74<br />
Figure 6.1 Percentage increase in Greenhouse Gas Emissions<br />
1990 -2006 ........................................................................... 81<br />
Figure6.2 Total Greenhouse Gases by Freight by Road 1990 -2006<br />
– thous<strong>and</strong> tonnes of carbon dioxide equivalent............... 82<br />
Figure 6.3 Average length of haul 1990 – 2006.................................... 83<br />
Figure 6.4 Light Duty Vehicles Carbon Dioxide (as carbon)<br />
1990 -2006 ........................................................................... 84<br />
4
1 <strong>Sustainable</strong> <strong>Transport</strong> <strong>and</strong> <strong>the</strong> <strong>Transport</strong> Worker – An Introduction<br />
The <strong>Transport</strong> <strong>and</strong> General Workers’ Section of <strong>Unite</strong> <strong>the</strong> <strong>Union</strong> has some 260,000<br />
members in its main <strong>Transport</strong> Sectors: Passenger <strong>Transport</strong>, Road <strong>Transport</strong><br />
Commercial, Logistics <strong>and</strong> Retail Distribution, Civil Air <strong>Transport</strong> <strong>and</strong> Docks,<br />
Railways, Ferries <strong>and</strong> Inl<strong>and</strong> Waterways. The views of our members in <strong>the</strong>se Sectors<br />
have been canvassed through our lay member committees at national <strong>and</strong> regional<br />
level <strong>and</strong> have been thoroughly discussed at a national conference of lay<br />
representatives from all transport modes <strong>and</strong> industries held in March 2009.<br />
The challenges to our society to create a more sustainable balance between people<br />
travelling on public <strong>and</strong> private forms of transport are immense. Achieving reductions<br />
in road congestion, both in cities <strong>and</strong> on inter-city <strong>and</strong> o<strong>the</strong>r routes, obtaining<br />
measurable shifts from high carbon modes of transport (road freight, car, plane) to<br />
low carbon (train <strong>and</strong> bus), <strong>and</strong> improving affordability of UK public transport in<br />
terms of <strong>the</strong> price paid per mile travelled, relative to o<strong>the</strong>r European countries is vital.<br />
Currently, we languish at <strong>the</strong> bottom of this league table.<br />
There is a clear need to both maintain <strong>and</strong> increase <strong>the</strong> provision of local services<br />
such as post offices, markets, cultural <strong>and</strong> leisure activities, schools, hospitals, <strong>and</strong><br />
doctors’ surgeries, as well as catering for a much needed rise in housing provision. All<br />
of this creates dem<strong>and</strong> for transport <strong>and</strong> a need to plan for how its needs are mediated<br />
with wider concerns.<br />
The drift towards almost exclusive reliance on just in time (JIT) production <strong>and</strong><br />
supply of manufactured goods <strong>and</strong> food raises <strong>the</strong> vital question of how to reduce <strong>the</strong><br />
economic, social <strong>and</strong> environmental costs of international freighting of imports.<br />
It is our view that Britain needs to ensure a sustainable transport industry by<br />
improving regulation <strong>and</strong> procurement practice in such a way as to enable longer term<br />
considerations, such as social <strong>and</strong> environmental goals, to be more fairly balanced<br />
against short term economic ones.<br />
We have concerns that a fixed adherence over <strong>the</strong> past quarter of a century to a rigid<br />
view that <strong>the</strong> free market will act in an invisibly intelligent way has promoted <strong>the</strong><br />
concept of a ‘competitive’ transport industry, ra<strong>the</strong>r than a ‘sustainable’ transport<br />
industry. This has led to both an under-priced sector <strong>and</strong> to environmental <strong>and</strong> societal<br />
damage, not <strong>the</strong> least to <strong>the</strong> health <strong>and</strong> livelihood of transport workers <strong>and</strong> <strong>the</strong>ir<br />
families, let alone <strong>the</strong> communities that live near transport activities.<br />
One of <strong>the</strong> underlying problems is that transport is perceived both by manufacturers<br />
<strong>and</strong> retailers as a cost. Therefore <strong>the</strong>y attempt to reduce <strong>the</strong> cost to <strong>the</strong> lowest level.<br />
This has resulted in transport companies not being paid <strong>the</strong> correct economic price for<br />
<strong>the</strong>ir services. This is compounded by <strong>the</strong> fact most if not all transport modes do not<br />
presently internalise its environmental cost.<br />
We believe that <strong>the</strong> concept of competition mediated only by an element of quantity<br />
licensing, as distinct from quality licensing, is <strong>the</strong> wrong way to treat transport<br />
operations in all its guises. Any competitive transport industry will, by definition, see<br />
companies <strong>and</strong> transport modes in direct competition with one ano<strong>the</strong>r. While this<br />
5
might bring about economic efficiency, or at least drive costs down, it will not bring<br />
about sustainable transport. Economic efficiency of this kind leads to an all-too<br />
evident ‘race to <strong>the</strong> bottom’, in terms of st<strong>and</strong>ards especially vehicle safety <strong>and</strong> labour<br />
st<strong>and</strong>ards.<br />
In its own `Towards a <strong>Sustainable</strong> <strong>Transport</strong> System’, <strong>the</strong> Department for <strong>Transport</strong><br />
identified a range of potential challenges relating to better safety <strong>and</strong> health goals,<br />
including reducing deaths <strong>and</strong> serious injuries. A sustainable transport industry<br />
concept should include areas such as working time – transport workers work some of<br />
<strong>the</strong> longest hours of all workers in <strong>the</strong> UK. The drive to longer hours <strong>and</strong> increased<br />
use of shift patterns, split shifts, <strong>and</strong> especially nightshifts, means that many transport<br />
workers, especially professional drivers <strong>and</strong> warehouse workers, are working against<br />
<strong>the</strong>ir circadian rhythms, increasing <strong>the</strong>ir risk of an accidents to <strong>the</strong>mselves or o<strong>the</strong>rs,<br />
<strong>and</strong> in <strong>the</strong> longer term damaging <strong>the</strong>ir health.<br />
It is well established that <strong>the</strong> period between 02:00 <strong>and</strong> 06:00 is particularly<br />
dangerous, especially for large goods vehicle drivers <strong>and</strong> bus <strong>and</strong> coach drivers who<br />
are driving on <strong>the</strong> road at that time. Yet employers push, for example, for a reduction<br />
in night time lorry bans, arguing that that this would result in a reduction of<br />
congestion. The price to be paid for this is yet more drivers out on <strong>the</strong> road during <strong>the</strong><br />
most dangerous period for road accidents.<br />
The trend over <strong>the</strong> last 30 years or more has been towards ever increasing<br />
globalisation, which has created both growth <strong>and</strong> jobs in <strong>the</strong> transport sectors.<br />
Retailers <strong>and</strong> manufacturers have sought ever cheaper supply chains. Food <strong>and</strong><br />
manufactured products travel much fur<strong>the</strong>r before <strong>the</strong>y reach us. People travel longer<br />
distances to get to work, now on average two hours, as industries in many local areas<br />
are closed down, centralised, or off-shored.<br />
JIT delivery systems may save businesses money but <strong>the</strong>y are not environmentally<br />
sustainable, especially in regards to lorries being part-loaded <strong>and</strong> returning empty.<br />
With companies reducing <strong>the</strong>ir warehousing inventory levels, more <strong>and</strong> smaller<br />
deliveries have been needed <strong>and</strong> <strong>the</strong> lorry has effectively become a mobile warehouse.<br />
If transport is to become sustainable <strong>the</strong>n this process will need to be halted <strong>and</strong><br />
reversed. Lean manufacturing <strong>and</strong> retailing, <strong>and</strong> non-local sourcing have serious<br />
implications for environmental <strong>and</strong> social concerns.<br />
Relocalisation means moving away from <strong>the</strong> obsession with globalisation as <strong>the</strong><br />
source of all that is good. A shift back towards local production <strong>and</strong> consumption has<br />
to be a part of more sustainable transport system. This will require <strong>the</strong> consumer to<br />
buy more locally-manufactured goods, locally-grown food <strong>and</strong> services. This would<br />
protect local freight transport <strong>and</strong> allied services, <strong>and</strong> increase local employment in<br />
<strong>the</strong> manufacturing, public transport <strong>and</strong> services sector more generally.<br />
A classic example is <strong>the</strong> Young’s prawn plant in Annan in Scotl<strong>and</strong>, next to <strong>the</strong><br />
fishing grounds. 120 jobs were lost in <strong>the</strong> plant, when <strong>the</strong> decision was taken to air<br />
freight <strong>the</strong> prawns to Thail<strong>and</strong> for processing, <strong>and</strong> <strong>the</strong>n re-import <strong>the</strong>m back to sell in<br />
UK shops. Ano<strong>the</strong>r example is what has been called <strong>the</strong> ‘great food swap’ where<br />
Britain imports 240,000 tonnes of pork from <strong>the</strong> Ne<strong>the</strong>rl<strong>and</strong>s each year - <strong>and</strong> exports<br />
195,000 tonnes back.<br />
6
The only way we can be sure of measurable successes in redirecting society towards a<br />
more sustainable transport policy is to see government actually deliver what it is<br />
already supposedly committed to. When we see “quantified reductions in greenhouse<br />
gas emissions” arising from <strong>the</strong> enactment of such policies are set out here, <strong>the</strong>n <strong>the</strong><br />
public can know that progress is under way. When we hear <strong>the</strong> government say that it<br />
seeks to “enhance social inclusion <strong>and</strong> regeneration”, we need to know that such<br />
laudable aims are accompanied by clear <strong>and</strong> measurable means to prove <strong>the</strong>ir<br />
accomplishment.<br />
<strong>Unite</strong> would like to see <strong>the</strong> creation <strong>and</strong> expansion of low carbon, coach <strong>and</strong> train,<br />
transport hubs on <strong>the</strong> edge of cities. Better <strong>and</strong> more widespread traffic calming that<br />
favours public transport <strong>and</strong> better regulation of drivers hours. Creating a sustainable<br />
transport system needs to take into account those issues that affect <strong>the</strong> people working<br />
within transport, such as roadside facilities.<br />
It has long been an aim for transport trade unions to achieve a genuinely integrated<br />
transport policy for both goods <strong>and</strong> people. We believe that this is more than ever<br />
essential, if we are to have a sustainable transport system. If we are to encourage a<br />
model shift from <strong>the</strong> car to public transport <strong>the</strong>n considerations has to be given to both<br />
to <strong>the</strong> price charged for public transport <strong>and</strong> <strong>the</strong> ease of use, especially in regard to<br />
through ticketing.<br />
The Stern Report made clear that <strong>the</strong> cost of tackling climate change is only one<br />
twentieth of <strong>the</strong> financial cost of NOT tackling climate change, not to mention <strong>the</strong><br />
human costs. These human costs impact most of all on <strong>the</strong> poorest in society, both at<br />
home <strong>and</strong> abroad. As with climate change, so o<strong>the</strong>r environmental <strong>and</strong> social costs –<br />
from pollution to exhaustion – impact most heavily on our members, some of whom<br />
live in poorer communities nearest to <strong>the</strong> major transport routes.<br />
Therefore, tackling climate change <strong>and</strong> environmental <strong>and</strong> social damage from <strong>the</strong><br />
transport system, is a matter of social justice <strong>and</strong> of intense concern to our members<br />
The DfT’s own statistics show that 81% of people are ‘very’ or ‘fairly’ concerned<br />
about climate change <strong>and</strong> <strong>the</strong>se figures are consistent across all social groups.<br />
We are also aware that <strong>the</strong> transport system itself is vulnerable to <strong>the</strong> impacts of<br />
climate change <strong>and</strong> that many of our members have already been affected by<br />
increased flooding <strong>and</strong> extreme heat waves in recent years. Currently all our transport<br />
systems are vulnerable to dislocation due to <strong>the</strong> increasing volatility of <strong>the</strong> wea<strong>the</strong>r. In<br />
<strong>the</strong> future we will have to invest more in our transport infrastructure so that <strong>the</strong>y can<br />
deal with extreme wea<strong>the</strong>r events which will now occur every 10 years ra<strong>the</strong>r <strong>the</strong>n<br />
every 50 years as used to be <strong>the</strong> case.<br />
The history of a shift towards privatised, high carbon modes of transport since <strong>the</strong><br />
early 80s has been disastrous for both <strong>the</strong> environment <strong>and</strong> for social inclusion <strong>and</strong><br />
must be reversed. To this end it is also important to ensure that social inclusion is<br />
enhanced for all in <strong>the</strong> most speedy <strong>and</strong> sustainable cost effective way possible, <strong>and</strong><br />
not just for those labelled as ‘disadvantaged’ or living in ‘deprived or remote areas’.<br />
7
There are some sustainable transport initiatives that can be easily promoted at <strong>the</strong><br />
workplace level by trade union activists, such as: car-sharing; travel planning; <strong>and</strong><br />
training for drivers in fuel efficiency. These are all areas that trade union activists in<br />
any workplace should be encouraged to pursue, to reduce congestion <strong>and</strong> pollution.<br />
But above all, both central <strong>and</strong> local government need to take a far more<br />
interventionist approach to tackle climate change which Gordon Brown has referred<br />
to as ‘<strong>the</strong> greatest market failure in history’. We believe that <strong>the</strong> government will fail<br />
to meet its environmental <strong>and</strong> social targets without both stricter environmental<br />
st<strong>and</strong>ards <strong>and</strong> regulations to drive dem<strong>and</strong> in <strong>the</strong> transport sector, <strong>and</strong> greater, more<br />
accountable direct state investment in public transport infrastructure <strong>and</strong> services.<br />
The deregulation of buses since 1986 (along with <strong>the</strong> later privatisation of <strong>the</strong><br />
railways) has been a disaster for public transport <strong>and</strong> <strong>the</strong> environment, leading to low<br />
wages, high fares, fewer routes <strong>and</strong> declining passengers numbers, <strong>and</strong> increased<br />
congestions <strong>and</strong> overcrowding.<br />
Improving <strong>the</strong> quality <strong>and</strong> quantity of public transport is critical to any serious<br />
sustainable transport strategy. More immediate regulation through quality contracts<br />
in <strong>the</strong> short term, <strong>and</strong> re-nationalisation <strong>and</strong> increased municipal ownership in <strong>the</strong><br />
longer term is needed to deliver more services, higher staffing levels, better trained<br />
<strong>and</strong> rewarded staff, more integration with o<strong>the</strong>r modes of transport, <strong>and</strong> lower fares.<br />
Such measures would contribute to making public transport a genuinely realistic,<br />
comfortable <strong>and</strong> safe alternative to private car use.<br />
The European Commission’s proposals to force tendering of bus contracts have been<br />
fiercely resisted by <strong>the</strong> European trade unions. We will continue to fight to protect<br />
<strong>the</strong> rights of local authorities to provide bus services <strong>the</strong>mselves, <strong>and</strong> to negotiate<br />
Quality Contracts which specify high st<strong>and</strong>ards of labour relations, service provisions<br />
<strong>and</strong> improve environmental st<strong>and</strong>ards.<br />
There is also a need to retrofit <strong>and</strong> produce newer buses with less polluting engines, as<br />
well as using lower emission fuel. Greater subsidy is needed but ultimately as <strong>the</strong><br />
European <strong>Transport</strong> Workers’ Federation says, ‘<strong>the</strong> role of <strong>the</strong> state cannot be limited<br />
to ensuring (fair) competition between companies <strong>and</strong> probably providing an<br />
infrastructure, where it is too expensive for <strong>the</strong> market to invest. The market has<br />
severe side effects on social <strong>and</strong> ecological sustainability <strong>and</strong> does not provide<br />
sustainable infrastructure <strong>and</strong> public transport’. Nowhere is this clearer than on <strong>the</strong><br />
buses <strong>and</strong> in <strong>the</strong> ‘Cinderella sector’ of <strong>the</strong> national coach network.<br />
It is clear that railways make up only a small amount of <strong>the</strong> total emissions in <strong>the</strong> UK<br />
<strong>and</strong> that has only increased marginally in <strong>the</strong> last 17 years, <strong>and</strong> at a slower rate that<br />
<strong>the</strong> rest of transport which has increased considerably. Railways are an energyefficient<br />
carrier of people <strong>and</strong> goods <strong>and</strong> hence produce relatively less CO 2 emissions<br />
per passenger than o<strong>the</strong>r modes. Emissions of CO 2 per passenger/Km are, on average,<br />
approximately half that of travel by car.<br />
The UK is a crowded isl<strong>and</strong> with a high population density. Rail makes more efficient<br />
use of space. A double track railway can carry up to 10 times <strong>the</strong> number of people<br />
per hour than a 2-lane road. Railways can’t always get people or freight to <strong>the</strong> desired<br />
8
destination in one go but <strong>the</strong>y can often take <strong>the</strong>m part or <strong>the</strong> majority of <strong>the</strong> way in<br />
many instances <strong>and</strong> in partnership with o<strong>the</strong>r modes of transport clearly have a lot to<br />
offer in delivering a sustainable transport plan. Rail fares in Britain are on average 50<br />
per cent higher than <strong>the</strong> rest of Europe <strong>and</strong> until this is addressed it is unlikely that<br />
railways will become a sustainable transport option for <strong>the</strong> majority of UK citizens.<br />
Rail transport is more fuel efficient <strong>and</strong> more jobs intensive than road transport, both<br />
in terms of day to day operations <strong>and</strong> <strong>the</strong> infrastructure required (ie road or track).<br />
Carrying freight by rail results in an 80% cut in CO 2 emissions per Kilogram carried<br />
compared to road haulage. Contrary to <strong>the</strong> belief of some, policy in <strong>the</strong> T&G, which<br />
forms <strong>the</strong> overwhelming bulk of <strong>Unite</strong>’s transport membership, has historically<br />
favoured rail building over roads <strong>and</strong> continues to do so.<br />
However, government investment both in <strong>the</strong> UK <strong>and</strong> <strong>the</strong> EU has favoured road<br />
building over rail, with rail employment falling <strong>and</strong> road freight employment<br />
growing, in recent years due in part to <strong>the</strong> increase in JIT systems. Although <strong>the</strong><br />
majority of our freight in <strong>the</strong> UK travels by road, <strong>the</strong>re has been a steady increase in<br />
<strong>the</strong> amount of freight being moved by rail. Switching more of this to rail could result<br />
in a dramatic reduction in CO 2 emissions, as well contributing to a reduction in road<br />
congestion.<br />
A large number of flights from London airports are to destinations that can, or could,<br />
be reached by high speed rail. Switching <strong>the</strong>se journeys to rail would be particularly<br />
beneficial as short haul flights produce a high proportion of more dangerous<br />
emissions <strong>and</strong> are particularly fuel inefficient, because take off uses up to 25 percent<br />
of <strong>the</strong> overall fuel. High speed rail produces only a fraction of such emissions. Funds<br />
generated through taxation of fuel <strong>and</strong> air travel should by hypo<strong>the</strong>cated for <strong>the</strong><br />
development of greener travel options, to improve environmental performance<br />
dramatically whilst avoiding a political backlash.<br />
It is <strong>the</strong> union’s current policy to support <strong>the</strong> expansion Heathrow provided it meets<br />
<strong>the</strong> environmental targets set out in <strong>the</strong> Aviation White Paper. We have noted <strong>the</strong><br />
report by <strong>the</strong> independent House of Commons research department in February 2009<br />
which cast some doubt both on <strong>the</strong> projected level of economic benefits, arguing it<br />
was nearer to £1.5 billion or less ra<strong>the</strong>r than £8.2billion, partly because it <strong>the</strong>ir costbenefit<br />
analysis “does not consider” alternative schemes which this union also<br />
supports, such as high speed rail. However, o<strong>the</strong>r reports have come to <strong>the</strong> opposite<br />
conclusions<br />
As <strong>the</strong> ILO report states: “A shift towards more sustainable transport is feasible, but it<br />
requires careful planning <strong>and</strong> transition measures.” Central <strong>and</strong> national government<br />
bodies need to work on <strong>the</strong> development of solutions for <strong>the</strong> national network <strong>and</strong><br />
international networks. Given that <strong>the</strong>se projects need a long-term strategic focus,<br />
which will not come from <strong>the</strong> private sector.<br />
Progress on means to ensure how national <strong>and</strong> international networks are developed<br />
should include those who work in <strong>the</strong> transport industries, <strong>and</strong> especially those<br />
working on <strong>the</strong> front line. All too often managers who have little or no experience of<br />
<strong>the</strong> realities of <strong>the</strong> transport networks are <strong>the</strong> ones who influence policy. This<br />
9
contribution from <strong>Unite</strong> is hopefully a beginning to such a direction of travel on<br />
transport policy.<br />
GRAHAM STEVENSON<br />
National Organiser – <strong>Transport</strong> - <strong>Transport</strong> <strong>and</strong> General Workers’ <strong>Union</strong> Section<br />
<strong>Unite</strong> <strong>the</strong> <strong>Union</strong><br />
March 2009<br />
10
2 <strong>Unite</strong> <strong>the</strong> <strong>Union</strong> <strong>and</strong> <strong>Sustainable</strong> <strong>Transport</strong><br />
2.1 Introduction<br />
<strong>Sustainable</strong>, efficient <strong>and</strong> affordable transport systems are essential to ensure we all<br />
have decent access to employment <strong>and</strong> economic opportunity, <strong>and</strong> to <strong>the</strong> goods <strong>and</strong><br />
services that we need, in a way that doesn’t damage <strong>the</strong> climate, our planet, <strong>and</strong><br />
ourselves.<br />
The T&G section of <strong>Unite</strong> <strong>the</strong> <strong>Union</strong>, as <strong>the</strong> main transport union, has long recognised<br />
<strong>the</strong> importance of <strong>the</strong>se issues <strong>and</strong> this has been more recently re-affirmed, first by <strong>the</strong><br />
Civil Air <strong>Transport</strong> (CAT) trade group <strong>and</strong> <strong>the</strong>n by <strong>the</strong> o<strong>the</strong>r transport sector trade<br />
groups, each of which have in varying degrees historically tackled <strong>the</strong>ir own<br />
challenges <strong>and</strong>/or opportunities. Representatives from each trade group have taken<br />
part in <strong>the</strong> European <strong>Transport</strong> Workers’ Federation (ETF’s) Trust 1 project, which has<br />
addressed in part <strong>the</strong> impact of transport on climate change. It is hoped that this<br />
report will inform <strong>the</strong> debate at <strong>the</strong> <strong>Transport</strong> Sector’s <strong>Sustainable</strong> <strong>Transport</strong><br />
Conference in February 2009, <strong>and</strong> can go forward to be incorporated in union policy<br />
<strong>and</strong> <strong>the</strong> ETF’s future policy.<br />
2.2 Can we afford sustainable transport?<br />
Employers have always used <strong>the</strong> argument that better service quality, higher<br />
safety st<strong>and</strong>ards, <strong>and</strong> better wages, would be unaffordable <strong>and</strong> would lead to job<br />
losses. The T&G section of <strong>Unite</strong> has always resisted this argument.<br />
The same arguments are now being be made about environmental st<strong>and</strong>ards.<br />
Employers are often reluctant to implement greener st<strong>and</strong>ards <strong>and</strong> are fighting<br />
regulation that would impose this, often on <strong>the</strong> grounds that it is ‘antiliberalisation’<br />
or ‘anti-competitive’. Ra<strong>the</strong>r than ask - can we afford to have a<br />
greener, more sustainable transport system – perhaps we should ask - can we<br />
afford not to?<br />
The very point of <strong>the</strong> concept of ‘sustainable development’ is to match <strong>the</strong> aim of<br />
long-term growth with a concern to ensure <strong>the</strong> future well-being of <strong>the</strong> planet’s<br />
environment. So it is vital <strong>the</strong> interest of working people <strong>and</strong> <strong>the</strong>ir families are<br />
considered in <strong>the</strong> wider context. This is particularly <strong>the</strong> case in a period of acute crisis<br />
in <strong>the</strong> financial world <strong>and</strong> <strong>the</strong> real economy. This current period of recession provides<br />
possibilities for ensuring that future growth takes place in a far more sustainable way<br />
than has been <strong>the</strong> case. One thing is clear – we can no longer leave everything to <strong>the</strong><br />
unguided market, this not only damages <strong>the</strong> environment, it damages workers’ rights<br />
in a way that impinges negatively on <strong>the</strong> environment.<br />
This is an issue of increasing concern to all – as <strong>the</strong> transport sector has grown <strong>and</strong><br />
moved towards more private, <strong>and</strong> less public transport, it has become <strong>the</strong> fastest<br />
growing consumer of energy <strong>and</strong> producer of Carbon Dioxide (CO 2 ) <strong>and</strong> o<strong>the</strong>r climate<br />
change causing emissions in Europe, according to <strong>the</strong> ETF, <strong>the</strong> transport sector’s fuel<br />
use now produces about a quarter of <strong>the</strong> world’s CO 2 emissions.<br />
Not taking action to stop dangerous climate change (‘business as usual’) would,<br />
accord to Nicholas Stern, <strong>the</strong> UK government’s chief economist, cost up to 20 times<br />
more than taking action – about 20% of GDP compared to 1% for taking action. Not<br />
1 Trade <strong>Union</strong>s for <strong>Sustainable</strong> <strong>Transport</strong><br />
11
taking action, would, he said, lead to a worldwide depression worse than <strong>the</strong> 1920s<br />
<strong>and</strong> two world wars put toge<strong>the</strong>r. These figures don’t even take into account <strong>the</strong><br />
human impact of climate change which is already causing food shortages, flooding<br />
<strong>and</strong> population migrations. The action <strong>the</strong> UK needs to take, according to <strong>the</strong> UN’s<br />
IPPCC (<strong>the</strong>ir climate scientists) is to cut CO 2 <strong>and</strong> o<strong>the</strong>r greenhouse gas emissions by<br />
about 5 per cent a year, every year, with real cuts starting within <strong>the</strong> next few years 2 .<br />
O<strong>the</strong>r environmental issues like air <strong>and</strong> sea pollution are important <strong>and</strong> affect <strong>the</strong><br />
health of humans <strong>and</strong> wildlife.<br />
The current globalised system is also socially unsustainable. Workers, manufactured<br />
goods, <strong>and</strong> food, have had to travel ever longer distances, often with damaging<br />
impacts on employment, working hours, wage levels, health <strong>and</strong> safety, <strong>and</strong> <strong>the</strong><br />
economic viability of communities <strong>and</strong> regions. At <strong>the</strong> same time, deregulation <strong>and</strong><br />
privatisation has reduced affordable, publicly owned, energy-efficient transport<br />
options such as buses <strong>and</strong> rail. Lastly, our over-reliance on fossil fuel energy from<br />
unstable regions fuels conflict in those regions, as well as damaging <strong>the</strong> planet.<br />
For us, as trade unionists within <strong>the</strong> main transport trade union, <strong>the</strong>re is an opportunity<br />
as well as a risk, if we are willing to engage with <strong>the</strong> issues seriously. What kind of<br />
society do we want? What will be its transport needs, <strong>and</strong> how will <strong>the</strong>y be met?<br />
What impact will that have on those currently working in <strong>the</strong> transport industry, on all<br />
our union’s members, on all working people? This document does not pretend to have<br />
all <strong>the</strong> answers but it is hoped it will help stimulate debate.<br />
Technological solutions, whilst important, are not <strong>the</strong> main way that our mounting<br />
social <strong>and</strong> environmental problems are going to be solved. The scale of <strong>the</strong> problems<br />
is too large <strong>and</strong> it is extremely unlikely that scientists will achieve enough huge<br />
breakthroughs in <strong>the</strong> time available. Social, political <strong>and</strong> economic change will also<br />
be necessary – indeed, inevitable.<br />
In <strong>the</strong> future, a sustainable transport system will have to be based on a fairer<br />
distribution of costs, on stronger local economies, <strong>and</strong> thus on shorter transport<br />
distances. This is not so much a technical as a fundamental systemic change. Gordon<br />
Brown has called climate change “<strong>the</strong> greatest market failure in history” <strong>and</strong> it is clear<br />
that solutions to this serious problem cannot be left to <strong>the</strong> market. Everyone should<br />
have <strong>the</strong> right to work in a way that provides for <strong>the</strong>ir needs without damaging <strong>the</strong>ir<br />
environment, <strong>the</strong> sustainability of <strong>the</strong> planet, or of future generations.<br />
2.3. Impacts<br />
Sustainability <strong>and</strong> social impacts – especially working time<br />
As <strong>the</strong> ETF’s TRUST report says – ‘A fast growing sector that is based on poor<br />
quality jobs is nei<strong>the</strong>r socially nor environmentally sustainable’. The report goes on<br />
to say, ‘it might be an illusion that in transport it is possible to put economic<br />
sustainability (competitiveness) at <strong>the</strong> same footing with environmental <strong>and</strong> social<br />
2 IPCC Fourth Assessment Report – Climate Change 2007<br />
12
sustainability, .reversing liberalisation where it has [worsened] social <strong>and</strong><br />
environmental sustainability would be <strong>the</strong> necessary consequence.’<br />
And it concludes ‘transport is too cheap, from both an environmental <strong>and</strong> social point<br />
of view.’ Costs are kept down by inadequate labour st<strong>and</strong>ards for transport workers,<br />
social dumping, deregulation, <strong>and</strong> also by artificially low fuel costs. In some sectors<br />
(such as aviation) <strong>the</strong>y are not taxed, in o<strong>the</strong>rs <strong>the</strong> fuel costs do not pay fully for <strong>the</strong><br />
impact of that fuel use on society <strong>and</strong> <strong>the</strong> environment.<br />
To take a not atypical example - think about a driver who has spent <strong>the</strong> last several<br />
years having to work a 60 hour week with many night shifts, to earn a decent wage,<br />
shifting imported manufactured goods. Is this sustainable? For who? For <strong>the</strong><br />
employer? For <strong>the</strong> worker? For <strong>the</strong> commuters who are delayed when that driver has<br />
an accident, through exhaustion, or just from sheer congestion? For <strong>the</strong> people –<br />
probably lower income people – who live, breath <strong>the</strong> air, <strong>and</strong> have to cross <strong>the</strong> city<br />
trunk roads that lorry drives down day <strong>and</strong> night? For <strong>the</strong> workers who have been laid<br />
off in <strong>the</strong> manufacturing plant near where he lives, because cheap transportation of<br />
imports makes <strong>the</strong>ir jobs easy to offshore?<br />
Of course it is not just road transport that is impacted upon by <strong>the</strong> move towards<br />
private <strong>and</strong> away from public transport, <strong>and</strong> <strong>the</strong> move to a ‘just in time’ culture. Long<br />
working hours are a real problem in <strong>the</strong> whole of <strong>the</strong> transport sector, despite some<br />
sectors (for example flight crew) being better regulated than most o<strong>the</strong>r workers, <strong>the</strong>re<br />
remains inadequate enforcement <strong>and</strong> insufficient regulation for many. There is some<br />
evidence that transport growth has led not to more jobs, but to longer hours, for<br />
example in Road <strong>Transport</strong>, through <strong>the</strong> misuse of periods of availability. There is<br />
also anecdotal evidence from this sector that suggests an increase in bogus selfemployment<br />
to get round <strong>the</strong> Working Time Directive.<br />
There are o<strong>the</strong>r social consequences, too. Ever increasing distances between where<br />
people live <strong>and</strong> where <strong>the</strong>y work, make union organising <strong>and</strong> community solidarity<br />
more difficult to achieve, thus undermining worker bargaining strength <strong>and</strong> wages.<br />
The average worker now commutes for nearly an hour every day – up sharply on 10<br />
years ago. Of course, this also compounds <strong>the</strong> problem of long hours working<br />
generally.<br />
Sustainability <strong>and</strong> environmental impacts – especially Climate change<br />
The International <strong>Transport</strong> Workers’ Federation (ITF) clearly state “<strong>the</strong>re is no<br />
longer any serious debate about whe<strong>the</strong>r climate change is taking place or not, or<br />
whe<strong>the</strong>r such change is caused by human activity. The scientific evidence is<br />
overwhelming.”<br />
We don’t need to be scientists to talk about climate change but it is important to have<br />
a basic underst<strong>and</strong>ing of what it is.<br />
When fossil fuels are burnt (like oil, coal, petrol or gas), it releases Carbon Dioxide<br />
(CO 2 ) <strong>and</strong> o<strong>the</strong>r ‘greenhouse gases’ into <strong>the</strong> atmosphere. These gases stay in <strong>the</strong><br />
atmosphere <strong>and</strong> trap <strong>the</strong> suns energy. This causes hotter temperatures, rising sea<br />
levels, <strong>and</strong> more extreme wea<strong>the</strong>r like floods, droughts, hurricanes, <strong>and</strong> heat waves. In<br />
13
2003 30,000 older people across Europe were killed due to a heat wave. (A common<br />
misunderst<strong>and</strong>ing is that climate change is related to <strong>the</strong> ozone layer – in fact, this is a<br />
separate problem, which has been largely solved through concerted action).<br />
Climate change in <strong>the</strong> UK can be measured by records extending back over 350 years.<br />
The 1990s was <strong>the</strong> warmest decade in central Engl<strong>and</strong> <strong>and</strong> this warming of climate<br />
over l<strong>and</strong> has been accompanied by warming of UK coastal waters. The growing<br />
season for plants in central Engl<strong>and</strong> has leng<strong>the</strong>ned by about one month since 1900,<br />
while <strong>the</strong>re are now fewer frosts <strong>and</strong> cold spell in <strong>the</strong> winter.<br />
The UN’s climate scientists (<strong>the</strong> IPCC) all agree that unless we reduce our use of<br />
fossil fuels, global temperatures will rise by more than 2 degrees C – possibly this<br />
century. This may not sound like much, but above this level, climate change will<br />
devastate large areas of <strong>the</strong> planet, both at home <strong>and</strong> abroad, causing floods, sea level<br />
rises, droughts, severe shortages of food <strong>and</strong> drinkable water, <strong>and</strong> millions of<br />
refugees 3 . Above this level, <strong>the</strong>re is <strong>the</strong> danger of reaching a ‘tipping point’ of<br />
unstoppable catastrophic climate change. This would arise if <strong>the</strong> oceans, soils, forests<br />
<strong>and</strong> ice caps that currently absorb much of our greenhouse gases were irreversibly<br />
damaged by rising temperatures.<br />
The IPCC says that to have a reasonable chance of limiting warming to no more than<br />
2 degrees, greenhouse gas emissions must start falling by 2015, must be cut by 50-<br />
80% globally by 2050. They also say that industrialised countries like <strong>the</strong> UK, which<br />
currently produce more than <strong>the</strong>ir fair share of greenhouse gases, will need to reduce<br />
emissions by more – by 80-95% by 2050, <strong>and</strong> by 25-40% by 2020.<br />
Countries like China <strong>and</strong> India will, underst<strong>and</strong>ably, only reduce <strong>the</strong>ir greenhouse gas<br />
emissions (which are still much lower per head, than ours) if developed countries like<br />
<strong>the</strong> UK also take action to reduce <strong>the</strong>irs. Therefore, restricting emissions to keep <strong>the</strong><br />
temperature increase to below 2 C, is <strong>the</strong> policy target of both <strong>the</strong> UK <strong>and</strong> <strong>the</strong> EU.<br />
UK <strong>and</strong> EU targets have been set to reflect <strong>the</strong> more ‘conservative’ end of <strong>the</strong>se<br />
scientific projections (so many<br />
environmentalists feel <strong>the</strong>y do not go<br />
far enough).<br />
much shorter term, too.<br />
Many of those who would like to<br />
continue ‘business as usual’<br />
acknowledge <strong>the</strong> need for cuts in CO2<br />
emissions by 2050, but not that we<br />
need cuts in <strong>the</strong> near future, if we are<br />
to prevent dangerous climate change.<br />
Long term targets for <strong>the</strong> reduction of<br />
greenhouse gas emissions are pretty<br />
pointless if we don’t deliver in <strong>the</strong><br />
3 Avoiding dangerous climate change, Hadley Centre, Met Office, Feb 2005, p6<br />
14
The <strong>Transport</strong> Sector of this union accepts <strong>the</strong> scientific consensus that we have to<br />
reduce our fossil fuel use to protect life on <strong>the</strong> planet. The question is, how can<br />
people <strong>and</strong> products get where <strong>the</strong>y need to go, whilst still taking care of our planet?<br />
What does that mean for our way of life, our jobs? Who has <strong>the</strong> responsibility for<br />
making <strong>the</strong>se changes? The T&G Section of <strong>Unite</strong> <strong>the</strong> <strong>Union</strong> has already expressed<br />
strong concern 4 that climate change will have devastating impacts, particularly on <strong>the</strong><br />
poorest people both at home <strong>and</strong> abroad, if we do not take action where we can, both<br />
pushing for government action <strong>and</strong> taking action at <strong>the</strong> workplaces where we are<br />
organised. This report <strong>and</strong> this conference will look at some solutions that have been<br />
suggested <strong>and</strong> begin to weigh up which are <strong>the</strong> most likely to benefit both <strong>the</strong><br />
environment, <strong>and</strong> <strong>the</strong> workers that our union represents. There is an opportunity for<br />
trade unions to make a genuine difference, <strong>and</strong> also for us to organise, as workers<br />
generally say <strong>the</strong>y want <strong>the</strong>ir employers to go green <strong>and</strong> are frustrated that <strong>the</strong>y are<br />
slow to do so.<br />
Finally, in <strong>the</strong> short term, climate change is already happening with an increase in<br />
extreme wea<strong>the</strong>r events, so we need to adapt as well as stopping it getting worse. For<br />
<strong>the</strong> transport sector <strong>the</strong>re are particular risks. The network can be disrupted by floods<br />
<strong>and</strong> storms, <strong>and</strong> summer heat waves lead to dangerously high temperatures affecting<br />
drivers <strong>and</strong> passengers. Solutions could include better design of vehicles <strong>and</strong><br />
infrastructure, as well as different shift patterns (to avoid overcrowding <strong>and</strong><br />
congestion) <strong>and</strong> even small things like relaxed uniform requirements. There should<br />
be a statutory upper limit on workplace temperature which applies to all workplaces<br />
including mobile ones.<br />
2.4 Scientific concerns worsening 5<br />
Recent research suggested that even greater reductions in greenhouse gas emissions<br />
than previously thought are necessary to keep within <strong>the</strong> crucial 2 degree limit,<br />
because <strong>the</strong> planet’s ‘carbon sinks’ (oceans, trees, <strong>and</strong> soil, which absorb climate<br />
change) are already damaged. To have a reasonable chance of staying within two<br />
degrees, we need to stabilise CO 2 in <strong>the</strong> atmosphere at 400 parts per million (ppm) 6 .<br />
Since <strong>the</strong> IPPC report in 2007 which fed into <strong>the</strong> report produced by <strong>the</strong> T&Gs Civil<br />
Air <strong>Transport</strong> Group, many of <strong>the</strong>ir scientists have expressed concerns that <strong>the</strong>ir<br />
conclusions were too conservative <strong>and</strong> <strong>the</strong>ir targets not tough enough. CO 2 is<br />
growing faster than anyone thought it would, <strong>and</strong> some have become even more<br />
worried about <strong>the</strong> ‘tipping point’ where we reach ‘unstoppable climate change’ 7 . The<br />
government’s chief economist Nicholas Stern has also publicly said in <strong>the</strong> last year<br />
that his 2007 report ‘didn’t go far enough’.<br />
O<strong>the</strong>r air pollutants<br />
4 T&G BDC 2005, 2007<br />
5 These figures are all drawn from <strong>the</strong> IPCC’s fourth assessment reports, available at www.ipcc.ch<br />
6 Sometimes expressed as ‘Carbon Dioxide equivalent ‘ or CO2e, which includes o<strong>the</strong>r gases – <strong>the</strong><br />
corresponding figure if that measure is used, is 450ppm CO2e.<br />
7 See for example a recent paper published by <strong>the</strong> Royal Society<br />
http://www.tyndall.ac.uk/publications/journal_papers/fulltext.pdf<br />
15
Greater fuel economy that reduces CO2 emissions, can sometimes reduce o<strong>the</strong>r air<br />
pollutants that are damaging to health <strong>and</strong> <strong>the</strong> environment in <strong>the</strong> immediate term.<br />
However this is not always <strong>the</strong> case (diesel engines being a particular problem) <strong>and</strong> it<br />
is important to ensure that both vehicle design <strong>and</strong> fuel type (for example, low sulphur<br />
fuel) are considered. Nitrous Oxide released particularly from diesel vehicles such as<br />
HGVs contributes both to climate change <strong>and</strong> also reacts with ozone to cause<br />
respiratory problems such as asthma. Sulphur dioxide (released largely from coal<br />
fired power stations but also shipping) causes acid rain. Road <strong>and</strong> water based<br />
transport fuels also release o<strong>the</strong>r airborne particles, both toxic heavy metals (such as<br />
mercury) <strong>and</strong> soot from uncombusted carbon, which again can cause breathing <strong>and</strong><br />
o<strong>the</strong>r health problems.<br />
This is a key Health <strong>and</strong> Safety issue for drivers as many studies have found that those<br />
working behind <strong>the</strong> wheel, especially taxi drivers, are more affected by vehicular air<br />
pollution, than anyone else, <strong>and</strong> <strong>the</strong> problem of air quality within garages is also<br />
severe.<br />
2.5 The impact of <strong>the</strong> transport sector<br />
The chart below shows that in 2006 transport produced more than a quarter (28 per<br />
cent) of <strong>the</strong> UK’s domestic carbon dioxide emissions 8 .<br />
Carbon dioxide emissions by end user in 2006<br />
O<strong>the</strong>r<br />
10%<br />
Residential<br />
27%<br />
Business<br />
35%<br />
<strong>Transport</strong><br />
28%<br />
Figure 21.1: Carbon Emissions by end user in 2006<br />
However about half (52 per cent) of domestic transport emissions do not come from<br />
<strong>the</strong> ‘transport sector’ but from car use, according to <strong>the</strong> AEA Energy <strong>and</strong><br />
<strong>Environment</strong> <strong>Sustainable</strong> Development Indicators. The transport sector itself makes<br />
up 13 per cent of <strong>the</strong> UK’s CO 2 emissions (2006 figures). This proportion has<br />
increased from 8% in 1990, as transport emissions have increased <strong>and</strong> business <strong>and</strong><br />
8 Source: AEA Energy <strong>and</strong> <strong>Environment</strong> <strong>Sustainable</strong> Development Indicators: Carbon dioxide<br />
emissions by end user:<br />
http://www.defra.gov.uk/environment/statistics/globatmos/download/xls/gafg07.xls<br />
16
household emissions have decreased (partly due to <strong>the</strong> off shoring of British industry)<br />
9 .<br />
Emissions from UK <strong>Transport</strong> Industry - trends since 1990<br />
Thous<strong>and</strong> tonnes of CO2 equivalent<br />
120000<br />
100000<br />
80000<br />
60000<br />
40000<br />
20000<br />
0<br />
1990<br />
1996<br />
1997<br />
1998<br />
1999<br />
2000<br />
2001<br />
Year<br />
2002<br />
2003<br />
2004<br />
2005<br />
2006<br />
Air transport<br />
Water transport<br />
Freight transport by road<br />
Buses <strong>and</strong> coaches<br />
Railways<br />
Taxis operation<br />
<strong>Transport</strong> via pipeline<br />
Tubes <strong>and</strong> trams<br />
Figure 2.2: Emissions from UK <strong>Transport</strong> Industry – trends since 1990<br />
Within <strong>the</strong> transport sector (ie excluding car use), air transport accounted for just<br />
under half of all greenhouse gas emissions, water transport <strong>and</strong> road freight about a<br />
fifth each, <strong>and</strong> public transport (rail, bus, coach, tram <strong>and</strong> tubes) accounts for about<br />
one tenth:<br />
Greenhouse Gas Emissions in <strong>the</strong> <strong>Transport</strong> Sector in 2006<br />
Supporting<br />
transport activities<br />
1%<br />
Air transport<br />
46%<br />
Railways<br />
3%<br />
Buses <strong>and</strong> coaches<br />
6%<br />
Freight transport by<br />
road<br />
20%<br />
Tubes <strong>and</strong> trams<br />
0%<br />
Taxis operation<br />
3%<br />
<strong>Transport</strong> via<br />
pipeline<br />
0%<br />
Water transport<br />
21%<br />
Figure 2.3: Greenhouse Gas Emissions in <strong>the</strong> <strong>Transport</strong> Sector<br />
9 http://www.defra.gov.uk/environment/statistics/globatmos/gakf07.htm<br />
17
2.6 Sustainability <strong>and</strong> economic impacts – especially in a downturn<br />
Some fear <strong>the</strong> current global economic downturn means <strong>the</strong>re will be a lessening of<br />
attention on <strong>the</strong> environment, but <strong>the</strong>re is also an emerging argument that now is <strong>the</strong><br />
right time for investment in green jobs – like better public transport <strong>and</strong> greener<br />
vehicles – which could provide livelihoods without damaging people or <strong>the</strong> planet as<br />
much as 30 years of untrammelled globalisation have done.<br />
It is clear that <strong>the</strong> current economic downturn (as well as environmental concerns) are<br />
having an impact on transport dem<strong>and</strong> <strong>and</strong> that is likely to continue. For example:<br />
In 2007/8 <strong>the</strong>re was a decrease in car mileage (for <strong>the</strong> first time since <strong>the</strong> 70s)<br />
<strong>and</strong> an increase in bus <strong>and</strong> train usage as drivers opted to save money <strong>and</strong><br />
travel by public transport instead.<br />
In 2008 passenger flights out of London airports dropped for <strong>the</strong> first time<br />
since 2001.<br />
The withdrawal of operators from some air routes, particularly low cost airline<br />
flights to second home destinations in Europe.<br />
Most observers believe <strong>the</strong> economic downturn will last at least until 2010, with many<br />
pessimistic that <strong>the</strong> economy will recover fully for several years after this.<br />
There are o<strong>the</strong>r trends that have arisen partly as a result of environmental concerns<br />
which are likely to be intensified by <strong>the</strong> downturn, leaving a different pattern of<br />
transport dem<strong>and</strong> in <strong>the</strong> future. For example:<br />
The growth of online retailing <strong>and</strong> home delivery – <strong>and</strong> a shrinkage of high<br />
street/retail jobs. (Home delivery could be a ‘greener’ option than people<br />
driving to out of town shopping centres – but it would be ‘greener’ still if <strong>the</strong>re<br />
were local drop off points).<br />
The growth of video conferencing as businesses cut back on business travel.<br />
Rising dem<strong>and</strong> for public transport, <strong>and</strong> shrinking dem<strong>and</strong> for larger, fuel<br />
hungry vehicles.<br />
More people choosing to holiday in <strong>the</strong> UK or cutting down on frequent short<br />
flights to Europe, due to <strong>the</strong> weakness of <strong>the</strong> pound.<br />
A reduction in off shoring – or an increase?<br />
As <strong>the</strong> last point makes clear, we can’t afford to assume that <strong>the</strong> economy that<br />
emerges from <strong>the</strong> recession will be socially <strong>and</strong> environmentally sustainable. Ano<strong>the</strong>r<br />
example of an area of concern is that investment in rail has shown signs of being hit<br />
by <strong>the</strong> damage to <strong>the</strong> financial markets. A socially <strong>and</strong> environmentally sustainable<br />
economy, union <strong>and</strong> transport system will only emerge if progressive forces like trade<br />
unions <strong>and</strong> <strong>the</strong> environmental movement, work toge<strong>the</strong>r.<br />
2.7 What Can We Do?<br />
Collective Bargaining Strategies<br />
Trade unions have a key role to play in getting information so that <strong>the</strong> impacts of <strong>the</strong><br />
sector as a whole, of companies in <strong>the</strong> sector, <strong>and</strong> of practices within companies, can<br />
be understood. Trade unionists can negotiate for access to information at both<br />
grassroots / workplace level, <strong>and</strong> at national <strong>and</strong> international governmental level.<br />
18
Ideally it would be achieved at both levels but we don’t need to wait for one to<br />
achieve <strong>the</strong> o<strong>the</strong>r. 10 .<br />
In terms of <strong>the</strong> impact that <strong>the</strong> transport sector has on climate change, different figures<br />
are used – for example you will often see figures quoted which only take account of<br />
domestic, not international, transport emissions (as international CO2 emissions are<br />
not currently regulated). This can make it look as though transport plays a smaller<br />
role than it actually does, in generating <strong>the</strong> CO2 emissions that cause climate change.<br />
The government has said that international transport emissions will be regulated in<br />
<strong>the</strong> future as clearly <strong>the</strong>y also contribute to climate change.<br />
Trade union members can elect union environmental reps to begin to ask <strong>the</strong><br />
questions about resource use, impact, <strong>and</strong> sustainable working practices, <strong>and</strong> <strong>the</strong>n<br />
collectively bargain around this.<br />
There are examples of collective bargaining around environmental concerns given<br />
elsewhere in this report – for example, <strong>the</strong> truckers <strong>and</strong> California dock workers who<br />
have negotiated ‘green contracts’ in <strong>the</strong> US, <strong>and</strong> calls for improved public transport,<br />
reduced reliance on overtime/shift work <strong>and</strong> just in time working, as well as for<br />
greener travel plans for all workers.<br />
For suggestions on practical workplace based actions that trade union reps can take,<br />
Appendix 3 provides a starting point <strong>and</strong> <strong>the</strong>re are also examples in <strong>the</strong> <strong>Unite</strong> booklet<br />
‘Climate change’. What o<strong>the</strong>r bargaining materials would help – a model agreement<br />
on <strong>the</strong> environment, for example?<br />
<strong>Union</strong> reps may find that negotiating with employers for investment in green<br />
improvements to <strong>the</strong> fleet <strong>and</strong> infrastructure, <strong>and</strong> for low-cost or no-cost moves to<br />
more energy efficient working practices, can also lead to increased job security in two<br />
ways. Firstly, such investment signals long-term commitment by employers to <strong>the</strong><br />
service. Secondly, saving fuel will obviously save money in <strong>the</strong> medium or even<br />
short term, so this can be used to boost job security <strong>and</strong>/or wages, with any savings<br />
negotiated to be ploughed back into <strong>the</strong> company or into wage packets. Indeed many<br />
employers will already be considering ways of saving fuel already, so it is crucial that<br />
<strong>Unite</strong> reps are able to be fully involved in <strong>the</strong>se discussions, to ensure such changes<br />
are implemented in a way that benefits workers, <strong>and</strong> are never used against <strong>the</strong>m.<br />
Modal shift towards lower carbon travel<br />
<strong>Unite</strong> has long supported a shift in transportation modes, reducing <strong>the</strong> reliance on cars<br />
<strong>and</strong> lorries <strong>and</strong> increasing <strong>the</strong> use of buses, trams <strong>and</strong> light rail <strong>and</strong> taxis in urban or<br />
sub-urban areas, <strong>and</strong> railways <strong>and</strong> coaches between cities.<br />
Such a policy would bring associated shifts in employment. It could ultimately lead<br />
to fewer or different types of, jobs in car <strong>and</strong> lorry manufacturing, a shift towards<br />
manufacturing of buses, trams <strong>and</strong> trains <strong>and</strong> away from private vehicles <strong>and</strong> planes,<br />
<strong>and</strong> fewer jobs in fuel refining <strong>and</strong> in fuel distribution. There would be more jobs in<br />
driving <strong>and</strong> operating public transport, in <strong>the</strong> manufacture of low carbon vehicles such<br />
10 For more on <strong>the</strong> role of Green Reps see <strong>the</strong> TUC’s publication ‘Go Green At Work’ (2008)<br />
19
as electric <strong>and</strong> hybrid electric vehicles, public transport vehicles <strong>and</strong> bikes, in <strong>the</strong><br />
repair <strong>and</strong> maintenance of vehicles, in retro-fitting existing vehicles to be more fuel<br />
efficient, <strong>and</strong> in building <strong>and</strong> maintaining <strong>the</strong> infrastructure needed to support it. The<br />
International Labour Organisation (ILO) estimates that every job created in public<br />
transport creates between 2 <strong>and</strong> 4 indirect jobs in <strong>the</strong> wider economy.<br />
It is important to note that this is not so much <strong>the</strong> question of car ownership that is <strong>the</strong><br />
main challenge. Certainly <strong>the</strong> quality <strong>and</strong> st<strong>and</strong>ard of <strong>the</strong> vehicles engaged in private<br />
use must change. Put more clearly, <strong>the</strong> use of <strong>the</strong> private car can be restrained without<br />
damaging livelihoods or <strong>the</strong> quality of life. For example it is often pointed out that<br />
Germany has higher levels of car ownership but lower levels of car use, with people<br />
not needing to use <strong>the</strong>ir cars as often because of good public transport. Also,<br />
consumer dem<strong>and</strong> for greener cars has risen sharply <strong>and</strong> this will continue to rise due<br />
to both financial <strong>and</strong> environmental concerns, as indeed must public sector dem<strong>and</strong><br />
for more, <strong>and</strong> greener, public transport vehicles. We will need to work with our<br />
union’s Vehicle Building section to ensure this growing dem<strong>and</strong> can be met as far as<br />
possible by green, locally manufactured vehicles supplying high quality jobs. This<br />
will require better support from <strong>the</strong> UK government for domestic R&D <strong>and</strong><br />
manufacture, as well as better infrastructure. See <strong>the</strong> section on ‘technology’ for<br />
more on <strong>the</strong> options in this area.<br />
None of this can happen without both stricter environmental st<strong>and</strong>ards <strong>and</strong> regulations<br />
to drive dem<strong>and</strong> in <strong>the</strong> transport sector, <strong>and</strong> greater, more accountable direct state<br />
investment in public transport infrastructure <strong>and</strong> services.<br />
Re-orientating <strong>the</strong> transport sector towards greater sustainability also needs changes in<br />
l<strong>and</strong> use <strong>and</strong> planning. More compact cities <strong>and</strong> shorter distances reduce <strong>the</strong> overall<br />
need for motorised transport. They can also make alternatives like public transport,<br />
cycling, <strong>and</strong> walking, more feasible.<br />
There are some initiatives that can be promoted at workplace level by trade union<br />
activists such as car-sharing, travel planning, <strong>and</strong> training for drivers in fuel<br />
efficiency, <strong>and</strong> <strong>the</strong>se are areas that trade union activists in any workplace should be<br />
encouraged to pursue, to reduce congestion <strong>and</strong> pollution.<br />
Public transport<br />
The deregulation of buses since 1986 (along with <strong>the</strong> privatisation of <strong>the</strong> railways) has<br />
been a disaster for public transport <strong>and</strong> <strong>the</strong> environment, leading to low wages, high<br />
fares, fewer routes <strong>and</strong> passengers, <strong>and</strong> worse congestion <strong>and</strong> overcrowding.<br />
Improving public transport is critical to any serious environmental strategy. More<br />
immediate regulation through quality contracts in <strong>the</strong> immediate term, <strong>and</strong> renationalisation<br />
/ municipal ownership in <strong>the</strong> longer term, is badly needed to deliver<br />
more services, higher staffing levels, better trained <strong>and</strong> rewarded staff, more<br />
integration with o<strong>the</strong>r modes of transport, <strong>and</strong> lower fares. Such measures would<br />
make public transport a genuinely realistic, comfortable <strong>and</strong> safe alternative to private<br />
car use.<br />
EU proposals to force <strong>the</strong> tendering of bus contracts have been fiercely resisted by <strong>the</strong><br />
European trade unions. We need to continue to fight to protect <strong>the</strong> rights of local<br />
20
authorities to provide bus services <strong>the</strong>mselves, <strong>and</strong> to negotiate contracts which<br />
specify high st<strong>and</strong>ards of labour relations, service <strong>and</strong> environmental impact.<br />
There is also a need to retrofit <strong>and</strong> produce newer buses with less polluting engines, as<br />
well as using lower emission fuel. Greater subsidy is needed but ultimately as <strong>the</strong><br />
ETF says, ‘<strong>the</strong> role of <strong>the</strong> state cannot be limited to ensuring (fair) competition<br />
between companies <strong>and</strong> probably providing infrastructure, where it is too expensive<br />
for <strong>the</strong> market to invest. The market has severe side effects on social <strong>and</strong> ecological<br />
sustainability <strong>and</strong> does not provide sustainable infrastructure <strong>and</strong> public transport’.<br />
Nowhere is this clearer than on <strong>the</strong> buses <strong>and</strong> in <strong>the</strong> ‘Cinderella sector’ of coaches.<br />
Railways<br />
Given <strong>the</strong> nature of <strong>the</strong> union’s structures at present, rail has not been taken account<br />
of fully in this report. To some extent <strong>the</strong> new trade group will deal with this.<br />
Between 1990 <strong>and</strong> 2006 Greenhouse gas emissions (GGE) from railways increased<br />
from 0.24 per cent of total GGE to 0.35 per cent. During <strong>the</strong> same period total GGE<br />
from <strong>the</strong> transport sector increased from 7.75 per cent to 12.8 per cent. So it is clear to<br />
see that railways make up only a small amount of <strong>the</strong> total GGE in <strong>the</strong> UK <strong>and</strong> that<br />
has only increased marginally in <strong>the</strong> last 17 years, <strong>and</strong> at a slower rate that <strong>the</strong> rest of<br />
transport which has increased considerably. 11<br />
Railways are an energy-efficient carrier of people <strong>and</strong> goods <strong>and</strong> hence produce<br />
relatively less CO 2 emissions per passenger than o<strong>the</strong>r modes. Emissions of CO 2 per<br />
passenger/Km are, on average, approximately half that of travel by car. 12 The UK is a<br />
crowded isl<strong>and</strong> with a high population density. Rail makes more efficient use of<br />
space. A double track railway can carry up to 10 times <strong>the</strong> number of people per hour<br />
than a 2-lane road. 13 Railways can’t always get people or freight to <strong>the</strong> desired<br />
destination in one go but <strong>the</strong>y can often take <strong>the</strong>m part or <strong>the</strong> majority of <strong>the</strong> way in<br />
many instances <strong>and</strong> in partnership with o<strong>the</strong>r modes of transport clearly have a lot to<br />
offer in delivering a sustainable transport plan.<br />
Freight to rail<br />
Rail transport is more fuel efficient <strong>and</strong> more jobs intensive than road transport, both<br />
in terms of day to day operations <strong>and</strong> <strong>the</strong> infrastructure required (ie road or track).<br />
Also <strong>the</strong>re is a need to develop a number of rail freight consolidation centres across<br />
<strong>the</strong> UK Carrying freight by rail results in an 80% cut in CO 2 emissions per Kilogram<br />
carried compared to road haulage. 14 T&G policy has historically favoured rail<br />
building over roads <strong>and</strong> continues to do so.<br />
However government investment both in <strong>the</strong> UK <strong>and</strong> <strong>the</strong> EU has favoured road<br />
building over rail, with rail employment falling <strong>and</strong> road freight employment<br />
growing, in recent years. The majority of our freight in <strong>the</strong> UK travels by road.<br />
Switching some of this to rail would result in a dramatic reduction in CO 2 emissions.<br />
11 www.statistics.gov.uk/statbase/Expodata/Spreadsheets/D5695.xls<br />
12 Railtrack - “Benefits of rail<br />
13<br />
The Railway Forum - “Rail <strong>and</strong> <strong>the</strong> <strong>Environment</strong>”<br />
14 The Railway Forum - “Rail <strong>and</strong> <strong>the</strong> <strong>Environment</strong>”<br />
21
Air to rail<br />
Six out of ten flights from London airports are to destinations that can, or could, be<br />
reached by high speed rail. Switching <strong>the</strong>se journeys to rail would be particularly<br />
beneficial as short haul flights produce a high proportion of more dangerous<br />
emissions <strong>and</strong> are particularly fuel inefficient, because take off uses up to 25 per cent<br />
of <strong>the</strong> overall fuel. High speed rail produces only a fraction of such emissions,<br />
according to <strong>the</strong> ILO/ITUC/UN ‘Green Jobs’ report. 15 The DfT estimates that short<br />
haul air craft emit 0.15kg of CO 2 per passenger kilometre. This, multiplied by 2, (<strong>the</strong><br />
T&G’s estimate of <strong>the</strong> relative impact of radiative forcing) equals 0.3kg. The DfT<br />
estimates that rail on average emits 0.04kg of CO 2 per passenger kilometre, which is<br />
nearly 10 times less than short haul air.<br />
Given that investment, particularly in public transport, is absolutely critical, <strong>the</strong> big<br />
question is where are <strong>the</strong>se funds to come from?. Some have called for a tax on fuel<br />
<strong>and</strong> air passengers to be ring fenced for this purpose. Our government has fiercely<br />
resisted this move so far but <strong>the</strong>re is a danger of a political backlash.<br />
The aviation industry argues that unlike o<strong>the</strong>r transport modes, it pays for its own<br />
infrastructure. On <strong>the</strong> o<strong>the</strong>r h<strong>and</strong> it has been pointed out that in 2003 aviation<br />
subsidies (exemptions from fuel duty <strong>and</strong> VAT) were worth £9 billion a year 16 , or<br />
about £45,000 per job per year (based on ILO estimates of 200,000 employed in<br />
aviation in <strong>the</strong> UK, broadly defined), <strong>and</strong> ano<strong>the</strong>r report argued that this level of<br />
subsidy finances job loss elsewhere in <strong>the</strong> transport sector that do not have <strong>the</strong> same<br />
tax benefits 17 . Although <strong>the</strong> union currently supports Heathrow expansion if<br />
sustainable, a report by <strong>the</strong> independent House of Commons research department in<br />
February 2009 18 cast some doubt both on <strong>the</strong> projected level of economic benefits,<br />
<strong>and</strong> on <strong>the</strong> likely level of technological breakthroughs. They argued <strong>the</strong> economic<br />
benefit was nearer to £1.5 billion or less ra<strong>the</strong>r than £8.2billion cited in <strong>the</strong> White<br />
Paper, partly because <strong>the</strong> government’s cost-benefit analysis “does not consider”<br />
alternative schemes which this union also supports, such as high speed rail. As <strong>the</strong><br />
ILO report states: “A shift towards more sustainable transport is feasible, but it<br />
requires careful planning <strong>and</strong> transition measures.”<br />
Relocalisation 19<br />
Buying locally manufactured goods <strong>and</strong> locally grown food, protecting local transport<br />
<strong>and</strong> services, could impact on jobs in logistics distribution but would increase local<br />
employment in <strong>the</strong> manufacturing, public transport <strong>and</strong> services sector more<br />
generally.<br />
15 p149<br />
16 The Hidden Cost of Flying, Sewill, AEF 2003, confirmed by BAA consultants Volterra Since <strong>the</strong>n,<br />
inflation <strong>and</strong> <strong>the</strong> increased number of passengers increased this figure to £10billion but it was brought<br />
back to £9bn by <strong>the</strong> rise in air passenger duty on 1/2/07.<br />
17 Predict <strong>and</strong> Provide, Cairns <strong>and</strong> Newson, 2006<br />
18 http://www.parliament.uk/commons/lib/research/rp2009/rp09-011.pdf<br />
19 Relocalisation means moving away from globalisation <strong>and</strong> back towards local production <strong>and</strong><br />
consumption<br />
22
The trend over <strong>the</strong> last 30 years or more has been towards ever increasing<br />
globalisation, which has created growth in <strong>the</strong> transport sectors. Retailers <strong>and</strong><br />
manufacturers have sought ever cheaper supply chains. Food <strong>and</strong> manufactured<br />
products travel much fur<strong>the</strong>r before <strong>the</strong>y reach us. People travel longer distances to<br />
get to work, as industries in many local areas are closed down, centralised, or off<br />
shored.<br />
A classic example is <strong>the</strong> Young’s prawn plant in Annan in Scotl<strong>and</strong>, next to <strong>the</strong><br />
fishing grounds. 120 jobs were lost in <strong>the</strong> plant, when <strong>the</strong> decision was taken to air<br />
freight <strong>the</strong> prawns to Thail<strong>and</strong> for processing, <strong>and</strong> <strong>the</strong>n re-import <strong>the</strong>m back to sell in<br />
UK shops. Ano<strong>the</strong>r is what has been called <strong>the</strong> ‘great food swap’ where Britain<br />
imports 240,000 tonnes of<br />
pork from <strong>the</strong> Ne<strong>the</strong>rl<strong>and</strong>s<br />
each year - <strong>and</strong> exports<br />
195,000 tonnes back 20 .<br />
The current economic crisis<br />
is already causing many to<br />
question <strong>the</strong> sustainability<br />
of this model, on social <strong>and</strong><br />
economic grounds as much<br />
as on environmental ones.<br />
We are hearing calls<br />
stronger than at any time since <strong>the</strong> 70s to ‘buy British’ to protect jobs, to holiday in<br />
<strong>the</strong> UK, to rediscover an economy based on manufacturing more of <strong>the</strong> things we use<br />
close to home ra<strong>the</strong>r than relying on imported goods from China <strong>and</strong> o<strong>the</strong>r countries<br />
involving unsustainable lengthy supply chains, an economy that is ‘jobs-intensive’<br />
ra<strong>the</strong>r than energy-intensive <strong>and</strong> based on artificially cheap transport. There are<br />
indications that consumers are heeding <strong>the</strong>se calls, again probably as much for<br />
economic as for environmental reasons.<br />
This issue that will need to be addressed toge<strong>the</strong>r with all o<strong>the</strong>r sectors of <strong>the</strong> union.<br />
It’s clear that long supply chains don’t serve <strong>the</strong> wider economy. One of our<br />
members gave <strong>the</strong> example of <strong>the</strong> UK Nissan production line, which was stopped for<br />
<strong>the</strong> want of a supply of 90p door seal shipped in from China - <strong>the</strong> factory down <strong>the</strong><br />
road which made <strong>the</strong> seals, presumably having closed down!<br />
Many environmentalists argue <strong>the</strong> ‘external’ costs of transport (e.g. CO 2 emissions,<br />
<strong>the</strong> effect on health <strong>and</strong> wildlife, traffic, noise, stress, etc) are not met by <strong>the</strong> transport<br />
industry but are passed on to society as a whole. Much of <strong>the</strong> policy focus has been<br />
on who should pay for <strong>the</strong>se external costs. Without regulation, businesses are in fact<br />
legally bound to pass <strong>the</strong>se costs on to society as much as possible. Ra<strong>the</strong>r than<br />
arguing whe<strong>the</strong>r costs are paid by consumers, passengers, workers, or citizens at<br />
large (for example <strong>the</strong> higher incidence of childhood asthma near busy trunk routes<br />
<strong>and</strong> transport hubs), perhaps we should be arguing for regulation to prevent<br />
businesses passing <strong>the</strong>se costs on to any of <strong>the</strong>se groups, <strong>and</strong> to internalise <strong>the</strong>m. Of<br />
course businesses, would state that this would make <strong>the</strong>m unprofitable but is this<br />
really true?<br />
20 Caroline Lucas MEP, Stopping <strong>the</strong> Great Food Swap, 2001<br />
23
Technological solutions:<br />
Technology, its development <strong>and</strong> use, is never non-political. Our members will<br />
already be all too aware of this, from lorry drivers to BA ground staff. So when<br />
faced with proposed technological solutions to environmental <strong>and</strong> sustainability<br />
problems we need always ask – who controls this <strong>and</strong> to what ends?<br />
There is a need for improved technology in transport to make it more environmentally<br />
friendly, but political <strong>and</strong> behavioural solutions are paramount. As Compass said in<br />
“The <strong>Environment</strong> we Inhabit” (2007), “We do not have to wait for major technical<br />
breakthroughs to make deep cuts in emissions. We know that <strong>the</strong>re is already huge<br />
scope for change...”. As outlined above, <strong>the</strong>re is currently not enough political <strong>and</strong><br />
business will to use <strong>and</strong> roll out existing fuel efficient technologies. The relative<br />
underinvestment in buses, coaches <strong>and</strong> rail as against cars <strong>and</strong> lorries, is a case in<br />
point. As <strong>the</strong> ITF states “We note that concrete policy measures ra<strong>the</strong>r tend to favour<br />
technological solutions...while a real political commitment to promote modal shift <strong>and</strong><br />
establish an integrated transport system is still missing.”<br />
As stated above, it’s important to work with our colleagues in manufacturing <strong>and</strong><br />
vehicle production to ensure that we get evidence based policies to ensure our<br />
transport can be run in <strong>the</strong> most energy efficient ways, domestically supplied where<br />
possible. Therefore retro-fitting as well as new vehicles is important.<br />
Secondly, given <strong>the</strong> likely<br />
slowness of transforming our<br />
whole transport system to a<br />
more energy efficient one,<br />
dem<strong>and</strong> for fuel intensive<br />
transport must also be<br />
reduced. If we wait to see<br />
what technologies can do,<br />
before we reduce fuel<br />
intensive transport dem<strong>and</strong>, it<br />
will be too late.<br />
Finally, <strong>and</strong> most<br />
controversially, some have<br />
accused companies of<br />
‘greenwash’, investing in<br />
technology as a PR exercise<br />
to buy <strong>the</strong>mselves some time,<br />
without it having any real<br />
prospects for solving <strong>the</strong><br />
problem 21 .<br />
It is important to be aware of both <strong>the</strong> technological solutions that are being talked<br />
about, <strong>the</strong>ir potential <strong>and</strong> <strong>the</strong>ir limitations. This section will look briefly at general<br />
fuel efficiency (through vehicle design <strong>and</strong> use), alternative fuels (i.e. biofuels,<br />
21 Technofixes, Corporate Watch 2008<br />
24
sometimes called ‘agrofuels’ when grown on large scale), <strong>and</strong> finally alternative ways<br />
of storing energy for transport (hydrogen <strong>and</strong> electricity),<br />
General fuel efficiency<br />
Much can be achieved with existing technologies. For example a US study found that<br />
use of existing technologies could, if properly implemented, raise car <strong>and</strong> commercial<br />
vehicles fuel efficiency by 40 per cent, saving large sums <strong>and</strong> also generating 130,000<br />
jobs. 22<br />
However <strong>the</strong> IPCC has voiced concern that fuel efficient technologies do not<br />
automatically equal a ‘greener’ transport industry. Instead <strong>the</strong>y are often cancelled<br />
out by manufacturers to squeeze more performance (acceleration, a heavier<br />
vehicle/more gadgets) from <strong>the</strong> same amount of fuel, ra<strong>the</strong>r than to get <strong>the</strong> same<br />
performance from less fuel.<br />
In terms of commercial fleets is it crucial that trade union activists are involved in<br />
vehicle choice, <strong>and</strong> given clear information to help ensure <strong>the</strong> best possible balance<br />
between environmental <strong>and</strong> o<strong>the</strong>r workforce concerns.<br />
A general move towards fuel efficiency would also have wider economic benefits.<br />
Even taking into account fuel taxes, if less money is spent on fuel, it frees up money<br />
to be spent in o<strong>the</strong>r sectors which are more labour intensive than <strong>the</strong> energy industry,<br />
thus creating more jobs.<br />
Examples are given elsewhere in this report about <strong>the</strong> use of back-shifting to reduce<br />
unnecessary empty journeys in road haulage. There is also a need to address speed<br />
issues as, generally, slower travelling is more fuel efficient - but this would require<br />
cultural <strong>and</strong> regulatory changes.<br />
Agrofuels<br />
Agrofuels (biofuels grown on an industrial scale) have been popular with<br />
governments <strong>and</strong> large scale agriculture. They have <strong>the</strong> advantage of being a liquid<br />
fuel that could replace petrol <strong>and</strong> diesel with little infrastructural changes. They have<br />
been promoted as ‘renewable’ or ‘carbon neutral’. The EU in January 2007 included<br />
a m<strong>and</strong>atory target of 10% of agrofuel use in transport by 2020. <strong>Unite</strong>’s agriculture<br />
section has been supportive of biofuels in <strong>the</strong> past but now has serious concerns that<br />
this could worsen l<strong>and</strong> conflicts, raise<br />
food prices, damage biodiversity <strong>and</strong><br />
possibly produce more CO 2 than it<br />
saves.<br />
Growing agrofuels uses much fossil<br />
fuel in <strong>the</strong> growing (fossil fuel based<br />
pesticides <strong>and</strong> fertilisers), harvesting<br />
<strong>and</strong> transporting of fuel. Much is<br />
grown in Brazil <strong>and</strong> Indonesia,<br />
22 ACEEE 2001, Apollo Alliance 2004<br />
25
contributing to rainforest destruction. This worsens climate change because <strong>the</strong> trees<br />
absorb <strong>and</strong> store a huge amount of CO 2 .<br />
As well as potentially creating more of a climate problem than <strong>the</strong>y solve, agrofuels<br />
have also been accused by <strong>the</strong> UN’s Food <strong>and</strong> Agriculture Programme of displacing<br />
food production <strong>and</strong> making it more expensive. Greenpeace has calculated that<br />
replacing a mere 10% of <strong>the</strong> world’s diesel with biodiesel would use up three quarters<br />
of <strong>the</strong> world’s soya, rapeseed <strong>and</strong> palm oil production 23 .<br />
Biomass like wood <strong>and</strong> waste can also be used to generate energy, <strong>and</strong> wood can be<br />
grown on l<strong>and</strong> that is not suitable for agriculture. There has been much talk of<br />
converting <strong>the</strong>se to liquids or gas to use as ‘2 nd generation biofuels’. However<br />
burning <strong>the</strong>se substances to generate electricity or digesting <strong>the</strong>m to generate gas, is<br />
far more efficient than turning <strong>the</strong>m into liquid fuels.<br />
Given <strong>the</strong>se concerns government biofuels targets remain under review.<br />
Recycled biofuel is a different matter – <strong>the</strong> material (for example, recycled chip fat)<br />
would o<strong>the</strong>rwise end up in l<strong>and</strong>fill so it is a genuinely ‘green’ way of fuelling<br />
vehicles. It could power up to 2 per cent of <strong>the</strong> UK’s freight.<br />
Hydrogen<br />
Hydrogen gas is a way of storing energy, not a source of energy – a bit like a battery.<br />
To produce <strong>and</strong> compress it, you need electricity (most of which is still produced by<br />
fossil fuel sources in <strong>the</strong> UK) to extract it from water, <strong>and</strong> in most methods, an<br />
additional fuel source such as natural gas. Powering <strong>the</strong> UK’s vehicles with hydrogen<br />
would more than double <strong>the</strong> country’s current electricity consumption 24 . It is likely<br />
that any big expansion of hydrogen power would have to rely on mostly fossil fuel<br />
power for <strong>the</strong> foreseeable future. According to some people ‘producing <strong>the</strong> hydrogen<br />
<strong>and</strong> compressing or liquefying it to use as a vehicle fuel could have a worse impact on<br />
<strong>the</strong> climate than using petrol’ 25 .<br />
On <strong>the</strong> o<strong>the</strong>r h<strong>and</strong>, hydrogen-powered fuel cells produce no pollution on <strong>the</strong> roads –<br />
<strong>the</strong> only by-product is water vapour. Therefore it has been seen as a useful option for<br />
cities <strong>and</strong> also with H&S benefits, <strong>and</strong> introduced onto some London buses by Ken<br />
Livingstone. Public procurement <strong>and</strong> significant EU <strong>and</strong> US funding has sought to<br />
drive this technology.<br />
For a number of years vehicle manufacturers have claimed that hydrogen powered<br />
vehicles are only a few years away from mass production – but <strong>the</strong>y have been saying<br />
this for quite a long time! The technology remains very expensive as it dependent on<br />
precious materials such as platinum <strong>and</strong> on difficult processes. Safety is a concern, as<br />
hydrogen leaks <strong>and</strong> ignites easily <strong>and</strong> invisibly. The market has also been held back<br />
by doubts whe<strong>the</strong>r <strong>the</strong> necessary infrastructure (eg hydrogen filling stations <strong>and</strong><br />
distribution networks) is likely to appear. Therefore, in <strong>the</strong> last couple of years car<br />
manufacturers have appeared to move away from hydrogen <strong>and</strong> back towards <strong>the</strong> idea<br />
of electric vehicles.<br />
23 Greenpeace International – Cooking <strong>the</strong> Climate, November 2007<br />
24 Decarbonising <strong>the</strong> UK - Tyndall Centre for Climate Change Research<br />
25 Techno-fixes – A Critical <strong>Guide</strong> to Climate Change Technologies, Corporate Watch, 2008<br />
26
On balance it seems likely that hydrogen could be useful for short range larger<br />
vehicles i.e. city based public transport, but is unlikely to be cost effective to power<br />
o<strong>the</strong>r forms of transport on a significant scale.<br />
The drawbacks to both hydrogen <strong>and</strong> agrofuels are particularly acute to <strong>the</strong> needs of<br />
aviation fuel, such that a recent report by <strong>the</strong> House of Commons researchers stated<br />
that “for <strong>the</strong> foreseeable future, kerosene will remain <strong>the</strong> only viable option [for<br />
fuelling aircraft].” The report went on to observe that “aircraft designs do not at <strong>the</strong><br />
moment incorporate many of <strong>the</strong> features highlighted by <strong>the</strong> secretary of state...unless<br />
<strong>the</strong>re are some very rapid improvements in technology, it will be some time before<br />
more environmentally friendly commercial aircraft are in widespread operation.” 26<br />
Electric vehicles<br />
Clearly electric vehicles also rely on energy production from existing or new sources,<br />
much like hydrogen. They do need to be plugged in to recharge <strong>and</strong> <strong>the</strong>refore are<br />
more suitable for short journeys within cities or for site vehicles, (unless <strong>the</strong>re is<br />
substantial investment in new infrastructure to enable ‘filling up’ on route. Although<br />
<strong>the</strong>se vehicles may produce less greenhouse gas emissions <strong>and</strong> o<strong>the</strong>r pollution in<br />
cities, <strong>the</strong> same may not be true for <strong>the</strong> source of <strong>the</strong> electricity, with most electricity<br />
in <strong>the</strong> UK currently produced by fossil fuels like coal <strong>and</strong> gas. For example is <strong>the</strong><br />
electricity produced by a polluting coal fired electricity station? None<strong>the</strong>less electric<br />
vehicles do ‘burn clean’ at <strong>the</strong> point of use which clearly has huge benefits to health<br />
<strong>and</strong> safety as well as to <strong>the</strong> environment by roads <strong>and</strong> in cities. And <strong>the</strong>re is greater<br />
potential in <strong>the</strong> long term for genuinely renewable electricity (eg from wind, tidal <strong>and</strong><br />
wave) than for genuinely renewable liquid fuels.<br />
Hybrid vehicles<br />
By combining an electric engine <strong>and</strong> a conventional motor, hybrids are more fuel<br />
efficient than a conventional petrol engine (in cities at least), but because <strong>the</strong> electric<br />
battery is re-charged while <strong>the</strong> car is driving, <strong>the</strong>y don’t require <strong>the</strong> additional<br />
infrastructure that a wholly electric vehicle would require. Their size <strong>and</strong> relative<br />
complexity also means <strong>the</strong>y provide more jobs.<br />
Plug-in hybrid vehicles<br />
Perhaps <strong>the</strong> most promising in <strong>the</strong> short to medium term, <strong>the</strong>se run on an electric<br />
charge alone for <strong>the</strong> first 50 miles or so (thus meeting <strong>the</strong> majority of journey needs<br />
with ultra low emissions <strong>and</strong> fuel use) <strong>and</strong> after that, run on a hybrid engine ie petrol<br />
or diesel topped up by self-generated electric power, without <strong>the</strong> need for an extensive<br />
charging infrastructure. Such vehicles are already being manufactured in buses (eg<br />
Wrights in Nor<strong>the</strong>rn Irel<strong>and</strong>) <strong>and</strong> most big car companies are hoping to roll out such<br />
vehicles in <strong>the</strong> next 2 or 3 years, though cost will still be an issue until <strong>the</strong>y are made<br />
on a large scale.<br />
International action - Market based mechanisms <strong>and</strong> carbon trading<br />
26 http://www.parliament.uk/commons/lib/research/rp2009/rp09-011.pdf<br />
27
Currently all corporations are legally obliged to put profit above all o<strong>the</strong>r<br />
considerations. The only option is to break this short termism through legal regulation<br />
<strong>and</strong> pressure from both consumers <strong>and</strong> workers. In <strong>the</strong> current climate, where <strong>the</strong><br />
failings of ‘<strong>the</strong> market’ have become apparent, greater regulation is once more being<br />
talked about as a serious option.<br />
However <strong>the</strong> transport sector employers, like most o<strong>the</strong>rs, has tended to resist<br />
straightforward regulation <strong>and</strong> prefer ‘market based mechanisms’ (like carbon trading<br />
<strong>and</strong> tax breaks) where companies are given financial incentives to reduce emissions.<br />
The Kyoto protocol is a mechanism to do this – through monitoring carbon levels <strong>and</strong><br />
a cap <strong>and</strong> trade system. A cap is put on <strong>the</strong> total amount of carbon emissions (<strong>and</strong><br />
o<strong>the</strong>r greenhouse gases) <strong>and</strong> <strong>the</strong>n this amount is divided up amongst countries, largely<br />
on <strong>the</strong> basis of <strong>the</strong>ir current emissions. Trade unions have tended to support <strong>the</strong>se<br />
schemes, as have those employers who wish to be seen as ‘progressive’, on <strong>the</strong> basis<br />
that <strong>the</strong>y level <strong>the</strong> playing field <strong>and</strong> create a more predictable <strong>and</strong> certain business<br />
environment.<br />
The current Kyoto agreement expires in 2012 <strong>and</strong> trade unions have been involved for<br />
several years in <strong>the</strong> negotiations towards a new agreement. This year (2009) is being<br />
seen as <strong>the</strong> ‘crunch’ year to get a new Kyoto agreement thrashed out. Some of <strong>the</strong><br />
main areas that this will consider – including <strong>the</strong> distribution of permits, <strong>the</strong> extent to<br />
which transport will be brought into <strong>the</strong> scheme, <strong>and</strong> whe<strong>the</strong>r money could be ‘ringfenced’<br />
for use in green projects like public transport, are highlighted in <strong>the</strong> short<br />
appendix at <strong>the</strong> end of this report.<br />
2.8 Conclusion<br />
There has been long st<strong>and</strong>ing union concern that deregulation <strong>and</strong> privatisation have<br />
led to a reduction in affordable, less fuel intensive public transport options open to<br />
people. This is part of a worldwide trend towards increasing reliance on more fuel<br />
intensive transport such as private cars, trucks <strong>and</strong> planes.<br />
Business as usual is likely to lead to <strong>the</strong>se trends continuing, <strong>and</strong> <strong>the</strong>n (it is now being<br />
seen) to economic crisis. New priorities for <strong>the</strong>se new times would entail substantial<br />
job opportunities, though this would require careful planning <strong>and</strong> transition measures,<br />
with union involvement crucial. Economic crisis may lead to <strong>the</strong> worst of all worlds,<br />
with jobs lost in <strong>the</strong> high carbon transportation industries <strong>and</strong> not created in local<br />
industries <strong>and</strong> in <strong>the</strong> lower carbon transportation industries. A response to <strong>the</strong><br />
economic crisis that includes proper strategic planning for <strong>the</strong> whole transport sector,<br />
<strong>and</strong> a shift in subsidies <strong>and</strong> o<strong>the</strong>r forms of financing, would allow enormous scope for<br />
sustainable mobility <strong>and</strong> sustainable employment. Such a response, wresting control<br />
back from <strong>the</strong> h<strong>and</strong>s of <strong>the</strong> market, is increasingly being seen as essential if we are to<br />
have a socially <strong>and</strong> environmentally sustainable transport system.<br />
28
3 Civil Air <strong>Transport</strong>, Climate Change <strong>and</strong> <strong>the</strong> Economy<br />
3.1 Introduction<br />
The Stern Report was a major publication about <strong>the</strong> effects of climate change. For <strong>the</strong><br />
first time it put an economic framework around <strong>the</strong> impact of climate change. It<br />
described <strong>the</strong> impact of climate change as “<strong>the</strong> greatest market failure <strong>the</strong> world has<br />
ever seen”.<br />
The report recognized <strong>the</strong> key role of transport which is <strong>the</strong> third largest source of<br />
emissions jointly with agriculture <strong>and</strong> industry. So it is clear that any strategy toward<br />
tackling climate change will need to prioritised transport.<br />
It also recognised that aviation faces difficult challenges <strong>and</strong> outlined that currently<br />
<strong>the</strong> levels of taxation in <strong>the</strong> aviation sector globally are low relative to road transport<br />
fuel taxes.<br />
Air passengers have more than doubled between 1990 <strong>and</strong> 2005 (an increase of 122<br />
per cent) <strong>and</strong> greenhouse gas emissions have increased nearly as much as a result (by<br />
110 per cent). There has however been a tailing off of passenger growth in recent<br />
years. There is currently a debate as to whe<strong>the</strong>r this is a long term trend or a<br />
temporary ‘blip’.<br />
Road transport accounts for 64 per cent of all <strong>the</strong> UK domestic greenhouse gas<br />
emissions, while air <strong>and</strong> water transport combined accounted for <strong>the</strong> o<strong>the</strong>r 36 per cent.<br />
However <strong>the</strong>se figures do not include international transport.<br />
The uncertainties over <strong>the</strong> overall impact of aviation on climate change mean that<br />
<strong>the</strong>re is currently no internationally recognised method of converting CO 2 emissions<br />
into <strong>the</strong> full CO 2 equivalent quantity. Emissions from aviation as a proportion of total<br />
greenhouse gas emissions are currently 1.6 per cent excluding <strong>the</strong> radiative forcing<br />
effect according to <strong>the</strong> Stern report. Some forecasts suggest that by 2030, aviation<br />
could account for a quarter of <strong>the</strong> UK’s contribution to climate change. In a 2006<br />
parliamentary answer Gillian Merron stated that:” In 2005 aviation represented 6.3<br />
per cent. of UK emissions, calculated as a proportion of emissions in <strong>the</strong> UK<br />
inventory plus emissions from international aviation <strong>and</strong> shipping departing <strong>the</strong><br />
UK…Using a radiative forcing multiplier of two, emissions from flights departing <strong>the</strong><br />
UK contributed approximately 13 per cent of total UK emissions in 2005.”<br />
The UN’s climate scientists, <strong>the</strong> IPPC recommend using a policy of using a multiplier<br />
of between 2 <strong>and</strong> 4, so <strong>the</strong> union position is at <strong>the</strong> lower end of this range. But to be<br />
fair we do not know <strong>the</strong> contribution of o<strong>the</strong>r industries to radiative forcing, so this 13<br />
percent figure is an absolute maximum for current UK aviations emissions, on this<br />
basis.<br />
In recent years aviation emissions have been growing faster than emissions from any<br />
o<strong>the</strong>r sector. It has been pointed out that if aviation continues to grow at rates<br />
29
projected by <strong>the</strong> DfT’s 2003 white paper 27 , <strong>the</strong> UK would not be able to meet its 2050<br />
climate targets, even if every o<strong>the</strong>r sector of <strong>the</strong> economy (including all o<strong>the</strong>r<br />
transport sectors, manufacturing, retail, public services etc) produced no carbon<br />
emissions at all. This is a contentious issue. In response to this, <strong>Sustainable</strong> Aviation,<br />
an industry body, has suggested that aviation usage could triple <strong>and</strong> emissions from<br />
aviation could return to 2000 levels due to technological <strong>and</strong> operational<br />
breakthroughs. There has been considerable scepticism on <strong>the</strong>se figures.<br />
Aircraft manufacturers have since <strong>the</strong> birth of commercial flight sought new ways of<br />
increasing <strong>the</strong> distance an aircraft could travel on a kilo of aviation fuel. The latest<br />
incarnations of this line are <strong>the</strong> Airbus A380 <strong>and</strong> <strong>the</strong> Boeing 787 Dream liner which<br />
combine <strong>the</strong> use of modern, space-age, light materials with fly by wire technology to<br />
keep <strong>the</strong> level of emissions to an absolute minimum. Technology has resulted in a<br />
70% drop in <strong>the</strong> fuel burn since <strong>the</strong> 1960s. The A380 on its own is designed reduce<br />
<strong>the</strong> total impact per passenger kilometre by 20% - 25%. Sadly <strong>the</strong>se savings are only<br />
slowing <strong>the</strong> level of total aviation emissions over time due to <strong>the</strong> growth in dem<strong>and</strong>.<br />
3.2 European Emissions Trading Scheme<br />
The principal idea of an emission trading scheme is to put a price on <strong>the</strong> emissions<br />
released from an industry in order to reduce to total volume of emissions released into<br />
<strong>the</strong> atmosphere.<br />
In 2005 <strong>the</strong> Commission adopted a Communication on ‘Reducing <strong>the</strong> Climate Change<br />
Impact of Aviation.’ The key conclusion was that, in view of <strong>the</strong> likely future growth<br />
in air traffic, fur<strong>the</strong>r policies <strong>and</strong> measures were needed to address <strong>the</strong> climate impact<br />
of aviation. The Commission decided to pursue a new market based instrument at <strong>the</strong><br />
Community level in preference to o<strong>the</strong>r financial measures such as tax <strong>and</strong> charges.<br />
Within <strong>the</strong> EU, aviation contributes 3% of emissions according to <strong>the</strong> Commission,<br />
<strong>and</strong> it has risen by 87% between 1990 <strong>and</strong> 2004.<br />
A Commission impact assessment considered <strong>the</strong> options <strong>and</strong> policy choices for<br />
including aviation in <strong>the</strong> Community scheme. It concludes that since every airline on<br />
each route covered by <strong>the</strong> scheme would be treated equally, airlines can be expected<br />
to pass on, to a large extent or even in full, compliance costs to customers. This would<br />
have only a small effect on forecasted dem<strong>and</strong> growth.<br />
It comes as no surprise that this has been challenged by <strong>the</strong> main European airlines.<br />
They claim that <strong>the</strong> EU ETS will increase fares, reduce dem<strong>and</strong> for flying, reduce <strong>the</strong><br />
already marginal profits of <strong>the</strong> airlines <strong>and</strong> result in a loss of jobs.<br />
The industry has raised some concerns about <strong>the</strong> speed with which new aircraft can be<br />
manufactured <strong>and</strong> delivered. Lead times for <strong>the</strong> manufacturing <strong>and</strong> supply of<br />
‘greener’ technologies is always an issue. Partly this is an issue that <strong>the</strong> UK<br />
government needs to address if it is going to secure <strong>the</strong> maximum number of ‘green<br />
jobs’ for UK manufacturing.<br />
27 For example <strong>the</strong> DfT’s 2003 Aviation white paper predicted a trebling of passenger numbers by<br />
2030, meaning that even with efficiency savings, emissions from aviation would double.<br />
30
There are also technical problems on new designs, some of which have been resolved<br />
<strong>and</strong> o<strong>the</strong>rs of which remain to be resolved.<br />
The union shares <strong>the</strong> industry’s concern to protect <strong>the</strong> integrity of <strong>the</strong> ETS following<br />
<strong>the</strong> introduction of <strong>the</strong> EU-US Open Skies agreement. The US airlines (which now<br />
have greater access to European routes) have threatened to challenge any attempt to<br />
impose carbon charges on <strong>the</strong>m through this scheme.<br />
None <strong>the</strong> less most European operators supported <strong>the</strong> inclusion of aviation into <strong>the</strong><br />
European Trading Scheme from 2012. From 2012 aviation will receive 80 percent of<br />
its carbon credits for free <strong>and</strong> <strong>the</strong>n will need to purchase any additional allocations.<br />
Over time this level of free allocation will be reduced <strong>and</strong> <strong>the</strong> industry forced into<br />
purchasing more modern greener aircraft.<br />
3.3 Future Aviation Growth<br />
There has been a tailing off of global passenger growth in recent years. This has been<br />
manifested, in <strong>the</strong> light of <strong>the</strong> current economic situation, in <strong>the</strong> latest reports which<br />
suggest a downturn in dem<strong>and</strong> in all London airports. There is currently a debate as<br />
to whe<strong>the</strong>r this is a long term trend or a temporary ‘blip’.<br />
It had been assumed until recently that <strong>the</strong> growth in <strong>the</strong> popularity <strong>and</strong> importance of<br />
air travel in <strong>the</strong> UK would continue over <strong>the</strong> next 30 to 40 years. In 2003 <strong>the</strong> DfT<br />
predicted that passengers through UK airports would increase from some 200 million<br />
passengers in 2003 to 250 million by 2008 <strong>and</strong> in fact this prediction looks likely to<br />
be exceeded.<br />
Scheduled traffic on domestic <strong>and</strong> international flights of airlines worldwide,<br />
measured in terms of passenger-kilometres performed (PKPs), has been predicted to<br />
increase at an average annual rate of 4.4 per cent for <strong>the</strong> period 2002-2015. By 2050<br />
<strong>the</strong> dem<strong>and</strong> for passenger travel was predicted to be three times that of 2000. Total<br />
freight traffic, measured in terms of freight tonne-kilometres, was also forecast to<br />
grow at 5.5 per cent rate per annum over <strong>the</strong> period 2002 to 2015 as well.<br />
International traffic was envisioned to continue growing at a higher rate than total<br />
traffic, namely at 5.1 per cent per annum for passenger-kilometres <strong>and</strong> 5.8 per cent<br />
per annum for freight tonne-kilometres.<br />
Clearly this is a hotly political issue as projections of growth are used to justify<br />
decisions regarding expansion of capacity, for example <strong>the</strong> 3rd runway at Heathrow.<br />
Industry sources such as ‘Airline Business’ magazine, predict that airline yields would<br />
decline at an annual rate of 0.5 per cent for <strong>the</strong> first four years for passenger traffic<br />
<strong>and</strong> six years for freight traffic <strong>and</strong> to stabilize for <strong>the</strong> remaining years of <strong>the</strong> forecast<br />
horizon.<br />
Given <strong>the</strong> continued growth in global population <strong>and</strong> <strong>the</strong> continued human desire of<br />
individuals to travel, visit <strong>and</strong> migrate, utilising <strong>the</strong> swiftest medium available, in <strong>the</strong><br />
long term it would models predict that growth in passenger numbers is unavoidable.<br />
31
Between 1987 <strong>and</strong> 2007 <strong>the</strong> UK market has continued to climb rapidly dropping back<br />
twice as a result of <strong>the</strong> two gulf wars from which <strong>the</strong> Air Freight sector in <strong>the</strong> UK has<br />
not yet fully recovered. (see Figure 1) Within <strong>the</strong> UK <strong>the</strong> majority of air freight <strong>and</strong><br />
mail is carried in <strong>the</strong> cargo hold, making <strong>the</strong> comparison of like for like passenger km<br />
difficult to calculate.<br />
3,000,000<br />
2,500,000<br />
2,000,000<br />
1,500,000<br />
1,000,000<br />
500,000<br />
-<br />
1987 1988 1989 1990 1991 1992 1993 1994 1995 1996 1997 1998 1999 2000 2001 2002 2003 2004 2005 2006 2007<br />
.<br />
Passengers (x100) tonnes<br />
Source: Civil Aviation Authority<br />
Figure 3.1: Air Passengers ‘000 <strong>and</strong> Air Freight tonnage 1987 – 2007<br />
Figure 3.2: UK transport CO 2 emissions 1970 – 2005 (by source) 28<br />
Source: Defra, 2007<br />
28 'O<strong>the</strong>r' includes motorcycles <strong>and</strong> mopeds; LPG emissions; o<strong>the</strong>r road vehicles <strong>and</strong> mobile sources<br />
<strong>and</strong> machinery. International shipping <strong>and</strong> aviation have been calculated using fuel in international<br />
bunkers.<br />
32
The task at h<strong>and</strong> is to achieve this growth while reducing <strong>the</strong> total footprint of<br />
aviation . In 2008 <strong>the</strong>re was a decline in total passenger numbers which can partly be<br />
put down to an increased environmental awareness by <strong>the</strong> travelling public <strong>and</strong> <strong>the</strong><br />
global economic downturn. It is not yet known if this was an aberration or <strong>the</strong> start of<br />
a decline in <strong>the</strong> popularity of this transport mode. Given <strong>the</strong> continued global<br />
population growth rates, however, predictions for long term growth are well<br />
supported.<br />
Currently road transport accounts for 64 per cent of all <strong>the</strong> UK domestic greenhouse<br />
gas emissions, while air <strong>and</strong> water transport combined accounted for <strong>the</strong> o<strong>the</strong>r 36 per<br />
cent. These figures do not include <strong>the</strong> industrial use of transport or international<br />
transport, however, <strong>and</strong> hence do not include <strong>the</strong> footprint of international shipping,<br />
aviation or long distance haulage by road <strong>and</strong> rail.<br />
Recent figures from Defra would suggest that if you include industrial transport<br />
aviation is only responsible for just 3 per cent of domestic transport emissions. In<br />
contrast figures supplied by industrial sector which include international aviation <strong>and</strong><br />
shipping suggest that aviation is responsible for 6 per cent of total UK emissions (46<br />
percent of industrial transport if you exclude <strong>the</strong> car from your calculations).<br />
UK Domestic Shipping<br />
3%<br />
UK Domestic Air<br />
2%<br />
O<strong>the</strong>r<br />
Railways<br />
1%<br />
2%<br />
Busses<br />
3%<br />
lorries<br />
22%<br />
cars<br />
54%<br />
vans<br />
13%<br />
Figure 3.3: UK domestic greenhouse gas emissions 2007<br />
Source: Defra, 2007b 29 , 30 .<br />
29 As this is by source, it excludes <strong>the</strong> emissions from electricity generation in rail.<br />
30 Note <strong>the</strong> difference between CO2 emissions <strong>and</strong> total greenhouse gas emissions here. The total<br />
basket of 'Kyoto' greenhouse gas emissions fell by 15.6% between 1990 <strong>and</strong> 2005 (Defra, 2007d).<br />
However, most recent estimates show carbon emissions rose again during 2006, mainly due to fuel<br />
switching from natural gas to coal, so that <strong>the</strong> level is currently only around 5% below <strong>the</strong> base year<br />
(Defra, 2007e).<br />
33
Dependant on <strong>the</strong> message you wish to use, <strong>the</strong> figures can <strong>the</strong>refore be used to vary<br />
<strong>the</strong> message significantly.<br />
Aircraft release emissions into <strong>the</strong> atmosphere comprising of several different kinds<br />
of gases <strong>and</strong> particles, which complicates <strong>the</strong> issue still fur<strong>the</strong>r. These gases <strong>and</strong><br />
particles also alter <strong>the</strong> concentration of atmospheric greenhouse gases, including CO 2 ,<br />
ozone (O3), <strong>and</strong> methane (CH4). Some of <strong>the</strong>se gases <strong>and</strong> particles cool <strong>the</strong> planet,<br />
o<strong>the</strong>r warm it. But <strong>the</strong> overall impact of <strong>the</strong>se emissions, according to <strong>the</strong> IPCC I<br />
2002, a warming affect of 2.7 times that of <strong>the</strong> carbon dioxide alone (IPCC 2001 exec<br />
summary).<br />
Figure 3.4: Composition of emissions from a typical aircraft jet engine<br />
Although direct effect of emissions of CO2 from aircraft are relatively well known,<br />
<strong>the</strong> emissions of o<strong>the</strong>r gases <strong>and</strong> particles are subject to greater uncertainties <strong>and</strong> <strong>the</strong><br />
climate impact is much more difficult to quantify due to a number of direct <strong>and</strong><br />
indirect effects. This is primarily because of different times <strong>the</strong>y stay in <strong>the</strong><br />
atmosphere <strong>and</strong> <strong>the</strong>ir different radiative properties, how <strong>the</strong> emissions change <strong>the</strong><br />
composition of <strong>the</strong> atmosphere by chemical reactions, <strong>and</strong> <strong>the</strong> way <strong>the</strong>y trigger <strong>the</strong><br />
formation of contrails <strong>and</strong> o<strong>the</strong>r clouds. Research for <strong>the</strong> IPCC by Sausen et al (2005)<br />
implied a Radiative Forcing index multiplier of 1.9, based upon better scientific<br />
underst<strong>and</strong>ing, which mostly reduced <strong>the</strong> effects of contrail radiative forcing.<br />
In a parliamentary answer Gillian Merron stated that: ‘Using a radiative forcing<br />
multiplier of two, emissions from flights departing <strong>the</strong> UK contributed approximately<br />
13 per cent of total UK emissions in 2005. However, <strong>the</strong> figures for non-aviation<br />
sources do not include any radiative forcing attributable to <strong>the</strong>m, as conclusive figures<br />
are not available’. So <strong>the</strong> absolute maximum figure for UK aviations emissions is 13<br />
per cent, but is anywhere between 6 <strong>and</strong> 13 per cent.<br />
The Air <strong>Transport</strong> Action Group has estimated that aircraft fuel efficiency has more<br />
than doubled in <strong>the</strong> past 40 years. Today’s aircraft are 70% more fuel-efficient than<br />
<strong>the</strong> jets of <strong>the</strong> 1960s (e.g. 3.5 litres per 100 passenger-kilometres, which is more<br />
efficient than many forms of transport). Current research efforts in Europe aim to<br />
achieve fur<strong>the</strong>r reductions of 20 per cent in CO 2 <strong>and</strong> 60 percent in nitrogen oxide<br />
(NOx) emissions, for new aircraft engines in 2008. Longer-term goals include<br />
achieving a 50% cut in CO 2 emissions per passenger-km <strong>and</strong> an 80% cut in NOx<br />
emissions for equipment entering service in 2020.(see Figure 3.4).<br />
34
Figure 3.5 <strong>Sustainable</strong> Aviation’s CO2 Roadmap - projected future<br />
emissions of CO 2 from UK aviation.<br />
In essence this graph predicts that aircraft could become 15 per cent more fuel<br />
efficient by 2015 <strong>and</strong> 40-50 per cent more efficient by 2050.<br />
There is, however, considerable scepticism about <strong>the</strong>se figures, especially from<br />
environmental groups, as to whe<strong>the</strong>r <strong>the</strong>se figures are achievable. We must remember<br />
that aircraft are long-lived, so that many of <strong>the</strong> older <strong>and</strong> less fuel efficient aircraft<br />
will still be in service beyond 2020. For example <strong>the</strong> House of Commons<br />
<strong>Environment</strong>al Audit Committee (3 rd report 2004) accused <strong>the</strong> government’s White<br />
Paper on The Future of Aviation of being deliberately misleading on this issue, <strong>and</strong><br />
pointed out that <strong>the</strong> Advisory Council for Aeronautical Research has said this<br />
aspirational 50 per cent target requires ‘breakthrough technologies’ which don’t yet<br />
exist, as opposed to <strong>the</strong> small incremental improvements that are currently being<br />
worked on.<br />
Even if <strong>the</strong> more optimistic assumptions about technological improvements to<br />
aviation are met, <strong>the</strong> IPCC cautions that such improvements are insufficient in view of<br />
current projections for aviation’s growth of about 5 percent 31 .<br />
3.4 European Emissions Trading Scheme Background<br />
On 27 September 2005 <strong>the</strong> Commission adopted a Communication on ‘Reducing <strong>the</strong><br />
Climate Change Impact of Aviation.’ The key conclusion drawn in <strong>the</strong><br />
Communication was that, in view of <strong>the</strong> likely future growth in air traffic, fur<strong>the</strong>r<br />
policies <strong>and</strong> measures were needed to address <strong>the</strong> climate impact of aviation. Having<br />
analysed a number of options, <strong>the</strong> Commission decided to pursue a new market based<br />
instrument at <strong>the</strong> Community level in preference to o<strong>the</strong>r financial measures such as<br />
tax <strong>and</strong> charges.<br />
31 Green Jobs – Towards Decent Work – ILO/ITUC/UNEP 2008 p149<br />
35
The move reflects a decision by <strong>the</strong> EU to extend <strong>the</strong> control of carbon emissions<br />
from <strong>the</strong> energy sector <strong>and</strong> heavy industry (<strong>the</strong> basis of <strong>the</strong> EU ETS), to o<strong>the</strong>r sectors<br />
of <strong>the</strong> economy. The EU’s strategic aim is to cut CO 2 emissions across <strong>the</strong> EU by 30<br />
per cent by 2020. This will generate <strong>the</strong> substantial reductions in greenhouse gas<br />
emissions compared with 1990 levels, which are needed to meet <strong>the</strong> objectives of <strong>the</strong><br />
Kyoto Protocol, under <strong>the</strong> <strong>Unite</strong>d Nations Framework Convention on Climate Change<br />
(UNFCCC). The UNFCCC seeks to stabilise greenhouse gas concentrations in <strong>the</strong><br />
atmosphere at a level that would prevent dangerous anthropogenic interference with<br />
<strong>the</strong> climate system.<br />
The limitation <strong>and</strong> reduction targets adopted under <strong>the</strong> Kyoto Protocol included<br />
emissions from domestic aviation but not emissions from international aviation or<br />
shipping. Instead <strong>the</strong> Kyoto Protocol places an obligation on <strong>the</strong> parties to "pursue<br />
limitation or reduction of emissions of greenhouse gases…from aviation…bunker<br />
fuels, working through <strong>the</strong> International Civil Aviation Organization…".<br />
Within <strong>the</strong> EU, aviation contributes 3 per cent of emissions according to <strong>the</strong><br />
Commission, <strong>and</strong> it has risen by 87 per cent between 1990 <strong>and</strong> 2004.<br />
A Commission impact assessment considered <strong>the</strong> specific design options <strong>and</strong> policy<br />
choices for including aviation in <strong>the</strong> Community scheme. It concludes that since every<br />
airline on each route covered by <strong>the</strong> scheme would be treated equally, airlines can be<br />
expected to pass on, to a large extent or even in full, compliance costs to customers.<br />
This would have only a small effect on forecasted dem<strong>and</strong> growth: from business-asusual<br />
levels of 142 per cent to a minimum of 135 per cent over <strong>the</strong> period 2005 to<br />
2020 for all departing <strong>and</strong> arriving flights. Competition between airlines would not be<br />
significantly affected. The main difference between airlines is <strong>the</strong> length of journey<br />
undertaken, <strong>the</strong> age of <strong>the</strong> aircraft used <strong>and</strong> <strong>the</strong> payload carried.<br />
Therefore, carriers travelling shorter distances, using older aircraft or carrying fewer<br />
passengers or less freight would be affected to a greater extent than more fuel efficient<br />
aircraft. Competition between airports <strong>and</strong> tourism would not be significantly<br />
affected. However, any risk to <strong>the</strong> latter would likely be decreased by including all<br />
departing <strong>and</strong> arriving flights in <strong>the</strong> scheme.<br />
Both <strong>the</strong> T&G Section of <strong>Unite</strong> <strong>the</strong> <strong>Union</strong> <strong>and</strong> <strong>the</strong> TUC 32 supported <strong>the</strong> Government<br />
efforts to fully capture EU aviation emissions within <strong>the</strong> EU Emissions Trading<br />
Scheme by 2008, but in practice aviation will not be covered by <strong>the</strong> scheme until<br />
2012. Including aviation emissions into <strong>the</strong> ETS under current aviation growth <strong>and</strong><br />
efficiency trends, is likely to have a major impact on <strong>the</strong> ETS itself. Unlike <strong>the</strong><br />
participation of o<strong>the</strong>r sectors of <strong>the</strong> economy, <strong>the</strong> aviation industry would enter <strong>the</strong><br />
ETS as a long-term net purchaser of carbon credits thus reducing <strong>the</strong> availability of<br />
credits in <strong>the</strong> system. Additionally on entry, aviation will only be provided with 80<br />
per cent of its needs for free. As a result <strong>the</strong> industry will need to purchase any<br />
remaining requirements at <strong>the</strong> government auctions.<br />
From 2012 all flights arriving <strong>and</strong> departing European airports will be included in <strong>the</strong><br />
scheme <strong>and</strong> <strong>the</strong> airlines will receive enough allowances in 2012 to cover 97 per cent<br />
32 A <strong>Sustainable</strong> Energy Policy: TUC response to <strong>the</strong> Government's Energy Review, 2006.<br />
36
of average 2004-06 emissions. If additional allowances are required, <strong>the</strong>se will have<br />
to be purchased on an auctioning basis. In 2013 <strong>and</strong> subsequent years this free<br />
allowance will decrease to a situation where by 202 only 60 per cent of required<br />
allowances will be provided. Consequently airlines will be forced to pay more if <strong>the</strong>y<br />
wish to continue a business as usual model.<br />
3.5 Technical Solutions<br />
Alternative fuels<br />
IATA has called for 10 per cent of aircraft fuel to be from alternative sources by<br />
2017 33 but even leaving aside concerns about biofuels <strong>and</strong> hydrogen (see p20) <strong>the</strong><br />
government has stated “<strong>the</strong>re is no viable alternative currently visible to kerosene as<br />
an aviation fuel.”<br />
These views are concurred with by <strong>the</strong> IPCC who said ‘<strong>the</strong>re would not appear to be<br />
any practical alternatives to kerosene based fuels for commercial jet aircraft for <strong>the</strong><br />
next several decades’. There is consensus that hydrogen based aircraft are also<br />
decades away <strong>and</strong> might well be more environmentally damaging due to <strong>the</strong> way in<br />
which <strong>the</strong> hydrogen is created <strong>and</strong> stored.<br />
Good<br />
Good<br />
Liquid<br />
hydrogen<br />
Ethanol<br />
Volume<br />
Jet A<br />
Liquid<br />
hydrogen<br />
Jet A<br />
Weight<br />
Ethanol<br />
Figure 3.6: Comparison of <strong>the</strong> volume to weight parameters of currently<br />
available aviation fuel sources.<br />
When designing an alternative fuel hydrogen is by far <strong>and</strong> away <strong>the</strong> best fuel to use if<br />
<strong>the</strong> only parameter you’re looking at is weight <strong>and</strong> reduced emissions from<br />
combustion. Due to <strong>the</strong> space required to store <strong>the</strong> amounts needed for international<br />
aviation, however, would require a considerable redesign. Such a redesign would turn<br />
<strong>the</strong> aircraft into little more than a flying tanker with a few seats.<br />
Already on long haul flights <strong>the</strong> amount of Jet A fuel is responsible for up to 55 per<br />
cent of <strong>the</strong> total weight of <strong>the</strong> plane. As outlined in <strong>the</strong> environmental section <strong>the</strong>re<br />
33 Green Jobs – Towards Decent Work – ILO/ITUC/UNEP 2008<br />
37
are concerns that biofuels actually may use more carbon than <strong>the</strong>y save <strong>and</strong> have o<strong>the</strong>r<br />
social <strong>and</strong> environmental impacts.<br />
There is currently much excitement about <strong>the</strong> potential to derive biofuels from algae<br />
because it is potentially more energy efficient (See Figure 3.6) <strong>and</strong> in principle could<br />
be grown virtually anywhere <strong>and</strong> even used to help clean contaminated water<br />
supplies. However this technology is in its early stages <strong>and</strong> it remains to be seen<br />
whe<strong>the</strong>r this can be scaled up successfully without substantial negative impacts.<br />
Boeing has been experimenting with Syn<strong>the</strong>tic aviation kerosene derived from Coal<br />
using <strong>the</strong> Fisher Trope process. This method can be used to extract Hydrogen <strong>and</strong> CO 2<br />
in a format which is 99.96 per cent pure. Such technology would remove aviations<br />
dependence on oil but is not an answer to environmental problems <strong>and</strong> in fact would<br />
worsen <strong>the</strong>m.<br />
Oil yield (kg/hectre)<br />
180,000<br />
160,000<br />
140,000<br />
120,000<br />
100,000<br />
80,000<br />
60,000<br />
40,000<br />
20,000<br />
0<br />
Soybean (US)<br />
Rapeseed (Europe)<br />
Babassu (Brazil)<br />
Palm oil (Malaysia)<br />
Algae (world?)<br />
Figure 3.7: Relative yield per hectare of various sources of biofuel<br />
Aircraft Design<br />
The Royal Commission on <strong>Environment</strong>al Pollution<br />
(RCEP) states that ‘The basic gas turbine design<br />
emerged in 1947. It has been <strong>the</strong> dominant form of<br />
aircraft engine for some 50 years <strong>and</strong> <strong>the</strong>re is no serious<br />
suggestion that this will change in <strong>the</strong> foreseeable<br />
future.” Boeing, Airbus <strong>and</strong> o<strong>the</strong>r manufacturers are<br />
looking at unducted turbine blades again in an effort to<br />
maximise fuel burn but are facing considerable<br />
problems over <strong>the</strong> noise produce by this technology due<br />
to <strong>the</strong> vibration of <strong>the</strong> blade tips at speed. Also of<br />
concern, a recent European Commission report<br />
suggested that <strong>the</strong> new more ‘efficient’ engines form<br />
more condensation trails <strong>and</strong> hence increase <strong>the</strong><br />
radiative forcing effect (discussed later) 34<br />
34 see www.aero-net.org/a2c3/a2c3_summary.pdf.<br />
38
The RCEP also stated that <strong>the</strong>re was potential for reduction in fuel use of up to 30 per<br />
cent by using huge hollow wings in which passengers would sit, but that this is just a<br />
concept <strong>and</strong> <strong>the</strong> stability <strong>and</strong> controllability of such an aircraft is still unknown. The<br />
idea of flying wing technology have yet to overcome <strong>the</strong> problem of increased travel<br />
sickness levels in such designs occurring due to <strong>the</strong> in ability of <strong>the</strong> brain of <strong>the</strong><br />
passenger sat in <strong>the</strong> centre of <strong>the</strong> plane to associate <strong>the</strong> movement of <strong>the</strong> aircraft<br />
relative to <strong>the</strong> horizon <strong>and</strong> overcoming passenger claustrophobia.<br />
The Advisory Council for Aeronautics Research in Europe (ACARE) has established<br />
a challenging goal of a 50 per cent reduction in CO 2 emissions per passenger km for<br />
new aircraft entering into service in 2020, compared with equivalent new aircraft<br />
entering service in 2000. Our assessment of <strong>the</strong> nearer term technology <strong>and</strong><br />
operational improvements centre around <strong>the</strong> assumptions underpinning <strong>the</strong> ACARE<br />
targets for 2020. The ACARE targets would also result in an 80 per cent cut in NO X<br />
<strong>and</strong> a 50 per cent cut in noise.<br />
But <strong>the</strong> ACARE targets are relying on developments in technology to bring about <strong>the</strong><br />
reduction to <strong>the</strong> environmental impacts of aircraft. We must, however, ask <strong>the</strong><br />
question what happens if <strong>the</strong>se developments do not happen?<br />
<strong>Sustainable</strong> <strong>and</strong> Green Engines (SAGE) is one of<br />
<strong>the</strong> six Integration Technology Demonstrators<br />
(ITDs) that make up <strong>the</strong> Clean Sky JTI. The €425<br />
million validation programme will involve <strong>the</strong><br />
design <strong>and</strong> build of five engine demonstrators,<br />
including an open rotor engine demonstrator. The<br />
open rotor engine demonstrator is planned to run<br />
around 2011-2012, enabling a product to enter<br />
into service in <strong>the</strong> latter half of <strong>the</strong> next decade 35 .<br />
The aviation industry has since its conception, tried to think of new ways in which to<br />
obtain more distance per kilo of fuel. This has often resulted in <strong>the</strong> rebalancing of <strong>the</strong><br />
turbine pressures which resulted in greater fuel burn duration per kilo or a higher<br />
compression ratio with a consequent increase in <strong>the</strong> levels of NOx <strong>and</strong> SOx.<br />
The addition of up turned wing tips has been shown to reduce fuel burn by between 3<br />
<strong>and</strong> 5 per cent. These devices increase <strong>the</strong> effective aerodynamic efficiency of <strong>the</strong><br />
wings preventing <strong>the</strong> formation of vortices at <strong>the</strong> wing tips which are formed by <strong>the</strong><br />
higher pressure air beneath <strong>the</strong> wing flowing around <strong>the</strong> sides of <strong>the</strong> wings to reach<br />
<strong>the</strong> lower pressure air created <strong>the</strong> wing by its forward motion.<br />
Weight is a major contributor to <strong>the</strong> volume of fuel burnt on each flight. Reducing<br />
weight from <strong>the</strong> interior of <strong>the</strong> aircraft - in terms of products, fixtures <strong>and</strong> fittings –<br />
can make a significant difference to fuel burn. For example, across Virgin Atlantic's<br />
fleet of 38 wide bodied long-haul aircraft, removing just 1 kg of weight per aircraft<br />
can reduce CO 2 emissions by over 16 tonnes per year. 36<br />
35 Fur<strong>the</strong>r information: http://www.cleansky.eu<br />
36 Source: Virgin Atlantic.<br />
39
<strong>Unite</strong> is currently campaigning to reduce <strong>the</strong> maximum permitted single item luggage<br />
weight limit to 23 kg. This policy is primarily aimed at reducing <strong>the</strong> level of injuries<br />
suffered by h<strong>and</strong>lers at <strong>the</strong> airports, however, it could have a far wider impact. If<br />
accepted across <strong>the</strong> industry <strong>the</strong> weight savings could be enormous as passengers pack<br />
more efficiently <strong>and</strong> taking only <strong>the</strong> essential items needed for <strong>the</strong>ir trip. Currently<br />
some airlines accept single items up to 32 kgs.<br />
Airbus estimates that for a 1% structural weight saving, approximately 0.5 per cent to<br />
1.5 per cent benefit in fuel consumption will occur. The exact benefit depends on<br />
many factors, particularly configuration <strong>and</strong> range (with more benefit being available<br />
for medium-range aircraft than long-range), <strong>and</strong> on whe<strong>the</strong>r <strong>the</strong> whole aircraft design<br />
can be re-optimised following <strong>the</strong> weight change. Airbus predicts that airframe<br />
aerodynamic improvements like natural or hybrid laminar flow control, low drag<br />
technology <strong>and</strong> innovative aircraft configurations can toge<strong>the</strong>r offer a fuel burn<br />
reduction of around 10 per cent 37 .<br />
The development <strong>and</strong> deployment of composite materials are now being implemented<br />
to reduce this weight <strong>and</strong> enable <strong>the</strong> aircraft to fly fur<strong>the</strong>r on each kilo of fuel.<br />
Additionally <strong>the</strong> addition of winglets to <strong>the</strong> tips of existing <strong>and</strong> future aircraft wings<br />
has already been shown to save between 3 <strong>and</strong> 5 per cent.<br />
Operational changes<br />
There are practical gains to be made which do not require any additional equipment<br />
but could save considerable amounts of fuel <strong>and</strong> hence emissions as well as changes<br />
which could reduce <strong>the</strong> effect of <strong>the</strong>se emissions.<br />
Efforts need to be introduced to minimise taxiing <strong>and</strong> stacking periods wherever<br />
possible. It has been estimated that reducing stacking <strong>and</strong> queuing on taxi ways at<br />
Heathrow by introducing mixed mode operations (where <strong>the</strong> two existing runways are<br />
used for both take offs <strong>and</strong> l<strong>and</strong>ings, at <strong>the</strong> same time, much like <strong>the</strong> case at single<br />
runway airports) could save an estimated 330,000 tonnes of C0 2 . Currently 'Every<br />
o<strong>the</strong>r flight that come in to <strong>the</strong> airport, is held in stack for around eight <strong>and</strong> a half<br />
minutes <strong>and</strong> could be sitting on <strong>the</strong> tarmac, with <strong>the</strong> engine running, waiting to leave<br />
for up to 20 minutes. The principle cause of this race to join a queue is <strong>the</strong> practice of<br />
counting on time departures from <strong>the</strong> moment aircraft are pushed back from <strong>the</strong> st<strong>and</strong>,<br />
not <strong>the</strong> time <strong>the</strong> aircraft leaves <strong>the</strong> ground.<br />
Currently air routes are chosen to ei<strong>the</strong>r avoid congestion<br />
or reduce <strong>the</strong> financial cost of a flight. The associated<br />
changes in routings can, however, extend flight distances<br />
by up to 20 per cent compared to shortest paths. Large<br />
differences in <strong>the</strong> amount charged by in European nations<br />
for <strong>the</strong> air traffic management of flights crossing <strong>the</strong>ir<br />
area can create situations where flights deliberately fly<br />
for longer distances simply to avoid highly priced zones.<br />
A good example of this is <strong>the</strong> well publicised flights<br />
operated by Thomas Cook <strong>and</strong> Monarch who frequently<br />
37 Airbus Holistic Road Map to <strong>the</strong> Future<br />
40
avoid higher fees on flights to <strong>the</strong> Canary Isl<strong>and</strong>s from Manchester <strong>and</strong> Birmingham<br />
by utilising Tango routes over <strong>the</strong> sea. Using such routes adds around 3,000 tonnes of<br />
CO 2 to <strong>the</strong> atmosphere on each flight. The airlines excuse was that it wanted to avoid<br />
congestion in <strong>the</strong> Boulogne area of France to guarantee an on time arrival <strong>and</strong><br />
departure. It was however also over €800 cheaper to use that route<br />
This is not an isolated incident as it has been discovered by Omega 38 that a number of<br />
airlines route flights based on financial considerations ra<strong>the</strong>r than taking what would<br />
be <strong>the</strong> most environmentally friendly 39 . A simple method to change this practice is to<br />
increase <strong>the</strong> cost of tango routes so that <strong>the</strong>y are charged in line with a harmonised <strong>the</strong><br />
price across Europe. Whilst this would not eliminate <strong>the</strong> use of tango routes it would<br />
focus <strong>the</strong> attention of operators more on <strong>the</strong> amount of fuel burnt <strong>and</strong> to <strong>the</strong> volume of<br />
CO 2 produced. Whilst <strong>the</strong> concept of a single European Sky will help this ideal it will<br />
not resolve <strong>the</strong> charging issues raised by Tango route operations.<br />
The CAT National Committee <strong>the</strong>refore calls for international co-operation to<br />
harmonise <strong>the</strong> costs of air traffic management across Europe <strong>and</strong> for tango routes<br />
to be charged by <strong>the</strong> distance travelled in order to eliminate <strong>the</strong> financial incentives<br />
to fly fur<strong>the</strong>r. We, in addition, call on governments to cooperate on access to<br />
national airspace so as to avoid unnecessary in-flight distance <strong>and</strong> to coordinate<br />
<strong>the</strong>ir actions to eradicate unnecessary fuel burn <strong>and</strong> emissions into <strong>the</strong><br />
environment.<br />
Unsurprisingly cleaner engines work more efficiently than dirty ones. Therefore <strong>the</strong><br />
provision to wash <strong>the</strong> engines without <strong>the</strong> need to dismantle <strong>the</strong>m has been explored.<br />
Keeping <strong>the</strong> compressor, turbine, <strong>and</strong> fan of a jet engine clean decreases fuel<br />
consumption by 0.5 to 1.5 per cent. Considering <strong>the</strong> cost of fuel <strong>and</strong> <strong>the</strong> level of<br />
emissions produced by a jet turbine, is well worth doing. In <strong>the</strong> old days, airline<br />
mechanics simply used a fire hose but this created significant delays due to <strong>the</strong> need<br />
to allow <strong>the</strong> resultant black sludge (a heavy-metal cocktail of cadmium, lead, <strong>and</strong><br />
arsenic) to drain, which usually ended up all over <strong>the</strong> tarmac. Pratt & Whitney's<br />
EcoPower Engine Wash rig shoots a pressurized spray into <strong>the</strong> engine, scouring <strong>the</strong><br />
blades of <strong>the</strong> turbine to a shine <strong>and</strong> captures <strong>the</strong> run off keeping <strong>the</strong> tarmac clean.<br />
Although this new process still takes <strong>the</strong> aircraft out of service for an hour, this is<br />
considerably less time than it would take to dismantle, clean <strong>and</strong> reassemble <strong>the</strong><br />
engines or wait for <strong>the</strong> engine to dry out after being blasted by a fire hose. The<br />
provision of this facility is currently only available within Europe at Amsterdam<br />
Schipol airport.<br />
Unlike CO 2 , emissions from aviation vary considerably with altitude. Contrails for<br />
example require cold hypa-saturated air to be formed which typically can be found<br />
over Europe at between 30,000 ft <strong>and</strong> 40,000 ft. Most aircraft currently cruise at<br />
35,000 feet which <strong>the</strong> ideal altitude for flights to maximise <strong>the</strong>ir fuel efficiency at <strong>the</strong><br />
speed at which <strong>the</strong>y are designed to travel. Redesigning aircraft to fly lower <strong>and</strong><br />
slower or higher <strong>and</strong> faster could almost eliminate contrail formation. Ano<strong>the</strong>r option<br />
would be to accurately map where <strong>the</strong>se areas of hypa-saturated air likely to be<br />
located using more accurate wea<strong>the</strong>r forecasting <strong>and</strong> route around <strong>the</strong>m. Currently <strong>the</strong><br />
38 Report into Air traffic management costs in Europe by Dr Lucy Budd of Loughborough University<br />
<strong>and</strong> Dr Tom Reynolds from <strong>the</strong> University of Cambridge<br />
39 Examples of cost comparisons on three routes in Europe can be found in Appendix 7 below<br />
41
overall effects of contrails <strong>and</strong> <strong>the</strong>ir effect on <strong>the</strong> creation of increases cloud is still<br />
largely an unknown factor requiring fur<strong>the</strong>r study. Consequently we do not know at<br />
present if such a diversion to avoid hypa-saturated air would be beneficial.<br />
NOx emissions do not directly affect <strong>the</strong> climate, but <strong>the</strong>y do readily react with <strong>the</strong><br />
atmosphere to produce Ozone (O 3 ) <strong>and</strong> destroy Methane (CH 4 ). As both O 3 <strong>and</strong> CH 4<br />
are powerful greenhouse gases <strong>and</strong> <strong>the</strong> relative ratio of O 3 creation <strong>and</strong> CH 4<br />
destruction vary with altitude <strong>and</strong> ambient temperature (as shown in Figure 7 below),<br />
it is possible for NOx release to reduce <strong>the</strong> global warming if released at lower<br />
altitudes. The amount of CO 2 produced far out weighs any gains from this NOx<br />
release at <strong>the</strong>se levels, however, as flying lower or higher than <strong>the</strong> optimum results in<br />
excessive fuel burn <strong>and</strong> hence more CO 2 . Increasing <strong>the</strong> altitude also reduces <strong>the</strong> fuel<br />
burn <strong>and</strong> <strong>the</strong> volumes of O 3 produced. (It should be noted that this is a completely<br />
separate issue to ‘<strong>the</strong> hole in <strong>the</strong> ozone layer’, which in fact is a problem that has been<br />
largely resolved).<br />
Figure 3.8: Dependence of Ozone radiative forcing on location of<br />
emissions 40<br />
Scientists at Cranford University working in collaboration with o<strong>the</strong>rs at Cambridge<br />
have suggested that <strong>the</strong> idea cruise altitude to minimise <strong>the</strong> effect of aviation<br />
emissions over Europe is around 33,000 ft using current aircraft designs. This is<br />
clearly only a minor adjustment to <strong>the</strong> current situation <strong>and</strong> should easily be<br />
achievable.<br />
On approach to airports <strong>the</strong> st<strong>and</strong>ard procedure is to descend <strong>the</strong>n to fly at a low level<br />
path toward <strong>the</strong> airport before making <strong>the</strong> final descent <strong>and</strong> touchdown. This creates<br />
excessive noise, requires more fuel to be burnt <strong>and</strong> hence higher levels of emissions.<br />
This path enables over flights of <strong>the</strong> area thus reducing <strong>the</strong> impact of <strong>the</strong> airport of <strong>the</strong><br />
flight paths in <strong>the</strong> area.<br />
The alternative continuous decent approach, (as seen below in Figure 3.9) on <strong>the</strong> o<strong>the</strong>r<br />
h<strong>and</strong>, utilises <strong>the</strong> aircrafts natural gliding capabilities to maintain a path directly from<br />
altitude to touchdown <strong>the</strong>refore reducing noise <strong>and</strong> fuel burn. If holding patterns <strong>and</strong><br />
vectoring of aircraft was eliminated almost 1 per cent of <strong>the</strong> aviations total fuel burn<br />
could be avoided.<br />
40 Keith Shine, Department of Meteorology Reading University<br />
42
40000<br />
35000<br />
30000<br />
25000<br />
20000<br />
15000<br />
10000<br />
5000<br />
0<br />
As fuel burns off <strong>the</strong> aircraft gradually continues <strong>the</strong> climb<br />
Steps in current flight paths caused by actions to avoid o<strong>the</strong>r aircraft<br />
<strong>and</strong> by vectoring <strong>and</strong> stacking requirements to enable adequate<br />
spacing of aircraft on approach<br />
More gradual climb<br />
path<br />
Continuous Decent<br />
Ideal Path<br />
Current Practice<br />
Source :- CANSO<br />
Figure 3.9: Comparison between ideal vertical flight path <strong>and</strong> current<br />
practices<br />
Rapid climbs to altitude do reduce <strong>the</strong> noise footprint of departing aircraft, but this<br />
environmental gain is dwarfed by <strong>the</strong> impact of <strong>the</strong> volume of fuel needed to achieve<br />
this manoeuvre. A recent scientific study by Dr Tom Reynolds of Cambridge<br />
concluded that such a continuous climb with no level offs is one aspect that could<br />
reduce total fuel burn significantly. 41 .<br />
Due to its proximity to RAF Northolt, Heathrow has <strong>the</strong> problem of military airspace<br />
to contend with to <strong>the</strong> west of <strong>the</strong> airport. This RAF facility will remain a ‘core<br />
military site’ for <strong>the</strong> foreseeable future, with fixed <strong>and</strong> rotary wing flying operations<br />
continuing at around 13,000 movements a year. Its proximity to Heathrow has<br />
resulted in stacking of aircraft over London <strong>and</strong> a sharp descent path into <strong>and</strong> out of<br />
<strong>the</strong> airport, which has resulted in increased greenhouse gas emissions. Illuminating<br />
<strong>the</strong> need for aircraft to stack <strong>and</strong> queue for take off <strong>and</strong> l<strong>and</strong>ing slots should also be a<br />
priority.<br />
Therefore <strong>the</strong> CAT National Committee calls for a review of all military air space<br />
especially that west of Heathrow to see if it can be derestricted <strong>and</strong> used to decrease<br />
<strong>the</strong> rate of decent <strong>and</strong> climb of aircraft <strong>and</strong> used to avoid lengthy diversions.<br />
Military no fly zones can also add considerably to flight paths as aircraft route around<br />
areas. This is particularly problematic over <strong>the</strong> English Channel <strong>and</strong> across parts of<br />
Wales due to naval <strong>and</strong> air force training requirements.<br />
Clearly <strong>the</strong> higher <strong>the</strong> number of passengers on a flight or on any journey <strong>the</strong> more<br />
efficient that journey will be in terms of emissions per passenger km. Using <strong>the</strong> most<br />
efficient aircraft for <strong>the</strong> designated route, <strong>the</strong>refore, makes a big difference. A 70-seat<br />
41 Source Study by Dr Tom Reynolds of Cambridge for Euro control, Aspire <strong>and</strong> Omega..<br />
43
turboprop will burn 35% less fuel than a regional jet on a 500 nm sector 42 . On longer<br />
sectors, however, larger aircraft which can carry more passengers gain <strong>the</strong> advantage.<br />
Although a move towards larger <strong>and</strong> larger aircraft does have <strong>the</strong> potential to lower<br />
<strong>the</strong> overall emission level, <strong>and</strong> reduce congestion at <strong>the</strong> airport, <strong>the</strong> challenge is<br />
<strong>the</strong>refore to choose <strong>the</strong> correct aircraft layout to match <strong>the</strong> dem<strong>and</strong>. This is where a<br />
hub airport comes into its own. By flying passengers into a single location to board<br />
<strong>the</strong> long haul route, passenger density can be maintained at a high enough level to<br />
justify <strong>the</strong> use of an airbus A380 or Boeing 747-400.<br />
The aviation industry is not just about <strong>the</strong> use of <strong>the</strong> best <strong>and</strong> most efficient aircraft.<br />
On <strong>the</strong> ground <strong>the</strong>re are numerous measures that could be implemented to reduce <strong>the</strong><br />
carbon footprint of <strong>the</strong> airports. Ranging from changes in <strong>the</strong> day to day actions of<br />
staff to generating power on site to investments in new technology, <strong>the</strong>se changes can<br />
culminate in a far more efficient method of operation which will not only reduce<br />
aviations effect on <strong>the</strong> climate, it will also provide financial savings, in <strong>the</strong> long term,<br />
for <strong>the</strong> airport operators.<br />
Local generation <strong>the</strong>refore not only provides <strong>the</strong> sites installing electrical generational<br />
capacity with a source of low carbon energy, it also provides <strong>the</strong> site with <strong>the</strong><br />
potential of a guaranteed supply at minimal long term cost. Various methods of<br />
generation are available but some methods cannot be utilised at airports.<br />
The main point is that <strong>the</strong>re are numerous options to generate environmentally<br />
friendly energy on airports but <strong>the</strong>re are limitations. St<strong>and</strong>ard wind turbines can not be<br />
used at airports as <strong>the</strong>y disrupt radar <strong>and</strong> air navigation services. Turbines which have<br />
a vertical axel might be OK, but <strong>the</strong> position of <strong>the</strong>se would be critical.<br />
3.6 What can staff do?<br />
There are a wide range of actions staff can do in <strong>the</strong> workplace which, when<br />
combined with <strong>the</strong> efforts of colleagues, do make a considerable difference. The<br />
greatest gains will always be made by staff by making <strong>the</strong> conscious decision to<br />
reduce <strong>the</strong>ir carbon footprint <strong>and</strong> looking into <strong>the</strong> consequences of <strong>the</strong>ir actions. (See<br />
Appendix 4 of <strong>the</strong> CAT Aviation <strong>and</strong> <strong>the</strong> <strong>Environment</strong> briefing)<br />
Policy Options<br />
Air travel will not develop in a political vacuum: its size, shape <strong>and</strong> success will be<br />
determined politically by <strong>the</strong> UK <strong>and</strong> o<strong>the</strong>r European Governments, <strong>the</strong> EU <strong>and</strong> <strong>the</strong><br />
views of <strong>the</strong> wider society as a whole in regard to <strong>the</strong> issues of global warming <strong>and</strong><br />
transport.<br />
The problem facing <strong>the</strong> aviation sector is that it must balance its projected growth in<br />
passengers numbers, freight volumes <strong>and</strong> employment against its environmental<br />
impact of this growth. It will need to balance <strong>the</strong> increasing dem<strong>and</strong>s for lower travel<br />
costs, better service quality, <strong>and</strong> very highest safety st<strong>and</strong>ards, against increasingly<br />
dem<strong>and</strong>ing environmental st<strong>and</strong>ards.<br />
42 Source: Bombardier.<br />
44
The aerospace industry cannot produce new aircraft swiftly enough to fully replace<br />
existing fleets before 2020. As a consequence existing fleets will need to continue<br />
operations. These older passenger aircraft tend to end <strong>the</strong>ir working lives as freight<br />
only carriers. As a result even if <strong>the</strong> new technology is implemented on aircraft<br />
entering service, drop in solutions will also be needed to enable <strong>the</strong> existing fleets to<br />
reduce <strong>the</strong>ir impact.<br />
Indeed a more problematic <strong>and</strong> possibly more difficult questions that may have to be<br />
asked is to what extent is it possible to have a growing <strong>and</strong> sustainable aviation sector,<br />
<strong>and</strong> how such a system could seamlessly integrates with o<strong>the</strong>r sustainable transport<br />
networks.<br />
A fur<strong>the</strong>r consideration is of <strong>the</strong> sustainability of off-shoring <strong>the</strong> service industry,<br />
manufacturing <strong>and</strong> agricultural production still fur<strong>the</strong>r <strong>and</strong> fur<strong>the</strong>r from <strong>the</strong> end<br />
consumer, both in terms of environmental <strong>and</strong> employment impacts, even if this<br />
would have increased <strong>the</strong> number of jobs in <strong>the</strong> transport sector.<br />
Therefore <strong>the</strong> CAT National Committee supports <strong>the</strong> introduction of focused<br />
carbon offsetting schemes, but not as an alternative to carbon pricing, with robust<br />
regulation in place to ensure <strong>the</strong> scheme is making real sustainable reductions in<br />
emissions, without putting UK jobs at risk in <strong>the</strong> long term.<br />
The CAT National Committee recognises that aviations contribution to CO 2 is<br />
greater than a number of o<strong>the</strong>r industries. Its working assumption is <strong>the</strong> through<br />
radiative forcing its impact is twice that of some o<strong>the</strong>r industries. As <strong>the</strong>re have not<br />
been any studies into <strong>the</strong> radiative forcing levels of o<strong>the</strong>r transport modes, this<br />
figure will be kept under review <strong>and</strong> changed if necessary if <strong>and</strong> when fur<strong>the</strong>r<br />
scientific evidence becomes available.<br />
The CAT National Committee reconfirms its support for <strong>the</strong> ETS <strong>and</strong> calls for <strong>the</strong><br />
introduction of a world wide emissions trading scheme for civil aviation.<br />
Also it should campaign for a scheme to be introduced ei<strong>the</strong>r in <strong>the</strong> EU or<br />
worldwide for <strong>the</strong> decommissioning of more polluting aircraft.<br />
The CAT National Committee want to see <strong>the</strong> ending of <strong>the</strong> Air Passenger Duty<br />
when <strong>the</strong> EU Emissions Trading Scheme starts operation. If Air Passenger Duty is<br />
maintained, <strong>the</strong>n <strong>the</strong> revenue stream should be hypo<strong>the</strong>cated <strong>and</strong> used for<br />
environmentally friendly civil aviation projects. i.e. research, development <strong>and</strong><br />
implementation of new operational practices <strong>and</strong> technology.<br />
The Department for <strong>Transport</strong> (DfT) recognises that transport needs to play a key role<br />
in helping to deliver reductions in emissions of CO 2 . Yet some means of transport are<br />
more sustainable than o<strong>the</strong>rs.<br />
Paradoxically, road transport emits six times more carbon dioxide per passenger mile<br />
than rail, but motoring costs have fallen in recent years. Meanwhile, rail is far more<br />
carbon efficient, but rail fares have increased steeply. 43<br />
43 Greening <strong>the</strong> workplace, a report by <strong>the</strong> TUSDAC unions, 2005.<br />
45
The CAT National Committee calls on <strong>the</strong> Government to recognise <strong>the</strong> vital<br />
importance of developing high-speed intercity rail network that will offer<br />
passengers a realistic affordable alternative form of long-distance travel within <strong>the</strong><br />
UK.<br />
The CAT National Committee fur<strong>the</strong>r calls on <strong>the</strong> Government to support a major<br />
review of fast <strong>and</strong> efficient public transport access to <strong>the</strong> UK’s major airports.<br />
However, this review should take into account <strong>the</strong> problems facing staff travelling<br />
to <strong>and</strong> from <strong>the</strong> airport early in <strong>the</strong> mornings or late in <strong>the</strong> evenings.<br />
3.7 Conclusions<br />
The future of <strong>the</strong> civil aviation in <strong>the</strong> UK, in Europe <strong>and</strong> globally is difficult if not<br />
impossible to predict. However, <strong>the</strong>re is one thing that will be certain, it will not be<br />
uncontroversial! The divided views of scientists, environmentalists, politicians <strong>and</strong><br />
those who work in <strong>the</strong> industry will make sure of that.<br />
The decisions taken by <strong>the</strong> <strong>Unite</strong> will affect this debate to some degree. It will have<br />
balance issues of growth <strong>and</strong> employment in <strong>the</strong> industry, against <strong>the</strong> environmental<br />
costs <strong>the</strong> industry produces.<br />
The Civil Air <strong>Transport</strong> Committee briefing, on Aviation <strong>and</strong> <strong>the</strong> <strong>Environment</strong> may<br />
help you in <strong>the</strong> decision making process, but it does not pretend to have <strong>the</strong> answers<br />
to <strong>the</strong>se difficult decisions only suggestions.<br />
46
4 Docks, Inl<strong>and</strong> Waterways, <strong>and</strong> Fisheries <strong>and</strong> <strong>Sustainable</strong> <strong>Transport</strong><br />
4.1: Introduction<br />
For <strong>the</strong> 200,000 years of human existence, <strong>the</strong> seas <strong>and</strong> oceans have always been rich<br />
in life <strong>and</strong> a source of abundant food. We have treated <strong>the</strong>m as if <strong>the</strong>y were limitless<br />
resource. But we can do so no longer. The awe-inspiring – <strong>and</strong> mostly damaging –<br />
changes to <strong>the</strong> pre-human order started first on l<strong>and</strong>, <strong>the</strong>n on our coasts <strong>and</strong> now in <strong>the</strong><br />
atmosphere by <strong>the</strong> planet’s billions of human inhabitants are beginning to affect even<br />
<strong>the</strong> oceans that cover over two-thirds of <strong>the</strong> globe.<br />
The seas are not boiling hot, but <strong>the</strong>ir surface waters are noticeably warmer than <strong>the</strong>y<br />
were even 50 years ago, <strong>and</strong> this is largely as a result of human-induced climate<br />
change. Even <strong>the</strong> most restrained scientific reports on <strong>the</strong> state of <strong>the</strong> oceans make<br />
alarming reading for anyone who cares about <strong>the</strong> health of <strong>the</strong> seas.<br />
“Ocean surface waters are warming, <strong>the</strong> sea level is rising ever faster, <strong>the</strong> oceans are<br />
becoming increasingly acidic <strong>and</strong> marine ecosystems are under threat,” was <strong>the</strong><br />
measured conclusion of <strong>the</strong> German Advisory Council on Global Change in its report<br />
44 on <strong>the</strong> future of our seas. “Human activities are unleashing processes of change in<br />
<strong>the</strong> oceans that are without precedent in <strong>the</strong> past several million years.”<br />
The UK’s economy has historically been based on our position as a trading nation, for<br />
centuries with an empire that made it easy to access to colonial markets <strong>and</strong> exploit<br />
<strong>the</strong>ir raw materials. Whilst some have suggested that Britain could meet much more<br />
of its own food <strong>and</strong> material needs, <strong>and</strong> that this might benefit both social<br />
sustainability (jobs) <strong>and</strong> environmental sustainability, few would want to live in an<br />
economy without any overseas imports at all – particularly those which we could not<br />
produce ourselves, such as coffee, chocolate, citrus fruit, <strong>and</strong> spices.<br />
The importance of shipping <strong>and</strong> trade to <strong>the</strong> economy of <strong>the</strong> UK, an isl<strong>and</strong> nation, has<br />
resulted in <strong>the</strong> establishment of a large number of ports around <strong>the</strong> coast, which are<br />
very diverse in terms of size <strong>and</strong> type of cargo h<strong>and</strong>led.<br />
Therefore our seaports are important transports hubs where ship, road <strong>and</strong> rail<br />
converge, <strong>and</strong> our inl<strong>and</strong> waterways should be used as main arteries of our industrial<br />
infrastructure, ra<strong>the</strong>r than just a leisure facility.<br />
The importance of shipping <strong>and</strong> trade to <strong>the</strong> economy of <strong>the</strong> UK, an isl<strong>and</strong> nation, has<br />
resulted in <strong>the</strong> establishment of a large number of ports around <strong>the</strong> coast, which are<br />
very diverse in terms of size <strong>and</strong> type of cargo h<strong>and</strong>led.<br />
4.2 Rising Sea levels<br />
A rise in sea levels <strong>and</strong> o<strong>the</strong>r changes fuelled by global warming threaten roads, rail<br />
lines, ports, airports <strong>and</strong> o<strong>the</strong>r important infrastructure in <strong>the</strong> <strong>Unite</strong>d Kingdom. It was<br />
nearly 200 years ago that Lord Byron foresaw <strong>the</strong> flooding of Venice. And as an<br />
44 http://www.wbgu.de/wbgu_sn2006_en.html<br />
47
unaccustomed portion of <strong>the</strong> famously submerged Italian city continues to lie under<br />
water, <strong>the</strong> words of his 1818 poem Ode To Venice appear more apt than ever.<br />
“Venice! Venice! When thy marble walls are level with <strong>the</strong> waters, <strong>the</strong>re shall be a<br />
cry of nations o’er thy sunken halls, a loud lament along <strong>the</strong> sweeping seas,” he wrote.<br />
But it seems his words could just as well apply to parts of Wales after it was<br />
announced a new study is to consider whe<strong>the</strong>r Welsh coastal towns may simply have<br />
to be ab<strong>and</strong>oned in <strong>the</strong> face of rising sea levels 45 .<br />
With scientists predicting sea levels will rise by about a metre by <strong>the</strong> end of <strong>the</strong><br />
century, <strong>the</strong> Assembly-backed study will consider how viable it will be for people to<br />
go on living along <strong>the</strong> coast.<br />
The study will focus on Pwllheli, in North Wales, <strong>and</strong> Barry, in <strong>the</strong> Vale of<br />
Glamorgan, <strong>and</strong> assess whe<strong>the</strong>r in <strong>the</strong> long term it is worth improving <strong>the</strong>ir sea<br />
defences to avoid scenes like those predicted by Lord Byron.<br />
But experts have warned it may be time to start thinking <strong>the</strong> unthinkable – that <strong>the</strong>y<br />
simply have to be given up to <strong>the</strong> sea.<br />
Both Barry <strong>and</strong> Pwllheli experienced severe flooding in 2000 <strong>and</strong> <strong>the</strong> study will also<br />
examine <strong>the</strong> more immediate question of how this can be prevented in future.<br />
Former head of <strong>the</strong> Met Office Sir John Houghton said that irrespective of any<br />
progress on emissions targets, sea levels will continue to rise as <strong>the</strong> polar ice caps<br />
melt at an alarming rate.<br />
Sir John, who was among a group of scientists who shared <strong>the</strong> Nobel Peace Prize with<br />
former US Vice-President Al Gore for <strong>the</strong>ir work on climate change, said: “One metre<br />
is a big rise so it may well be that certain populations or areas by <strong>the</strong> sea have to be<br />
ab<strong>and</strong>oned as a result, ra<strong>the</strong>r than building expensive sea defences.<br />
“Sea levels will continue to rise for hundreds of years, whatever we do about<br />
controlling climate change.”<br />
In <strong>the</strong> <strong>Unite</strong>d States <strong>the</strong> greatest <strong>and</strong> most immediate potential impact is coastal<br />
flooding, according to one of <strong>the</strong> reports, by an expert panel convened by <strong>the</strong> National<br />
Research Council, <strong>the</strong> research arm of <strong>the</strong> National Academy of Sciences 46 .<br />
Ano<strong>the</strong>r study, a multi-agency effort led by <strong>the</strong> <strong>Environment</strong>al Protection Agency,<br />
sounds a similar warning on coastal infrastructure but adds that natural features like<br />
beaches, wetl<strong>and</strong>s <strong>and</strong> fresh-water supplies are also threatened by encroaching salt<br />
water.<br />
45 Rising sea levels threaten coastal towns Dec 3 2008 by Darren Devine, Western Mail<br />
46 U.S. reports say rising sea levels threaten infrastructure By Cornelia Dean Wednesday, March<br />
12, 2008 International Herald Tribune<br />
48
The reports are not <strong>the</strong> first to point out that rising seas, inevitable in a warming<br />
world, are a major threat. For example, in a report last September, <strong>the</strong> Miami-Dade<br />
County Climate Change Task Force noted that a rise of two feet, or a little over half a<br />
meter, by <strong>the</strong> year 2100 as predicted by <strong>the</strong> <strong>Unite</strong>d Nations' Intergovernmental Panel<br />
on Climate Change "would make life in South Florida very difficult for everyone."<br />
But <strong>the</strong> new reports offer detailed assessments of vulnerability in <strong>the</strong> relatively near<br />
term. Both note that coastal areas are densely populated, economically important <strong>and</strong><br />
gaining people <strong>and</strong> investment by <strong>the</strong> day, even as scientific knowledge of <strong>the</strong> risks<br />
<strong>the</strong>y face increases. Use of this knowledge by policy makers <strong>and</strong> planners is<br />
"inadequate," <strong>the</strong> academy panel said.<br />
"It's time for <strong>the</strong> transportation people to put <strong>the</strong>se things into <strong>the</strong>ir thought<br />
processes," Henry Schwartz Jr., <strong>the</strong> chairman of <strong>the</strong> research council panel, said in an<br />
interview.<br />
Rising sea levels caused by global warming will threaten <strong>the</strong> future of ports <strong>and</strong> portside<br />
communities not only in <strong>the</strong> UK but worldwide. 3.2billion people currently live<br />
in sea level communities that could be threatened by rising sea levels <strong>and</strong> more at risk<br />
of tsunami type events, with <strong>the</strong> UN estimating that over a billion people will be<br />
vulnerable to flooding by 2050 if we don’t dramatically reduce our climate change<br />
impact now.<br />
Scientists at a international conference on climate change in Copenhagen in March<br />
heard that predictions from <strong>the</strong> Intergovernmental Panel on Climate Change, <strong>the</strong> body<br />
of climate experts convened by <strong>the</strong> UN, had underestimated <strong>the</strong> extent of sea level<br />
rises.<br />
Sea levels are rising faster than predicted, <strong>and</strong> are likely to surge by 50cm-1m by <strong>the</strong><br />
end of <strong>the</strong> century owing to climate change. Such levels would cause serious harm to<br />
coastal areas, said researchers, <strong>and</strong> affect at least 10 per cent of <strong>the</strong> world's<br />
population 47 .<br />
4.3: Greenhouse Gas Emissions<br />
The total greenhouse gas emissions from Water <strong>Transport</strong> 48 in 2006 were 19.4 million<br />
tonnes, which was 2.7 per cent of <strong>the</strong> total greenhouse emission of <strong>the</strong> 93 economic<br />
sectors in <strong>the</strong> UK.<br />
Water transport accounts for 21 per cent of <strong>the</strong> total greenhouse gas emissions in <strong>the</strong><br />
transport sector in 2006. This was <strong>the</strong> second largest emissions for <strong>the</strong> transport<br />
sector, <strong>and</strong> was followed by freight transported by road. However, <strong>the</strong> freight<br />
transported by road does not include <strong>the</strong> activities of o<strong>the</strong>r companies which operate<br />
47 Seas rise faster than expected By Fiona Harvey Financial Times March 11 2009 02:00 | Last<br />
updated: March 11 2009<br />
48 Sea <strong>and</strong> coastal water transport including; Passenger sea <strong>and</strong> coastal water transport; Freight sea <strong>and</strong><br />
coastal water transport; Inl<strong>and</strong> water transport;<br />
49
lorries but do not operated in <strong>the</strong> hire <strong>and</strong> reward sector. Overall greenhouse gas<br />
emissions peaked in 2004 at 27.45 millions tonnes.<br />
Emissions from international aviation <strong>and</strong> shipping can be estimated from refuelling<br />
from bunkers at ports (whe<strong>the</strong>r by UK or non-UK operators).<br />
Emissions from UK shipping bunker fuel use are around <strong>the</strong> same as <strong>the</strong>y were in<br />
1990, but UK operators purchase most of <strong>the</strong>ir fuel outside <strong>the</strong> UK. So <strong>the</strong>se figures<br />
do not capture any increases in shipping fuels purchased abroad which have most<br />
likely increased substantially over <strong>the</strong> period.<br />
Under <strong>the</strong> guidelines agreed for UNFCCC, reporting emission from international<br />
shipping are not included in <strong>the</strong> UK’s emissions, but <strong>the</strong>se estimates are reported as<br />
memo items in national greenhouse gas inventories. Parties to <strong>the</strong> UNFCCC are<br />
required to act to limit or reduce emissions from international services working<br />
through <strong>the</strong> International Maritime Organisation (IMO).<br />
4.4: Ports<br />
In total <strong>the</strong>re are more than 650 ports in <strong>the</strong> UK for which statutory harbour authority<br />
powers have been granted, of which around 120 are commercially active. They range<br />
from ports such as <strong>the</strong> Port of London, which extends 95 miles from Teddington to<br />
<strong>the</strong> North Sea, to small harbour trusts responsible for quays, piers <strong>and</strong> o<strong>the</strong>r facilities<br />
which are only of local significance.<br />
Water <strong>Transport</strong> Total Greenhouse Gas Emissions 1990- 2006<br />
29000<br />
27000<br />
25000<br />
'000 tonnes<br />
23000<br />
21000<br />
19000<br />
17000<br />
15000<br />
1990 1995 2000 2005<br />
Year<br />
Figure 4.1: Water <strong>Transport</strong> Total Greenhouse Gas Emissions 1990 -<br />
2006<br />
The UK ports industry is <strong>the</strong> largest in Europe in terms of freight tonnage.<br />
It is estimated that around 95 per cent by volume <strong>and</strong> 75 per cent by value of <strong>the</strong> UK’s<br />
international trade is transported by sea. In 2007, total UK imports across all transport<br />
50
modes were 581million tones of which inward freight traffic accounted for 62 per<br />
cent <strong>and</strong> 38 per cent outward freight traffic.<br />
In addition, each year around 50 million international <strong>and</strong> domestic passenger<br />
journeys are made through UK ports. In 2007, <strong>the</strong>re were 25 million international sea<br />
passenger journeys to <strong>and</strong> from <strong>the</strong> UK, <strong>and</strong> 24 million Ro-ro passengers on short sea<br />
routes, <strong>and</strong> 20 million on inter-isl<strong>and</strong> services such as <strong>the</strong> Isle of Wight <strong>and</strong> Scottish<br />
isl<strong>and</strong>s.<br />
As for all o<strong>the</strong>r transport sectors, ports activities are subjected to several EU <strong>and</strong><br />
international rules on environmental protection (such as on birds protection, water or<br />
air quality). The debate within <strong>the</strong> ETF TRUST discussions covered <strong>the</strong> future ports<br />
policy also involved environmental questions, <strong>and</strong> was particularly focused on <strong>the</strong><br />
relationship between <strong>the</strong> growth of port activities <strong>and</strong> <strong>the</strong> consequences it has on<br />
environment. The increasing flows of maritime transport <strong>and</strong> <strong>the</strong> development of<br />
logistics, require ports in some cases to exp<strong>and</strong>, in o<strong>the</strong>r to rethink <strong>the</strong>ir role <strong>and</strong> to<br />
become nodal points within an inter-modal transport chain.<br />
In <strong>the</strong> past port activities <strong>and</strong> environmental protection were often mentioned as<br />
irreconcilable <strong>the</strong> one with <strong>the</strong> o<strong>the</strong>r, <strong>the</strong> current debate is more oriented at looking for<br />
solutions which satisfy both <strong>the</strong> need for increased capacity <strong>and</strong> <strong>the</strong> need to protect<br />
<strong>the</strong> environment. One of <strong>the</strong> points agreed by <strong>the</strong> ETF Dockers Section during <strong>the</strong><br />
TRUST workshop on ports was <strong>the</strong> possibility of coupling both <strong>the</strong> above mentioned<br />
objectives: besides developing <strong>the</strong>ir activities in ports <strong>and</strong> thus being directly exposed<br />
to air pollution from ships in <strong>the</strong> form of NOx, SOx <strong>and</strong> particulate matter, port<br />
workers are also citizens living in port neighbourhoods <strong>and</strong> aiming at living in<br />
socially <strong>and</strong> environmentally sustainable areas. A first step to be considered is that<br />
port expansion should be only considered as long as it is strictly necessary, since <strong>the</strong>re<br />
are some cases where alternative solutions can be found, such as redesigning or<br />
adapting <strong>the</strong> existing infrastructures. In any case, a clarification of <strong>the</strong> application of<br />
<strong>the</strong> current environmental rules to ports should be considered.<br />
Fur<strong>the</strong>rmore, <strong>the</strong> relationship between ports <strong>and</strong> local communities in <strong>the</strong> hinterl<strong>and</strong><br />
has to be considered in order to overcome possible controversies. Although ports<br />
generate employment <strong>and</strong> economic benefits for <strong>the</strong> local communities, <strong>the</strong> industry<br />
does not have a positive or environmentally friendly image amongst <strong>the</strong> neighbouring<br />
communities. The TRUST debate highlighted that <strong>the</strong> current EU legislation does not<br />
take into consideration recent positive developments in terms of environmental<br />
performance in <strong>the</strong> sector, or in parts of it, <strong>and</strong> that <strong>the</strong>re is no need to start from<br />
scratch. In many EU regions <strong>and</strong> ports in fact different forms of dialogue are already<br />
in place, which led to shared <strong>and</strong> balanced solutions, which could certainly be spread<br />
as best practices. Also at EU level dialogue is in place <strong>and</strong> some valid instruments<br />
have already been developed by certain stakeholders, which could be used as a basis<br />
to develop fur<strong>the</strong>r measures.<br />
Finally, <strong>the</strong> TRUST debate highlighted that <strong>the</strong> coordination between <strong>the</strong><br />
environmental policy measures applying to <strong>the</strong> various transport modes should be<br />
enhanced, especially in <strong>the</strong> light of <strong>the</strong> expansion of logistics, which require a closer<br />
connection <strong>and</strong> coherence between <strong>the</strong> various transport modes, in order to minimize<br />
<strong>the</strong> side effects that policies applying to one mode could have on <strong>the</strong> o<strong>the</strong>rs. This<br />
51
aspect is crucial for ports, which, being <strong>the</strong> place where different transport modes<br />
meet, have to comply with legislation applying to different sectors.<br />
4.5: What can ports <strong>and</strong> terminals do to significantly improve <strong>the</strong>ir<br />
environmental profile?<br />
Sources of Air Pollution in Ports’<br />
• Ships movements <strong>and</strong> alongside, on own power;<br />
• Port activity – cargo h<strong>and</strong>ling, etc;<br />
• Port/cargo-related transportation;<br />
• Port/cargo-related process & storage industry;<br />
• Distribution transportation; lorries <strong>and</strong> trains<br />
• Intra-port traffic, including tugs, patrol/pilot boats<br />
Types of Air Pollution in Ports’<br />
Air Pollution in Ports Areas arises principally from:<br />
Diesel engines <strong>and</strong> o<strong>the</strong>r combustion processes involving fossil fuels:<br />
Carbon Dioxide – CO 2 ;<br />
Particulates PM10, etc.;<br />
Hydrocarbons - HC;<br />
Oxides of Nitrogen - NOx;<br />
Sulphur products – SOx;<br />
but o<strong>the</strong>r pollutants may also be present: Chemical vapours / gases from industrial<br />
processes.<br />
“Cold Ironing” The Solution or Merely a Panacea?<br />
“Shore power” is nothing new – NATO <strong>and</strong> former Warsaw pact navies have<br />
used st<strong>and</strong>ard equipment in all major naval bases, for over 40 years:<br />
440V, 3 phase, 3 wire, 60 Hz;<br />
St<strong>and</strong>ard bolted connections to cables.<br />
For merchant ships, <strong>the</strong> lack of world-wide class st<strong>and</strong>ards for power systems<br />
creates difficulty in providing shore power to a wide variety of ships:<br />
“Cold-Ironing” is a way towards reducing emissions of ships in port but:<br />
o It is more suitable for longer-term turn-around visits, especially where<br />
dedicated berths are provided to one company or class of ships;<br />
o The environmental benefits are largely localised, ra<strong>the</strong>r than total;<br />
O<strong>the</strong>r Means of Reducing Pollutants while Alongside<br />
<br />
<br />
<br />
Shore-side Diesel generators – better matched to load, so lower “signature”<br />
but still producing key pollutants;<br />
Shore-side LPG powered generators – successful Pacific Gas <strong>and</strong> Electric<br />
Company trials in Oakl<strong>and</strong>, USA, July 2007: Better but still not “Carbon-<br />
Neutral”<br />
Shore power will not always be possible, so we should identify o<strong>the</strong>r areas of<br />
sea <strong>and</strong> port activity, in which “offset” or o<strong>the</strong>r benefits can be obtained.<br />
52
Cargo-H<strong>and</strong>ling:<br />
“Specific Power” (power needed to move 1 tonne of cargo 1Km) reduces as<br />
ships’ sizes increase:<br />
Do ports need to invest in dredged access <strong>and</strong> cargo h<strong>and</strong>ling facilities for <strong>the</strong><br />
largest container <strong>and</strong> bulk vessels?<br />
Increased Vessel Productivity to Reduce Time in Port – Double-Cycling <strong>and</strong><br />
Twin/T<strong>and</strong>em Picks for Quay Cranes<br />
Container Yard<br />
o Double-cycling of yard tractors<br />
o Quay crane double-cycling<br />
o Yard tractor double-cycling<br />
o Pooling of tractors serving groups of quay cranes<br />
o Intelligent route planning: Minimization of travelling distance yields<br />
increased productivity <strong>and</strong> reduced fuel consumption<br />
o Storage buffers at on-dock rail yards<br />
o Depending on terminal layout <strong>and</strong> <strong>the</strong> type of lift & transport<br />
equipment used, <strong>the</strong> benefit of double-cycling on a long drayage route<br />
may offset any extra lifts in a grounded buffer area.<br />
o Enables double-cycling of dray vehicles<br />
Port transportation:<br />
Cranes/container movers increasingly electrically driven;<br />
Trucks, etc. likely to remain fossil-fuel powered but Euro 4/Tier III engines<br />
available (reduced PM10s, HCs <strong>and</strong> Nox) Currently <strong>the</strong>se are all typically<br />
powered by diesel fuel<br />
<br />
<br />
Port-based process <strong>and</strong> storage facilities:<br />
o Not only economic sense (adding value from realestate)<br />
o But sound environmental benefits to be gained (reduced transportation:<br />
Tonne-Kms)<br />
Port-located power generation.<br />
o<br />
Available industrial l<strong>and</strong> <strong>and</strong> ports’ permitted development powers<br />
lend to:<br />
Wind turbines;<br />
“Biomass”;<br />
“Waste to power” generating plant.<br />
<br />
<br />
Reduce <strong>the</strong> need for cargo onward double transportation?<br />
o Ports should be developed with adjacent space for distribution facilities<br />
serving local markets;<br />
o This needs Government underst<strong>and</strong>ing, recognition <strong>and</strong> support for<br />
planning, at both UK <strong>and</strong> local levels.<br />
Co-Located Ports <strong>and</strong> Distribution Parks?<br />
o<br />
o<br />
Combination of Port adjacent to major distribution park:<br />
Typical of <strong>the</strong> European model but less usual in <strong>the</strong> UK.<br />
53
Look to new technology to provide low-emission vessels for port<br />
activity:<br />
o<br />
o<br />
o<br />
Seek efficient, modern tugs, running on low-sulphur MGO?<br />
Encourage intra-port cargo services to renew <strong>the</strong>ir fleets or upgrade<br />
propulsion machinery to Euro IV / Tier III st<strong>and</strong>ards?<br />
Operate low-emissions pilotage <strong>and</strong> patrol vessels?<br />
<br />
Outside Lorries<br />
<br />
<br />
<br />
<br />
<br />
<br />
<br />
<br />
<br />
<br />
Reduce <strong>the</strong> number of truck visits for a given throughput<br />
Enable trucks to perform two transactions per port visit<br />
Web-enabled dispatch / container move matching systems<br />
Virtual container yard (reduces empty re-position moves) – Reduce<br />
gate process time <strong>and</strong> queuing / idling time<br />
Web-based pre-process <strong>and</strong> pre-advise<br />
Optical Character Recognition (OCR)<br />
RFID tagging of trucks – Spread <strong>the</strong> workload to <strong>the</strong> container yard<br />
Extend gate (<strong>and</strong> yard crane) hours<br />
Increase average truck travel speed on <strong>the</strong> road<br />
Appointments aimed at avoiding congestion hours<br />
WHAT IS OUR GOAL?<br />
Climate Change?<br />
Global Scale<br />
Greenhouse gases (especially CO2) reduction<br />
Human Health Risk<br />
Regional Scale<br />
o NOx<br />
o SOx<br />
o Local Scale<br />
• PM (particulate matter), especially from diesel engines<br />
The best strategy for reducing emissions depends on which types of emissions are<br />
targeted.<br />
The “best” strategies may be different in different ports this is why prescriptive<br />
regulations can sometimes miss <strong>the</strong> target. Reducing GHG needs to become part of<br />
daily environmental management of a port<br />
Small-scale initiatives can generate important effects<br />
A lot can be done through self-regulation but not everything<br />
Any EU legal / policy framework for ports <strong>and</strong> shipping should be proportional <strong>and</strong><br />
dovetail <strong>the</strong> international framework<br />
54
4.6: Inl<strong>and</strong> Waterways<br />
In <strong>the</strong> UK our waterways are an integrated part of a complex, sensitive <strong>and</strong> partly<br />
threatened ecosystem. Therefore, inl<strong>and</strong> navigation in <strong>the</strong> UK should be performed in<br />
an environmentally sustainable way as it is energy efficient, quiet, uses little space<br />
<strong>and</strong> thus makes <strong>the</strong> sector one of <strong>the</strong> least environmentally damaging mode of<br />
transport. It is only responsible for 1.5 per cent of transport CO 2 emissions in <strong>the</strong> EU-<br />
25, which is on <strong>the</strong> one h<strong>and</strong> due to its low average fossil fuel consumption but on <strong>the</strong><br />
o<strong>the</strong>r h<strong>and</strong> due to its ability to carry high weights of freight over long distances.<br />
Consequently, emissions of o<strong>the</strong>r harmful air pollutants such as SO x , NO x <strong>and</strong><br />
particulate matters are also comparably small. At present, however, <strong>the</strong> capacity of<br />
inl<strong>and</strong> waterway vessels is not even fully utilised as <strong>the</strong>y could h<strong>and</strong>le even much<br />
greater volumes.<br />
Fur<strong>the</strong>r reduction of fuel consumption <strong>and</strong> emissions may be achieved by energyefficiency<br />
measures, such as improved <strong>and</strong> innovative technologies <strong>and</strong> vessel<br />
concepts. However, <strong>the</strong>se measures cannot be implemented immediately as vessels<br />
have a very long lifetime.<br />
Therefore it is not only necessary to construct environmentally friendly new vessels<br />
but also to modernise existing ones. The modernisation of vessels, however, is not<br />
only important for <strong>the</strong> environment but also for improving working <strong>and</strong> living<br />
conditions on board. One crucial step in this direction is <strong>the</strong> installation of River<br />
Information Systems, which support <strong>the</strong> planning <strong>and</strong> management of transport<br />
operations by enabling an optimal cruise speed <strong>and</strong> an optimal operation of vessels.<br />
Inl<strong>and</strong> navigation is not harmless but has various environmental effects on <strong>the</strong> local<br />
<strong>and</strong> regional river ecosystems, such as whirling up of fine sediments due to intense<br />
traffic, an increase of <strong>the</strong> suspended particles in <strong>the</strong> rivers, <strong>the</strong> re-suspension of<br />
sediments <strong>and</strong> due to <strong>the</strong> jet of ship propellers a relocation of s<strong>and</strong> <strong>and</strong> gravel. This<br />
may not only have a direct impact on species living along river banks but may also<br />
damage <strong>the</strong> hydraulic conditions of <strong>the</strong> river banks. The extent of <strong>the</strong> damage depends<br />
on <strong>the</strong> size of <strong>the</strong> ships, <strong>the</strong> load, speed <strong>and</strong> direction of traffic. Waste from ships is<br />
ano<strong>the</strong>r environmental issue: Mineral oil is brought into rivers in <strong>the</strong> form of bilge oil<br />
<strong>and</strong> <strong>the</strong> dumping of wash waters from tank cleaning into rivers can be found despite<br />
existing regulations. Lastly <strong>the</strong>re is <strong>the</strong> potential risk of accidents, although seldom<br />
occurred, where potential quantities of hazardous substances could come into <strong>the</strong><br />
water <strong>and</strong> harm <strong>the</strong> environment.<br />
The basic conflict is that natural rivers need diversity while inl<strong>and</strong> navigations needs<br />
stability <strong>and</strong> <strong>the</strong> rivers adjusted to <strong>the</strong> ships. Therefore, it is necessary to apply a<br />
holistic <strong>and</strong> proportionate approach which balances <strong>the</strong> interest of <strong>the</strong> users <strong>and</strong> <strong>the</strong><br />
ecosystem <strong>and</strong> also takes into account <strong>the</strong> workers on board <strong>the</strong> vessels <strong>and</strong> those<br />
working to maintain <strong>the</strong> rivers <strong>and</strong> <strong>the</strong> canals.<br />
Although <strong>the</strong> importance of <strong>the</strong> inl<strong>and</strong> waterways has decline in regards to <strong>the</strong><br />
transportation of freight, <strong>the</strong>y can have an increasing important role in an integrated<br />
<strong>and</strong> sustainable transport system.<br />
55
From Table we can although waterborne freight in <strong>the</strong> UK declined over all by a total<br />
of 9.4 per cent it was at its lowest in 2004 when it declined by 20.9 per cent to 1.63<br />
billion tonnes-kilometres.<br />
Inl<strong>and</strong> water traffic 1999-2007 billions tonnes-kilometres<br />
2.50<br />
2.00<br />
1.50<br />
1.00<br />
0.50<br />
0.00<br />
1999 2000 2001 2002 2003 2004 2005 2006 2007<br />
Year<br />
internal Coastwise Foreign one-port Total<br />
Source: Table 2.3 Waterborne Freight in <strong>the</strong> <strong>Unite</strong>d Kingdom 2007<br />
Figure 4.2: Inl<strong>and</strong> water traffic 1999-2007 billion tonnes kilometres<br />
56
Figure 4.3: Major inl<strong>and</strong> waterway routes - total goods moved 2007 Billion tonne<br />
kilometre<br />
River Forth 0.17<br />
River Clyde 0.09<br />
Aire <strong>and</strong> 0.01<br />
Calder<br />
River Ouse 0.04<br />
River Mersey 0.11<br />
Manchester<br />
Ship Canal 0.09<br />
River Humber 0.23<br />
River Trent 0.03<br />
River Severn 0.01<br />
River Orwell 0.05<br />
River Thames 0.82<br />
River Medway 0.04<br />
57
4.7: Shipping<br />
The problem shipping is that tonne-miles <strong>and</strong> gross tonnage was growing at similar<br />
rates to world GDP but <strong>the</strong> number of vessels growth smaller, due to shift to larger<br />
ships.<br />
Greenhouse gases from UK-based international shipping 1990-2006<br />
10.0<br />
million tonnes (CO2 equivalent)<br />
5.0<br />
0.0<br />
1990 1995 2000 2005<br />
Year<br />
Figure 4.4: Greenhouse gases from UK-based international shipping 1990-2006<br />
The warning was reinforced in February 2008 by a study 49 presented to <strong>the</strong> American<br />
Association for <strong>the</strong> Advancement of Science, which concluded that more than 40 per<br />
cent of <strong>the</strong> world’s oceans are heavily affected by human activities <strong>and</strong> only 4 per<br />
cent remain almost pristine. The results were obtained by overlaying maps of 17<br />
different activities such as fishing, coastal development <strong>and</strong> shipping pollution. It<br />
shows that <strong>the</strong> most heavily affected waters include large areas of <strong>the</strong> North Atlantic,<br />
<strong>the</strong> South <strong>and</strong> East China seas, <strong>the</strong> Caribbean, Mediterranean, Red Sea, <strong>the</strong> Gulf,<br />
Bering Sea, <strong>and</strong> much of <strong>the</strong> western Pacific.<br />
The least affected areas are mainly near <strong>the</strong> Arctic <strong>and</strong> Antarctic, though a few places<br />
far from <strong>the</strong> poles, such <strong>the</strong> Torres Strait, north of Australia, are also relatively<br />
untouched.<br />
US researchers have produced a composite picture of man-made damage to <strong>the</strong> seas.<br />
The dumping of vast quantities of garbage <strong>and</strong> <strong>the</strong> rampant over fishing of almost all<br />
forms of edible marine life. Growing areas of ocean are effectively ‘dead’. The<br />
damage to biodiversity has knock on effects on <strong>the</strong> rest of us – from our food supply<br />
to our leisure activities, <strong>and</strong> most pressing of all, to our climate.<br />
O<strong>the</strong>r problems, such as rising sea levels, changing ocean currents <strong>and</strong> <strong>the</strong> increased<br />
intensity of typhoons <strong>and</strong> hurricanes, will impact most severely on coastal<br />
49 http://www.sciencemag.org/cgi/content/abstract/319/5865/948<br />
58
communities <strong>and</strong> on coastal infrastructure including ports <strong>and</strong> docks. For years <strong>the</strong><br />
oceans have silently served our planet by absorbing about a third of human-induced<br />
carbon dioxide emissions (<strong>the</strong>y already hold 38,000 gigatonnes 50 of carbon, many<br />
times more than <strong>the</strong> air or <strong>the</strong> l<strong>and</strong>), but climate change is already damaging <strong>the</strong> sea’s<br />
ability to continue to absorb CO2. 51<br />
Whilst no one wea<strong>the</strong>r event can ever be said conclusively to be caused by climate<br />
change, Hurricane Katrina was just one example of <strong>the</strong> type of catastrophe that<br />
scientists agree will become more common. Unfortunately this <strong>and</strong> o<strong>the</strong>r coastal<br />
tragedies (such as <strong>the</strong> Sri Lankan Tsunami) had worse impacts in part due to <strong>the</strong><br />
degradation <strong>and</strong> industrialisation of nearby coastline <strong>and</strong> <strong>the</strong> loss of natural defences<br />
such as mangrove swamps, which in <strong>the</strong> past helped absorb shock <strong>and</strong> flood waters.<br />
Avoiding such problems, <strong>and</strong> reversing <strong>the</strong>m, requires a drastic reduction of carbon<br />
dioxide emissions, as well as sensible policies to protect marine biodiversity <strong>and</strong> to<br />
police this.<br />
O<strong>the</strong>r problems, such as rising sea levels, changing ocean currents <strong>and</strong> <strong>the</strong> increased<br />
intensity of typhoons <strong>and</strong> hurricanes – are more severe <strong>and</strong> will be harder to tackle<br />
without a drastic reduction of carbon dioxide emissions.<br />
And some of our problems with <strong>the</strong> seas are existential. For years <strong>the</strong> oceans have<br />
silently served our planet by absorbing about a third of human-induced carbon dioxide<br />
emissions (<strong>the</strong>y already hold 38,000 gigatonnes of carbon, many times more than <strong>the</strong><br />
air or <strong>the</strong> l<strong>and</strong>), but it is not clear exactly how quickly <strong>the</strong> absorption can continue or<br />
what <strong>the</strong> effects might be on <strong>the</strong> oceans <strong>the</strong>mselves.<br />
But <strong>the</strong>re is room for hope, with targeted efforts to protect <strong>the</strong> chunks of <strong>the</strong> ocean<br />
that remain relatively pristine, we have a good chance of preserving <strong>the</strong>se areas in<br />
good condition.<br />
Container shipping lines have started a concerted effort to rehabilitate <strong>the</strong> industry's<br />
battered public image, recently <strong>the</strong>y launched a campaign to show its environmental<br />
record is improving <strong>and</strong> that <strong>the</strong> industry's record on security is good.<br />
The growing criticism of <strong>the</strong> impact of shipping, particularly on <strong>the</strong> environment, has<br />
prompted shipping lines to launch <strong>the</strong> Container Shipping Information Service.<br />
There has been particularly strong criticism of Hong Kong - which, with neighbouring<br />
Shenzhen, h<strong>and</strong>les about 28 per cent of world container movements - <strong>and</strong> sou<strong>the</strong>rn<br />
California, which h<strong>and</strong>les 40 per cent of US container imports.<br />
"The largest category of ships, which carry most of <strong>the</strong> world's cargo, are termed<br />
Category 3 vessels by <strong>the</strong> USA <strong>Environment</strong>al Protection Agency (EPA). Category 3<br />
vessels are fuelled by bunker oil, <strong>the</strong> dirtiest <strong>and</strong> least expensive form of fuel<br />
available. As high-grade petroleum products such as jet fuel, gasoline, <strong>and</strong> diesel fuel<br />
are produced, <strong>the</strong> refining process removes undesirable chemicals. The residue from<br />
<strong>the</strong> production of <strong>the</strong>se higher grade fuels is collected <strong>and</strong> sold as bunker oil. Bunker<br />
50 Giga is a factor of 10 9<br />
51 http://www.guardian.co.uk/environment/2009/jan/12/sea-co2-climate-japan-environment<br />
59
oil contains high concentrations of toxic fuel compounds banned from use in most<br />
o<strong>the</strong>r industrial <strong>and</strong> consumer applications.<br />
The pollutants emitted from burning this dirty fuel leads to acid rain, global climate<br />
changes, particularly over oceans, <strong>and</strong> damaging health effects for communities living<br />
near major port areas.<br />
Analysis by Carnegie Mellon <strong>and</strong> Duke Universities suggests that smokestack<br />
emissions 52 from ships may account for half <strong>the</strong> sulphur found over <strong>the</strong> world's<br />
oceans, <strong>and</strong> 60 percent of <strong>the</strong> airborne sulphur in <strong>the</strong> North Pacific <strong>and</strong> North Atlantic.<br />
Worldwide, ship sulphur emissions rival <strong>the</strong> sulphur emissions of <strong>the</strong> world's largest<br />
economies, resulting in staggering proportions when compared to sulphur generated<br />
on l<strong>and</strong>. Total worldwide ship sulphur emissions equals 43 percent of <strong>the</strong> sulphur<br />
produced by <strong>the</strong> US <strong>and</strong> 53 percent of that produced by OECD Europe. Researchers<br />
conclude that ship emissions are a critical <strong>and</strong> overlooked element in <strong>the</strong> global<br />
climate change debate <strong>and</strong> in emissions modelling.<br />
Adding to <strong>the</strong>se concerns, to <strong>the</strong> results from <strong>the</strong> Indian Ocean Experiment in 1998-<br />
1999 suggest that aerosol emissions from ships, power plants <strong>and</strong> industrial sources<br />
may be trapping solar heat by "burning away" clouds through emissions of sulphates,<br />
nitrates, soot <strong>and</strong> ash. Such an effect would increase global warming through loss of<br />
heat-reflecting cloud cover."<br />
Research published in 2007 claimed 60,000 people died each year as <strong>the</strong> result of<br />
ships' high levels of sulphate emissions.<br />
Information put out by <strong>the</strong> service, whose centrepiece is <strong>the</strong> website 53 , stresses <strong>the</strong><br />
benefits brought by container shipping, particularly <strong>the</strong> sharp reduction in global<br />
transport costs achieved by <strong>the</strong> industry.<br />
The service marks an unusual foray into <strong>the</strong> public arena by a group of senior<br />
executives at <strong>the</strong> world's 24 largest container carriers. Many of its members,<br />
particularly <strong>the</strong> many family controlled lines, are normally publicity-shy.<br />
The shipping lines reject criticism of <strong>the</strong>ir environmental record, saying large, modern<br />
container ships create far fewer emissions moving a tonne of cargo for a given<br />
distance than any o<strong>the</strong>r means of transport. Most lines have also reduced <strong>the</strong> speed of<br />
<strong>the</strong>ir ships in recent months, <strong>the</strong>y point out. The move, intended to lower consumption<br />
of expensive fuel, has reduced carbon emissions.<br />
Emissions from some shipping lines ships were down 35 per cent following a<br />
reduction in <strong>the</strong>ir average speed from 24 to 20 knots, even after taking into account<br />
<strong>the</strong> emissions produced by <strong>the</strong> extra ship needed to maintain weekly services with <strong>the</strong><br />
slower speeds.<br />
However, like o<strong>the</strong>r debates about <strong>the</strong> impact of transport on <strong>the</strong> environment <strong>the</strong>re<br />
are different claims. Some claim container shipping is <strong>the</strong> most environmentally<br />
52 http://www.earthscape.org/p1/bwn01/<br />
53 www.ships<strong>and</strong>boxes.com<br />
60
sound way to transport large volumes of goods across <strong>the</strong> world. Ninety percent of <strong>the</strong><br />
world’s manufactured goods <strong>and</strong> products travel by container ships <strong>and</strong> which has<br />
doubled in 25 years, but when this fact is considered, <strong>the</strong> relative impact upon <strong>the</strong><br />
environment is low in comparison to o<strong>the</strong>r modes of transport.<br />
For example, for every kilometre that a container ship carries a ton of cargo, it is far<br />
more energy efficient <strong>and</strong> emits much less in <strong>the</strong> way of harmful CO 2 emissions than<br />
any o<strong>the</strong>r type of freight transport, including airplanes, trucks <strong>and</strong> trains. It is<br />
estimated that on average a container ship emits around 40 times less CO 2 than a large<br />
freight aircraft <strong>and</strong> over three times less than a heavy truck. Container shipping is also<br />
estimated to be two <strong>and</strong> a half times more energy efficient than rail <strong>and</strong> 7 times more<br />
so than road.<br />
Even so, <strong>the</strong> industry recognises it cannot rest on its laurels. It is by definition a large<br />
industry <strong>and</strong> of course it does have an impact on <strong>the</strong> world around it. Container<br />
shipping companies are <strong>the</strong>refore working hard, alongside environmental agencies<br />
<strong>and</strong> governments, to minimise all impacts upon <strong>the</strong> environment.<br />
For example, all member lines of CSIS work with, or are full members of, <strong>the</strong> Clean<br />
Cargo Working Group <strong>and</strong> <strong>the</strong> World Shipping Council. The Clean Cargo Working<br />
Group, set up by Business for Social Responsibility, develops voluntary guidelines<br />
<strong>and</strong> metrics aimed at improving freight transport’s performance in environmental<br />
sustainability. By taking a cooperative, pan-industry approach, <strong>the</strong> group helps to<br />
promote environmental stewardship <strong>and</strong> sustainability in a competitive market.<br />
Working with legislators, appropriate government agencies <strong>and</strong> international<br />
organisations, <strong>the</strong> World Shipping Council focuses specifically on <strong>the</strong> areas of vessel<br />
air emissions, ballast water management, <strong>and</strong> <strong>the</strong> protection of North Atlantic Right<br />
Whales <strong>and</strong> coral reefs.<br />
As well as industry regulations <strong>and</strong> voluntary codes of conduct, <strong>the</strong>re are a great many<br />
environmentally-focused design features specifically built into containers <strong>and</strong> <strong>the</strong><br />
ships that carry <strong>the</strong>m. For example:<br />
<br />
<br />
<br />
<br />
<br />
<br />
<br />
It is now possible to recycle 98% of most container ships<br />
Containers are made of steel <strong>and</strong> are 100% recyclable<br />
If <strong>the</strong>y are not recycled to make new steel products <strong>the</strong>y often become ‘static’<br />
containers which can have charitable uses, such as schools in developing<br />
countries, or use as storage<br />
Many container shipping lines take steps to ensure that <strong>the</strong>ir ships travel at <strong>the</strong><br />
optimum speed for efficient fuel consumption<br />
Developments in hull <strong>and</strong> propeller design continue to improve fuel<br />
efficiency <strong>and</strong> reduce emissions – in fact a container ship now typically emits<br />
about a quarter of <strong>the</strong> CO 2 it did in <strong>the</strong> 1970s as well as carrying up to ten<br />
times as many containers<br />
Use of lower sulphur fuels is increasing <strong>and</strong> maximum sulphur content<br />
allowed in marine heavy fuel is now limited to 4.5 per cent, or as low as 1.5<br />
per cent in some areas<br />
All fuel is cleaned by filters <strong>and</strong> purifiers on board before use to help produce<br />
cleaner emissions<br />
61
The majority of container shipping lines have replaced tin-based ‘antifouling’<br />
paint on ship hulls with a more environmentally-friendly alternative<br />
New paints that keep hulls free of barnacles <strong>and</strong> o<strong>the</strong>r sea life offer energy<br />
efficiencies of around 10 per cent<br />
Fur<strong>the</strong>rmore, container shipping companies have risk management plans,<br />
environmental policies <strong>and</strong> trained staff available so <strong>the</strong>y can anticipate <strong>and</strong> avoid, or<br />
react to, environmental issues or crises.<br />
So through this mix of regulation, voluntary codes of conduct <strong>and</strong> from<br />
environmentally-aware design to operation, <strong>the</strong> container shipping industry is<br />
reducing its impact on our environment.<br />
However, o<strong>the</strong>rs in <strong>the</strong> shipping industry argue that <strong>the</strong> 90,000 ships that ply <strong>the</strong><br />
world's oceans emit carbon dioxide at a level twice that of aviation.<br />
A report prepared by Intertanko, which represents <strong>the</strong> majority of <strong>the</strong> world's tanker<br />
operators, says emissions have risen sharply in <strong>the</strong> past six years.<br />
Previous International Maritime Organisation estimates suggested levels were<br />
comparable with those of aeroplanes.<br />
Intertanko says its figures are <strong>the</strong> most realistic estimation of <strong>the</strong> current levels of CO 2<br />
from ships.<br />
Its estimate suggests that <strong>the</strong> world's shipping uses between 350 <strong>and</strong> 410 million<br />
tonnes of fuel each year, which equates to up to 1.2 billion tonnes of carbon dioxide<br />
emissions.<br />
Intertanko says that growth in global trade coupled with ships burning more fuel to<br />
deliver freight faster has contributed significantly to <strong>the</strong> increase.<br />
Dragos Routa, <strong>the</strong> technical director of Intertanko, told <strong>the</strong> BBC in October 2007 that<br />
<strong>the</strong> figures were a work in progress but <strong>the</strong> levels of emissions had risen sharply.<br />
While <strong>the</strong>re are few accurate measures <strong>and</strong> even fewer restrictions on <strong>the</strong> amounts of<br />
carbon dioxide that ships can emit at present, governments in many parts of <strong>the</strong> world<br />
are considering a clampdown as part of <strong>the</strong>ir efforts to tackle global warming.<br />
But Mr Routa argued that <strong>the</strong> much greater tonnage carried by each vessel, compared<br />
with aircraft, meant that shipping was still a much greener form of transporting freight<br />
around <strong>the</strong> globe.<br />
Figures from <strong>the</strong> oil giant BP, which owns 50 tankers, <strong>and</strong> researchers at <strong>the</strong> Institute<br />
for Physics <strong>and</strong> Atmosphere in Wessling, Germany reveal that annual emissions from<br />
shipping range between 600 <strong>and</strong> 800m tonnes of carbon dioxide, or up to 5 per cent of<br />
<strong>the</strong> global total. This is nearly double Britain's total emissions <strong>and</strong> more than all<br />
African countries combined.<br />
62
Carbon dioxide emissions from ships do not come under <strong>the</strong> Kyoto agreement or any<br />
proposed European legislation <strong>and</strong> few studies have been made of <strong>the</strong>m, even though<br />
<strong>the</strong>y are set to increase.<br />
Aviation carbon dioxide emissions, estimated to be about 2 per cent of <strong>the</strong> global<br />
total, have been at <strong>the</strong> forefront of <strong>the</strong> climate change debate because of <strong>the</strong> sharp<br />
increase in cheap flights, whereas shipping emissions have risen nearly as fast in <strong>the</strong><br />
past 20 years but have been largely ignored by governments <strong>and</strong> environmental<br />
groups.<br />
In 2007 Donald Gregory, director of environment at BP Marine, said that BP<br />
estimates that <strong>the</strong> global fleet of 70,000 ships uses approximately 200m tonnes of fuel<br />
a year <strong>and</strong> this is expected to grow to 350m tonnes a year by 2020. "We estimate<br />
carbon dioxide emissions from shipping to be 4% of <strong>the</strong> global total. Ships are getting<br />
bigger <strong>and</strong> every shipyard in <strong>the</strong> world has a full order book. There are about 20,000<br />
new ships on order" he said 54 .<br />
The estimate supports o<strong>the</strong>r academic studies which, until now, have been dismissed<br />
as "extreme", because <strong>the</strong> industry fears that emissions regulations will be forced on it<br />
if it is not seen to be addressing <strong>the</strong> issue.<br />
Dr Veronika Eyring, a researcher at <strong>the</strong> Institute of Physics <strong>and</strong> Atmosphere,<br />
calculates that <strong>the</strong> global fleet used 280m tonnes of fuel in 2001 <strong>and</strong> that could reach<br />
400m tonnes by 2020.<br />
Government actions – by encouraging modal shift has <strong>the</strong> avowed aim of increasing<br />
<strong>the</strong> volume of goods carried by sea, especially short-sea-shipping (based on a<br />
recognition that <strong>the</strong> industry is <strong>the</strong> best alternative in terms of CO 2 output), which will<br />
inevitably increase total carbon emissions from ships; similarly, delays in port<br />
development approvals (perhaps on o<strong>the</strong>r environmental grounds) can increase CO 2<br />
emissions as ships waste fuel while waiting for berths.<br />
It also has to be remembered that shipping is one of <strong>the</strong> most regulated industries,<br />
particularly in <strong>the</strong> area of environmental protection. The International Convention for<br />
<strong>the</strong> Prevention of Pollution from Ships was first introduced over 30 years ago <strong>and</strong> its<br />
provisions are regularly updated. The industry has done much to improve its<br />
environmental performance – <strong>and</strong> of course producing less CO 2 means burning less<br />
fuel so <strong>the</strong>re is also a major financial incentive for <strong>the</strong> shippers to reduce <strong>the</strong>ir outputs<br />
of CO 2 !<br />
To summaries <strong>the</strong> situation in <strong>the</strong> long-term shipping will have a warming impact on<br />
<strong>the</strong> climate due to CO 2 emissions. But <strong>the</strong>re is a short-term cooling effect from SO 2<br />
emissions, but this will diminish as <strong>the</strong> sulphur content of fuel is reduced.<br />
Tank <strong>and</strong> bulk vessels <strong>the</strong> largest fuel consumer at roughly 135Mt in 2007, <strong>and</strong><br />
containers consumed around 80Mt. According to <strong>the</strong> Committee on Climate Change if<br />
global shipping is left unconstrained it could grow from roughly 3.5 per cent of total<br />
54 The Guardian Saturday March 3 2007<br />
63
CO 2 emissions in 2007 to 15 per cent – 30 per cent of all CO 2 emissions permitted in<br />
2050. Unless <strong>the</strong>re is a reduction in greenhouse gases even with high carbon prices,<br />
€200 a tonne, global shipping emissions would still be 2GtCO 2 in 2050 – this would<br />
be double today’s levels.<br />
4.8 What can shipping lines do?<br />
Emissions Trading Scheme<br />
Current Industry Position: International Shipping <strong>and</strong> World Trade<br />
Commitment to reducing <strong>the</strong> impact off shipping<br />
Shipping - <strong>the</strong> irreplaceable engine off world trade<br />
Shipping - <strong>the</strong> greenest transport mode<br />
Strive to improve fuel efficiency<br />
Due to <strong>the</strong> complexities of <strong>the</strong> shipping industry, this sector is one where a global<br />
sector deal on emissions is a priority, but in <strong>the</strong> absence of a global deal EU action is<br />
still a 2nd best solution. The focus on international shipping should be towards getting<br />
a global agreement to reduce emissions from this sector. However, shipping should be<br />
in EU ETS by 2012 if IMO fails to act<br />
Even <strong>the</strong> sensible allocations at <strong>the</strong> UK level produce a fairly wide range for UK<br />
shipping emissions e.g. in 2000 (Source: Entec)<br />
Ships’ Power How Can we Reduce or Offset Pollution?<br />
o Legislation-Driven: Low-sulphur fuels: IMO North Sea SECA <strong>and</strong> EU<br />
Directives: >1.0% sulphur now <strong>and</strong> >0.1% sulphur by 1st January 2010;<br />
o Economically-Driven: Lower-speed running – but “shipping lines” may<br />
require additional tonnage to maintain delivery rates;<br />
o Vessel Speed Reduction (VSR)<br />
Voluntary program in which ships slow to 12 knots within 20 nautical<br />
miles of <strong>the</strong> port<br />
High success rate in San Pedro Bay since 2001<br />
VSR boundary may be extended to 40 nm<br />
Effective regional strategy, but may actually increase global emissions<br />
Design-Driven: Reducing CO 2 production: Match low sulphur MGO<br />
harbour generator capacity to harbour load: B<br />
Better matching <strong>and</strong> advances in engine technology is bringing lower<br />
PM10s, HCs <strong>and</strong> NOx<br />
But <strong>the</strong>re is room for improvement <strong>and</strong> innovation in design:<br />
In <strong>the</strong> past smokestacks billowing soot was acceptable but not today. Exhaust<br />
scrubber technologies – trialled but not yet widely commercially available maybe a<br />
future technology to deal with this problem.<br />
What are <strong>the</strong> basics for a sea water scrubber?<br />
Function - Exhaust contains pollutants of NOx, SOx, Particulates.<br />
Scrubbing systems remove Sox <strong>and</strong> Particulates.<br />
64
Exhaust – water absorbs <strong>and</strong> neutralises SOx <strong>and</strong> traps particulate.<br />
System operates with a low back pressure discharging clean dry gas.<br />
Water – scrubber discharge flows to a treatment plant in <strong>the</strong> engine<br />
room. Clean water is discharged to <strong>the</strong> ocean exceeding IMO guideline<br />
requirements.<br />
Waste – Particulates are removed from scrubber water <strong>and</strong> can be<br />
discharged into <strong>the</strong> existing oily waste tank.<br />
Monitoring – <strong>the</strong> system has secure marine approved monitoring <strong>and</strong><br />
data storage for both exhaust <strong>and</strong> water discharge.<br />
65
5 Passenger Services Trade Group: Towards <strong>Sustainable</strong> <strong>Transport</strong><br />
5.1 Introduction <strong>and</strong> Overview of <strong>the</strong> Sector<br />
The T&G section of <strong>Unite</strong> <strong>the</strong> <strong>Union</strong>’s current membership in <strong>the</strong> Passenger Services<br />
Trade Group, toge<strong>the</strong>r with our membership in o<strong>the</strong>r trade groups, such as supervisory<br />
<strong>and</strong> administrative grades, <strong>and</strong> some maintenance engineering members, well exceeds<br />
100,000. The Passenger Services Trade Group represents workers in all areas of<br />
passenger services including bus, coach, taxi, <strong>and</strong> tram <strong>and</strong> rail workers in 150 large<br />
local companies. The Passenger Services Trade Group of <strong>the</strong> T&G section of <strong>Unite</strong> is<br />
<strong>the</strong> largest trade union representing drivers, engineers, admin staff, inspectors <strong>and</strong><br />
managers employed in <strong>the</strong> UK transport industry, with over 96 per cent of <strong>the</strong><br />
organised workers in <strong>the</strong> sector in <strong>Unite</strong>.<br />
All forms of public transport have a vital role to play in providing an efficient,<br />
affordable <strong>and</strong> sustainable transport system. The Passenger Services Trade Group in<br />
particular containing so many different modes of transport has a leading role to play<br />
in shaping <strong>the</strong> type of sustainable transport system that will benefit <strong>the</strong> transport<br />
workers that deliver it, <strong>the</strong> public that travel on it <strong>and</strong> <strong>the</strong> wider society that are<br />
affected by its environmental fallout. There is no conflict between <strong>the</strong> role <strong>Unite</strong> plays<br />
in <strong>the</strong> workplaces delivering public transport <strong>and</strong> <strong>the</strong> role it plays in wider civil<br />
society. For <strong>the</strong> two million working members <strong>and</strong> retired members that <strong>Unite</strong><br />
represents, toge<strong>the</strong>r with <strong>the</strong>ir immediate families, <strong>Unite</strong> represents a<br />
disproportionately large segment of <strong>the</strong> travelling public.<br />
In recent years we have seen a concerted effort to improve Greenhouse Gas Emissions<br />
(GGE) by <strong>the</strong> transport sector with new technology <strong>and</strong> policy options being<br />
introduced. These actions are having an impact but <strong>the</strong>re is no magic cure. It’s a<br />
continual fight <strong>and</strong> with UK population projected to be 71 million in 2031, 55 from just<br />
under 61 million in mid 2007, 56 <strong>the</strong> strain on UK transport will only increase along<br />
with GGE, unless we do all we can now to manage <strong>the</strong> impacts better, as well as<br />
protecting <strong>and</strong> streng<strong>the</strong>ning local economies.<br />
According to <strong>the</strong> Labour Force Survey at least a minimum of 25 per cent of bus <strong>and</strong><br />
coaches drivers work over 48 hours a week. 57 From <strong>the</strong> union’s experiences drivers<br />
<strong>and</strong> <strong>the</strong> support staff working for public transport operators are working closing to 50-<br />
60 hours a week, 58 desperately trying to make a living so <strong>the</strong>y can take care of <strong>the</strong>ir<br />
families, who <strong>the</strong>y never get to see. Pressure to drive long hours to make a decent<br />
living is dangerous for <strong>the</strong> drivers <strong>and</strong> <strong>the</strong>ir passengers. In addition, drivers <strong>and</strong><br />
engineering staff in particular are exposed to GGE <strong>and</strong> o<strong>the</strong>r particles, which can<br />
potentially cause a number of ill-health, even sometimes fatal, conditions in <strong>the</strong> short<br />
<strong>and</strong> medium term. At a wider level CO2 is <strong>the</strong> main cause of global warming. The<br />
World Health Organization estimates that global warming will contribute to more<br />
than 300,000 deaths <strong>and</strong> 10m illnesses each year by 2030. 59 <strong>Transport</strong> workers are a<br />
group that is disproportionately at risk.<br />
55 www.statistics.gov.uk/cci/nugget.asp?id=1352<br />
56 www.statistics.gov.uk/CCI/nugget.asp?ID=6&Pos=6&ColRank=1&Rank=128<br />
57 Labour Force Survey Jan-Mar 2008<br />
58 www.wrp.org.uk/news/3535<br />
59 http://74.125.77.132/search?q=cache:BSae12pS_IcJ:www.cdproject.net/admin/attachedfiles/Res<br />
ponses/42421/963/CDP5_ABSA_AQ.doc+greenhouse+gas+emissions+illnesses&hl=en&ct=clnk&<br />
cd=10&gl=uk<br />
66
Drivers <strong>and</strong> transport workers are in <strong>the</strong> front line <strong>and</strong> are suffering bone or muscle<br />
pains (especially back), headaches, frequent tiredness, swollen or upset stomach,<br />
shortness of breath, numbed or tingling limbs, dizziness, difficulty in sleeping, high<br />
blood pressure, occasional pain in <strong>the</strong> chest or heart area, mental overload. 60 Scores<br />
of valid medical studies across <strong>the</strong> globe over <strong>the</strong> past two decades have more than<br />
adequately established that <strong>the</strong> very process of h<strong>and</strong>ling <strong>the</strong> complex tasks of driving<br />
human `cargo’ safely contributes excessively to <strong>the</strong> generation of stress-related<br />
conditions, most especially in busy <strong>and</strong> congested city conditions. So it is vital that in<br />
any proposed strategy for developing a sustainable transport system has <strong>the</strong> health <strong>and</strong><br />
safety of <strong>the</strong> professional drivers <strong>and</strong> transport workers at <strong>the</strong> centre of any future<br />
plans.<br />
In order to achieve a sustainable transport system we must challenge our obsession of<br />
designing our working cities around <strong>the</strong> car <strong>and</strong> instead give priority to public<br />
transport, bike or foot where it is possible to do so, like it has been in <strong>the</strong> city of<br />
Amsterdam for example. In addition we must look at making public transport<br />
sustainable for all including disabled people, pensioners, shift workers <strong>and</strong> part time<br />
workers. They all have different needs <strong>and</strong> for transport to be truly sustainable, we<br />
must compensate for those needs. For example easier access on <strong>and</strong> off for disabled<br />
people, free travel for pensioners encouraging use of public transport, as well as rural<br />
transport options so pensioners can travel where <strong>the</strong>y want to, more preferential rates<br />
for part-time workers who are travelling at off peak times <strong>and</strong> more travel options for<br />
shift workers who are travelling outside <strong>the</strong> traditional 9-5 working hours.<br />
5.2 Climate Change – Greenhouse Gas Emissions (GGE)<br />
<strong>Transport</strong> Sector<br />
So, one of <strong>the</strong> obvious challenges in trying to deliver a sustainable transport system is<br />
to get people out of <strong>the</strong>ir cars <strong>and</strong> into mass public transport modes instead. We share<br />
<strong>the</strong> widely-held satisfaction with <strong>the</strong> massive growth of use of <strong>the</strong> mainline railways<br />
but <strong>the</strong> plain truth is that <strong>the</strong> major competitor to all public transport modes is<br />
indiscriminate use of <strong>the</strong> private car. The failure of bus <strong>and</strong> coach deregulation <strong>and</strong><br />
privatisation, <strong>and</strong> <strong>the</strong> pressure to fur<strong>the</strong>r deregulate taxi provision, to massively<br />
exp<strong>and</strong> ridership of road passenger transport vehicles of all kinds has adversely<br />
affected any aims to address this imbalance. In most cases, <strong>the</strong> growth of regional <strong>and</strong><br />
inter-city railway travel has been important in challenging <strong>the</strong> use of motor cars on<br />
motorways for long-distance commuting, which has risen astronomically with <strong>the</strong><br />
shift of employment away from manufacturing to service industries <strong>and</strong> people having<br />
to travel longer distances to find work as traditional local economies collapse under<br />
<strong>the</strong> strain of globalisation.<br />
In this context, little attention has been given to <strong>the</strong> re-regulation <strong>and</strong> expansion of <strong>the</strong><br />
role of inter-city coach travel <strong>and</strong> this will be an increasingly important part of our<br />
work. The once much-vaunted expansion of <strong>the</strong> tram <strong>and</strong> rapid transit sector has not<br />
materialised, largely due to an aversion to <strong>the</strong> high public sector infrastructure<br />
investment required. In fact, shorter-distance travel has seen <strong>the</strong> motor car replacing<br />
<strong>the</strong> key role that public transport once played in daily travel. It is now becoming a<br />
commonplace observation that <strong>the</strong> market does not make decisions on <strong>the</strong> basis of<br />
logic <strong>and</strong> is not an all-seeing perfect instrument. Self-evidently, <strong>the</strong> view that <strong>the</strong> state<br />
60 www.itfglobal.org/road-transport/busalert.cfm<br />
67
has an important part to play in ensuring that <strong>the</strong> blindness of <strong>the</strong> market is addressed.<br />
The unrestrained market has led to a massive deterioration of both public transport<br />
provision <strong>and</strong> <strong>the</strong> quality of <strong>the</strong> jobs of public transport workers. This is not merely a<br />
problem for those workers but should be a concern for all. There can be a solution but<br />
it will require strength of conviction on <strong>the</strong> part of politicians to usher in a genuine<br />
new deal that would be a plan to boost <strong>the</strong> widest range of public transport provision<br />
that would enable benefits from <strong>the</strong> possible economies of scale savings in potential<br />
GGE.<br />
Whilst <strong>the</strong> transport sectors level of GGE has been going up, o<strong>the</strong>r sectors of <strong>the</strong> UK<br />
economy have seen GGE fall to 78 per cent in 2006 from 84.9 per cent in 2000, which<br />
is a real terms fall of 84,579 thous<strong>and</strong> tonnes of CO 2 equivalent. 61 Since deregulation,<br />
it is underst<strong>and</strong>able that <strong>the</strong> UK public transport sector has seen a rise in GGE. Bus<br />
deregulation saw passenger levels plummet <strong>and</strong> fares rocketed. For example in South<br />
Yorkshire fares rose by 750 per cent <strong>and</strong> passenger levels halved. Less profitable<br />
routes <strong>and</strong> times (including night services) were taken out of service so overcrowding<br />
increased. On more profitable routes <strong>the</strong>re was increased waste through competing<br />
companies all running <strong>the</strong> same service. A similar story happened in Tyneside where<br />
<strong>the</strong> metro, tram <strong>and</strong> buses were integrated <strong>and</strong> publicly owned until deregulation.<br />
Now <strong>the</strong>y all overlap <strong>and</strong> <strong>the</strong>re isn’t an integrated service. In essence what has<br />
happened shows that rational integrated transport systems are in fact natural<br />
monopolies <strong>and</strong> competition doesn’t work for workers, for passengers, or indeed for<br />
<strong>the</strong> environment, which suffers as passengers are forced to ei<strong>the</strong>r stay home or rely on<br />
private cars.<br />
So, <strong>the</strong> public transport sector clearly needs to go beyond merely getting more people<br />
out of <strong>the</strong>ir cars <strong>and</strong> into public transport. It has to find new ways of meeting its<br />
sustainable challenges. For us, it is natural that we should first <strong>and</strong> foremost consider<br />
that this means improvements in terms <strong>and</strong> conditions for drivers <strong>and</strong> transport<br />
workers. Our main point in existing is, after all to promote <strong>the</strong> well-being of our<br />
members. Moreover, it is our contention that an improved working life for public<br />
transport workers will flow through into wider benefits for all <strong>and</strong> that questions of<br />
sustainability go beyond simple questions of direct environmental gains. Reductions<br />
in <strong>the</strong> amount of GGE omitted by transport vehicles <strong>and</strong> a lifting in <strong>the</strong> st<strong>and</strong>ards<br />
required are intimately linked to <strong>the</strong> need for a cultural shift from personal to mass<br />
forms of public transport. Making this <strong>the</strong> viable option requires that an integrated<br />
transport system is in place.<br />
So <strong>the</strong> key areas are a shift from private to public transport, better working conditions<br />
(in terms of pay, driving/working hours <strong>and</strong> rest periods as well as actual physical<br />
working conditions in drivers cabs/cabins <strong>and</strong> garages), improved travelling<br />
conditions <strong>and</strong> greener forms of transport.<br />
Buses <strong>and</strong> Coaches<br />
We will start by looking at buses <strong>and</strong> coaches in regards to <strong>the</strong>ir contribution to <strong>the</strong><br />
total GGE in <strong>the</strong> UK in comparison to <strong>the</strong> transport sector total contribution. Between<br />
1990 <strong>and</strong> 2006, GGE from bus <strong>and</strong> coaches increased from 0.6 per cent of total GGE<br />
61 www.statistics.gov.uk/statbase/Expodata/Spreadsheets/D5695.xls<br />
68
to 0.8 per cent. During <strong>the</strong> same period, total GGE from <strong>the</strong> transport sector increased<br />
from 7.75 per cent to 12.8 per cent. So, it is clear to see that buses <strong>and</strong> coaches make<br />
up only a small amount of <strong>the</strong> total GGE in <strong>the</strong> UK <strong>and</strong> that has only increased<br />
marginally in <strong>the</strong> last 17 years. 62<br />
Percentage of <strong>the</strong> Total Greenhouse Gas Emissions in <strong>the</strong> UK 1990 - 2006<br />
15<br />
14<br />
13<br />
12<br />
11<br />
10<br />
9<br />
%<br />
8<br />
7<br />
6<br />
5<br />
4<br />
3<br />
2<br />
1<br />
0<br />
1990 1995 2000 2005<br />
Year<br />
<strong>Transport</strong> Sector<br />
Buses & Coaches<br />
Figure 5.1: Percentage of Total Greenhouse Gas Emissions in UK 1990 - 2006<br />
In real terms buses <strong>and</strong> coaches total GGE has increased from 5,052 thous<strong>and</strong> tonnes<br />
of CO 2 equivalent in 1990 to 5,655 in 2006, an increase of 11.9%. Whereas <strong>the</strong><br />
transport sector total GGE has increased from 62,753 thous<strong>and</strong> tonnes of CO 2<br />
equivalent in 1990 to 92,869 in 2006, an increase of 48 per cent. So buses <strong>and</strong><br />
coaches GGE impact has been increasing at a slower rate in comparison to <strong>the</strong> overall<br />
transport sector, which itself has seen a marked increase. 63<br />
EA Economic Sector 1990 2000 2001 2002 2003 2004 2005 2006<br />
Code<br />
Buses & coaches as a % of 0.6% 0.6% 0.6% 0.7% 0.7% 0.6% 0.7% 0.8%<br />
total UK emissions<br />
<strong>Transport</strong> sector as a % of<br />
total UK emissions<br />
7.75% 11.3% 11.8% 12.2% 12.5% 13.2% 13.5% 12.8%<br />
Table 5.1: Buses <strong>and</strong> coaches <strong>and</strong> <strong>the</strong>ir contribution to <strong>the</strong> total GGE<br />
62 www.statistics.gov.uk/statbase/Expodata/Spreadsheets/D5695.xls<br />
63 www.statistics.gov.uk/statbase/Expodata/Spreadsheets/D5695.xls<br />
69
Total Greenhouse Gases by Buses & Coaches 1990 - 2006<br />
thous<strong>and</strong> tonnes of carbon dioxide equivalent<br />
7000<br />
6000<br />
5000<br />
4000<br />
3000<br />
2000<br />
1000<br />
0<br />
1990 1995 2000 2005<br />
Year<br />
Figure 5.2: Total Greenhouse Gases by Buses <strong>and</strong> Coaches 1990 -2006<br />
In 2006 bus <strong>and</strong> coaches accounted for 6.1% of <strong>the</strong> total GGE of <strong>the</strong> transport sector,<br />
while in 1990 it accounted for 8 per cent of <strong>the</strong> total GGE of <strong>the</strong> transport sector. So<br />
<strong>the</strong> contribution of buses <strong>and</strong> coaches to <strong>the</strong> transport sector total GGE has decreased<br />
by 1.9%. 64<br />
EA Economic Sector 1990 2000 2001 2002 2003 2004 2005 2006<br />
Code<br />
64 Buses <strong>and</strong> coaches 5052 4662 4408 4889 4935 4774 5377 5655<br />
Total transport industry 62763 83167 87542 88158 91515 96727 99537 92869<br />
% of total UK transport<br />
emissions<br />
8.0% 5.6% 5.0% 5.5% 5.4% 4.9% 5.4% 6.1%<br />
Table 5.2: Buses <strong>and</strong> coaches <strong>and</strong> <strong>the</strong>ir contribution to <strong>the</strong> total GGE for <strong>the</strong><br />
<strong>Transport</strong> Industry<br />
Clearly, it can be seen that buses <strong>and</strong> coaches are not <strong>the</strong> main GGE perpetrator in <strong>the</strong><br />
UK transport sector. In fact, when some people take a bus or a coach ra<strong>the</strong>r than drive<br />
in individual cars, we can all benefit from cleaner air. You may hear people complain<br />
about <strong>the</strong> exhausts that buses <strong>and</strong> coaches produce. But from <strong>the</strong> perspective of <strong>the</strong><br />
community as a whole, <strong>the</strong> real issue is <strong>the</strong> per-mile difference in emissions between<br />
bus <strong>and</strong> coach travel <strong>and</strong> car travel. A bus <strong>and</strong> a coach do produce more exhaust than<br />
a car, but it also transports more people. In net terms, bus <strong>and</strong> coach travel reduces air<br />
pollution. Although, as an aside, we would note that it is our perception that <strong>the</strong> anticollective<br />
nature of ownership of public transport provision directly collides with its<br />
ostensible collective role. It is our experience that, in general <strong>and</strong> with honourable<br />
exceptions, many operators place a low priority on <strong>the</strong> costs of quality maintenance of<br />
both <strong>the</strong>ir vehicles <strong>and</strong> <strong>the</strong>ir staff.<br />
64 www.statistics.gov.uk/statbase/Expodata/Spreadsheets/D5695.xls<br />
70
Bus traffic in particular currently releases lower levels of emissions per passenger<br />
kilometre than car traffic. A well used bus service will omit 45-80 grams of CO 2 per<br />
passenger kilometre. Compared with an average car which releases 145-260 grams of<br />
CO 2 per kilometre for <strong>the</strong> average car carrying one person. 65 However we do<br />
acknowledge that for some journeys personal transport is more appropriate than a<br />
common carrier, especially in a deep rural area.<br />
Coaches are in fact <strong>the</strong> lowest emissions way of travelling between cities 66 , <strong>and</strong> unlike<br />
o<strong>the</strong>r transport systems (trains, planes) could be quickly exp<strong>and</strong>ed without massive<br />
infrastructural investment being needed. As with city buses, deregulation in <strong>the</strong> early<br />
1980s meant many of <strong>the</strong> less profitable routes being cut. Therefore, many<br />
environmentalists see improving coach services as vital (which would require<br />
integration, through ticketing <strong>and</strong> re-regulation). For passengers, one of <strong>the</strong> main<br />
drawbacks of coach travel has always been <strong>the</strong> time spent crossing <strong>the</strong> towns <strong>and</strong><br />
cities. To address this problem, George Monbiot, <strong>the</strong> environmentalist, has strongly<br />
advocated coach ‘hubs’ at motorway junctions on <strong>the</strong> edge of cities, which are<br />
accessible by improved city transport. 67<br />
In addition, when some people take a bus or a coach ra<strong>the</strong>r than drive in individual<br />
cars, we all benefit from a reduced dem<strong>and</strong> for parking. Of course <strong>the</strong>re’s money to be<br />
saved for every parking space that employers don’t have to build or maintain, but<br />
<strong>the</strong>re are also important environmental benefits to not building parking, too. By not<br />
building parking, we reduce <strong>the</strong> rate at which l<strong>and</strong> surrounding <strong>the</strong> urban area is<br />
gobbled up, <strong>and</strong> we refrain from putting additional stress on local waterways with<br />
more storm runoff.<br />
It is worth our making <strong>the</strong> incidental, yet vitally important point here, that <strong>the</strong> T&G<br />
section of <strong>Unite</strong> has long advocated <strong>the</strong> `hypo<strong>the</strong>cation’, or dedicated use, of special<br />
taxes to fund <strong>the</strong> provision of a massively exp<strong>and</strong>ed public transport provision. But<br />
we have also long resisted <strong>the</strong> bl<strong>and</strong>ishments of those who advocate road pricing, road<br />
user charging, toll roads <strong>and</strong> o<strong>the</strong>r forms of taxation.<br />
Road pricing is <strong>the</strong> direct charges applied for <strong>the</strong> use of roads. These road charges<br />
includes fuel taxes, licence fees, parking taxes, tolls, <strong>and</strong> congestion charges,<br />
including those which may vary by time of day, by <strong>the</strong> specific road, or by <strong>the</strong><br />
specific vehicle type, being used. Road pricing has two distinct objectives: revenue<br />
generation, usually for road infrastructure financing, <strong>and</strong> congestion pricing for<br />
dem<strong>and</strong> management purposes. Toll roads are <strong>the</strong> typical example of revenue<br />
generation. Charges for using high-occupancy toll lanes or urban tolls for entering a<br />
restricted area of a city are typical examples of using road pricing for congestion<br />
management purposes.<br />
Our main concern has been that such taxes are inevitably regressive in character,<br />
ensuring that <strong>the</strong> poorest in society pay disproportionately for <strong>the</strong>m. Whilst those with<br />
access to company funding, or who are <strong>the</strong>mselves pretty well-off, will merely pay<br />
<strong>the</strong> charge <strong>and</strong> motoring behaviour will not be affected, unless <strong>the</strong> charges are<br />
65 www.campaigncc.org/Howdoesairtravel.doc<br />
66 www.climnet.org/publicawareness/transport.html<br />
67 http://www.guardian.co.uk/commentisfree/2008/dec/02/climate-change-lord-turner<br />
71
enormously punitive but that would be politically difficult to steer through. Since <strong>the</strong><br />
avowed purpose of such charges is to do precisely this <strong>and</strong> to fund public transport<br />
alternatives, this would seem to negate <strong>the</strong> very point. Moreover, we are aware that<br />
existing road tax arrangements, not being hypo<strong>the</strong>cated have devalued public trust,<br />
whilst governments faced with declining revenues in, for example tobacco taxation,<br />
may simply relish <strong>the</strong> prospect of new means to tax <strong>the</strong> ordinary working person.<br />
We varied our long-st<strong>and</strong>ing opposition to road charging in <strong>the</strong> case of <strong>the</strong> London<br />
congestion charge, largely since <strong>the</strong>re was confidence in <strong>the</strong> objectives of <strong>the</strong> political<br />
force, in <strong>the</strong> shape of <strong>the</strong> London Mayor <strong>and</strong> Assembly, of <strong>the</strong> time. To some extent,<br />
this confidence was justified but times have changed in more ways than one. The<br />
recent experience of <strong>the</strong> referendum in Greater Manchester, which saw a massive<br />
rejection of <strong>the</strong> proposed congestion charge, suggests widespread suspicion as to <strong>the</strong><br />
aims of <strong>the</strong> government in respect of <strong>the</strong> <strong>Transport</strong> Infrastructure Fund.<br />
For <strong>Unite</strong>, this may raise <strong>the</strong> prospect of our campaigning harder for our existed, longst<strong>and</strong>ing<br />
policy alternative to road pricing - that of <strong>the</strong> payroll public transport levy.<br />
Such a tax has been successfully <strong>and</strong> widely used in France for <strong>the</strong> last quarter of a<br />
century to fund public transport. The conception is that businesses with more than 10<br />
employees have an obligation to pay wider society for <strong>the</strong>ir requirement for<br />
employees to travel to work. The bus, rail <strong>and</strong> metro system of Paris is almost entirely<br />
funded through such a payroll tax of 2.2 per cent on employment costs <strong>and</strong> this<br />
generates well over €2 billion a year with no obvious deleterious effect on<br />
employment having arisen. The fiscal effect of revenue generation of such a tax on<br />
<strong>the</strong> finance sector in City of London, had <strong>the</strong>re been one over <strong>the</strong> past 25 years, is<br />
easy to imagine.<br />
In France, <strong>the</strong> tax is set as a percentage of <strong>the</strong> total wage bill <strong>and</strong> is paid by <strong>the</strong><br />
employer. A cautious estimate of <strong>the</strong> application of such a tax in <strong>the</strong> UK is that some<br />
£15 billion – about seven times <strong>the</strong> current public expenditure on bus provision –<br />
could be raised if <strong>the</strong> tax were set at around 2.5%. To those who would be concerned<br />
that an employment-related tax is <strong>the</strong> last thing that is needed in a period of rising<br />
unemployment <strong>and</strong> recession, a public transport payroll tax could be offset, or allied<br />
to, Corporation Tax, which is already extraordinarily low. Moreover, <strong>the</strong> notion that<br />
businesses (especially banks!) should be ready to pay back something to <strong>the</strong> wider<br />
taxpayer in <strong>the</strong> form of a demonstrable benefit for all, would surely be massively<br />
popular. It is suggested here that <strong>the</strong> Passenger Services Sector promote this T&G<br />
section of <strong>Unite</strong> policy so that it becomes <strong>the</strong> endorsed position of <strong>the</strong> whole of <strong>Unite</strong>.<br />
Only by making public transport a safe <strong>and</strong> comfortable alterative can we gain <strong>the</strong><br />
benefits of seeing people taking a bus or coach ra<strong>the</strong>r than drive in individual cars <strong>and</strong><br />
<strong>the</strong> resulting reduced congestion on <strong>the</strong> roads. The Department for <strong>Transport</strong> have<br />
forecast in <strong>the</strong> past that road traffic in <strong>the</strong> UK will increase by between 24 per cent<br />
<strong>and</strong> 51 per cent from 1996 to 2016. 68 So unless public transport plays a larger role in<br />
<strong>the</strong> way our community grows, drivers will spend more <strong>and</strong> more time sitting in <strong>the</strong>ir<br />
cars in <strong>the</strong> years to come, using more petrol, creating more exhaust fumes.<br />
68 www.dft.gov.uk/pgr/roads/environment/cvtf/<strong>the</strong>environmentalimpactsofroa3793?page=2`<br />
72
Beyond <strong>the</strong> inconvenience increased traffic congestion means for drivers <strong>and</strong> a certain<br />
economic wastefulness, it also creates an environment that is hostile to o<strong>the</strong>r means of<br />
transportation. As streets become more crowded with cars, <strong>the</strong>y become more<br />
dangerous for people who walk or bike, in effect creating pressure for <strong>the</strong>m to drive,<br />
too. Clearly, not everyone in our community is going to use a bus or coach service to<br />
get from place to place. But that does not make <strong>the</strong> benefits of a bus or coach service<br />
to <strong>the</strong> community any less real.<br />
Taxi Operations<br />
One important misconception to nail at <strong>the</strong> outset is that taxi transport is in some way<br />
merely an extension of private car transport. On <strong>the</strong> contrary, for us, like car sharing<br />
schemes, taxi transport is part of <strong>the</strong> solution not part of <strong>the</strong> problem. In many towns<br />
<strong>and</strong> cities private hire provision, a discrete segment of overall taxi operations, has<br />
actually replaced <strong>the</strong> former public transport provision of <strong>the</strong> former publicly-owned<br />
bus sector.<br />
As for <strong>the</strong> contribution of taxi provision to <strong>the</strong> total GGE in <strong>the</strong> UK in comparison to<br />
<strong>the</strong> transport sector total contribution, between 1990 <strong>and</strong> 2006, emissions from taxi<br />
operations increased from 0.20 per cent of total GGE to 0.34 per cent. During <strong>the</strong><br />
same period total GGE from <strong>the</strong> transport sector increased from 7.75 per cent to 12.8<br />
per cent. Taxi operations GGE are a minimal part of <strong>the</strong> overall UK GGE levels <strong>and</strong><br />
in <strong>the</strong> past 17 years <strong>the</strong>y have only increased marginally. 69<br />
EA Economic Sector 1990 2000 2001 2002 2003 2004 2005 2006<br />
Code<br />
Taxis operations as a % of 0.20% 0.31% 0.31% 0.32% 0.32% 0.32% 0.33% 0.34%<br />
total UK emissions<br />
<strong>Transport</strong> sector as a % of<br />
total UK emissions<br />
7.75% 11.3% 11.8% 12.2% 12.5% 13.2% 13.5% 12.8%<br />
Table 4.3: Taxi operations <strong>and</strong> <strong>the</strong>ir contribution to <strong>the</strong> total GGE<br />
In real terms, taxi operations total GGE has increased from 1,599 thous<strong>and</strong> tonnes of<br />
CO 2 equivalent in 1990 to 2,464 in 2006, an increase of 54.1 per cent. Whereas <strong>the</strong><br />
transport sector total GGE has increased from 62,753 thous<strong>and</strong> tonnes of CO 2<br />
equivalent in 1990 to 92,869 in 2006, an increase of 48 per cent. So taxi operations<br />
have increased at a greater rate in percentage terms in comparison to <strong>the</strong> overall<br />
transport sector which has also seen a marked increase. 70<br />
In 2006 taxi operations accounted for 2.7 per cent of <strong>the</strong> total GGE of <strong>the</strong> transport<br />
sector, while in 1990 it accounted for 2.5 per cent of <strong>the</strong> total GGE of <strong>the</strong> transport<br />
sector. So <strong>the</strong> contribution of taxi operations to <strong>the</strong> transport sector total GGE has<br />
increased by 0.2 per cent in <strong>the</strong> last 17 years. 71<br />
69 www.statistics.gov.uk/statbase/Expodata/Spreadsheets/D5695.xls<br />
70 www.statistics.gov.uk/statbase/Expodata/Spreadsheets/D5695.xls<br />
71 www.statistics.gov.uk/statbase/Expodata/Spreadsheets/D5695.xls<br />
73
Percentage of <strong>the</strong> Total Greenhouse Gas Emissions in <strong>the</strong> UK 1990 - 2006<br />
15<br />
14<br />
13<br />
12<br />
11<br />
10<br />
9<br />
%<br />
8<br />
7<br />
6<br />
5<br />
4<br />
3<br />
2<br />
1<br />
0<br />
1990 1995 2000 2005<br />
Year<br />
<strong>Transport</strong> Sector<br />
Taxi Operations<br />
Figure 5.3: Taxi operations <strong>and</strong> <strong>the</strong>ir contribution to total UK Greenhouse Gas<br />
Emissions<br />
EA Economic Sector 1990 2000 2001 2002 2003 2004 2005 2006<br />
Code<br />
66 Taxi operations 1599 2293 2287 2330 2357 2381 2426 2464<br />
Total transport industry 62763 83167 87542 88158 91515 96727 99537 92869<br />
% of total UK transport<br />
2.5% 2.8% 2.6% 2.6% 2.6% 2.5% 2.4% 2.7%<br />
emissions<br />
Table 5.4: Taxi operations <strong>and</strong> <strong>the</strong>ir contribution to <strong>the</strong> <strong>Transport</strong> Industry total GGE<br />
Total Greenhouse Gases by Taxi Operations 1990 - 2006<br />
thous<strong>and</strong> tonnes of carbon dioxide equivalent<br />
3000<br />
2500<br />
2000<br />
1500<br />
1000<br />
500<br />
0<br />
1990 1995 2000 2005<br />
Year<br />
Figure 5.4: Greenhouse Gas Emissions by taxi operations 1990 - 2006<br />
74
Taxi operations GGE is one of <strong>the</strong> lowest in comparison to o<strong>the</strong>r modes of transport.<br />
However in <strong>the</strong> past 17 years taxi operations GGE have increased by 54.1% in <strong>the</strong><br />
UK, where as <strong>the</strong> whole transport sector has increased at a slower 48%. This is a little<br />
disappointing when we know for example in London that <strong>the</strong> 21,000 strong black taxi<br />
fleets exhaust omissions have to be a lot cleaner <strong>the</strong>n o<strong>the</strong>r modes of public transport<br />
due to stipulations by <strong>Transport</strong> for London’s Public Carriage Office. So perhaps mini<br />
cabs are causing a disproportionate increase in GGE levels in this area <strong>and</strong> need to be<br />
regulated to <strong>the</strong> same st<strong>and</strong>ards as black taxis <strong>and</strong> not just in London but in <strong>the</strong> whole<br />
of <strong>the</strong> UK?<br />
London in particular has <strong>the</strong> worst air quality in <strong>the</strong> UK <strong>and</strong> air pollution has a major<br />
impact on health <strong>and</strong> quality of life. The former Mayor Ken Livingstone’s ‘Taxi<br />
Emissions Strategy’ was launched in December 2004 <strong>and</strong> aimed to reduce <strong>the</strong><br />
emissions from London’s taxis by up to 37 per cent by July 2008. 72 The following<br />
major steps have now been taken:-<br />
<br />
<br />
<br />
<br />
Since October 2002 any new taxi licensed in London for <strong>the</strong> first time has had<br />
to be Euro 3 st<strong>and</strong>ard.<br />
From July 1st 2006 all taxis that are of a pre-Euro emissions st<strong>and</strong>ard will be<br />
required to meet Euro 3 st<strong>and</strong>ards.<br />
As of January 1st 2007 all taxis that are of a Euro 1 emissions st<strong>and</strong>ard will be<br />
required to meet Euro 3 st<strong>and</strong>ards.<br />
As of January 1st 2008 all taxis that are of a Euro 2 emissions st<strong>and</strong>ard will be<br />
required to meet Euro 3 st<strong>and</strong>ards. 73<br />
Taxi operations are a vital cog in any integrated sustainable transport system because<br />
<strong>the</strong>y help fill <strong>the</strong> gaps where direct connections cannot be made. This encourages <strong>the</strong><br />
public to use taxis along with o<strong>the</strong>r forms of public transport to complete a journey<br />
ra<strong>the</strong>r <strong>the</strong>n drive <strong>the</strong>mselves, which in turn helps to create less traffic <strong>and</strong> <strong>the</strong>refore<br />
less GGE. Sure fur<strong>the</strong>r improvements can be made to taxi operations GGE levels as<br />
<strong>the</strong>y can to all o<strong>the</strong>r forms of transport <strong>and</strong> perhaps <strong>the</strong> London black taxi blueprint is<br />
one that o<strong>the</strong>r taxis networks around <strong>the</strong> whole of <strong>the</strong> UK can take on board to<br />
achieve this.<br />
5.3 Policy Options<br />
Drivers <strong>and</strong> <strong>Transport</strong> Workers<br />
<br />
Working time <strong>and</strong> Timetabling - The health <strong>and</strong> safety of drivers <strong>and</strong> <strong>the</strong>ir<br />
passengers must be of paramount importance. In order to achieve this, <strong>the</strong><br />
working week must be reduced with no detriment to pay <strong>and</strong> conditions. In<br />
particular, UK Domestic Driving Hours need to encompass a minimum<br />
st<strong>and</strong>ard of no more than four-<strong>and</strong>-a-half hour’s maximum driving in a single<br />
spell, eight hours a day maximum driving, a maximum ten-hour a day total<br />
duty <strong>and</strong> a minimum of 11 hours continuous break between duties.<br />
Quality contracting<br />
72 http://www.london.gov.uk/mayor/environment/air_quality/mayor/taxi_emissions.jsp<br />
73 http://www.london.gov.uk/view_press_release.jsp?releaseid=4637<br />
75
More than two thirds of journeys made on public transport are by bus, playing<br />
a vital role in easing congestion <strong>and</strong> providing a green alternative to <strong>the</strong> car. It<br />
is hoped that <strong>the</strong> Local <strong>Transport</strong> Act covering Engl<strong>and</strong> <strong>and</strong> Wales, which was<br />
given Royal Assent in Nov 08 through its introduction of Quality Contracts<br />
will encourage as many people as possible to consider switching to buses. The<br />
Local <strong>Transport</strong> Act is seen by many as a first attempt to address <strong>the</strong><br />
inadequacy <strong>and</strong> market failure of bus services since deregulation.<br />
Local authorities will have greater power to serve routes that are dem<strong>and</strong>ed in<br />
<strong>the</strong> local area, which have previously been dropped due to lack of profitability<br />
by private contractors. There is <strong>the</strong> potential to cut down on empty/non full<br />
buses on <strong>the</strong> road by having more full buses.<br />
<strong>Unite</strong> has fought hard to protect bus workers employment conditions that may<br />
be affected by <strong>the</strong> Quality Contract process by getting TUPE protection<br />
written into <strong>the</strong> Act under Clause 39.<br />
<strong>Unite</strong> needs to make sure that during <strong>the</strong> statutory instrument phase of <strong>the</strong><br />
Local <strong>Transport</strong> Act that it continues to deliver for bus workers. In particular<br />
<strong>the</strong>re is an opportunity to win access for bus workers to <strong>the</strong> Local Government<br />
Pension Scheme. The company which is awarded <strong>the</strong> Quality Contract will<br />
have Admitted Body Status <strong>and</strong> can apply for access to <strong>the</strong> Local Government<br />
Pension Scheme or an equivalent scheme. In order to make sure this practice<br />
becomes <strong>the</strong> norm <strong>Unite</strong> must make sure that <strong>the</strong> companies who win <strong>the</strong><br />
Quality Contracts choose to apply for access to <strong>the</strong> Local Government Pension<br />
Scheme so this practice becomes <strong>the</strong> norm <strong>and</strong> <strong>the</strong>refore becomes an expected<br />
part of what would make up a Quality Contract.<br />
In Scotl<strong>and</strong> <strong>the</strong> <strong>Transport</strong> (Scotl<strong>and</strong>) Act 2001, establishes systems for setting<br />
up formal bus quality partnerships <strong>and</strong> bus quality contract schemes. However,<br />
to date no Quality Partnerships or Quality Contracts have been introduced <strong>and</strong><br />
only voluntary partnerships exist.<br />
So <strong>the</strong> Bus Regulation (Scotl<strong>and</strong>) Bill aims to simplify procedures whereby<br />
transport authorities specify local bus services <strong>and</strong> st<strong>and</strong>ards to help facilitate<br />
Quality Partnerships <strong>and</strong> Quality Contracts.<br />
This is an ongoing battle in Scotl<strong>and</strong> because <strong>the</strong> Scottish National Party<br />
(SNP) are financially backed by Brian Souter who is <strong>the</strong> Chief Executive of<br />
Stagecoach <strong>and</strong> opposed to Quality Contracts.<br />
Modal shift<br />
<br />
<br />
<br />
<br />
Promotion of public transport – By promoting public transport hopefully<br />
people will be encouraged to leave <strong>the</strong>ir cars at home <strong>and</strong> use public transport<br />
or walk or cycle.<br />
High availability, attractive pricing & more reliable - Passenger numbers<br />
will increase if <strong>the</strong>re is a broader offering of public transport options at a lower<br />
price which are more reliable.<br />
Through ticketing – One ticket used for all forms of transport making public<br />
transport more appealing to use.<br />
Creating car free zones - To raise awareness on energy conservation,<br />
vehicular pollution (both air <strong>and</strong> noise) <strong>and</strong> to improve <strong>the</strong> quality of life <strong>and</strong><br />
economy of <strong>the</strong> local community.<br />
76
Creating a positive bus environment - Bus priority at traffic lights, bus<br />
gates, bus lanes, bus only roads/segregated bus ways.<br />
Green miles –Pressure must be created that stops companies from being able<br />
to source <strong>the</strong>ir goods from all over <strong>the</strong> world in search of cheaper labour, with<br />
no consideration for <strong>the</strong> environmental fall out of transporting goods<br />
thous<strong>and</strong>s of miles around <strong>the</strong> world. <strong>Unite</strong> has previously called for all<br />
companies to include in <strong>the</strong>ir company reports <strong>the</strong>ir overall carbon footprint.<br />
This may create consumer pressure to change <strong>and</strong> source locally.<br />
Reducing emissions from vehicles<br />
<br />
<br />
<br />
<br />
<br />
<br />
<br />
<br />
New fuels - Traffic can become increasingly sustainable through new fuels<br />
such as biofuels, maritime fuel options <strong>and</strong> o<strong>the</strong>r fuel efficiency measures.<br />
Economical driving – By accelerating <strong>and</strong> driving slower, as well as braking<br />
more gradually.<br />
New engines - Hybrid motors use a battery pack, backed by a diesel engine.<br />
Hybrid motors can generate 40% less carbon dioxide than <strong>the</strong>ir diesel-powered<br />
forebears. An entirely hybrid fleet of buses could produce 200,000 fewer<br />
tonnes of carbon each year.<br />
Warm coolant system - Buses that are connected to a warm coolant system<br />
when on <strong>the</strong> parking ramp, reduce <strong>the</strong> number of environmentally harmful<br />
cold starts to a minimum.<br />
Recycling - Each transport depot should prepare its own waste plan. Recycling<br />
of metals, corrugated board/batteries, burnable material, tyres <strong>and</strong> spill oil.<br />
Destruction or disassembly of oil sludge, oil filters, chemical residue <strong>and</strong><br />
electronics.<br />
Introducing vehicle emission st<strong>and</strong>ards & inspection / maintenance<br />
systems - To improve <strong>the</strong> air quality of <strong>the</strong> urban environment <strong>and</strong> health of<br />
<strong>the</strong> urban population through improved emission st<strong>and</strong>ards.<br />
Introducing vehicle fuel st<strong>and</strong>ards - To improve <strong>the</strong> urban air quality by<br />
reducing ambient concentration of <strong>the</strong> key pollutants.<br />
Greening fuel taxes - To provide disincentives for excessive use of<br />
automobiles <strong>and</strong> consumption of fuels, to induce switching to cleaner fuels, to<br />
secure financial source for more environmentally sustainable measures of<br />
transport, to induce structural impact on <strong>the</strong> choice of vehicles <strong>and</strong> location of<br />
residences, to internalise <strong>the</strong> external costs of petroleum production <strong>and</strong><br />
consumption.<br />
77
6 Road <strong>Transport</strong> Commercial<br />
6.1 Introduction <strong>and</strong> Overview of <strong>the</strong> Road <strong>Transport</strong> Commercial Sector<br />
Freight transport by road dominates <strong>the</strong> inl<strong>and</strong> freight market in Europe <strong>Union</strong> <strong>and</strong><br />
has grown steadily over <strong>the</strong> past decade while it is predicted to fur<strong>the</strong>r increase its<br />
share in <strong>the</strong> future. This makes <strong>the</strong> road sector by far <strong>the</strong> biggest source of energy use<br />
<strong>and</strong> thus emitter of Green House Gases (GHG) among <strong>the</strong> l<strong>and</strong>-based transport<br />
modes. Due to <strong>the</strong> huge amounts of burned diesel oil, road transport is also <strong>the</strong> largest<br />
contributor to NOx emissions in Europe <strong>and</strong> <strong>the</strong> second largest one for particulate<br />
matters.<br />
The contribution of <strong>the</strong> freight sector to global warming has so far received less<br />
attention than CO 2 emissions from car traffic <strong>and</strong> aviation. The European road freight<br />
hire or reward industry accounted for 80% of Europe’s road freight traffic in 2006 <strong>and</strong><br />
90 per cent for journeys with an international element.<br />
However, despite technological improvements to engines <strong>and</strong> various policy<br />
measures, air quality on roads is not improving significantly.<br />
The issue of poor air quality is foremost a health problem not only for people that live<br />
near roads but also for professional lorry drivers (respiratory problems, cardiovascular<br />
diseases, cancer).<br />
Commercial vehicles performance is worst in urban traffic situation <strong>and</strong> in stop-start<br />
traffic. Congestion of many of <strong>the</strong> main arterial road axis, particularly in central<br />
Europe is ano<strong>the</strong>r source of concern which impacts on <strong>the</strong> smooth running of<br />
transportation <strong>and</strong> on <strong>the</strong> quality of life of citizens as well.<br />
HGV Drivers SOC8211<br />
Not 60.24:<br />
Freight<br />
transport by<br />
road<br />
60.24:<br />
Freight<br />
transport by<br />
road<br />
All<br />
SOC<br />
8211<br />
Labour Force Survey Jan-Mar<br />
2002 59.0 81.9 67.8<br />
2003 53.1 77.4 63.0<br />
2004 54.2 72.4 60.2<br />
2005 54.0 74.0 61.9<br />
2006 51.4 69.2 57.6<br />
2007 47.1 64.9 53.0<br />
2008 45.0 67.9 53.4<br />
Table 6.1: Percentage of drivers usually working 48 hrs or more<br />
Professional lorry drivers have always known that working long hours does not favour<br />
a positive work-life balance; in freight transport, fatigue, stress <strong>and</strong> <strong>the</strong> lack of decent<br />
<strong>and</strong> affordable parking places, give fur<strong>the</strong>r arguments to <strong>the</strong> idea that <strong>the</strong> profession<br />
lorry driver life, especially that of international transport drivers, is not only a risky<br />
one but a unhealthy one as well.<br />
78
Road transport is also <strong>the</strong> most widespread source of noise, which again not only has<br />
an impact on local residents, but also on <strong>the</strong> drivers, resulting in hearing losses. As<br />
both noise <strong>and</strong> congestion increases <strong>the</strong> truck driver’s level of stress also increases<br />
significantly.<br />
So, it has to be remembered that <strong>the</strong> environmental problems caused by road transport<br />
are closely linked to health <strong>and</strong> safety of professional drivers <strong>and</strong> o<strong>the</strong>r transport<br />
workers.<br />
To tackle <strong>the</strong>se environmental challenges, several environmental measures need to be<br />
undertaken such as improved infrastructure, cleaner <strong>and</strong> alternative fuels as well as<br />
cleaner <strong>and</strong> technologically advanced vehicles are required.<br />
However, in regards to <strong>the</strong> increased use of bio fuels in <strong>the</strong> road transport sector, it<br />
has to be taken into consideration where <strong>the</strong>se fuels come from <strong>and</strong> whe<strong>the</strong>r <strong>the</strong>y are<br />
produced from sustainable resources. Fur<strong>the</strong>rmore, products are often transported<br />
long distances across Europe <strong>and</strong> it is questionable whe<strong>the</strong>r some of <strong>the</strong>se transport<br />
flows are needed <strong>and</strong> could be avoided.<br />
At <strong>the</strong> moment, <strong>the</strong> full internalisation of external environmental costs of road freight<br />
transport is not taken into account, although pricing/ taxation policies could help to<br />
get rid of any unfair cost advantages that road transport may have over o<strong>the</strong>r forms of<br />
transport, <strong>and</strong> also help to make <strong>the</strong> end consumers more aware of <strong>the</strong> environmental<br />
cost of what <strong>the</strong>y buy. However, we have to be careful that increased costs do not<br />
impact on workers but are paid for by <strong>the</strong> end users.<br />
In <strong>the</strong> majority of EU Member States, freight transport by road employs a third to half<br />
of all people working in <strong>the</strong> transport sector. In total, more than 2.7m workers are<br />
employed in road freight transport in <strong>the</strong> EU-27.<br />
According to Jan – Mar 2008 Labour Force Survey <strong>the</strong>re are 293,981 employed LGV<br />
drivers in <strong>the</strong> UK. The Road <strong>Transport</strong> Commercial Trade Group membership in<br />
March 2008 was 69,126. However, <strong>the</strong>re are a significant number of LGV drives in<br />
o<strong>the</strong>r trade groups of <strong>the</strong> T&G Section of <strong>Unite</strong> <strong>the</strong> <strong>Union</strong>.<br />
Due to <strong>the</strong> restructuring in <strong>the</strong> sector <strong>and</strong> <strong>the</strong> emergence of logistics, new jobs have<br />
been created, in particular with warehousing operators. But only a small number of<br />
<strong>the</strong>se are covered by specific collective agreements.<br />
Fur<strong>the</strong>rmore, 3PL companies increasingly exploit <strong>the</strong> possibilities of an internal<br />
transport market using <strong>the</strong> huge wage gap between professional LGV drivers of <strong>the</strong><br />
new <strong>and</strong> old Member States. As a result, <strong>the</strong>y employ cheaper labour from new<br />
Member States through cabotage <strong>and</strong> cross trade. Such situation by no means helps to<br />
improve <strong>the</strong> overall working conditions in <strong>the</strong> sector or create sustainable<br />
employment.<br />
The completion of <strong>the</strong> European internal market in 1992 but also <strong>the</strong> dynamics of<br />
globalisation <strong>and</strong> <strong>the</strong> development of information technology (IT) has been <strong>the</strong><br />
catalyst for considerable restructuring in <strong>the</strong> road freight transport sector, especially<br />
<strong>the</strong> growth of 3PLs.<br />
79
The intra-EU freight transport, which was traditionally a fragmented market <strong>and</strong><br />
characterised by small <strong>and</strong> medium-sized companies, was opened up to competition.<br />
In 1998, <strong>the</strong> transport market for both goods was fully liberalised, <strong>and</strong> thus transport<br />
operators based in <strong>the</strong> EU could supply transport services between any Member<br />
States. This led to a major consolidation process which still continues today.<br />
A shift in activities has also been taking place from those companies which were<br />
exclusively dedicated to transporting goods, towards those which also organise o<strong>the</strong>r<br />
transport activities, 3PLs, <strong>and</strong> as a result <strong>the</strong> whole supply chain in relation to<br />
transport.<br />
These 3PL companies not only manage <strong>the</strong> flow of goods, <strong>the</strong>y also respond as<br />
quickly as possible to <strong>the</strong> just-in-time dem<strong>and</strong>s of <strong>the</strong>ir customers, both<br />
manufacturing <strong>and</strong> retail, by reducing stock levels <strong>and</strong> <strong>the</strong>refore costs, using minimal<br />
stock levels, <strong>and</strong> <strong>the</strong>y increasingly operate door-to-door deliveries. Many of <strong>the</strong>se<br />
deliveries are a result of internet sales, which are increasing at a very fast rate.<br />
As previously mentioned <strong>the</strong>re is a trend towards mergers <strong>and</strong> concentration of large<br />
companies with o<strong>the</strong>r large companies. As a result, an increasing number of megalogistic<br />
providers are managing <strong>and</strong> controlling <strong>the</strong> transport <strong>and</strong> related services<br />
market while small <strong>and</strong> medium-sized companies are working as subcontracting for<br />
<strong>the</strong>m. These small <strong>and</strong> medium-sized companies are struggle for survival due to <strong>the</strong><br />
low prices paid by <strong>the</strong>se large 3PLs. This is a clear example of unsustainable business<br />
model in transport.<br />
Outsourcing <strong>and</strong> subcontracting has become a very common practice in <strong>the</strong> sector.<br />
This whole restructuring process <strong>and</strong> <strong>the</strong> division of labour has severe repercussions<br />
for road transport workers. Jobs in <strong>the</strong> sector have always included a high level of<br />
mobility, antisocial working hours <strong>and</strong> do not support a positive work-life balance.<br />
But <strong>the</strong> sector’s development in <strong>the</strong> last ten years has changed <strong>the</strong> workers’ situation.<br />
The new jobs which have been created in warehousing are not always of a good<br />
quality both in terms of pay <strong>and</strong> working conditions, as well as with regards to<br />
training <strong>and</strong> education levels.<br />
Ano<strong>the</strong>r trend is that companies increasingly use low-cost labour from Eastern Europe<br />
especially through cabotage, as well as <strong>the</strong> 3PLs establishing subsidiaries in Eastern<br />
Europe.<br />
In regard to professional transport drivers <strong>the</strong>re is a tendency to use those workers<br />
with <strong>the</strong> lowest wages to undertake international road transport through cabotage <strong>and</strong><br />
not respecting <strong>the</strong> principle of equal pay for equal work in <strong>the</strong> home country.<br />
Human fatigue, mainly due to reduced rest-time, has become a major reason for road<br />
accidents. An additional problem is <strong>the</strong> progression of bogus self-employed drivers,<br />
which do not have to meet <strong>the</strong> same st<strong>and</strong>ards as employed drivers <strong>and</strong> fur<strong>the</strong>r<br />
undermine positive developments which have been made in commercial road<br />
transport. As a result, <strong>the</strong> sector has a low level of job satisfaction, high turnover of<br />
workers, which led to a shortage of experienced drivers, as well as to <strong>the</strong> problem of<br />
recruiting <strong>and</strong> retaining professional drivers.<br />
80
6.2 Greenhouse gas emissions <strong>and</strong> freight transport in <strong>the</strong> <strong>Unite</strong>d Kingdom<br />
We will start by looking at road freight in regards to its contribution to <strong>the</strong> total<br />
Greenhouse Gas Emissions (GGE) in <strong>the</strong> UK <strong>and</strong> as part of <strong>the</strong> transport sector.<br />
Between 1990 <strong>and</strong> 2006 GGE from freight transport by road increased by 31.7 per<br />
cent from 2.0 percent of total GGE to 2.7 per cent.<br />
During <strong>the</strong> same period total GGE from <strong>the</strong> transport sector increased 64.6 per cent<br />
from 7.9 per cent to 13.0 per cent.<br />
Percentage increase in Greenhouse Gas Emissions 1990 - 2006<br />
15.0<br />
10.0<br />
%<br />
5.0<br />
0.0<br />
1990 1995 2000 2005<br />
Year<br />
<strong>Transport</strong> Sector<br />
Freight by Road<br />
Figure 6.1: Percentage increase in Greenhouse Gas Emissions 1990 -2006<br />
CO 2 emissions from HGV, which are defined as lorries with a gross weight of 3.5<br />
tonnes or more, can be measured in three ways – see Appendix 1 - but we will us <strong>the</strong><br />
input-based measure used in <strong>the</strong> <strong>Unite</strong>d Kingdom <strong>Environment</strong>al Accounts,<br />
maintained by Office of National Statistics (ONS). These accounts contain data on<br />
CO 2 emissions for ‘road transport of freight’ Economic Activity (EA) code 67. This is<br />
based on estimates of fuel purchases obtained from <strong>the</strong> Department for Business<br />
Enterprise <strong>and</strong> Regulatory Reform (BERR). Its published estimates of CO 2 emissions<br />
for road freight relate solely to companies whose main activity is freight transport i.e.<br />
road hauliers.<br />
However, <strong>the</strong> Department for <strong>Transport</strong> advises ‘Data users’ to be ‘aware that <strong>the</strong><br />
road freight industry comprises solely <strong>the</strong> specialist road haulage companies <strong>and</strong> not<br />
all road freight activities’ (Department for <strong>Transport</strong>, 2006 74 ). This was not made<br />
clear when official statistics were released in 2004, suggesting that CO 2 emissions<br />
from HGVs had risen by almost 40% between 1990 <strong>and</strong> 2003. These statistics,<br />
however, excluded many ‘own account’ operators of lorries whose main activity is<br />
not freight transport.<br />
74 Department for <strong>Transport</strong> (2006) ‘Greenhouse gas emissions from transport: London.<br />
81
During <strong>the</strong> 1990s, <strong>the</strong>re was a significant switch from own account to hire <strong>and</strong> reward<br />
transport operations as more companies outsourced <strong>the</strong>ir distribution. This had <strong>the</strong><br />
effect, ceteris paribus, of increasing fuel purchases by <strong>the</strong> ‘hire <strong>and</strong> reward’ sector.<br />
This represented a transfer of <strong>the</strong> dem<strong>and</strong> for fuel between different road freight<br />
sectors ra<strong>the</strong>r than a net increase in <strong>the</strong> total dem<strong>and</strong> for fuel <strong>and</strong> in CO 2 emissions. It<br />
was subsequently recognised that <strong>the</strong>re had been ‘a misallocation between industry<br />
groups’ <strong>and</strong> <strong>the</strong> estimated CO 2 growth rate was revised downward (Department for<br />
<strong>Transport</strong>, 2006).<br />
Total Greenhouse Gases by Freight by Road 1990 - 2006<br />
thous<strong>and</strong> tonnes of carbon dioxide equivalent<br />
21000<br />
20000<br />
19000<br />
18000<br />
17000<br />
16000<br />
15000<br />
1990 1995 2000 2005<br />
Year<br />
Figure 6.2: Total Greenhouse Gases by Freight by Road 1990 -2006 – thous<strong>and</strong><br />
tonnes of carbon dioxide equivalent<br />
In 2006 freight transported by road accounted for 20 per cent of <strong>the</strong> total GGE of <strong>the</strong><br />
transport sector, while in 1990 it accounted for 25.4 per cent of <strong>the</strong> total GGE of <strong>the</strong><br />
transport sector. So <strong>the</strong> contribution to of freight transported by road to <strong>the</strong> transport<br />
sector total GGE has decreased by 20 per cent.<br />
Between 1990 <strong>and</strong> 2006 <strong>the</strong> average length of haul for all rigid vehicles was static at<br />
43 kilometres. During <strong>the</strong> same period <strong>the</strong> average length of an articulated vehicle<br />
hauls decreased by 4.7 per cent to 123 kilometres. For all HGV <strong>the</strong>re was an average<br />
increase of 7 kilometres per haul, an increase of 8.9 per cent.<br />
82
Average length of haul: 1990 - 2006<br />
140<br />
120<br />
Kilometres<br />
100<br />
80<br />
60<br />
40<br />
1990 1995 2000 2005<br />
Year<br />
Figure 6.3: Average length of haul 1990 - 2006<br />
Rigid Articulated All Lorries<br />
6.3 Van Traffic<br />
CO 2 emissions from vans carrying freight have been estimated using an output based<br />
approach. This used data from <strong>the</strong> 2004 Survey of Van Activity (Department for<br />
<strong>Transport</strong>, 2004) <strong>and</strong> estimates of average fuel consumption from o<strong>the</strong>r sources.<br />
Allowance was made for <strong>the</strong> fact that vans, unlike trucks, are used for purposes o<strong>the</strong>r<br />
than <strong>the</strong> carriage of freight. In 2004, only 35 per cent of <strong>the</strong> distance travelled by<br />
company-owned vans involved <strong>the</strong> collection <strong>and</strong>/or delivery of goods or related<br />
empty running. Commuting to <strong>and</strong> from work accounted for a similar proportion of<br />
<strong>the</strong> distance travelled. It is not possible, on <strong>the</strong> basis of available data, to calculate fuel<br />
efficiency <strong>and</strong> CO 2 emissions specifically for freight collections <strong>and</strong> deliveries. It will<br />
simply be assumed that freight-carrying vans account for around 35 per cent of total<br />
van kilometres <strong>and</strong> a similar proportion of <strong>the</strong> CO 2 output from <strong>the</strong> van sector.<br />
It is not possible to monitor trends in <strong>the</strong> amount of CO 2 emitted by vans carrying<br />
freight as <strong>the</strong> Van Activity survey is only conducted occasionally. Indeed <strong>the</strong>re have<br />
only been two official surveys of van traffic over <strong>the</strong> past 16 years which measured<br />
<strong>the</strong> weight of goods transported in <strong>the</strong>se vehicles (in 1992-3 <strong>and</strong> 2004).<br />
The National Atmospheric Emissions Inventory (NAEI) contains data for <strong>the</strong> period<br />
1990-2004 for CO 2 emissions from vans. This does not differentiate emissions by trip<br />
purpose, however. This is important as <strong>the</strong> balance of freight-related <strong>and</strong> non-freight<br />
work undertaken by small vans is likely to have changed significantly over <strong>the</strong> past<br />
fifteen years, reflecting <strong>the</strong> growth <strong>and</strong> transformation of <strong>the</strong> service sector.<br />
83
Light Duty Vehicles Carbon Dioxide (as Carbon) 1990 - 2006<br />
2010<br />
2005<br />
2000<br />
ktonnes<br />
1995<br />
1990<br />
1985<br />
1990 1995 2000 2005<br />
Year<br />
Figure 6.4: Light Duty Vehicles Carbon Dioxide (as carbon) 1990 -2006<br />
6.4 Some policy options to be considered by <strong>the</strong> RTC National Committee<br />
This is not an excusive list <strong>and</strong> <strong>the</strong>re are different categories of instruments, which<br />
aim to promote modal shift <strong>and</strong> promote sustainable employment<br />
<br />
<br />
<br />
Give incentives for emission reduction <strong>and</strong> energy saving. The generated<br />
income from pricing/ taxation of transport should be used for maintenance <strong>and</strong><br />
<strong>the</strong> supply of better transport infrastructure, as well as for more public<br />
passenger transport. Also some of this income should be used to improve <strong>the</strong><br />
enforcement of driver’s hours regulations <strong>and</strong> vehicle safety st<strong>and</strong>ards related<br />
to road transport activities.<br />
The price of transport influences <strong>the</strong> modal choice. A market based instrument<br />
to promote a modal shift towards more sustainable transport modes is <strong>the</strong><br />
internalisation of external environmental <strong>and</strong> social costs.<br />
Avoid un-necessary transport <strong>and</strong> reduce empty running<br />
84
Percentage empty running<br />
Vehicle type<br />
Business Type Rigids Artics All vehicles<br />
Hire or Reward 29.8 25.6 27<br />
Own account 27.5 28.6 27.8<br />
Agriculture, forestry <strong>and</strong> fishing 40.7 34.8 38.2<br />
Energy <strong>and</strong> water supply 58.3 50.7 58<br />
Manufacture, mining <strong>and</strong> quarrying 25.7 312 27.7<br />
Construction 44.0 38.9 43.6<br />
Wholesale & retail trade, repairs <strong>and</strong> hotels 25.5 26.3 25.8<br />
<strong>Transport</strong>, storage <strong>and</strong> communication 27.8 15.7 23<br />
Banking, finance <strong>and</strong> insurance, business services <strong>and</strong> leasing 29.1 33.6 29.6<br />
Education, public admin & defence, extra-territorial<br />
organisations<br />
61.8 32.7 60.9<br />
Health, social work <strong>and</strong> o<strong>the</strong>r community services 17.1 46.3 79.8<br />
All business types 28.4 26.4 27.4<br />
Source: Table 1.6 Road Freight Statistics 2007<br />
Table 6.2: Percentage empty running lorries<br />
The ETF fully supports a policy aiming for modal shift <strong>and</strong> <strong>the</strong> internalisation of all<br />
external costs in all transport modes. This is essential for an environmentally<br />
sustainable transport system.<br />
This policy must be complemented by a policy that promotes intermodal transport <strong>and</strong><br />
concepts that combine <strong>the</strong> different transport modes in a sustainable way.<br />
However, “putting prices right” is not an aim, but a method to change transport <strong>and</strong><br />
production patterns. If internalisation of external costs is to be effective in terms of<br />
avoiding environmental damages, it is necessary that it is not transport workers, who<br />
pay <strong>the</strong> increase in price.<br />
It must be ensured through a number of social policy instruments <strong>and</strong> strict<br />
enforcement of social legislation, that higher infrastructure using costs are transferred<br />
to <strong>the</strong> customer <strong>and</strong> thus give <strong>the</strong> right (environmentally sustainable) price signals.<br />
Fur<strong>the</strong>rmore, a (environmentally) sustainable transport system needs a policy that<br />
aims at:<br />
Acknowledging <strong>and</strong> streng<strong>the</strong>ning <strong>the</strong> human element in environmental<br />
policies as well as respecting <strong>the</strong> close link between environmental <strong>and</strong><br />
working conditions, by tackling, amongst o<strong>the</strong>rs, fatigue <strong>and</strong> excessive<br />
workloads that raise <strong>the</strong> percentage of accidents having a negative impact on<br />
environment. If <strong>the</strong>re is an environmental impact assessment conducted at EU<br />
level, additionally <strong>the</strong>re should also be a social analysis with trade unions’<br />
involvement to ensure a win-win situation;<br />
Ensuring <strong>the</strong> effective implementation of existing environmental st<strong>and</strong>ards<br />
<strong>and</strong>/ or regulations. Never<strong>the</strong>less, <strong>the</strong>re is a clear need for improved, stricter<br />
<strong>and</strong> binding environmental regulations in <strong>the</strong> transport sector with a view to<br />
ensure higher respect for <strong>the</strong> environment;<br />
85
Tackling <strong>the</strong> sectors’ environmental challenges <strong>and</strong> fur<strong>the</strong>r intensifying <strong>the</strong><br />
reduction of fuel consumption <strong>and</strong> pollutant emissions through improved<br />
infrastructure <strong>and</strong> energy-efficiency measures, such as <strong>the</strong> use of cleaner fuels<br />
as well as improved <strong>and</strong> innovative technologies when constructing more<br />
environmentally friendly trains/ trucks/ airplanes/ vessels. Often <strong>the</strong>se<br />
measures cannot, due to <strong>the</strong> very long life time of those vehicles, be<br />
implemented immediately. Therefore, particular attention has to be paid to <strong>the</strong><br />
need for modernising existing vehicles;<br />
Ensuring that o<strong>the</strong>r regions of <strong>the</strong> world implement comparable measures, i.e.<br />
global solutions are preferred to regional ones. However, <strong>the</strong> EU can <strong>and</strong> must<br />
be a forerunner in <strong>the</strong> field of ecological protection <strong>and</strong> not defer <strong>the</strong><br />
implementation of <strong>the</strong> highest st<strong>and</strong>ards that protect European citizens.<br />
86
7 Conference Report<br />
The conference was attended by 38 delegates from all <strong>the</strong> T&G <strong>Transport</strong> Sector<br />
Trade Groups.<br />
The meeting was opened by Paul Clark MP, Parliamentary Under Secretary of State<br />
for <strong>Transport</strong> 75 . Paul’s speech was followed by a question <strong>and</strong> answer session, at<br />
which delegates raised a number of issues.<br />
This was followed by a round table discussion lead by: Richard Dyer, Friends of <strong>the</strong><br />
Earth; Philippa Edmunds Freight on Rail; Gideon Middleton, Ex Wincanton, ex<br />
Kingfisher; Philip Pearson, TUC; Christopher Snelling, Freight <strong>Transport</strong><br />
Association; Mac Urata International <strong>Transport</strong> Workers’ Federation ;Roger<br />
Wiltshire, British Air <strong>Transport</strong> Association;<br />
It became clear that <strong>the</strong> delegates thought that activists were keen to have information<br />
<strong>and</strong> materials <strong>the</strong>y could use with members. They were also keen to learn more about<br />
areas that <strong>the</strong>y might face when dealing with employers: biofuels <strong>and</strong> offsetting were<br />
examples where <strong>the</strong>y felt <strong>the</strong>y might need more information.<br />
<strong>Environment</strong>al training should have union involvement o<strong>the</strong>rwise could be counterproductive,<br />
also should have rewards<br />
The afternoon session began with a brief overview of <strong>the</strong> <strong>Sustainable</strong> <strong>Transport</strong><br />
Report by <strong>the</strong> Researchers from <strong>the</strong> Research Department. Caroline Molloy gave an<br />
overview of <strong>the</strong> report <strong>and</strong> <strong>the</strong> introductory chapter; Colin Potter reported on <strong>the</strong> Civil<br />
Air <strong>Transport</strong> chapter; John Neal reported on <strong>the</strong> Passenger <strong>Transport</strong> chapter; <strong>and</strong><br />
Roger Sealey reported on <strong>the</strong> Docks <strong>and</strong> Inl<strong>and</strong> Waterways Chapter <strong>and</strong> <strong>the</strong> Road<br />
<strong>Transport</strong> Commercial chapters<br />
Delegates <strong>the</strong>n broke into groups to discuss issues arising from <strong>the</strong> Introductory<br />
Chapter <strong>and</strong> <strong>the</strong> relevant Trade Group Chapter.<br />
7.1 Passenger <strong>Transport</strong> Trade Group<br />
Affected by politics of privatisation <strong>and</strong> deregulation – more extensive in UK than<br />
elsewhere – need to address <strong>the</strong> politics. More about market solutions will not provide<br />
sustainable transport.<br />
Biofules – Stagecoach Scotl<strong>and</strong> – company in Mo<strong>the</strong>rwell processes cooking oil. This<br />
is part of an environmental initiative that allows customers to exchange used cooking<br />
oil for discounted bus travel. On Wednesday 5 November 2008 <strong>the</strong> Bio Bus won <strong>the</strong><br />
award at <strong>the</strong> Route One Operator Excellence Awards 2008 in Birmingham. What <strong>the</strong><br />
judges said: “without doubt <strong>the</strong> winning innovation has captured <strong>the</strong> hearts <strong>and</strong> minds<br />
of not only <strong>the</strong> community in which it serves but also much fur<strong>the</strong>r afield. The result<br />
have surpassed all expectations <strong>and</strong> as a consequence serious consideration is being<br />
given to broadening <strong>the</strong> project to o<strong>the</strong>r parts of <strong>the</strong> UK” 76<br />
75 http://www.dft.gov.uk/press/speechesstatements/speeches/unite<br />
76 See http://www.<strong>the</strong>biobus.com/ for more details<br />
87
Taxi drivers more affected by transport emissions being in <strong>the</strong> centre of <strong>the</strong> road<br />
Large increase in taxi numbers after a number of Councils lifted <strong>the</strong> restriction on <strong>the</strong><br />
number of taxis after a circular letter from <strong>the</strong> Department for <strong>Transport</strong> following an<br />
Office of Fair Trading Report.<br />
Use <strong>the</strong> <strong>Sustainable</strong> <strong>Transport</strong> document to campaign on environmental <strong>and</strong> social<br />
issues<br />
Practical solutions list – What can our members do? What are we doing? (Bus<br />
workers Charter, Local <strong>Transport</strong> Act 2008)<br />
<strong>Environment</strong>al reps – What would <strong>the</strong>y do? What rights would <strong>the</strong>y have?<br />
Economical driving – Traffic light economical driving system in place in a lot of<br />
workplaces already (Red – bad, Green – good, etc). They put stats on pay slips.<br />
Potential for management misuse?<br />
Workplace examples of what could be done in <strong>the</strong> workplace to deliver sustainable<br />
transport – Garage side of sustainability.<br />
Town planning – Around car or employer in <strong>the</strong> case of John Lewis in Leicester.<br />
Cab design committees – Frank Llwellyn heads this up for us. They felt <strong>the</strong>re was<br />
some potential here.<br />
7.2 Road <strong>Transport</strong> Commercial Trade Group<br />
Delegates fully endorsed <strong>the</strong> recommendations in <strong>the</strong> RTC chapter of <strong>the</strong> report. The<br />
issue of how to create an sustainable <strong>and</strong> integrated transport policy - through<br />
regulation – is a question for <strong>the</strong> whole country. It was recalled that in <strong>the</strong> 1960s,<br />
picking up <strong>and</strong> dropping off was largely h<strong>and</strong>led locally. From 1975 this changed –<br />
along with pressure for cheaper prices. Vehicles now run double or even triple shifts<br />
for trunking <strong>and</strong> distribution. Companies do not want to hold stocks but this results in<br />
lorries not being fully loaded. An easy way to reduce <strong>the</strong> number of lorry movements<br />
would be to revert to more stock-holding.<br />
Finding means to make holding stock more financially attractive than ‘just in time’<br />
delivery was perhaps a way for government to address some of <strong>the</strong> problems – ei<strong>the</strong>r<br />
making <strong>the</strong> latter more expensive <strong>and</strong>/or <strong>the</strong> former cheaper. Additionally, measures<br />
that would make it more expensive for lorries to travel without a load would have a<br />
beneficial effect.<br />
7.3 Civil Air <strong>Transport</strong> Trade Group<br />
It was considered that <strong>the</strong>re are some areas that we cannot affect – e.g. <strong>the</strong> technical<br />
design of aircraft <strong>and</strong> <strong>the</strong> type of fuel used by aircraft. Employers held <strong>the</strong> key to this,<br />
<strong>the</strong> key factor for employer is saving money <strong>and</strong> as <strong>the</strong>re is a direct relationship<br />
between fuel savings <strong>and</strong> environmental improvement <strong>the</strong> union can play a role in<br />
making employers aware of <strong>the</strong> measures that could be taken.<br />
88
But what we can do is to look at fuel <strong>and</strong> cost savings – e.g. encourage holding areas<br />
near <strong>the</strong> runway – this would reduce emissions <strong>and</strong> <strong>the</strong> costs savings could secure<br />
ground h<strong>and</strong>ling jobs.<br />
It was noted that stacking could last for up to 18 minutes <strong>and</strong> aircraft could be sitting<br />
in a queue lining up to depart for more than 20 minutes with all engines idling. There<br />
is a need to negotiate around <strong>the</strong> use of air space – currently companies fly <strong>the</strong><br />
cheapest route where air traffic costs are <strong>the</strong> cheapest – not always <strong>the</strong> best or shortest<br />
routes. Overwhelmingly, <strong>the</strong>re was a need to pressure Government <strong>and</strong> <strong>the</strong> EU to act.<br />
More <strong>and</strong> better rail links to airports could take freight <strong>and</strong> passengers off roads.<br />
There could be incentive schemes for employees who come up with sustainable<br />
transport ideas – which might be self-funding through <strong>the</strong> cost savings achieved.<br />
A simple energy saving might be for airports to scale down <strong>the</strong> extensive use of<br />
lighting in of-peak periods. Sometimes <strong>the</strong> level of lighting was very high <strong>and</strong> some<br />
airports didn’t even factor in an ability to turn part of <strong>the</strong> lighting off – it was all or<br />
nothing <strong>and</strong> in some cases lighting was kept on 24/7.<br />
Recycling need to be introduced into airports <strong>and</strong> EU ETS does not solve <strong>the</strong> issue<br />
need to campaign for global trading scheme<br />
An absolute need was to improve job security – using minimum st<strong>and</strong>ards to stop <strong>the</strong><br />
race to bottom syndrome; as it is now, in many cases, currently it is a case of a job<br />
today but no job tomorrow.<br />
The links with ETF <strong>and</strong> ITF were considered highly important.<br />
7.4 Docks <strong>and</strong> Inl<strong>and</strong> Waterways Trade Group<br />
Delegates reviewed <strong>the</strong> content of <strong>the</strong> report in detail <strong>and</strong> were comfortable with <strong>the</strong><br />
text as it stood. A range of o<strong>the</strong>r pressing issues were discussed.<br />
7.5 Day 2 of Conference<br />
Eduardo Chagas, General Secretary of <strong>the</strong> European <strong>Transport</strong> Workers’ Federation<br />
gave a presentation on behalf of <strong>the</strong> ETF, He started by outling <strong>the</strong> work of <strong>the</strong> ETF<br />
<strong>and</strong> <strong>the</strong> various campaigns <strong>the</strong>y had been involved in.<br />
He <strong>the</strong>n went on to say that this is a moment of growing pressure on labour <strong>and</strong> social<br />
rights, with <strong>the</strong> spread of social <strong>and</strong> wage dumping, attacks on trade unions <strong>and</strong><br />
expansion of neo-liberal policies which requires a clear <strong>and</strong> firm response from<br />
European workers <strong>and</strong> <strong>the</strong>ir organizations, <strong>and</strong> that a new front is thus now open in<br />
our members’ priorities: <strong>the</strong> protection of jobs. And that <strong>the</strong> trade union movement<br />
must go on <strong>the</strong> offensive <strong>and</strong> claim that <strong>the</strong> same support is found for preserving jobs<br />
<strong>and</strong> workers’ living st<strong>and</strong>ards.<br />
The credit crunch <strong>and</strong> <strong>the</strong> resulting economic crisis, has come at <strong>the</strong> same time when<br />
<strong>the</strong> European trade union movement has been confronted with a series of rulings from<br />
89
<strong>the</strong> European Court of Justice - <strong>the</strong> Viking, Laval/Vaxholm, Ruffert <strong>and</strong> Luxembourg<br />
– whose impact goes much fur<strong>the</strong>r than just <strong>the</strong> cases <strong>the</strong>y address.<br />
Based upon <strong>the</strong> existing Treaty, <strong>the</strong> Court, although recognizing <strong>the</strong> right to strike,<br />
considered actions or legislation aiming at ensuring equal treatment for workers <strong>and</strong><br />
preventing social dumping, to be in breach of <strong>the</strong> Treaty because <strong>the</strong>y hinder <strong>the</strong> free<br />
movement of businesses <strong>and</strong> <strong>the</strong> freedom of establishment. Suddenly we were told<br />
that economic freedoms should prevail over fundamental social rights.<br />
In adopting <strong>the</strong>se rulings, <strong>the</strong> ECJ rewrote <strong>the</strong> legislation, it did not limit itself to<br />
interpret <strong>the</strong> law <strong>and</strong> <strong>the</strong> Treaty but went fur<strong>the</strong>r even using <strong>the</strong> law to interpret <strong>the</strong><br />
Treaty.<br />
with just-in-time deliveries <strong>and</strong> zero stocks, requires more flexible - “modern” <strong>the</strong>y<br />
call it - forms of labour organization, we have assisted to <strong>the</strong> development of<br />
shameful forms of precarious labour, namely in <strong>the</strong> freight distribution market.<br />
Workers being paid by <strong>the</strong> kilometer or by <strong>the</strong> parcel are just examples of how<br />
businesses perceive <strong>the</strong> concept of sustainability.<br />
When <strong>the</strong> ETF finished <strong>the</strong> TRUST project, we concluded that <strong>the</strong> debate should be<br />
continued <strong>and</strong> deepened but also that trade unions can <strong>and</strong> must play a key role in<br />
shaping a different transport policy, one that promotes a broader concept of<br />
sustainability, where <strong>the</strong> decision makers <strong>the</strong>mselves dem<strong>and</strong> <strong>and</strong> respect our<br />
participation as responsible <strong>and</strong> representative actors.<br />
<strong>Transport</strong> workers’ organisations have to be active players in promoting environment<br />
protection, not because it is now fashionable, but because we want to ensure that<br />
possible solutions take into account <strong>the</strong> interests of our members too.<br />
The Congress will thus discuss a political paper that will exp<strong>and</strong> <strong>the</strong> conclusions of<br />
<strong>the</strong> TRUST project <strong>and</strong> provide <strong>the</strong> necessary tools for a trade union intervention in<br />
<strong>the</strong> sustainability debate, seeking for adequate measures that can ensure a balanced<br />
<strong>and</strong> sustainable development of <strong>the</strong> different transport modes.<br />
The o<strong>the</strong>r main paper to be discussed <strong>and</strong> adopted by Congress, “Strong <strong>Union</strong>s”, will<br />
deal with <strong>the</strong> need to reinforce <strong>the</strong> balance of power of transport trade unions, thus<br />
also responding to <strong>the</strong> organizing globally strategy adopted at <strong>the</strong> last ITF Congress in<br />
2006.<br />
Eduardo concluded by giving his commitment, <strong>the</strong> commitment of <strong>the</strong> ETF<br />
Secretariat, to continue fighting for a sustainable transport policy where <strong>the</strong> human<br />
element, <strong>the</strong> contribution from all, women <strong>and</strong> men, to make Europe a better place to<br />
live <strong>and</strong> work, is respected, valorised <strong>and</strong> dignified.<br />
After a question <strong>and</strong> answer session <strong>the</strong> conference broke into four groups to discuss<br />
issue raised in Eduardo’s presentation.<br />
7.6 Yellow Group<br />
Q1 What can unions do in <strong>the</strong> workplace to encourage environmental <strong>and</strong> social<br />
sustainability?<br />
90
Power sharing forum - turning off lights – recycle water<br />
Green reps let H&S reps to be green rep – out of recession pick up<br />
Q2 What sustainability policies should unions be pushing for with national<br />
government <strong>and</strong> how should <strong>the</strong>se be progressed?<br />
Use of taxation to encourage sustainable transport – higher stock level set against tax<br />
Q3 What sustainability policies should unions be pushing for at European <strong>and</strong><br />
International levels <strong>and</strong> how should <strong>the</strong>se be progressed?<br />
Through social net works<br />
Q4 On motorways is down – railways traffic down, large second-h<strong>and</strong> market for<br />
lorries – decommission old lorries <strong>and</strong> add new EU st<strong>and</strong>ards<br />
Green Group<br />
Q1 What can unions do in <strong>the</strong> workplace to encourage environmental <strong>and</strong> social<br />
sustainability?<br />
Fuel savings – stationary vehicles switch off – company introduce company transport<br />
scheme – promote share transport – Technology educate <strong>and</strong> train.<br />
Q2 What sustainability policies should unions be pushing for with national<br />
government <strong>and</strong> how should <strong>the</strong>se be progressed?<br />
<strong>Environment</strong>al reps – pursue issues to where we want to be rerouting – do we need<br />
railways track – do we need to reroute – saving achieved reinvested<br />
Q3 What sustainability policies should unions be pushing for at European <strong>and</strong><br />
International levels <strong>and</strong> how should <strong>the</strong>se be progressed?<br />
Global solutions on issues – not move problem from one side of <strong>the</strong> globe to <strong>the</strong> o<strong>the</strong>r<br />
Q4 How can unions ensure that <strong>the</strong> transport system that emerges from <strong>the</strong> recession<br />
is a sustainable one?<br />
Companies put environmental issues on backburner – concentrate on profits –<br />
minimum environmental or employment or social st<strong>and</strong>ards<br />
7.8 Blue Group<br />
Q1 What can unions do in <strong>the</strong> workplace to encourage environmental <strong>and</strong> social<br />
sustainability?<br />
encourage companies to introduce recycling scheme to include eg waste<br />
metals, oil, tyres etc – motion detector/energy efficient lighting<br />
work out payback times, survey people for <strong>the</strong>ir opinions.<br />
<br />
<br />
<br />
<br />
plant tree when by a lorry<br />
Measuring how much fuel is saved – Leicester Arriva giving people a bonus<br />
on <strong>the</strong> fuel saved per driver. First are doing this too. Maybe need for more<br />
collective solutions?<br />
Limit speed - UPS vans are limited to 57mph.<br />
<strong>Union</strong> involvement in driving training crucial. First are all having Smiths<br />
training – an advanced driving course. This is going to be part of <strong>the</strong> new<br />
91
CPC training – all drivers have 5 days training. Concentrates on 5 keys – not<br />
getting too close, etc.<br />
Easier to ask people to be economical at work than at home – people care less.<br />
Enforcement of working time eg busworkers charter, linking to scheduling<br />
Leaving cabs pleasant (litter free, smoke free) for o<strong>the</strong>r drivers<br />
All parts of union to negotiate for travel plans<br />
Negotiate on vehicle types<br />
Q2 What sustainability policies should unions be pushing for with national<br />
government <strong>and</strong> how should <strong>the</strong>se be progressed?<br />
Better town planning –<br />
environmental reps have same rights as SS<br />
Working time – revision of driving hours <strong>and</strong> working time directives<br />
Taxing empty running<br />
Political control to challenge just in time delivery- planning, regulation –<br />
nationalisation?<br />
Commission to look at sustainable transport<br />
Overturn <strong>the</strong> privatised, deregulated bus transport<br />
<br />
<br />
<strong>Transport</strong> hubs (freight depots) from railways that are <strong>the</strong>n unloaded into.<br />
Freight corridors that are designed <strong>and</strong> planned, integrated with rail – maybe<br />
even canal.<br />
Q3 What sustainability policies should unions be pushing for at European <strong>and</strong><br />
International levels <strong>and</strong> how should <strong>the</strong>se be progressed?<br />
Levy on empty running on planes <strong>and</strong> ships (planes running empty to keep <strong>the</strong><br />
slots)<br />
Working with sister unions<br />
Consider international fuel duty on aviation<br />
Tackle flags of convenience<br />
Similar approach to all forms of transport – better global st<strong>and</strong>ards, improved<br />
conditions, more regulation<br />
Q4 How can unions ensure that <strong>the</strong> transport system that emerges from <strong>the</strong> recession<br />
is a sustainable one?<br />
Race to bottom means road haulage under-cutting more environmentally<br />
friendly transport eg lost feeder service from Southampton to Grangemouth –<br />
gone from sea back to road –<strong>the</strong> road hauliers are undercutting everyone –<br />
forced rates right down. They will do it even if <strong>the</strong>y make £1 load.<br />
Intensifying competition, driving down st<strong>and</strong>ards<br />
Increased use of clearing houses by independent haulier<br />
Tackling this needs regulation <strong>and</strong> tariff controls <strong>and</strong> supporting increased<br />
funding for public transport.<br />
7.9 Orange Group<br />
Q1 Most workplaces not well organised need to deal issues talk about TU delivering<br />
sustainable. Social stainable is important for our industries. Need to home in on what<br />
policies need connection with workforce. Need well organised teams – green reps as<br />
add on will not work<br />
92
Q2 policies know what lifestyle need to follow this year - science or promote issues<br />
we know about . This is what we want - members involvement in Labour Party<br />
Q3 Use <strong>the</strong> institution we have ETF <strong>and</strong> ITF – Social Partnership can only exist<br />
where both social partners can operate a sanction – <strong>the</strong> only way forward is by<br />
organising workers – major priority EU Elections – are main priority<br />
Q4 Could be good impact Of recession – go back to planned transport ra<strong>the</strong>r than free<br />
market – NatEx equivalent of x ).5b in debt – left with coach network – create an<br />
equivalent of network Rail. -<br />
The conference concluded with closing remarks by Graham Stevenson, National<br />
Organiser <strong>Transport</strong><br />
93
Appendices<br />
Appendix 1<br />
Input-based measures: <strong>the</strong>se are based on estimates of <strong>the</strong> fuel purchased by /<br />
supplied to companies in particular sectors. They are industry-specific <strong>and</strong> apply only<br />
to UK-registered companies. Many of <strong>the</strong>se companies operate in o<strong>the</strong>r countries, as<br />
well as <strong>the</strong> UK, <strong>and</strong> so CO2 emissions from <strong>the</strong>ir freight transport operations are not<br />
confined to <strong>the</strong> UK.<br />
Output-based measures: <strong>the</strong>se are derived from estimates of <strong>the</strong> amount of freight<br />
movement, expressed ei<strong>the</strong>r in tonne-kms or vehicle-kms. They are activity- or modespecific<br />
<strong>and</strong> not confined to <strong>the</strong> operations of UK-registered businesses. These outputbased<br />
measures permit greater geographical targeting. For example, surveys of lorry<br />
traffic in <strong>the</strong> UK, comprising both British <strong>and</strong> foreign-registered vehicles, can be used<br />
to calculate total CO2 emissions from all trucks operating in <strong>the</strong> UK regardless of<br />
<strong>the</strong>ir origin <strong>and</strong> ownership.<br />
94
Appendix 2<br />
(i) Assumptions about <strong>the</strong> utilisation of vehicle capacity: Many estimates of CO 2<br />
emissions from freight transport are based on st<strong>and</strong>ard mode-specific ratios of grams<br />
of CO 2 per tonne-km. In deriving <strong>the</strong>se ratios, researchers often make assumptions<br />
about <strong>the</strong> utilisation of vehicle capacity. The amount of fuel consumed, <strong>and</strong> hence<br />
CO 2 emitted, is very sensitive to vehicle load factors, particularly in <strong>the</strong> case of road<br />
transport. Agencies promoting particular transport modes as being more ‘green’ have<br />
sometimes based CO 2 calculations for <strong>the</strong>ir mode on high levels of utilisation while<br />
using average load factor data for competing modes.<br />
(ii) Use of parameters derived from international studies: in <strong>the</strong> absence of carbon<br />
intensity data for freight transport operations in a particular country, researchers often<br />
rely on intensity values calculated for o<strong>the</strong>r countries or international averages. This is<br />
risky as <strong>the</strong>re are wide international differences in <strong>the</strong> nature <strong>and</strong> efficiency of freight<br />
transport operations, in <strong>the</strong> primary source of electricity (for rail <strong>and</strong> pipeline) <strong>and</strong> in<br />
<strong>the</strong> condition of transport infrastructure.<br />
(iii) National ‘emissions accounting’ typically quantifies CO 2 emissions by industry<br />
sector. Freight transport is an activity which is highly diffuse within an economy,<br />
often undertaken on an ancillary basis by companies whose main activity is not<br />
transport. This makes it difficult to obtain a comprehensive, crosssectoral measure of<br />
CO 2 emissions from freight transport.<br />
(iv) Use of tonne-kms as <strong>the</strong> output measure for freight transport: Analyses of <strong>the</strong><br />
carbon intensity of freight transport invariably express CO 2 emissions as a ratio of<br />
tonne-kms, i.e. weight transported multiplied by <strong>the</strong> distance travelled. For some<br />
modes <strong>and</strong> commodity types it would be more appropriate to measure freight<br />
movement in terms of volume ra<strong>the</strong>r than weight. Lack of government statistics on <strong>the</strong><br />
cubic volume of freight makes this impossible, however.<br />
(v) Movement of freight in passenger vehicles: A significant amount of freight<br />
(mainly shopping) is moved in cars or public transport vehicles. This does not appear<br />
in any official statistics <strong>and</strong> so has not been included in CO 2 calculations for freight<br />
transport. With <strong>the</strong> growth of online shopping, responsibility for <strong>the</strong> ‘last mile’<br />
delivery to <strong>the</strong> home is transferring from <strong>the</strong> consumer to <strong>the</strong> retailer <strong>and</strong> or <strong>the</strong><br />
delivery company. The movement of online retail purchases in vans increases its<br />
statistical visibility. Associated CO 2 emissions are <strong>the</strong>n included in environmental<br />
audits for <strong>the</strong> freight transport sector. The integration of passenger <strong>and</strong> freight<br />
movement in <strong>the</strong> same vehicles also complicates CO 2 auditing in <strong>the</strong> aviation sector.<br />
A large proportion of air cargo moves in <strong>the</strong> bellyholds of passenger aircraft, making<br />
it difficult to decide how much of a plane’s CO 2 emissions should be attributed to <strong>the</strong><br />
airfreight.<br />
(vi) CO 2 <strong>and</strong> o<strong>the</strong>r global warming gases: CO 2 is only one of several gases which<br />
contribute to global warming. It is estimated to account for around 84% of <strong>the</strong> global<br />
warming impact of <strong>the</strong> transport sector in <strong>the</strong> UK. This report is solely concerned with<br />
CO 2 emissions from freight transport operations <strong>and</strong> ignores emissions of o<strong>the</strong>r global<br />
warming gases, such as methane <strong>and</strong> nitrous oxide.<br />
95
Appendix 3<br />
GREENING YOUR WORKPLACE – SOME PRACTICAL TIPS FOR UNITE<br />
TRANSPORT WORKERS<br />
Elect <strong>Union</strong> Green Reps This can be<br />
a st<strong>and</strong>alone role, or held by existing<br />
union reps - shop stewards, <strong>Union</strong><br />
Learning Reps, or H&S reps, as well as<br />
those new to (or returning to) activism.<br />
<strong>Unite</strong> wants union reps to have <strong>the</strong><br />
same legal right to represent members<br />
on environmental issues, as <strong>the</strong>y<br />
already do on H&S <strong>and</strong> learning<br />
issues. In <strong>the</strong> mean time, in some<br />
workplaces <strong>Union</strong> Green Reps have<br />
negotiated to be recognized <strong>and</strong><br />
consulted, <strong>and</strong> for facilities. It’s<br />
important to work closely with<br />
stewards <strong>and</strong> o<strong>the</strong>r existing reps - eg<br />
ULRs have promoted environmental<br />
issues within <strong>the</strong> learning agenda, <strong>and</strong><br />
H&S Reps have brought <strong>the</strong>ir<br />
knowledge of <strong>the</strong> employers legal<br />
duties, eg on temperature &<br />
equipment.<br />
In well organised workplaces, <strong>Union</strong><br />
environmental reps can act as a conduit<br />
between management <strong>and</strong><br />
members/staff, feeding concerns,<br />
suggestions <strong>and</strong> responses in both<br />
directions, <strong>and</strong> working with <strong>the</strong><br />
workforce <strong>and</strong> management to develop<br />
best environmental practice. They can<br />
help review or shape environmental<br />
policies <strong>and</strong> initiatives, <strong>and</strong> help ensure<br />
that such policies are properly<br />
understood, fit for purpose, <strong>and</strong> can be<br />
put into practical effect in a fair way at<br />
each workplace.<br />
Getting <strong>the</strong> union message across<br />
Who is responsible for environmental<br />
issues, on <strong>the</strong> management side?<br />
There is often already a committee or<br />
working party (ei<strong>the</strong>r at local or group<br />
level) combining roles like Facilities /<br />
Energy <strong>Environment</strong> manager,<br />
Corporate Social Responsibility/PR<br />
dept, <strong>and</strong> possibly Human Resources<br />
(especially if <strong>the</strong>y are also looking at<br />
travel). It is important to work with<br />
<strong>the</strong> existing union structures to take <strong>the</strong><br />
environmental agenda forward,<br />
whe<strong>the</strong>r by ensuring this item is on <strong>the</strong><br />
JNC’s agenda, <strong>the</strong> H&S committee is<br />
given an exp<strong>and</strong>ed remit, that <strong>the</strong>re is a<br />
specific environment committee set up,<br />
or getting an existing committee to<br />
include trade union representation.<br />
<strong>Environment</strong>al Agreement It is also<br />
important to formalise trade union<br />
involvement in environmental issues,<br />
where possible, through environmental<br />
agreements. An agreement could cover<br />
<strong>the</strong> mechanisms for union<br />
involvement, reps, facilities <strong>and</strong><br />
training; <strong>the</strong> issues to be covered;<br />
mutual responsibilities <strong>and</strong> procedures<br />
for dealing with issues; clear objectives<br />
<strong>and</strong> monitoring policies; <strong>and</strong> links with<br />
H&S <strong>and</strong> o<strong>the</strong>r policies <strong>and</strong> structures.<br />
There should be an emphasis on<br />
collective rewards <strong>and</strong> it should be<br />
made clear that disciplinary procedures<br />
will never be used to enforce<br />
environmental agreements. There is a<br />
draft model agreement in <strong>the</strong> free<br />
guide available from TUC Publications<br />
‘Go Green At Work’ For more ideas,<br />
see <strong>the</strong> checklist, overleaf. If you do<br />
negotiate an agreement on any<br />
environmental issue, be sure to send a<br />
copy to www.lrd.org.uk so that o<strong>the</strong>rs<br />
can benefit too.<br />
Training <strong>Unite</strong> runs national courses<br />
on <strong>the</strong> environment – contact your<br />
regional Education officer. There is<br />
also an online TUC course. A key role<br />
is to negotiate for on-site training for<br />
all members on energy efficiency,<br />
greener driving, etc. If courses are put<br />
on without union involvement <strong>the</strong>y<br />
may not properly meet people’s needs.<br />
96
Commitment from <strong>the</strong> top <strong>and</strong> <strong>the</strong><br />
grassroots is important. It’s linked to<br />
information availability - people at all<br />
levels are more likely to act if <strong>the</strong>y<br />
underst<strong>and</strong> <strong>the</strong> financial <strong>and</strong> local<br />
environmental impact, <strong>and</strong> <strong>the</strong>y may<br />
all have important information about<br />
causes <strong>and</strong> impacts. As well as union<br />
reps involvement, it’s important to<br />
have both a senior champion <strong>and</strong> an<br />
operational manager with clear<br />
responsibility to make this information<br />
transparent.<br />
Maintaining enthusiasm Remember<br />
that small steps add up to large<br />
impacts. If organisations achieve cost<br />
savings, a proportion could be reserved<br />
for fur<strong>the</strong>r ‘green’ investment, or for<br />
rewarding staff as a whole. You <strong>and</strong><br />
your branch could also get involved in<br />
campaigning, for example by lobbying<br />
your MP or affiliating to a group like<br />
<strong>the</strong> ‘Campaign Against Climate<br />
Change’.<br />
Communication We all look to o<strong>the</strong>rs<br />
for action - ‘I will if you will’ – but<br />
messages from <strong>the</strong> organisation about<br />
what it is doing, often become<br />
wallpaper. Workers want facts <strong>and</strong><br />
targets that <strong>the</strong>y can underst<strong>and</strong>, that<br />
focus on a particular area, that can be<br />
updated, <strong>and</strong> that are personally<br />
meaningful <strong>and</strong> tangible. For example,<br />
how does <strong>the</strong> company’s use of fuel<br />
<strong>and</strong> creation of climate changing<br />
emissions, compare to <strong>the</strong> amount that<br />
an individual produces in <strong>the</strong>ir home<br />
life?<br />
Communication needs to be 2-way,<br />
through reps, meetings, events,<br />
committees, posters, surveys <strong>and</strong><br />
newsletters. An important rule is that<br />
no-one should be made to feel guilty or<br />
threatened; <strong>the</strong> focus should be on<br />
removing barriers to ‘green’ behaviour.<br />
Open day Awareness raising events<br />
such as open days are great ways of<br />
getting people thinking about <strong>the</strong><br />
environment at home <strong>and</strong> at work.<br />
Some reps have shown <strong>the</strong> Al Gore<br />
film ‘An Inconvenient Truth’ during<br />
working hours, or have arranged for<br />
<strong>the</strong> local Friends of <strong>the</strong> Earth group, or<br />
council Energy Saving team, to come<br />
in to <strong>the</strong>ir workplace to give talks,<br />
advice <strong>and</strong> materials, which also<br />
resulted in new union members being<br />
recruited. Or you could invite a<br />
speaker from <strong>the</strong>se organisations along<br />
to <strong>the</strong> branch.<br />
Audit To be able to improve<br />
environmental impact, you need to<br />
know where you’re starting from – ie<br />
an audit of environmental<br />
performance. There are many different<br />
ways of auditing <strong>and</strong> measuring<br />
environmental performance for union<br />
purposes. The checklist overleaf gives<br />
some starting points.<br />
Finding out more - general<br />
Discover your environmental<br />
‘footprint’ at www.ecofoot.org <strong>and</strong><br />
encourage colleagues to do <strong>the</strong> same.<br />
Have a look at your employer’s reports<br />
<strong>and</strong> websites, particularly on<br />
‘Corporate Social Responsibility’.<br />
<strong>Unite</strong>’s research department can help<br />
with this.<br />
If you work for a large company,<br />
check out www.cdproject.net (Carbon<br />
Disclosure Project), which is a<br />
voluntary reporting st<strong>and</strong>ard. Any<br />
member of <strong>the</strong> public, including<br />
employees, has <strong>the</strong> right to request<br />
information about an organisation<br />
under <strong>the</strong> <strong>Environment</strong>al Information<br />
Regulations (<strong>and</strong> about public bodies<br />
under <strong>the</strong> Freedom of Information<br />
regulations) – see<br />
http://community.foe.co.uk/tools/right<br />
_to_know/ (very helpful. You may<br />
also be able to use <strong>the</strong> Information <strong>and</strong><br />
Consultation Regulations, or European<br />
Works Councils, see www.tuc.org.uk<br />
for more on this.<br />
www.netregs.gov.uk explains<br />
environmental regulations in plain<br />
97
language, <strong>and</strong> has a good section on<br />
<strong>the</strong> various environmental management<br />
schemes (EMAS, ISO14001, etc). See<br />
also www.epaw.co.uk.<br />
Finding out more – within your<br />
organisation<br />
Here are some suggestions for<br />
questions you might consider asking<br />
colleagues or management. To start<br />
with, pick one or two areas to focus on<br />
that particularly interest you or your<br />
colleagues, or that you think are<br />
important or could be ‘quick wins’.<br />
You might want to carry out a survey<br />
to assess <strong>the</strong> most important areas to<br />
your colleagues, to do a walk round<br />
inspection (perhaps with <strong>the</strong> H&S<br />
reps), or have a meeting to discuss<br />
what’s already been done <strong>and</strong> what’s<br />
outst<strong>and</strong>ing.<br />
1. Does <strong>the</strong> organisation publish<br />
it’s total ‘carbon footprint’?<br />
2. Does it publish any o<strong>the</strong>r<br />
‘environmental indicators’?<br />
3. Has <strong>the</strong> organisation had help<br />
from organisations like <strong>the</strong><br />
Carbon Trust (energy),<br />
Envirowise (waste/recycling),<br />
or <strong>the</strong> Energy Saving Trust<br />
(fleet)?<br />
4. Has it implemented <strong>the</strong>ir<br />
recommendations?<br />
5. Does it have written<br />
environmental policies <strong>and</strong> / or<br />
plan? Is it detailed enough?<br />
6. Is <strong>the</strong>re a commitment to seek<br />
ways of minimising <strong>the</strong> use of<br />
scarce resources including fuel,<br />
electricity, <strong>and</strong> raw materials,<br />
particularly disposable items?<br />
7. Do all <strong>the</strong>se plans cover social<br />
as well as environmental<br />
sustainability for example<br />
working time?<br />
8. Does it have an accredited<br />
environmental management<br />
scheme (e.g. ISO4001, EMAS,<br />
Carbon Trust Management<br />
Scheme?)<br />
9. Who has responsibility for<br />
progressing any plans / policies<br />
/ schemes?<br />
10. Is <strong>the</strong> union currently involved<br />
in decision making about what<br />
<strong>the</strong> priorities are?<br />
Possible workplace improvements<br />
1. Are <strong>the</strong>re automatic power<br />
reducing features eg on lights<br />
<strong>and</strong> pcs, power downs on idling<br />
vehicles?<br />
2. Are staff trained in more<br />
energy efficient working <strong>and</strong><br />
driving? Is <strong>the</strong> training<br />
appropriate, with union<br />
involvement?<br />
3. Is purchasing of goods,<br />
vehicles etc done in<br />
consultation with staff <strong>and</strong><br />
taking into account new energy<br />
<strong>and</strong> environmental st<strong>and</strong>ards,<br />
as well as labour st<strong>and</strong>ards?<br />
4. If <strong>the</strong>re are ‘eco-friendly’<br />
options on equipment, vehicles,<br />
etc, are staff trained to use <strong>the</strong>m<br />
properly?<br />
5. Is equipment, vehicles etc,<br />
regularly serviced <strong>and</strong> clearly<br />
labelled (obviously o<strong>the</strong>r<br />
regulations including H&S also<br />
apply here).<br />
6. Is <strong>the</strong> company changing it’s<br />
fleet to plug-in hybrid, electric,<br />
or hybrid vehicles? How<br />
quickly?<br />
98
7. Is it introducing more energy<br />
efficient vehicle design?<br />
8. If biodiesel is used, is it only<br />
recycled biodiesel (which is a<br />
genuinely renewable product)?<br />
9. Is it retro-fitting <strong>the</strong> existing<br />
vehicle fleet <strong>and</strong> buildings with<br />
more energy efficient<br />
measures?<br />
10. Is it working with <strong>the</strong> union to<br />
minimise unnecessary journeys,<br />
eg empty vehicles?<br />
11. Is it working with <strong>the</strong> union to<br />
minimise unnecessary weight<br />
on vehicles?<br />
12. Are any vehicles, equipment<br />
etc, left on when not in use?<br />
Why?<br />
13. Is temperature an issue, ei<strong>the</strong>r<br />
generally or at particular times<br />
of day?<br />
14. Are staff or passengers opening<br />
doors <strong>and</strong> windows, even when<br />
cooling/heating is operating?<br />
Why?<br />
15. Are <strong>the</strong> <strong>the</strong>rmostats in <strong>the</strong> right<br />
place <strong>and</strong> set to <strong>the</strong> right<br />
temperature (19-24 degrees)?<br />
16. Can workers control or<br />
influence <strong>the</strong> heating, cooling<br />
<strong>and</strong> lighting in <strong>the</strong>ir workplace?<br />
Can passengers? Are <strong>the</strong>re any<br />
issues here?<br />
17. Is lighting on in areas, or at<br />
times of day, when <strong>the</strong>re should<br />
be enough daylight? Why?<br />
Are windows dirty or<br />
insufficient?<br />
18. Does <strong>the</strong> business make any<br />
claims to be ‘greener’ than<br />
competitors?<br />
19. Is everything that can be,<br />
recycled?<br />
20. Are water saving measures in<br />
place?<br />
21. Is <strong>the</strong>re an up to date travel<br />
plan for transport to work,<br />
negotiated with <strong>the</strong> union?<br />
22. Are <strong>the</strong> catering arrangements<br />
ok, or is food over-processed<br />
<strong>and</strong> over-packaged?<br />
23. Does <strong>the</strong> organisation seek<br />
ways to support staff saving<br />
energy <strong>and</strong> resources at home?<br />
24. Is offsetting only carried out as<br />
a last resort, after looking at<br />
energy saving, <strong>and</strong> on-site<br />
renewable energy (eg wind<br />
turbines, solar water heating) or<br />
combined heat <strong>and</strong> power?<br />
GOVERNMENT TIPS FOR<br />
‘GREENER’ DRIVING<br />
Drive smoothly <strong>and</strong> slowly<br />
driving smoothly <strong>and</strong> at a<br />
slower speed can reduce fuel<br />
consumption<br />
<br />
check <strong>the</strong> road ahead, anticipate<br />
traffic <strong>and</strong> avoid harsh<br />
acceleration <strong>and</strong> braking<br />
stick to <strong>the</strong> speed limits - at 70<br />
miles per hour (mph) you could<br />
use up to 15 per cent more fuel<br />
than at 50 mph<br />
Change gears at <strong>the</strong> right time<br />
correct gear changing will save<br />
fuel <strong>and</strong> reduce your emissions<br />
<br />
a vehicle travelling at 37 mph<br />
in third gear uses 25 per cent<br />
more fuel than it would at <strong>the</strong><br />
same speed in fifth gear<br />
Stop <strong>and</strong> start less<br />
keeping <strong>the</strong> engine running or<br />
pumping <strong>the</strong> accelerator wastes<br />
fuel, increases engine wear <strong>and</strong><br />
increases emissions<br />
<br />
<br />
get in <strong>and</strong> go - modern engines<br />
are designed to be most<br />
efficient when you do this<br />
switch your engine off if you<br />
won't be moving for a while<br />
99
100