Estimating Farm Machinery Costs - National Ag Risk Education Library
Estimating Farm Machinery Costs - National Ag Risk Education Library
Estimating Farm Machinery Costs - National Ag Risk Education Library

Create successful ePaper yourself
Turn your PDF publications into a flip-book with our unique Google optimized e-Paper software.
<strong>Machinery</strong> Management<br />
<strong>Estimating</strong> <strong>Farm</strong> <strong>Machinery</strong> <strong>Costs</strong><br />
<strong>Machinery</strong> and equipment are major<br />
cost items in farm businesses. Larger<br />
machines, new technology, higher<br />
prices for parts and new machinery,<br />
and higher energy prices have<br />
caused machinery and power costs<br />
to rise in recent years.<br />
However, good managers can control<br />
machinery and power costs per acre.<br />
Making smart decisions about how<br />
to acquire machinery, when to trade,<br />
and how much capacity to invest in<br />
can reduce machinery costs by as<br />
much as $25 per acre. All of these<br />
decisions require accurate estimates<br />
of the costs of owning and operating<br />
farm machinery.<br />
<strong>Machinery</strong> <strong>Costs</strong><br />
<strong>Farm</strong> machinery costs can be divided<br />
into two categories: annual ownership<br />
costs, which occur regardless<br />
of machine use, and operating costs,<br />
which vary directly with the amount<br />
of machine use.<br />
The true value of some of these costs<br />
is not known until the machine is<br />
sold or worn out. But the costs<br />
can be estimated by making a few<br />
assumptions about machine life, annual<br />
use, and fuel and labor prices.<br />
This publication contains a worksheet<br />
that can be used to calculate<br />
costs for a particular machine or<br />
operation.<br />
An example problem will be used<br />
throughout this publication to illustrate<br />
the calculations. The example<br />
uses a 180-PTO horsepower diesel<br />
tractor with a list price of $110,000.<br />
Dealer discounts are assumed to<br />
reduce the actual purchase price to<br />
$93,500. An economic life of 15 years<br />
is assumed, and the tractor is expected<br />
to be used 400 hours per year.<br />
Ownership costs (also called fixed<br />
costs) include depreciation, interest<br />
(opportunity cost), taxes, insurance,<br />
and housing facilities.<br />
Depreciation<br />
Depreciation is a cost resulting from<br />
wear, obsolescence, and age of a machine.<br />
The degree of mechanical wear<br />
may cause the value of a<br />
particular machine to be somewhat<br />
above or below the average value<br />
for similar machines when it is traded<br />
or sold. The introduction of new<br />
technology or a major design change<br />
may make an older machine suddenly<br />
obsolete, causing a sharp decline in<br />
its remaining value. But age and accumulated<br />
hours of use usually<br />
are the most important factors in determining<br />
the remaining value of<br />
a machine.<br />
Before an estimate of annual depreciation<br />
can be calculated, an economic<br />
life for the machine and a salvage<br />
value at the end of the economic life<br />
must be specified. The economic life<br />
of a machine is the number of years<br />
for which costs are to be estimated.<br />
It often is less than the machine’s<br />
service life because most farmers<br />
trade a machine for a different one<br />
before it is completely worn out.<br />
A good rule of thumb is to use an<br />
economic life of 10 to 12 years for<br />
most new farm machines and a<br />
15-year life for tractors, unless it<br />
is known that the machine will be<br />
traded sooner.<br />
Salvage value is an estimate of the<br />
sale value of the machine at the end<br />
of its economic life. It is the amount<br />
the farmer can expect to receive as<br />
a trade-in allowance, an estimate of<br />
the used market value if he or she<br />
expects to sell the machine outright,<br />
or zero if the farmer plans to keep<br />
the machine until it is worn out.<br />
Estimates of the remaining value of<br />
tractors and other classes of farm<br />
machines as a percentage of new list<br />
price are listed in Tables 1a and 1b.<br />
Note that for tractors, combines,<br />
and forage harvesters the number<br />
of hours of annual use also is<br />
considered when estimating the<br />
remaining value. The factors were<br />
developed from published reports<br />
of used equipment auction values,<br />
and are estimates of the average<br />
“as-is” value of a class of machines<br />
in average mechanical condition at<br />
the farm. Actual market value will<br />
vary from these values depending<br />
on the condition of the machine, the<br />
current market for used machinery,<br />
and local preferences or dislikes for<br />
certain models.<br />
PM 710 Paper version Revised November 2001<br />
Electronic version Revised August 2005<br />
1
Table 1a. Remaining Salvage Value as Percent of New List Price<br />
30–79 hp Tractor 80–149 hp Tractor 150+ hp Tractor Combine, Forage Harvester<br />
Annual Hours 200 400 600 200 400 600 200 400 600 100 300 500<br />
<strong>Ag</strong>e<br />
1 65% 60% 56% 69% 68% 68% 69% 67% 66% 79% 69% 63%<br />
2 59% 54% 50% 62% 62% 61% 61% 59% 58% 67% 58% 52%<br />
3 54% 49% 46% 57% 57% 56% 55% 54% 52% 59% 50% 45%<br />
4 51% 46% 43% 53% 53% 52% 51% 49% 48% 52% 44% 39%<br />
5 48% 43% 40% 50% 49% 49% 47% 45% 44% 47% 39% 34%<br />
6 45% 40% 37% 47% 46% 46% 43% 42% 41% 42% 35% 30%<br />
7 42% 38% 35% 44% 44% 43% 40% 39% 38% 38% 31% 27%<br />
8 40% 36% 33% 42% 41% 41% 38% 36% 35% 35% 28% 24%<br />
9 38% 34% 31% 40% 39% 39% 35% 34% 33% 31% 25% 21%<br />
10 36% 32% 30% 38% 37% 37% 33% 32% 31% 28% 23% 19%<br />
11 35% 31% 28% 36% 35% 35% 31% 30% 29% 26% 20% 17%<br />
12 33% 29% 27% 34% 34% 33% 29% 28% 27% 23% 18% 15%<br />
13 32% 28% 25% 33% 32% 32% 27% 26% 25% 21% 16% 13%<br />
14 30% 27% 24% 31% 31% 30% 25% 24% 24% 19% 14% 12%<br />
15 29% 25% 23% 30% 29% 29% 24% 23% 22% 17% 13% 10%<br />
16 28% 24% 22% 28% 28% 27% 22% 21% 21% 16% 11% 9%<br />
17 26% 23% 21% 27% 27% 26% 21% 20% 19% 14% 10% 8%<br />
18 25% 22% 20% 26% 25% 25% 20% 19% 18% 13% 9% 7%<br />
19 24% 21% 19% 25% 24% 24% 19% 18% 17% 11% 8% 6%<br />
20 23% 20% 18% 24% 23% 23% 17% 17% 16% 10% 7% 5%<br />
Table 1b. Remaining Salvage Value as Percent of New List Price<br />
Machine <strong>Ag</strong>e Plows Other Tillage Planter, Drill, Sprayer Mower, Chopper Baler Swather, Rake Vehicle Others<br />
1 47% 61% 65% 47% 56% 49% 42% 69%<br />
2 44% 54% 60% 44% 50% 44% 39% 62%<br />
3 42% 49% 56% 41% 46% 40% 36% 56%<br />
4 40% 45% 53% 39% 42% 37% 34% 52%<br />
5 39% 42% 50% 37% 39% 35% 33% 48%<br />
6 38% 39% 48% 35% 37% 32% 31% 45%<br />
7 36% 36% 46% 33% 34% 30% 30% 42%<br />
8 35% 34% 44% 32% 32% 28% 29% 40%<br />
9 34% 31% 42% 31% 30% 27% 27% 37%<br />
10 33% 30% 40% 30% 28% 25% 26% 35%<br />
11 32% 28% 39% 28% 27% 24% 25% 33%<br />
12 32% 26% 38% 27% 25% 23% 24% 31%<br />
13 31% 24% 36% 26% 24% 21% 24% 29%<br />
14 30% 23% 35% 26% 22% 20% 23% 28%<br />
15 29% 22% 34% 25% 21% 19% 22% 26%<br />
16 29% 20% 33% 24% 20% 18% 21% 25%<br />
17 28% 19% 32% 23% 19% 17% 20% 24%<br />
18 27% 18% 30% 22% 18% 16% 20% 22%<br />
19 27% 17% 29% 22% 17% 16% 19% 21%<br />
20 26% 16% 29% 21% 16% 15% 19% 20%<br />
Source: American Society of <strong>Ag</strong>ricultural Engineers, 1997.<br />
2
The appropriate values in Tables 1a<br />
and 1b should be multiplied by the<br />
current list price of a replacement<br />
machine of equivalent size and type,<br />
even if the actual machine was or will<br />
be purchased for less than list price.<br />
For the 180-hp tractor in the<br />
example, the salvage value after<br />
15 years with 400 hours of annual<br />
use is estimated as 23 percent<br />
of the new list price:<br />
Salvage value = current list price<br />
remaining value factor (Table 1)<br />
= $110,000 23%<br />
= $25,300<br />
Total depreciation =<br />
purchase price – salvage value<br />
= $93,500 – $25,300<br />
= $68,200<br />
Interest<br />
If the operator borrows money to buy<br />
a machine, the lender will determine<br />
the interest rate to charge. But if the<br />
farmer uses his or her own capital,<br />
the rate will depend on the opportunity<br />
cost for that capital elsewhere<br />
in the farm business. If only part of<br />
the money is borrowed, an average<br />
of the two rates should be used.<br />
For the example we will assume<br />
an average interest rate of 8 percent.<br />
Inflation reduces the real cost of<br />
investing capital in farm machinery,<br />
however, because loans can be repaid<br />
with cheaper dollars. The interest rate<br />
can be adjusted by subtracting the<br />
expected rate of inflation. For our<br />
example we will assume a 3 percent<br />
inflation rate, so the adjusted or<br />
“real” interest rate is 5 percent.<br />
The joint costs of depreciation and<br />
interest can be calculated by using<br />
a capital recovery factor. Capital<br />
recovery is the number of dollars that<br />
would have to be set aside each year<br />
just to repay the value lost due to<br />
depreciation and pay interest costs.<br />
Table 2 shows capital recovery factors<br />
for various combinations of real<br />
interest rates and economic lives.<br />
For the example, the capital recovery<br />
factor for 15 years and 5 percent is<br />
.096. The annual capital recovery<br />
cost is found by first multiplying the<br />
appropriate capital recovery factor<br />
by the total depreciation, then adding<br />
the product of the interest rate and the<br />
salvage value to it.<br />
For the example values given above:<br />
Capital recovery = (total depreciation<br />
capital recovery factor) + (salvage<br />
value interest rate)<br />
= ($68,200 .096) + ($25,300 .05)<br />
= $6,547 + $1,265<br />
= $7,812/year<br />
Table 2. Capital Recovery Factors<br />
Interest<br />
Rate 2% 3% 4% 5% 6% 7% 8% 9% 10% 11% 12% 13% 14% 15%<br />
Years<br />
1 1.020 1.030 1.040 1.050 1.060 1.070 1.080 1.090 1.100 1.110 1.120 1.130 1.140 1.150<br />
2 0.515 0.523 0.530 0.538 0.545 0.553 0.561 0.568 0.576 0.584 0.592 0.599 0.607 0.615<br />
3 0.347 0.354 0.360 0.367 0.374 0.381 0.388 0.395 0.402 0.409 0.416 0.424 0.431 0.438<br />
4 0.263 0.269 0.275 0.282 0.289 0.295 0.302 0.309 0.315 0.322 0.329 0.336 0.343 0.350<br />
5 0.212 0.218 0.225 0.231 0.237 0.244 0.250 0.257 0.264 0.271 0.277 0.284 0.291 0.298<br />
6 0.179 0.185 0.191 0.197 0.203 0.210 0.216 0.223 0.230 0.236 0.243 0.250 0.257 0.264<br />
7 0.155 0.161 0.167 0.173 0.179 0.186 0.192 0.199 0.205 0.212 0.219 0.226 0.233 0.240<br />
8 0.137 0.142 0.149 0.155 0.161 0.167 0.174 0.181 0.187 0.194 0.201 0.208 0.216 0.223<br />
9 0.123 0.128 0.134 0.141 0.147 0.153 0.160 0.167 0.174 0.181 0.188 0.195 0.202 0.210<br />
10 0.111 0.117 0.123 0.130 0.136 0.142 0.149 0.156 0.163 0.170 0.177 0.184 0.192 0.199<br />
11 0.102 0.108 0.114 0.120 0.120 0.133 0.140 0.147 0.154 0.161 0.168 0.176 0.183 0.191<br />
12 0.095 0.100 0.107 0.113 0.119 0.126 0.133 0.140 0.147 0.154 0.161 0.169 0.177 0.184<br />
13 0.088 0.094 0.100 0.106 0.113 0.120 0.127 0.134 0.141 0.148 0.156 0.163 0.171 0.179<br />
14 0.083 0.089 0.095 0.101 0.108 0.114 0.121 0.128 0.136 0.143 0.151 0.159 0.167 0.175<br />
15 0.078 0.084 0.090 0.096 0.103 0.110 0.117 0.124 0.131 0.139 0.147 0.155 0.163 0.171<br />
16 0.074 0.080 0.086 0.092 0.099 0.106 0.113 0.120 0.128 0.136 0.143 0.151 0.160 0.168<br />
17 0.070 0.076 0.082 0.089 0.095 0.102 0.110 0.117 0.125 0.132 0.140 0.149 0.157 0.165<br />
18 0.067 0.073 0.079 0.086 0.092 0.099 0.107 0.114 0.122 0.130 0.138 0.146 0.155 0.163<br />
19 0.064 0.070 0.076 0.083 0.090 0.097 0.104 0.112 0.120 0.128 0.136 0.144 0.153 0.161<br />
20 0.061 0.067 0.074 0.080 0.087 0.094 0.102 0.110 0.117 0.126 0.134 0.142 0.151 0.160<br />
3
Taxes, Insurance,<br />
and Housing (TIH)<br />
These three costs usually are much<br />
smaller than depreciation and<br />
interest, but they need to be considered.<br />
Property taxes on farm machinery<br />
have been phased out in Iowa,<br />
except for very large inventories. For<br />
states that do have property taxes on<br />
farm machinery, a cost estimate equal<br />
to 1 percent of the purchase price<br />
often is used.<br />
Insurance should be carried on farm<br />
machinery to allow for replacement<br />
in case of a disaster such as a fire or<br />
tornado. If insurance is not carried,<br />
the risk is assumed by the rest of the<br />
farm business. Current rates for farm<br />
machinery insurance in Iowa range<br />
from $4 to $6 per $1,000 of valuation,<br />
or about 0.5 percent of the<br />
purchase price.<br />
There is a tremendous variation in<br />
housing for farm machinery. Providing<br />
shelter, tools, and maintenance<br />
equipment for machinery will result<br />
in fewer repairs in the field and less<br />
deterioration of mechanical parts and<br />
appearance from weathering. That<br />
should produce greater reliability in<br />
the field and a higher trade-in value.<br />
An estimated charge of 0.5 percent<br />
of the purchase price is suggested for<br />
housing costs.<br />
To simplify calculating TIH costs,<br />
they can be lumped together as<br />
1 percent of the purchase price where<br />
property taxes are not significant.<br />
TIH = 0.01 purchase price<br />
For our tractor example, these costs<br />
would be:<br />
TIH = 0.01 $93,500<br />
= $935/year<br />
Total Ownership Cost<br />
The estimated costs of depreciation,<br />
interest, taxes, insurance, and<br />
housing are added together to find<br />
the total ownership cost. For our<br />
example tractor this adds up to<br />
$8,747 per year. This is almost<br />
10 percent of the original cost of<br />
the tractor.<br />
Total ownership cost = $7,812 + $935<br />
= $8,747/year<br />
If the tractor is used 400 hours per<br />
year, the total ownership cost per<br />
hour is:<br />
Ownership cost/hour =<br />
$8,747 400 hours<br />
= $21.87/hour<br />
Operating costs (also called variable<br />
costs) include repairs and maintenance,<br />
fuel, lubrication, and<br />
operator labor.<br />
Repairs and Maintenance<br />
Repair costs occur because of routine<br />
maintenance, wear and tear, and<br />
accidents. Repair costs for a particular<br />
type of machine vary widely from one<br />
geographic region to another because<br />
of soil type, rocks, terrain, climate,<br />
and other conditions. Within a local<br />
area, repair costs vary from farm to<br />
farm because of different management<br />
policies and operator skill.<br />
The best data for estimating repair<br />
costs are the operator’s own records<br />
of past repair expenses. Good records<br />
indicate whether a machine has<br />
had above or below average repair<br />
costs and when major overhauls<br />
may be needed. They also will<br />
provide information about the<br />
operator’s maintenance program and<br />
mechanical ability. Without such<br />
data, repair costs must be estimated<br />
from average experience.<br />
The values in Table 3 show the<br />
relationship between the sum of all<br />
repair costs for a machine and the<br />
total hours of use during its lifetime,<br />
based on historical repair data. The<br />
total accumulated repair costs are<br />
then calculated as a percentage of<br />
the current list price of the machine,<br />
because repair and maintenance costs<br />
usually change at about the same rate<br />
as new list prices.<br />
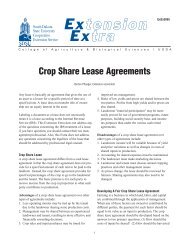
Figure 1 shows how repair costs<br />
accumulate for two-wheel drive<br />
tractors. Notice the shape of the<br />
graph. The slope of the curve<br />
increases as the number of hours<br />
of use increases. This indicates that<br />
repair costs are low early in the life<br />
of a machine, but increase rapidly as<br />
the machine accumulates more hours<br />
of operation.<br />
Because the tractor in the example<br />
will be used about 400 hours per year,<br />
it will have accumulated about 6,000<br />
hours of operation by the end of its<br />
15-year economic life (400 hours <br />
15 years = 6,000 hours). According to<br />
Table 3, after 6,000 hours of use, total<br />
accumulated repair costs for a twowheel<br />
drive tractor will be equal to<br />
about 25 percent of its new list price.<br />
Therefore, total accumulated repairs<br />
can be estimated to be:<br />
Accumulated repairs =<br />
0.25 $110,000<br />
= $27,500<br />
The average repair cost per hour can<br />
be calculated by dividing the total<br />
accumulated repair cost by the total<br />
accumulated hours:<br />
Repair cost/hour =<br />
$27,500 6,000 hours<br />
= $4.58/hour<br />
4
Table 3. Accumulated Repair <strong>Costs</strong> as a Percentage of New List Price<br />
Type of Machine Accumulated Hours 1,000 2,000 3,000 4,000 5,000 6,000 7,000 8,000 9,000 10,000<br />
Two-wheel drive tractor 1% 3% 6% 11% 18% 25% 34% 45% 57% 70%<br />
Four-wheel drive tractor 0% 1% 3% 5% 8% 11% 15% 19% 24% 30%<br />
Type of Machine Accumulated Hours 200 400 600 800 1,000 1,200 1,400 1,600 1,800 2,000<br />
Moldboard plow 2% 6% 12% 19% 29% 40% 53% 68% 84% 101%<br />
Heavy-duty disk 1% 4% 8% 12% 18% 25% 32% 40% 49% 58%<br />
Tandem disk 1% 4% 8% 12% 18% 25% 32% 40% 49% 58%<br />
Chisel plow 3% 8% 14% 20% 28% 36% 45% 54% 64% 74%<br />
Field cultivator 3% 7% 13% 20% 27% 35% 43% 52% 61% 71%<br />
Harrow 3% 7% 13% 20% 27% 35% 43% 52% 61% 71%<br />
Roller-packer, mulcher 2% 5% 8% 12% 16% 20% 25% 29% 34% 39%<br />
Rotary hoe 2% 6% 11% 17% 23% 30% 37% 44% 52% 61%<br />
Row crop cultivator 0% 2% 6% 10% 17% 25% 36% 48% 62% 78%<br />
Type of Machine Accumulated Hours 200 400 600 800 1,000 1,200 1,400 1,600 1,800 2,000<br />
Corn picker 0% 2% 4% 8% 14% 21% 30% 41% 54% 69%<br />
Combine (pull) 0% 1% 4% 7% 12% 18% 26% 35% 46% 59%<br />
Potato harvester 2% 5% 9% 14% 19% 25% 30% 37% 43% 50%<br />
Mower-conditioner 1% 4% 8% 13% 18% 24% 31% 38% 46% 55%<br />
Mower-conditioner (rotary) 1% 3% 6% 10% 16% 23% 31% 41% 52% 64%<br />
Rake 2% 5% 8% 12% 17% 22% 27% 33% 39% 45%<br />
Rectangular baler 1% 4% 9% 15% 23% 32% 42% 54% 66% 80%<br />
Large square baler 1% 2% 4% 7% 10% 14% 18% 23% 29% 35%<br />
Forage harvester (pull) 1% 3% 7% 10% 15% 20% 26% 32% 38% 45%<br />
Type of Machine Accumulated Hours 300 600 900 1,200 1,500 1,800 2,100 2,40 2,700 3,000<br />
Forage harvester (SP) 0% 1% 2% 4% 7% 10% 13% 17% 22% 27%<br />
Combine (SP) 0% 1% 3% 6% 9% 14% 19% 25% 32% 40%<br />
Windrower (SP) 1% 2% 5% 9% 14% 19% 26% 35% 44% 54%<br />
Cotton picker (SP) 1% 4% 9% 15% 23% 32% 42% 53% 66% 79%<br />
Type of Machine Accumulated Hours 100 200 300 400 500 600 700 800 900 1,000<br />
Mower (sickle) 1% 3% 6% 10% 14% 19% 25% 31% 38% 46%<br />
Mower (rotary) 0% 2% 4% 7% 11% 16% 22% 28% 36% 44%<br />
Large round baler 1% 2% 5% 8% 12% 17% 23% 29% 36% 43%<br />
Sugar beet harvester 3% 7% 12% 18% 24% 30% 37% 44% 51% 59%<br />
Rotary tiller 0% 1% 3% 6% 9% 13% 18% 23% 29% 36%<br />
Row crop planter 0% 1% 3% 5% 7% 11% 15% 20% 26% 32%<br />
Grain drill 0% 1% 3% 5% 7% 11% 15% 20% 26% 32%<br />
Fertilizer spreader 3% 8% 13% 19% 26% 32% 40% 47% 55% 63%<br />
Type of Machine Accumulated Hours 200 400 600 800 1,000 1,200 1,400 1,600 1,800 2,000<br />
Boom-type sprayer 5% 12% 21% 31% 41% 52% 63% 76% 88% 101%<br />
Air-carrier sprayer 2% 5% 9% 14% 20% 27% 34% 42% 51% 61%<br />
Bean puller-windrower 2% 5% 9% 14% 20% 27% 34% 42% 51% 61%<br />
Stalk chopper 3% 8% 14% 20% 28% 36% 45% 54% 64% 74%<br />
Forage blower 1% 4% 9% 15% 22% 31% 40% 51% 63% 77%<br />
Wagon 1% 4% 7% 11% 16% 21% 27% 34% 41% 49%<br />
Forage wagon 2% 6% 10% 14% 19% 24% 29% 35% 41% 47%<br />
Source: American Society of <strong>Ag</strong>ricultural Engineers, 1996.<br />
5
% of list price<br />
70<br />
65<br />
60<br />
55<br />
50<br />
45<br />
40<br />
35<br />
30<br />
25<br />
20<br />
15<br />
10<br />
5<br />
0<br />
1,000 2,000 3,000 4,000 5,000 6,000 7,000 8,000 9,000 10,000<br />
Accumulated hours of use<br />
Figure 1. Accumulated repair costs for two-wheel drive tractor<br />
Fuel<br />
Fuel costs can be estimated in two<br />
ways. Extension publication PM 709,<br />
Fuel Required for Field Operations, lists<br />
average fuel use in gallons per acre<br />
for many field operations. Those<br />
figures can be multiplied by the fuel<br />
cost per gallon to calculate the<br />
average fuel cost per acre.<br />
For example, if the average amount of<br />
diesel fuel required to harvest an acre<br />
of corn silage is 3.25 gallons, at a cost<br />
of $1 per gallon, then the average fuel<br />
cost per acre is $3.25.<br />
Average fuel consumption (in gallons<br />
per hour) for farm tractors on a yearround<br />
basis without reference to<br />
any specific implement also can be<br />
estimated with these equations:<br />
0.060 maximum PTO horsepower<br />
for gasoline engines<br />
0.044 maximum PTO horsepower<br />
for diesel engines<br />
For our 180-horsepower diesel<br />
tractor example:<br />
Average diesel fuel consumption =<br />
0.044 180 horsepower<br />
= 7.92 gallons/hour<br />
Average fuel cost/hour =<br />
7.92 gallons/hour $1.00/gallon =<br />
$7.92/hour<br />
Lubrication<br />
Surveys indicate that total lubrication<br />
costs on most farms average about<br />
15 percent of fuel costs. Therefore,<br />
once the fuel cost per hour has been<br />
estimated, it can be multiplied by<br />
0.15 to estimate total lubrication<br />
costs.<br />
For our tractor example, average fuel<br />
cost was $7.92 per hour, so average<br />
lubrication cost would be:<br />
Lubrication = 0.15 $7.92<br />
= $1.19/hour<br />
Labor<br />
Because different size machines<br />
require different quantities of labor to<br />
accomplish such tasks as planting or<br />
harvesting, it is important to consider<br />
labor costs in machinery analysis.<br />
Labor cost also is an important<br />
consideration in comparing ownership<br />
to custom hiring.<br />
Actual hours of labor usually<br />
exceed field machine time by 10 to<br />
20 percent, because of travel time<br />
and the time required to lubricate and<br />
service machines. Consequently, labor<br />
costs can be estimated by multiplying<br />
the labor wage rate times 1.1 or 1.2.<br />
Using a labor value of $10 per hour<br />
for our tractor example:<br />
Labor cost/hour = $10.00 1.1<br />
= $11.00<br />
Different wage rates can be used for<br />
operations requiring different levels<br />
of operator skill.<br />
Total Operating Cost<br />
Repair, fuel, lubrication, and labor<br />
costs are added to calculate total<br />
operating cost. For the tractor<br />
example, total operating cost was<br />
$18.09 per hour:<br />
Total operating cost =<br />
$4.58 + $7.92 + $1.19 + $11.00<br />
= $24.69/hour<br />
Total Cost<br />
After all costs have been estimated,<br />
the total ownership cost per hour can<br />
be added to the operating cost per<br />
hour to calculate total cost per hour<br />
to own and operate the machine.<br />
Total cost per hour for our example<br />
tractor was:<br />
Total cost = $21.87 + $24.69<br />
= $46.56/hour<br />
Implement <strong>Costs</strong><br />
<strong>Costs</strong> for implements or attachments<br />
that depend on tractor power are<br />
estimated in the same way as for the<br />
example tractor, except that there are<br />
no fuel, lubrication, or labor costs<br />
involved. An example follows.<br />
6
Used <strong>Machinery</strong><br />
<strong>Costs</strong> for used machinery can be<br />
estimated by using the same procedure<br />
shown for new machinery.<br />
However, the fixed costs usually<br />
will be lower because the original<br />
cost of the machine will be lower.<br />
Repair costs usually will be higher<br />
because of the greater hours of<br />
accumulated use. Therefore, the<br />
secret to successful used machinery<br />
economics is to balance higher hourly<br />
repair costs against lower hourly fixed<br />
costs. If the machine’s condition is<br />
misjudged and the repair costs are<br />
higher than anticipated, or if too high<br />
a price is paid for the machine so<br />
that fixed costs are not as low as<br />
anticipated, the total hourly costs of<br />
a used machine may be as high as or<br />
higher than those of a new machine.<br />
As an example of estimating costs for<br />
a used machine, assume a farmer just<br />
bought a 6-year-old 28-foot tandem<br />
disk for $11,000. It appeared to<br />
be clean and in good mechanical<br />
condition. If the farmer does not<br />
know for sure how many hours<br />
of accumulated use the disk has, it<br />
can be estimated by multiplying its<br />
age (6 years) by the farmer’s own<br />
expected annual use (100 hours per<br />
year), or 600 hours.<br />
What is the estimated total cost of the<br />
disk over the next 8 years? From<br />
Table 1b, the expected salvage value<br />
at the end of 13 years is 24 percent of<br />
the current list price of an equivalent<br />
machine (estimated to be $30,000),<br />
or $7,200.<br />
The capital recovery factor for 8 years<br />
and a 5 percent real interest rate is<br />
.155 (Table 2). Capital recovery<br />
costs are:<br />
Capital recovery = .155 ($11,000 –<br />
$7,200) + ($7,200 .05)<br />
= $589 + $360<br />
= $949/year<br />
For taxes, insurance and housing:<br />
TIH = 0.01 $11,000<br />
= $110/year<br />
Total fixed costs = $949 + $110<br />
= $1,059/year<br />
If the disk is used an average of<br />
100 hours per year:<br />
Ownership cost/hour =<br />
$1,059 100 hours<br />
= $10.59/hour<br />
Use Table 3 to estimate average repair<br />
costs. If the farmer intends to keep<br />
this disk for 8 more years, the<br />
accumulated hours of use after that<br />
time will be:<br />
Accumulated hours = 600 + (100<br />
hours/yr 8 years)<br />
= 1,400 hours<br />
Now, using Table 3, note that the<br />
accumulated repair cost for a tandem<br />
disk after 600 hours is 8 percent of<br />
the new list price. After 1,400 hours it<br />
is estimated at 32 percent. Thus, the<br />
accumulated costs from 600 to 1,400<br />
hours can be estimated at 32 percent<br />
minus 8 percent, or 24 percent of the<br />
new list price. If the list price for a<br />
28-foot tandem disk is $30,000, the<br />
repair costs for the next 8 years are<br />
estimated to be:<br />
Repair costs = .24 $30,000<br />
= $7,200<br />
The repair cost per hour is estimated<br />
to be:<br />
Repair cost per hour = $7,200 <br />
(1,400 – 600) hours<br />
= $7,200 800 hours<br />
= $9.00/hour<br />
Other variable costs, such as fuel,<br />
lubrication, and labor, already have<br />
been included in the variable costs for<br />
the tractor, so the total cost per hour<br />
for the disk is simply the sum of the<br />
ownership costs per hour and the<br />
repair costs per hour:<br />
Total cost = $10.59 + $9.00<br />
= $19.59/hour<br />
When estimating future costs for a<br />
machine that has been owned for<br />
several years, start with the best<br />
estimate of the current market value<br />
of the machine instead of its original<br />
purchase price, or use the salvage<br />
value factor in Table 1a or 1b to<br />
estimate its current value.<br />
Total <strong>Costs</strong> per Operation<br />
Tractor costs must be added to<br />
the implement costs to determine<br />
the combined total cost per hour<br />
of operating the machine. In the<br />
example:<br />
Total cost = $46.56 + 19.59<br />
= $66.15/hour<br />
Finally, total cost per hour can be<br />
divided by the hourly work rate in<br />
acres per hour or tons per hour to<br />
calculate the total cost per acre or<br />
per ton.<br />
The hourly work rate or field capacity<br />
of an implement or self-propelled<br />
machine can be estimated from<br />
the effective width of the machine<br />
(in feet), its speed across the field<br />
(in miles per hour), and its field<br />
efficiency (in percentage). The field<br />
efficiency is a factor that adjusts<br />
for time lost due to turning at<br />
the end of the field, overlapping,<br />
making adjustments to the machine,<br />
and filling or emptying tanks<br />
and hoppers.<br />
7
Field capacity (in acres per hour) is<br />
calculated by:<br />
(width speed field efficiency)<br />
8.25<br />
For example, if the 28-foot disk can<br />
be pulled at 6.0 miles per hour with<br />
a field efficiency of 79 percent, the<br />
estimated field capacity is:<br />
Field capacity = (28 6.0 79%)<br />
8.25<br />
= 16 acres/hour<br />
Publication PM 696, <strong>Estimating</strong><br />
Field Capacity of <strong>Farm</strong> Machines,<br />
has typical accomplishment rates<br />
for different types and sizes of<br />
farm machines.<br />
If the 28-foot disk in the example can<br />
cover 16 acres per hour, the total cost<br />
per acre for disking is:<br />
Total cost per acre =<br />
$66.15 16 acres<br />
= $4.13/acre<br />
<strong>Costs</strong> for operations involving selfpropelled<br />
machines can be calculated<br />
by treating the self-propelled unit as a<br />
power unit, and the harvesting head<br />
or other attachment as an implement.<br />
Income Tax Considerations<br />
The tax treatment of different methods<br />
of acquiring machine services is a<br />
major factor in evaluating machine<br />
costs. If a machine is purchased, all<br />
operating expenses except unpaid<br />
labor are deductible when determining<br />
income tax liability. Housing<br />
expenses, taxes, insurance, interest<br />
payments made on a loan to finance<br />
the machine purchase, and depreciation<br />
also are tax deductible.<br />
Depreciation for tax purposes is<br />
calculated quite differently from<br />
economic depreciation due to the<br />
actual decline in value of a machine,<br />
however. Tax depreciation methods<br />
reduce salvage value to zero after a<br />
few years for most machines. Tax<br />
depreciation expense is useful for<br />
calculating the tax savings that result<br />
from a machinery purchase, but<br />
should not be used to estimate true<br />
economic costs.<br />
Specific rules and regulations on<br />
deductible costs and depreciation<br />
are discussed in the <strong>Farm</strong>er’s Tax<br />
Guide, published by the Internal<br />
Revenue Service.<br />
Other publications that will help you make good machinery management<br />
decisions are:<br />
PM 696 <strong>Estimating</strong> Field Capacity of <strong>Farm</strong> Machines<br />
PM 709 Fuel Required for Field Operations<br />
PM 786 Combine Ownership or Custom Hire<br />
PM 787 Acquiring <strong>Farm</strong> <strong>Machinery</strong> Services: Ownership, Custom Hire,<br />
Rental, Leasing<br />
PM 952 <strong>Farm</strong> <strong>Machinery</strong> Selection<br />
PM 1373 Joint <strong>Machinery</strong> Ownership<br />
PM 1450 Transferring Ownership of <strong>Farm</strong> <strong>Machinery</strong><br />
PM 1860 Replacement Strategies for <strong>Farm</strong> <strong>Machinery</strong><br />
PM 1874 Fieldwork Days in Iowa<br />
8
Example Worksheet for <strong>Estimating</strong> <strong>Farm</strong> <strong>Machinery</strong> <strong>Costs</strong><br />
Tractor or<br />
Implement or<br />
Information Power Unit Attachment<br />
Machine ________________ 180-hp tractor<br />
________________<br />
28-foot disk<br />
a. Current list price of a comparable replacement machine<br />
$110,000<br />
________________<br />
$30,000<br />
________________<br />
b. Purchase price or current used value of the machine<br />
$93,500<br />
________________<br />
$11,000<br />
________________<br />
c. Accumulated hours to date (zero for a new machine)<br />
0 hr.<br />
________________<br />
600 hr.<br />
________________<br />
d. Economic life, years of ownership remaining<br />
15 yr.<br />
________________<br />
8 yr.<br />
________________<br />
e. Interest rate, % (cost of capital minus inflation)<br />
5%<br />
________________<br />
5%<br />
________________<br />
f. Annual use, acres<br />
1,600 acres<br />
______________<br />
g. Field capacity, acres/hr. or tons/hr.*<br />
16 acres/hr.<br />
_______________<br />
h. Annual use, hours (f g for implement)<br />
400 hr.<br />
________________<br />
100 hr.<br />
________________<br />
i. Engine or PTO horsepower<br />
180 hp.<br />
________________<br />
j. Fuel price<br />
$1.00/gal.<br />
________________<br />
k. <strong>Machinery</strong> labor rate<br />
$10/hr.<br />
________________<br />
<strong>Estimating</strong> Ownership <strong>Costs</strong><br />
1. Remaining value (% from Table 1) list price a<br />
23%<br />
____________<br />
$25,300<br />
________________<br />
24%<br />
____________<br />
$7,200<br />
________________<br />
2. Total depreciation = (b – 1)<br />
$68,200<br />
________________<br />
$3,800<br />
________________<br />
3. Capital recovery factor (from Table 2)<br />
.096<br />
________________<br />
.155<br />
________________<br />
4. Capital recovery = (2 3) + (e 1)<br />
$7,812<br />
________________<br />
$949<br />
________________<br />
5. Taxes, insurance, and housing = 0.01 b<br />
$935<br />
________________<br />
$110<br />
________________<br />
6. Total ownership cost per year = 4 + 5<br />
$8,747<br />
________________<br />
$1,059<br />
________________<br />
<strong>Estimating</strong> Operating <strong>Costs</strong><br />
0 hr.<br />
7. Accumulated hours to date (c) and repair % from Table 3 ____________<br />
0%<br />
________________<br />
600 hr.<br />
____________<br />
8%<br />
________________<br />
8. Total accumulated hours at end of life =<br />
6,000 hr. 25% 1,400 hr. 32%<br />
(d h) + c, and % from Table 3 ____________ ________________ ____________ ________________<br />
9. Total accumulated repairs = (% from 8 – % from 7) a<br />
$27,500<br />
________________<br />
$7,200<br />
________________<br />
10. Average repair cost/hour =<br />
$4.58 $9.00<br />
9 (hours from 8 – hours from 7) ________________ ________________<br />
11. Fuel cost/hour = 0.044 (diesel) or 0.06 (gasoline) i j<br />
$7.92<br />
________________<br />
12. Lubrication cost/hour = 0.15 11<br />
$1.19<br />
________________<br />
13. Labor cost/hour = k 1.1<br />
$11.00<br />
________________<br />
14. Total operating cost/hour = 10 + 11 + 12 + 13<br />
$24.69<br />
________________<br />
$9.00<br />
________________<br />
15. Ownership cost/hour = 6 h<br />
$21.87<br />
________________<br />
$10.59<br />
________________<br />
16. Total cost/hour = 14 + 15<br />
$46.56<br />
________________<br />
$19.59<br />
________________<br />
17. Total cost per hour for tractor and implement combined<br />
$66.15<br />
____________<br />
18. Total cost/acre or ton = 17 g<br />
$4.13<br />
____________<br />
*Average hourly work rates for many farm machines are listed in PM 696, <strong>Estimating</strong> Field Capacity of <strong>Farm</strong> Machines.<br />
9
Worksheet for <strong>Estimating</strong> <strong>Farm</strong> <strong>Machinery</strong> <strong>Costs</strong><br />
Tractor or<br />
Implement or<br />
Information Power Unit Attachment<br />
Machine<br />
$<br />
________________<br />
$<br />
________________<br />
a. Current list price of a comparable replacement machine<br />
$<br />
________________<br />
$<br />
_______________<br />
b. Purchase price or current used value of the machine<br />
hr.<br />
________________<br />
hr.<br />
________________<br />
c. Accumulated hours to date (zero for a new machine)<br />
yr.<br />
________________<br />
yr.<br />
________________<br />
d. Economic life, years of ownership remaining<br />
%<br />
________________<br />
%<br />
________________<br />
e. Interest rate, % (cost of capital minus inflation) ________________<br />
acre<br />
________________<br />
f. Annual use, acres<br />
acre/hr.<br />
________________<br />
g. Field capacity, acres/hr. or tons/hr.*<br />
hr.<br />
hr.<br />
________________<br />
h. Annual use, hours (f g for implement)<br />
hp.<br />
________________ ________________<br />
i. Engine or PTO horsepower<br />
$ /gal.<br />
________________<br />
j. Fuel price<br />
$ /hr.<br />
________________<br />
k. <strong>Machinery</strong> labor rate ________________<br />
<strong>Estimating</strong> Ownership <strong>Costs</strong><br />
1. Remaining value (% from Table 1) list price a ____________ % $ ________________ ____________ % ________________<br />
$<br />
2. Total depreciation = (b – 1) ________________ $ ________________<br />
$<br />
3. Capital recovery factor (from Table 2) ________________ ________________<br />
4. Capital recovery = (2 3) + (e 1) ________________ $ ________________<br />
$<br />
5. Taxes, insurance, and housing = 0.01 b ________________ $ ________________<br />
$<br />
6. Total ownership cost per year = 4 + 5 ________________ $ ________________<br />
$<br />
<strong>Estimating</strong> Operating <strong>Costs</strong><br />
7. Accumulated hours to date (c) and repair % from Table 3 ____________ hr. ________________ % ____________ hr. ________________ %<br />
8. Total accumulated hours at end of life =<br />
(d h) + c, and % from Table 3 ____________ hr. ________________ % ____________ hr. ________________ %<br />
9. Total accumulated repairs = (% from 8 – % from 7) a ________________ $ ________________<br />
$<br />
10. Average repair cost/hour =<br />
9 (hours from 8 – hours from 7) ________________ $ ________________<br />
$<br />
11. Fuel cost/hour = 0.044 (diesel) or 0.06 (gasoline) i j ________________<br />
$<br />
12. Lubrication cost/hour = 0.15 11 ________________<br />
$<br />
13. Labor cost/hour = k 1.1 ________________<br />
$<br />
14. Total operating cost/hour = 10 + 11 + 12 + 13 ________________ $ ________________<br />
$<br />
15. Ownership cost/hour = 6 h ________________ $ ________________<br />
$<br />
16. Total cost/hour = 14 + 15 ________________ $ ________________<br />
$<br />
17. Total cost per hour for tractor and implement combined ____________<br />
$<br />
18. Total cost/acre or ton = 17 g ____________<br />
$<br />
*Average hourly work rates for many farm machines are listed in PM 696, <strong>Estimating</strong> Field Capacity of <strong>Farm</strong> Machines.<br />
10
Prepared by William Edwards, extension<br />
economist. Originally prepared by<br />
George Ayres, former extension agricultural<br />
engineer, and Michael Boehlje,<br />
former professor of economics.<br />
The U.S. Department of <strong>Ag</strong>riculture<br />
(USDA) prohibits discrimination in all its<br />
programs and activities on the basis of race,<br />
color, national origin, gender, religion, age,<br />
disability, political beliefs, sexual orientation,<br />
and marital or family status. (Not all<br />
prohibited bases apply to all programs.)<br />
Many materials can be made available in<br />
alternative formats for ADA clients. To<br />
file a complaint of discrimination, write<br />
USDA, Office of Civil Rights, Room 326-W,<br />
Whitten Building, 14th and Independence<br />
Avenue SW, Washington, DC 20250-9410<br />
or call 202-720-5964. 11<br />
Issued in furtherance of Cooperative<br />
Extension work, Acts of May 8 and<br />
June 30, 1914, in cooperation with the<br />
U.S. Department of <strong>Ag</strong>riculture. Stanley R.<br />
Johnson, director, Cooperative Extension<br />
Service, Iowa State University of Science<br />
and Technology, Ames, Iowa.<br />
File: Engineering 3-1 and Economics 1-8<br />
[A]