A scientometric analysis of knowledge management and ... - Emerald
A scientometric analysis of knowledge management and ... - Emerald
A scientometric analysis of knowledge management and ... - Emerald

Create successful ePaper yourself
Turn your PDF publications into a flip-book with our unique Google optimized e-Paper software.
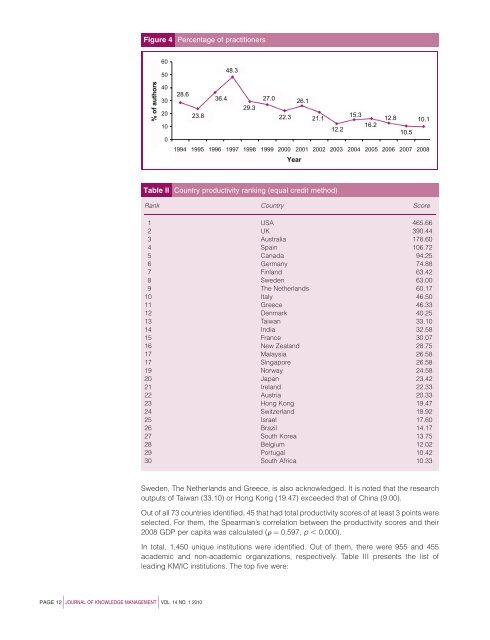
Figure 4 Percentage <strong>of</strong> practitioners<br />
60<br />
50<br />
48.3<br />
% <strong>of</strong> authors<br />
40<br />
30<br />
20<br />
10<br />
0<br />
28.6<br />
36.4<br />
27.0<br />
26.1<br />
29.3<br />
23.8<br />
22.3<br />
15.3<br />
21.1 12.8 10.1<br />
16.2<br />
12.2<br />
10.5<br />
1994 1995 1996 1997 1998 1999 2000 2001 2002 2003 2004 2005 2006 2007 2008<br />
Year<br />
Table II Country productivity ranking (equal credit method)<br />
Rank Country Score<br />
1 USA 465.66<br />
2 UK 390.44<br />
3 Australia 178.60<br />
4 Spain 106.72<br />
5 Canada 94.25<br />
6 Germany 74.88<br />
7 Finl<strong>and</strong> 63.42<br />
8 Sweden 63.00<br />
9 The Netherl<strong>and</strong>s 60.17<br />
10 Italy 46.50<br />
11 Greece 46.33<br />
12 Denmark 40.25<br />
13 Taiwan 33.10<br />
14 India 32.58<br />
15 France 30.07<br />
16 New Zeal<strong>and</strong> 28.75<br />
17 Malaysia 26.58<br />
17 Singapore 26.58<br />
19 Norway 24.58<br />
20 Japan 23.42<br />
21 Irel<strong>and</strong> 22.33<br />
22 Austria 20.33<br />
23 Hong Kong 19.47<br />
24 Switzerl<strong>and</strong> 18.92<br />
25 Israel 17.60<br />
26 Brazil 14.17<br />
27 South Korea 13.75<br />
28 Belgium 12.02<br />
29 Portugal 10.42<br />
30 South Africa 10.33<br />
Sweden, The Netherl<strong>and</strong>s <strong>and</strong> Greece, is also ac<strong>knowledge</strong>d. It is noted that the research<br />
outputs <strong>of</strong> Taiwan (33.10) or Hong Kong (19.47) exceeded that <strong>of</strong> China (9.00).<br />
Out <strong>of</strong> all 73 countries identified, 45 that had total productivity scores <strong>of</strong> at least 3 points were<br />
selected. For them, the Spearman’s correlation between the productivity scores <strong>and</strong> their<br />
2008 GDP per capita was calculated (r ¼ 0:597, p , 0:000).<br />
In total, 1,450 unique institutions were identified. Out <strong>of</strong> them, there were 955 <strong>and</strong> 455<br />
academic <strong>and</strong> non-academic organizations, respectively. Table III presents the list <strong>of</strong><br />
leading KM/IC institutions. The top five were:<br />
PAGE 12j j JOURNAL OF KNOWLEDGE MANAGEMENT VOL. 14 NO. 1 2010