15 The Cropland Data Layer (CDL)
15 The Cropland Data Layer (CDL)
15 The Cropland Data Layer (CDL)

Create successful ePaper yourself
Turn your PDF publications into a flip-book with our unique Google optimized e-Paper software.
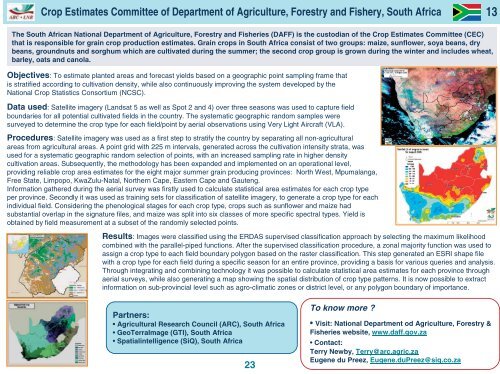
Crop Estimates Committee of Department of Agriculture, Forestry and Fishery, South Africa<br />
13<br />
<strong>The</strong> South African National Department of Agriculture, Forestry and Fisheries (DAFF) is the custodian of the Crop Estimates Committee (CEC)<br />
that is responsible for grain crop production estimates. Grain crops in South Africa consist of two groups: maize, sunflower, soya beans, dry<br />
beans, groundnuts and sorghum which are cultivated during the summer; the second crop group is grown during the winter and includes wheat,<br />
barley, oats and canola.<br />
Objectives: To estimate planted areas and forecast yields based on a geographic point sampling frame that<br />
is stratified according to cultivation density, while also continuously improving the system developed by the<br />
National Crop Statistics Consortium (NCSC).<br />
<strong>Data</strong> used: Satellite imagery (Landsat 5 as well as Spot 2 and 4) over three seasons was used to capture field<br />
boundaries for all potential cultivated fields in the country. <strong>The</strong> systematic geographic random samples were<br />
surveyed to determine the crop type for each field/point by aerial observations using Very Light Aircraft (VLA).<br />
Procedures: Satellite imagery was used as a first step to stratify the country by separating all non-agricultural<br />
areas from agricultural areas. A point grid with 225 m intervals, generated across the cultivation intensity strata, was<br />
used for a systematic geographic random selection of points, with an increased sampling rate in higher density<br />
cultivation areas. Subsequently, the methodology has been expanded and implemented on an operational level,<br />
providing reliable crop area estimates for the eight major summer grain producing provinces: North West, Mpumalanga,<br />
Free State, Limpopo, KwaZulu-Natal, Northern Cape, Eastern Cape and Gauteng.<br />
Information gathered during the aerial survey was firstly used to calculate statistical area estimates for each crop type<br />
per province. Secondly it was used as training sets for classification of satellite imagery, to generate a crop type for each<br />
individual field. Considering the phenological stages for each crop type, crops such as sunflower and maize had<br />
substantial overlap in the signature files, and maize was split into six classes of more specific spectral types. Yield is<br />
obtained by field measurement at a subset of the randomly selected points.<br />
Results: Images were classified using the ERDAS supervised classification approach by selecting the maximum likelihood<br />
combined with the parallel-piped functions. After the supervised classification procedure, a zonal majority function was used to<br />
assign a crop type to each field boundary polygon based on the raster classification. This step generated an ESRI shape file<br />
with a crop type for each field during a specific season for an entire province, providing a basis for various queries and analysis.<br />
Through integrating and combining technology it was possible to calculate statistical area estimates for each province through<br />
aerial surveys, while also generating a map showing the spatial distribution of crop type patterns. It is now possible to extract<br />
information on sub-provincial level such as agro-climatic zones or district level, or any polygon boundary of importance.<br />
Partners:<br />
• Agricultural Research Council (ARC), South Africa<br />
• GeoTerraImage (GTI), South Africa<br />
• Spatialintelligence (SiQ), South Africa<br />
23<br />
To know more ?<br />
• Visit: National Department od Agriculture, Forestry &<br />
Fisheries website, www.daff.gov.za<br />
• Contact:<br />
Terry Newby, Terry@arc.agric.za<br />
Eugene du Preez, Eugene.duPreez@siq.co.za