Morningstar Fund Profile (PDF) - USAA.com
Morningstar Fund Profile (PDF) - USAA.com
Morningstar Fund Profile (PDF) - USAA.com

You also want an ePaper? Increase the reach of your titles
YUMPU automatically turns print PDFs into web optimized ePapers that Google loves.
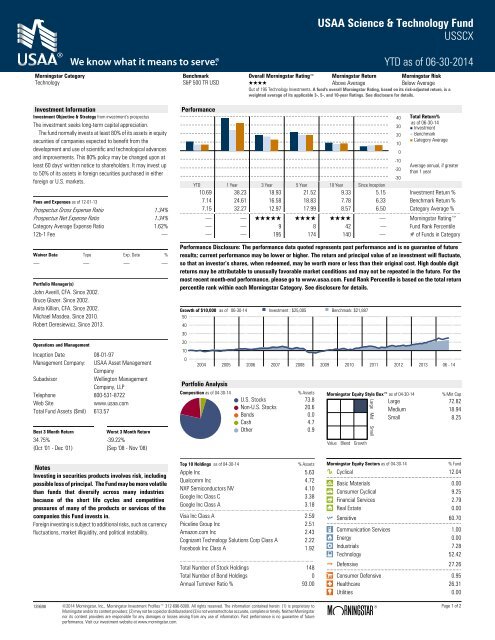
<strong>USAA</strong> Science & Technology <strong>Fund</strong><br />
USSCX<br />
YTD as of 06-30-2014<br />
<strong>Morningstar</strong> Category Benchmark Overall <strong>Morningstar</strong> Rating <strong>Morningstar</strong> Return <strong>Morningstar</strong> Risk<br />
Technology S&P 500 TR USD QQQQ Above Average Below Average<br />
Out of 195 Technology Investments. A fund's overall <strong>Morningstar</strong> Rating, based on its risk-adjusted return, is a<br />
weighted average of its applicable 3-, 5-, and 10-year Ratings. See disclosure for details.<br />
Investment Information<br />
Investment Objective & Strategy from investment’s prospectus<br />
The investment seeks long-term capital appreciation.<br />
The fund normally invests at least 80% of its assets in equity<br />
securities of <strong>com</strong>panies expected to benefit from the<br />
development and use of scientific and technological advances<br />
and improvements. This 80% policy may be changed upon at<br />
least 60 days' written notice to shareholders. It may invest up<br />
to 50% of its assets in foreign securities purchased in either<br />
foreign or U.S. markets.<br />
Fees and Expenses as of 12-01-13<br />
Prospectus Gross Expense Ratio 1.34%<br />
Prospectus Net Expense Ratio 1.34%<br />
Category Average Expense Ratio 1.62%<br />
12b-1 Fee .<br />
Waiver Data Type Exp. Date %<br />
. . . .<br />
Portfolio Manager(s)<br />
John Averill, CFA. Since 2002.<br />
Bruce Glazer. Since 2002.<br />
Anita Killian, CFA. Since 2002.<br />
Michael Masdea. Since 2010.<br />
Robert Deresiewicz. Since 2013.<br />
Operations and Management<br />
Inception Date 08-01-97<br />
Management Company: <strong>USAA</strong> Asset Management<br />
Company<br />
Subadvisor<br />
Wellington Management<br />
Company, LLP<br />
Telephone 800-531-8722<br />
Web Site<br />
www.usaa.<strong>com</strong><br />
Total <strong>Fund</strong> Assets ($mil) 613.57<br />
Best 3 Month Return<br />
Worst 3 Month Return<br />
34.75% -39.22%<br />
(Oct '01 - Dec '01)<br />
(Sep '08 - Nov '08)<br />
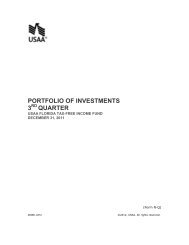
Performance<br />
YTD L1 1 Year L2 3 Year L3 5 Year L4 10 L5 Year Since Inception L6<br />
40 Total Return%<br />
as of 06-30-14<br />
30 Investment<br />
20 Benchmark<br />
Category Average<br />
10<br />
0<br />
-10<br />
-20<br />
-30<br />
Average annual, if greater<br />
than 1 year<br />
10.69 38.23 18.93 21.52 9.33 5.15 Investment Return %<br />
7.14 24.61 16.58 18.83 7.78 6.33 Benchmark Return %<br />
7.15 32.27 12.97 17.99 8.57 6.50 Category Average %<br />
..........................................................................................................................................................................................................<br />
. . QQQQQ QQQQ QQQQ . <strong>Morningstar</strong> Rating<br />
. . 9 8 42 . <strong>Fund</strong> Rank Percentile<br />
. . 195 174 140 . # of <strong>Fund</strong>s in Category<br />
Performance Disclosure: The performance data quoted represents past performance and is no guarantee of future<br />
results; current performance may be lower or higher. The return and principal value of an investment will fluctuate,<br />
so that an investor’s shares, when redeemed, may be worth more or less than their original cost. High double digit<br />
returns may be attributable to unusually favorable market conditions and may not be repeated in the future. For the<br />
most recent month-end performance, please go to www.usaa.<strong>com</strong>. <strong>Fund</strong> Rank Percentile is based on the total return<br />
percentile rank within each <strong>Morningstar</strong> Category. See disclosure for details.<br />
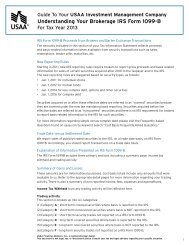
Growth of $10,000 as of 06-30-14 Investment : $25,005 Benchmark: $21,887<br />
50<br />
40<br />
30<br />
20<br />
10<br />
0<br />
2004 2005 2006 2007 2008 2009 2010 2011 2012 2013 06 - 14<br />
Portfolio Analysis<br />
Composition as of 04-30-14<br />
% Assets<br />
U.S. Stocks 73.8<br />
Non-U.S. Stocks 20.6<br />
Bonds 0.0<br />
Cash 4.7<br />
Other 0.9<br />
<strong>Morningstar</strong> Equity Style Box as of 04-30-14<br />
% Mkt Cap<br />
Large 72.82<br />
Medium 18.94<br />
Small 8.25<br />
Value Blend Growth<br />
Large Mid Small<br />
Notes<br />
Investing in securities products involves risk, including<br />
possible loss of principal. The <strong>Fund</strong> may be more volatile<br />
than funds that diversify across many industries<br />
because of the short life cycles and <strong>com</strong>petitive<br />
pressures of many of the products or services of the<br />
<strong>com</strong>panies this <strong>Fund</strong> invests in.<br />
Foreign investing is subject to additional risks, such as currency<br />
fluctuations, market illiquidity, and political instability.<br />
Top 10 Holdings as of 04-30-14<br />
% Assets<br />
Apple Inc 5.63<br />
Qual<strong>com</strong>m Inc 4.72<br />
NXP Semiconductors NV 4.10<br />
Google Inc Class C 3.38<br />
Google Inc Class A 3.18<br />
.......................................................................................................<br />
Visa Inc Class A 2.59<br />
Priceline Group Inc 2.51<br />
Amazon.<strong>com</strong> Inc 2.43<br />
Cognizant Technology Solutions Corp Class A 2.22<br />
Facebook Inc Class A 1.92<br />
.......................................................................................................<br />
Total Number of Stock Holdings 148<br />
Total Number of Bond Holdings 0<br />
Annual Turnover Ratio % 93.00<br />
<strong>Morningstar</strong> Equity Sectors as of 04-30-14<br />
% <strong>Fund</strong><br />
h Cyclical 12.04<br />
...............................................................................................<br />
r Basic Materials 0.00<br />
t Consumer Cyclical 9.25<br />
y Financial Services 2.79<br />
u Real Estate 0.00<br />
j Sensitive 60.70<br />
...............................................................................................<br />
i Communication Services 1.00<br />
o Energy 0.00<br />
p Industrials 7.28<br />
a Technology 52.42<br />
k Defensive 27.26<br />
...............................................................................................<br />
s Consumer Defensive 0.95<br />
d Healthcare 26.31<br />
f Utilities 0.00<br />
139698 ©2014 <strong>Morningstar</strong>, Inc., <strong>Morningstar</strong> Investment <strong>Profile</strong>s 312-696-6000. All rights reserved. The information contained herein: (1) is proprietary to<br />
<strong>Morningstar</strong> and/or its content providers; (2) may not be copied or distributed and (3) is not warranted to be accurate, <strong>com</strong>plete or timely. Neither <strong>Morningstar</strong><br />
nor its content providers are responsible for any damages or losses arising from any use of information. Past performance is no guarantee of future<br />
performance. Visit our investment website at www.morningstar.<strong>com</strong>.<br />
® Page 1 of 2<br />
ß
Disclosure<br />
Performance<br />
Total return reflects performance without adjusting for the<br />
effects of taxation, but is adjusted to reflect all actual ongoing<br />
fund expenses and assumes reinvestment of dividends and<br />
capital gains.<br />
The fund's performance is <strong>com</strong>pared to an index. The index<br />
is an unmanaged portfolio of specified securities and does not<br />
reflect any initial or ongoing expenses. A fund's portfolio may<br />
differ significantly from the securities in the index.<br />
<strong>Morningstar</strong> provides adjusted historical returns and an<br />
Extended Performance Rating for some mutual funds in its<br />
universe. This means that any share class that doesn't have a<br />
1, 3-, 5-, or 10-year performance history may receive a<br />
hypothetical <strong>Morningstar</strong> Rating based on the oldest surviving<br />
share class of the fund. First, <strong>Morningstar</strong> <strong>com</strong>putes the funds'<br />
new return stream by appending an adjusted return history of<br />
the oldest share class. Next, the Extended Performance Rating<br />
is determined by <strong>com</strong>paring the adjusted-historical returns to<br />
the current open-end mutual fund universe to identify<br />
placement in the bell curve used to assign the <strong>Morningstar</strong><br />
Rating.<br />
Best and Worst 3 Month Performance<br />
<strong>Morningstar</strong> calculates best and worst 3-month period<br />
(inpercentage) in-house on a monthly basis.<br />
Best 3-month Period: The highest total return the stock has<br />
posted in a consecutive three-month period over the trailing 15<br />
years, or if a fund does not have 15 years of history, it will go<br />
back as far as the inception date.<br />
Worst 3-month Period: The lowest total return the stock has<br />
posted in a consecutive three-month period over the trailing 15<br />
years, or if a fund does not have 15 years of history, it will go<br />
back as far as the inception date.<br />
Growth of $10,000 Graph<br />
This graph shows a fund's performance based on how $10,000<br />
invested in the fund would have grown over time. The returns<br />
used in the graph are not load-adjusted. The growth of $10,000<br />
begins at the date of the fund's inception, or the first year listed<br />
on the graph, whichever is appropriate. Located alongside the<br />
fund's graph line is a line that represents the growth of $10,000<br />
in an index. The inclusion of the index allows investors to<br />
<strong>com</strong>pare the performance of the fund with the performance of<br />
a benchmark index.<br />
<strong>Morningstar</strong> Rating<br />
Often simply called the Star Rating, the <strong>Morningstar</strong> Rating<br />
brings load-adjustments, performance (returns) and risk<br />
together into one evaluation. To determine a fund's star rating<br />
for a given time period (three, five, or 10 years), the fund's riskadjusted<br />
return is plotted on a bell curve: If the fund scores in<br />
the top 10% of its category, it receives 5 stars (Highest); if it<br />
falls in the next 22.5% it receives 4 stars (Above Average); a<br />
place in the middle 35% earns 3 stars (Average); those lower<br />
still, in the next 22.5%, receive 2 stars (Below Average); and<br />
the bottom 10% get only 1 star (Lowest). The Overall<br />
<strong>Morningstar</strong> Rating is a weighted average of the available<br />
three-, five-, and 10-year ratings.<br />
<strong>Morningstar</strong> Return<br />
This statistic is a measurement of a fund's excess return over<br />
a risk-free rate (the return of the 90-day Treasury bill), after<br />
adjusting for all applicable loads and sales charges. In each<br />
<strong>Morningstar</strong> Category, the top 10% of funds earn a High<br />
<strong>Morningstar</strong> Return, the next 22.5% Above Average, the middle<br />
35% Average, the next 22.5% Below Average, and the bottom<br />
10% Low. <strong>Morningstar</strong> Return is measured for up to three time<br />
periods (three-, five-, and 10-years). These separate measures<br />
are then weighted and averaged to produce an overall measure<br />
for the fund. <strong>Fund</strong>s with less than three years of performance<br />
history are not rated.<br />
<strong>Morningstar</strong> Risk<br />
This statistic evaluates the variations in a fund's monthly<br />
returns, with an emphasis on downside variations. In each<br />
<strong>Morningstar</strong> Category, the 10% of funds with the lowest<br />
measured risk are described as Low Risk, the next 22.5% Below<br />
Average, the middle 35% Average, the next 22.5% Above<br />
Average, and the top 10% High.<br />
<strong>Morningstar</strong> Risk is measured for up to three time periods<br />
(three-, five-, and 10-years). These separate measures are then<br />
weighted and averaged to produce an overall measure for the<br />
fund. <strong>Fund</strong>s with less than three years of performance history<br />
are not rated.<br />
<strong>Fund</strong> Rank Percentile<br />
This is the total return percentile rank within each <strong>Morningstar</strong><br />
Category. The highest (or most favorable) percentile rank is 1<br />
and the lowest (or least favorable) percentile rank is 100.<br />
Historical percentile ranks are based on a snapshot of the funds<br />
as they were at the time of the calculation.<br />
Percentile ranks within categories are most useful in those<br />
groups that have a large number of funds. For small universes,<br />
funds will be ranked at the highest percentage possible. For<br />
instance, if there are only two specialty-utility funds with 10-<br />
year average total returns, <strong>Morningstar</strong> will assign a percentile<br />
rank of 1 to the top-performing fund, and the second fund will<br />
earn a percentile rank of 51 (indicating the fund underperformed<br />
50% of the sample).<br />
<strong>Morningstar</strong> Style Box<br />
The <strong>Morningstar</strong> Style Box reveals a fund's investment style as<br />
of the date noted on this report.<br />
For equity funds the vertical axis shows the market<br />
capitalization of the long stocks owned and the horizontal axis<br />
shows investment style (value, blend, or growth).<br />
For fixed-in<strong>com</strong>e funds, the vertical axis shows the credit<br />
quality of the long bonds owned and the horizontal axis shows<br />
interest rate sensitivity as measured by a bond's effective<br />
duration.<br />
<strong>Morningstar</strong> seeks credit rating information from fund<br />
<strong>com</strong>panies on a periodic basis (e.g., quarterly). In <strong>com</strong>piling<br />
credit rating information <strong>Morningstar</strong> accepts credit ratings<br />
reported by fund <strong>com</strong>panies that have been issued by all<br />
Nationally Recognized Statistical Rating Organizations<br />
(NRSROs). For a list of all NRSROs, please visit http://<br />
www.sec.gov/divisions/marketreg/ratingagency.htm.<br />
Additionally, <strong>Morningstar</strong> accepts foreign credit ratings from<br />
widely recognized or registered rating agencies. If two rating<br />
organizations/agencies have rated a security, fund <strong>com</strong>panies<br />
are to report the lower rating; if three or more organizations/<br />
agencies have rated a security, fund <strong>com</strong>panies are to report<br />
the median rating, and in cases where there are more than two<br />
organization/agency ratings and a median rating does not exist,<br />
fund <strong>com</strong>panies are to use the lower of the two middle ratings.<br />
PLEASE NOTE: <strong>Morningstar</strong>, Inc. is not itself an NRSRO nor does<br />
it issue a credit rating on the fund. An NRSRO or rating agency<br />
ratings can change from time-to-time and do not remove<br />
market risk.<br />
For credit quality, <strong>Morningstar</strong> <strong>com</strong>bines the credit rating<br />
information provided by the fund <strong>com</strong>panies with an average<br />
default rate calculation to <strong>com</strong>e up with a weighted-average<br />
credit quality. The weighted-average credit quality is currently<br />
a letter that roughly corresponds to the scale used by a leading<br />
NRSRO. Bond funds are assigned a style box placement of<br />
"low", "medium", or "high" based on their average credit quality.<br />
<strong>Fund</strong>s with a low credit quality are those whose weightedaverage<br />
credit quality is determined to be less than "BBB-";<br />
medium are those less than "AA-", but greater or equal to<br />
"BBB-"; and high are those with a weighted-average credit<br />
quality of "AA-" or higher. When classifying a bond portfolio,<br />
<strong>Morningstar</strong> first maps the NRSRO credit ratings of the<br />
underlying holdings to their respective default rates (as<br />
determined by <strong>Morningstar</strong>'s analysis of actual historical default<br />
rates). <strong>Morningstar</strong> then averages these default rates to<br />
determine the average default rate for the entire bond fund.<br />
Finally, <strong>Morningstar</strong> maps this average default rate to its<br />
corresponding credit rating along a convex curve.<br />
For interest-rate sensitivity, <strong>Morningstar</strong> obtains from fund<br />
<strong>com</strong>panies the average effective duration. Generally,<br />
<strong>Morningstar</strong> classifies a fixed-in<strong>com</strong>e fund's interest-rate<br />
sensitivity based on the effective duration of the <strong>Morningstar</strong><br />
Core Bond Index (MCBI), which is currently three years. The<br />
classification of Limited will be assigned to those funds whose<br />
average effective duration is between 25% to 75% of MCBI's<br />
average effective duration; funds whose average effective<br />
duration is between 75% to 125% of the MCBI will be classified<br />
as Moderate; and those that are at 125% or greater of the<br />
average effective duration of the MCBI will be classified as<br />
Extensive.<br />
For municipal bond funds, <strong>Morningstar</strong> also obtains from<br />
fund <strong>com</strong>panies the average effective duration. In these cases<br />
static breakpoints are utilized. These breakpoints are as follows:<br />
(i) Limited: 4.5 years or less; (ii) Moderate: more than 4.5 years<br />
but less than 7 years; and (iii) Extensive: more than 7 years. In<br />
addition, for non-US taxable and non-US domiciled fixed in<strong>com</strong>e<br />
funds static duration breakpoints are used: (i) Limited: less than<br />
or equal to 3.5 years; (ii) Moderate: greater than 3.5 and less<br />
than equal to 6 years; (iii) Extensive: greater than 6 years.<br />
Additional Information<br />
Consider the investment objectives, risks, charges and<br />
expenses of the <strong>USAA</strong> mutual funds carefully before<br />
investing. Contact us at 800-531-8910 for a prospectus<br />
containing this and other information about the funds<br />
from <strong>USAA</strong> Investment Management Company,<br />
Distributor. Read it carefully before investing.<br />
Investments provided by <strong>USAA</strong> Investment Management<br />
Company and <strong>USAA</strong> Financial Advisors Inc., both registered<br />
broker dealers.<br />
139698 ©2014 <strong>Morningstar</strong>, Inc., <strong>Morningstar</strong> Investment <strong>Profile</strong>s 312-696-6000. All rights reserved. The information contained herein: (1) is proprietary to<br />
<strong>Morningstar</strong> and/or its content providers; (2) may not be copied or distributed and (3) is not warranted to be accurate, <strong>com</strong>plete or timely. Neither <strong>Morningstar</strong><br />
nor its content providers are responsible for any damages or losses arising from any use of information. Past performance is no guarantee of future<br />
performance. Visit our investment website at www.morningstar.<strong>com</strong>.<br />
® Page 2 of 2<br />
ß