Boardroom Briefing: Mergers & Acquisitions - Directors & Boards
Boardroom Briefing: Mergers & Acquisitions - Directors & Boards
Boardroom Briefing: Mergers & Acquisitions - Directors & Boards

You also want an ePaper? Increase the reach of your titles
YUMPU automatically turns print PDFs into web optimized ePapers that Google loves.
The <strong>Directors</strong> & <strong>Boards</strong> Survey:<br />
<strong>Mergers</strong> & <strong>Acquisitions</strong><br />
Methodology<br />
This <strong>Directors</strong> & <strong>Boards</strong> survey<br />
was conducted in July 2006 via<br />
the web, with an email invitation<br />
to participate. The invitation was<br />
emailed to the recipients of <strong>Directors</strong><br />
& <strong>Boards</strong>’ monthly e-<strong>Briefing</strong>. A total<br />
of 406 usable surveys were completed.<br />
About the respondents<br />
(Multiple responses allowed)<br />
A director of a publicly held company 34.6%<br />
A director of a privately held company 34.5%<br />
A director of a non-profit entity 26.1%<br />
A senior level executive (CEO, CFO, CxO)<br />
of a privately held company 21.7%<br />
Other shareholder 17.2%<br />
Attorney 16.7%<br />
Auditor, consultant, board advisor 13.8%<br />
A senior level executive (CEO, CFO, CxO)<br />
of a publicly held company 11.3%<br />
Academic 5.9%<br />
Institutional shareholder 5.4%<br />
An investor relations professional/officer 3.9%<br />
Other 6.3%<br />
(Other responses included: retired director,<br />
consultant, D&O underwriter, corporate<br />
secretary, internal M&A executive.)<br />
Revenues<br />
(For the primary company of the respondent)<br />
Average revenues:<br />
$1.965 billion<br />
Less than $250 million 51%<br />
$251 million-$500 million 7.1%<br />
$501 million to $999 million 15.3%<br />
$1 billion to $10 billion 17.9%<br />
More than $10 billion 8.7%<br />
Board Service<br />
(Average number of boards respondents serve)<br />
Public 1.20<br />
Private 1.42<br />
Charitable 1.88<br />
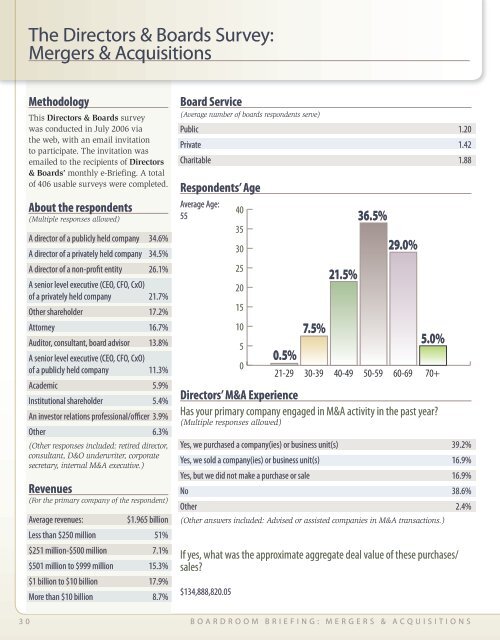
Respondents’ Age<br />
Average Age:<br />
55<br />
40<br />
35<br />
30<br />
25<br />
20<br />
15<br />
10<br />
5<br />
0<br />
0.5%<br />
7.5%<br />
21.5%<br />
36.5%<br />
29.0%<br />
5.0%<br />
21-29 30-39 40-49 50-59 60-69 70+<br />
<strong>Directors</strong>’ M&A Experience<br />
Has your primary company engaged in M&A activity in the past year?<br />
(Multiple responses allowed)<br />
Yes, we purchased a company(ies) or business unit(s) 39.2%<br />
Yes, we sold a company(ies) or business unit(s) 16.9%<br />
Yes, but we did not make a purchase or sale 16.9%<br />
No 38.6%<br />
Other 2.4%<br />
(Other answers included: Advised or assisted companies in M&A transactions.)<br />
If yes, what was the approximate aggregate deal value of these purchases/<br />
sales?<br />
$134,888,820.05<br />
3 0 B o a r d r o o m B r i e f i n g : M e r g e r s & A c q u i s i t i o n s
![[link to PDF] for a copy of the briefing paper - Directors & Boards](https://img.yumpu.com/43729022/1/190x245/link-to-pdf-for-a-copy-of-the-briefing-paper-directors-boards.jpg?quality=85)