Iceland-SocialProblems-2006.pdf - (Campus.fsu.edu)Campus.fsu.edu
Iceland-SocialProblems-2006.pdf - (Campus.fsu.edu)Campus.fsu.edu
Iceland-SocialProblems-2006.pdf - (Campus.fsu.edu)Campus.fsu.edu

Create successful ePaper yourself
Turn your PDF publications into a flip-book with our unique Google optimized e-Paper software.
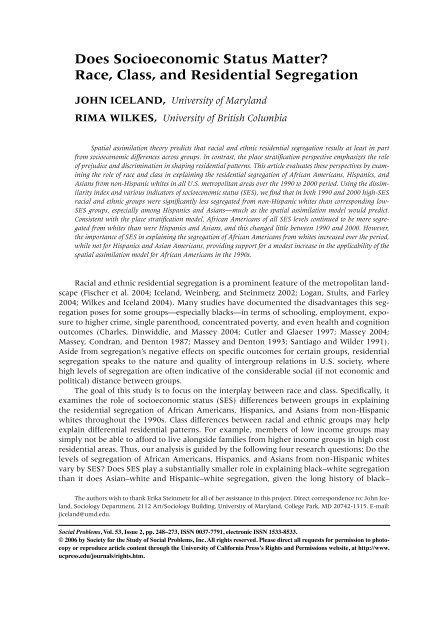
Does Socioeconomic Status Matter?<br />
Race, Class, and Residential Segregation<br />
JOHN ICELAND, University of Maryland<br />
RIMA WILKES, University of British Columbia<br />
Spatial assimilation theory predicts that racial and ethnic residential segregation results at least in part<br />
from socioeconomic differences across groups. In contrast, the place stratification perspective emphasizes the role<br />
of prejudice and discrimination in shaping residential patterns. This article evaluates these perspectives by examining<br />
the role of race and class in explaining the residential segregation of African Americans, Hispanics, and<br />
Asians from non-Hispanic whites in all U.S. metropolitan areas over the 1990 to 2000 period. Using the dissimilarity<br />
index and various indicators of socioeconomic status (SES), we find that in both 1990 and 2000 high-SES<br />
racial and ethnic groups were significantly less segregated from non-Hispanic whites than corresponding low-<br />
SES groups, especially among Hispanics and Asians—much as the spatial assimilation model would predict.<br />
Consistent with the place stratification model, African Americans of all SES levels continued to be more segregated<br />
from whites than were Hispanics and Asians, and this changed little between 1990 and 2000. However,<br />
the importance of SES in explaining the segregation of African Americans from whites increased over the period,<br />
while not for Hispanics and Asian Americans, providing support for a modest increase in the applicability of the<br />
spatial assimilation model for African Americans in the 1990s.<br />
Racial and ethnic residential segregation is a prominent feature of the metropolitan landscape<br />
(Fischer et al. 2004; <strong>Iceland</strong>, Weinberg, and Steinmetz 2002; Logan, Stults, and Farley<br />
2004; Wilkes and <strong>Iceland</strong> 2004). Many studies have documented the disadvantages this segregation<br />
poses for some groups—especially blacks—in terms of schooling, employment, exposure<br />
to higher crime, single parenthood, concentrated poverty, and even health and cognition<br />
outcomes (Charles, Dinwiddie, and Massey 2004; Cutler and Glaeser 1997; Massey 2004;<br />
Massey, Condran, and Denton 1987; Massey and Denton 1993; Santiago and Wilder 1991).<br />
Aside from segregation’s negative effects on specific outcomes for certain groups, residential<br />
segregation speaks to the nature and quality of intergroup relations in U.S. society, where<br />
high levels of segregation are often indicative of the considerable social (if not economic and<br />
political) distance between groups.<br />
The goal of this study is to focus on the interplay between race and class. Specifically, it<br />
examines the role of socioeconomic status (SES) differences between groups in explaining<br />
the residential segregation of African Americans, Hispanics, and Asians from non-Hispanic<br />
whites throughout the 1990s. Class differences between racial and ethnic groups may help<br />
explain differential residential patterns. For example, members of low income groups may<br />
simply not be able to afford to live alongside families from higher income groups in high cost<br />
residential areas. Thus, our analysis is guided by the following four research questions: Do the<br />
levels of segregation of African Americans, Hispanics, and Asians from non-Hispanic whites<br />
vary by SES? Does SES play a substantially smaller role in explaining black–white segregation<br />
than it does Asian–white and Hispanic–white segregation, given the long history of black–<br />
The authors wish to thank Erika Steinmetz for all of her assistance in this project. Direct correspondence to: John <strong>Iceland</strong>,<br />
Sociology Department, 2112 Art/Sociology Building, University of Maryland, College Park, MD 20742-1315. E-mail:<br />
jiceland@umd.<strong>edu</strong>.<br />
Social Problems, Vol. 53, Issue 2, pp. 248–273, ISSN 0037-7791, electronic ISSN 1533-8533.<br />
© 2006 by Society for the Study of Social Problems, Inc. All rights reserved. Please direct all requests for permission to photocopy<br />
or reproduce article content through the University of California Press’s Rights and Permissions website, at http://www.<br />
ucpress.<strong>edu</strong>/journals/rights.htm.
Race, Class, and Residential Segregation 249<br />
white racism, discrimination, and racial conflict? Has black–white segregation declined relative<br />
to Asian–white and Hispanic–white segregation in recent years? Has there been a change<br />
in the effect of SES on racial and ethnic residential patterns?<br />
We calculate residential segregation indexes, by race and class, for all metropolitan areas<br />
in the United States by applying the dissimilarity index to data from the 1990 and 2000<br />
decennial censuses. We use several measures of class, including income, poverty status, <strong>edu</strong>cation,<br />
and occupation. We then employ generalized linear regression models to gauge the<br />
roles of race and class in explaining patterns of segregation, controlling for a variety of group<br />
and metropolitan area characteristics.<br />
This article makes three noteworthy contributions to the literature on race, class, and<br />
segregation. First, studies of the relationship between race, class, and segregation tend to<br />
focus primarily on African Americans, and often in a small number of metropolitan areas. In<br />
contrast, we compare the segregation of African Americans, Hispanics, and Asian Americans<br />
from whites, for all U.S. metropolitan areas. Studying multiple groups is increasingly important<br />
because Hispanics recently surpassed African Americans as the largest minority in the<br />
United States, and the Asian population has continued to grow rapidly. At the same time,<br />
using information from all metropolitan areas allows us to make broad generalizations about<br />
segregation patterns across the United States. Second, we provide an assessment of the relative<br />
importance of race and class for different groups in a multivariate framework, allowing<br />
us to draw stronger conclusions about these associations. Third, we use data from the most<br />
recent decennial censuses to assess the theoretical models of interest: spatial assimilation and<br />
place stratification. Importantly, there are indications that the roles of race and SES in shaping<br />
residential patterns may be changing in recent years, given, for example, some declines in<br />
the discrimination against blacks in housing markets in the 1990s (Ross and Turner 2005).<br />
Background<br />
Residential segregation refers to the differential distribution of groups across space, and is<br />
usually thought of in terms of the degree to which various groups reside in different neighborhoods.<br />
People are residentially segregated across a number of dimensions, including age,<br />
socioeconomic status, and race and ethnicity. Scholars commonly believe that differences in<br />
residential patterns across racial and ethnic groups reflect social distance (Park 1925; White<br />
1987). A number of theories have been offered to explain patterns of racial and ethnic residential<br />
segregation. Two broad theoretical perspectives that encompass many of these views<br />
have been termed spatial assimilation and place stratification (Charles 2003).<br />
The spatial assimilation theory has long been applied to the study of immigrant residential<br />
patterns. According to this perspective, differences in socioeconomic status (the focus<br />
of this study) and acculturation across racial and ethnic groups, together, help shape patterns of<br />
segregation (Alba and Logan 1991; Charles 2003; Logan and Alba 1995; Taeuber and Taeuber<br />
1965). As noted, most minority group members may not be able to afford to live in affluent<br />
white neighborhoods (Alba and Logan 1991; Clark 1986, 1988; Pascal 1967). People who<br />
work in different sectors of the economy may also live grouped together in distinct neighborhoods<br />
near their work sites (Clark 1986), or the poor may be more likely to live in distinct<br />
areas, such as central cities, where public transportation is more readily available and government<br />
support more generous (Glaeser, Kahn, and Rappaport 2000). Indeed, research has shown<br />
that people of different classes are at least somewhat segregated from one another (Farley<br />
1977; White 1987).<br />
This model may be important in the context of continued SES disparities across racial and<br />
ethnic groups. African Americans and Hispanics, in particular, lag behind whites in terms of<br />
incomes, occupational status, and <strong>edu</strong>cation (Harrison and Bennett 1995). For example, according<br />
to the 2000 Census, the median household income of non-Hispanic whites, at $45,367,
250 ICELAND/WILKES<br />
was considerably higher than the $29,423 median income for blacks and $33,676 median<br />
income for Hispanics, although the median income for non-Hispanic whites is lower than the<br />
$51,908 figure for Asians (U.S. Census Bureau 2002). A higher proportion of non-Hispanic<br />
whites have advanced degrees and are managers than blacks and Hispanics, though these<br />
proportions are lower than those observed among Asians (Bauman and Graf 2003; Fronczek<br />
and Johnson 2003). Similarly, African American and Hispanic poverty rates (24.9 and 22.6<br />
percent, respectively) are roughly three times higher than those of non-Hispanic whites (8.1<br />
percent), while the 12.4 percent Asian poverty rate is also higher than that of whites (Bishaw<br />
and <strong>Iceland</strong> 2003).<br />
According to the spatial assimilation theory, these SES differences, by themselves, should<br />
result in some racial and ethnic segregation, even if there were no prejudice and discrimination<br />
affecting people’s residential choices. Those who achieve socioeconomic gains, however,<br />
can then translate them into higher quality neighborhoods and housing. This is noteworthy<br />
since residential mobility is a step toward more complete assimilation across other dimensions,<br />
such as social and political (Alba and Logan 1991; Charles 2003; Massey and Mullan<br />
1984). Richard Alba and John Logan (1991) note that: “This process implies, on the one<br />
hand, a tendency toward dispersion of minority-group members, which opens the way for<br />
increased contact with members of the ethnic majority . . . and, on the other, greater resemblance<br />
in residential characteristics between successful minority-group members and their<br />
peers from the majority” (p. 443).<br />
In contrast to the spatial assimilation model, the place stratification perspective emphasizes<br />
the role of prejudice and discrimination in shaping residential patterns. These forces<br />
constrain the residential mobility of minority group members. For example, the long history<br />
of discrimination against African Americans probably plays an important role in explaining<br />
current residential patterns. A number of researchers have documented the rise of the American<br />
ghetto in the twentieth century, particularly between 1940 and 1970, when African<br />
American migration to Northern central cities continued and ghettos expanded (e.g., Cutler,<br />
Glaeser, and Vigdor 1999; Massey and Denton 1993; Taeuber and Taeuber 1965). Even as formal<br />
barriers to integration fell in the post-Civil Rights era, the legacy of past discrimination<br />
and segregation, and continued racism today, is likely to help explain levels of segregation<br />
between African Americans and whites in recent years (Cutler et al. 1999).<br />
More generally, the place stratification perspective emphasizes that a group’s residential<br />
patterns and integration into society depend on the group’s position in the social hierarchy<br />
(Charles 2003; White and Glick 1999). The dominant group in the United States—non-Hispanic<br />
whites—is at the top of the hierarchy, and other groups follow in some order, depending on<br />
prejudices and preferences of society at large. The effects of negative stereotypes are thought<br />
to be greatest for African Americans because they tend to be perceived in the most unfavorable<br />
terms (Alba and Logan 1991; Bobo and Zubrinksky 1996; Charles 2000, 2001a; Farley et<br />
al. 1994; Zubrinksy and Bobo 1996). Thus, one of the consequences is that African Americans<br />
are unable to attain their locational preferences as often as whites of similar SES backgrounds<br />
are able to (Adelman 2004; Fainstein 1993; Massey and Eggers 1990).<br />
The “racial preferences” literature has provided some support for the place stratification<br />
model. In general, ethnic groups often show strong desires to live in neighborhoods where<br />
their own group is highly represented, and often avoid other ethnic neighborhoods. However,<br />
African Americans, Hispanics, and Asians are more likely than whites to express a preference<br />
for living in integrated neighborhoods (Bobo and Zubrinsky 1996; Farley 1977; Farley<br />
et al. 1994; Farley, Fielding, and Krysan 1997; Zubrinsky and Bobo 1996). Whites also tend to<br />
show the strongest avoidance behavior, especially of African Americans, even when controlling<br />
for the socioeconomic characteristics of the other groups in the neighborhood (Clark 1991,<br />
1992; Emerson, Yancy, and Chai 2001; Freeman 2000; Krysan and Farley 2002). In short, racial<br />
prejudice and discrimination are likely to be more important in determining segregation—<br />
especially black–white segregation—than are more benign ethnocentric preferences for same-
Race, Class, and Residential Segregation 251<br />
race neighborhoods (Charles 2000). Nevertheless, some research indicates an increased willingness<br />
by whites, over the decades, to remain in their neighborhoods as African Americans<br />
enter (Farley et al. 1994).<br />
Scholars have extensively documented discriminatory practices against African Americans<br />
and, to a lesser extent, Hispanics in the housing market. Such practices probably play a<br />
role in shaping residential patterns (Massey and Denton 1993; Ross and Turner 2005; Turner<br />
et al. 2002). Asians also experience discrimination in housing markets (Turner and Ross<br />
2003). Over the years, discriminatory practices have included real estate agents steering racial<br />
groups to certain neighborhoods, unequal access to mortgage credit, exclusionary zoning that<br />
restricts racial groups to particular neighborhoods, and neighbors’ hostility (Alba and Logan<br />
1991, 1993; Galster 1988; Goering and Wienk 1996; Massey and Denton 1993; Massey and<br />
Mullan 1984; Meyer 2000; Yinger 1995). For these reasons, minority members—African<br />
Americans in particular—have historically been less likely to convert socioeconomic gains into<br />
advantageous residential outcomes, such as living in preferred neighborhoods (Alba and<br />
Logan 1991).<br />
Formal barriers to integration have fallen with the passage of various laws, notably the<br />
Fair Housing Act of 1968. In essence, this act made it unlawful to discriminate on the basis of<br />
race, color, religion, or national origin in most housing market transactions. Amendments to<br />
the act in 1988 strengthened its enforcement. Recent research has indicated that discrimination<br />
in rental and owner-occupied housing markets declined substantially in the 1990s, although<br />
some discrimination still occurs (Ross and Turner 2005). Stephen Ross and Margery Turner<br />
(2005) conclude that declines in discrimination are probably a result of changing attitudes in<br />
society, increased contact with minority customers, the rising economic status of minority<br />
customers, and the continuing effect of the Fair Housing Act and its enforcement on the real<br />
estate industry (Ross and Turner 2005).<br />
Ross and Turner (2005) also emphasize that racial and ethnic stereotypes and statistical<br />
discrimination continue to play a role in the housing market. Other research finds that inequality<br />
in access to home mortgage lending continues (Williams 2005), although some policies,<br />
such as the Community Reinvestment Act, have also helped minorities buy homes in<br />
predominately white neighborhoods (Friedman and Squires 2005). The implication of these<br />
findings is that discrimination may still contribute to residential segregation but at lower rates<br />
than in the past.<br />
Empirical Studies that Directly Examine the Effect of SES on<br />
Segregation Patterns<br />
Many studies of segregation have found that the effect of race overwhelms that of class<br />
for African Americans in particular (e.g., Darden and Kamel 2000; Denton and Massey 1988;<br />
Fischer et al. 2004; <strong>Iceland</strong>, Sharpe, and Steinmetz 2005; Massey and Fischer 1999; White<br />
and Sassler 2000). Levels of black–white segregation are clearly too high to be explained by<br />
SES differences alone, and black–white segregation has also generally been much greater<br />
than segregation by social class, measured by <strong>edu</strong>cation, occupation, or income (Farley 1977;<br />
Sims 1999; White 1987).<br />
In a study of segregation in Los Angeles county in 1990, Camille Z[ubrinsky] Charles<br />
(2001b) found that class differences explained virtually none of the difference in black–white<br />
segregation. John Farley (1995) determined much the same about the St. Louis metropolitan<br />
area in 1990, where, at all income levels, African Americans and whites with similar incomes<br />
were about as segregated as African Americans and whites overall. Likewise, researchers have<br />
found that in 1990 middle class African Americans were highly segregated from middle class<br />
whites despite small declines between 1970 and 1990 (Adelman 2004; Adelman et al. 2001).<br />
At the same time, middle class blacks lived in neighborhoods with significantly lower median<br />
incomes, higher poverty rates, and a higher incidence of other related problems than did
252 ICELAND/WILKES<br />
middle class whites (Adelman 2004; Adelman et al. 2001; Alba, Logan, and Stults 2000;<br />
Erbe 1975; Pattillo-McCoy 1999, 2000).<br />
Interestingly, some studies using recent data have suggested that the effect of class differences<br />
on racial segregation patterns is significant (Alba et al. 2000; Clark and Ware 1997; St.<br />
John and Clymer 2000), and it may be increasing (Clark and Ware 1997; <strong>Iceland</strong> et al. 2005).<br />
Black–white segregation has declined moderately in recent decades (<strong>Iceland</strong> et al. 2002;<br />
Lewis Mumford Center 2001; Timberlake 2004), and at the same time, there have been some<br />
r<strong>edu</strong>ctions in SES differentials (Harrison and Bennett 1995) and in housing discrimination<br />
(Ross and Turner 2005; Turner et al. 2002). John <strong>Iceland</strong>, Cicely Sharpe, and Erika Steinmetz<br />
(2005) reported that higher SES African Americans were less segregated from all whites than<br />
were lower SES African Americans. They also reported that segregation declined modestly for<br />
higher SES African Americans between 1990 and 2000. Some researchers have also argued<br />
that, more generally, the role of class in shaping residential patterns has increased in recent<br />
decades (Massey 1996; Wilson 1996). The implication of these patterns is that the relative<br />
predictive strength of the place stratification and spatial assimilation models warrants renewed<br />
attention.<br />
The evidence tends to indicate that class plays a larger, if moderate, role in patterns of<br />
segregation for Hispanics and Asians than for African Americans (Bayer, McMillan, and Rueben<br />
2004; Denton and Massey 1988; Logan et al. 2004; Massey and Fischer 1999). For example,<br />
John Logan, Brian Stults, and Reynolds Farley (2004) found that income differences had<br />
a larger effect on Hispanic–white dissimilarity than on black–white dissimilarity. Nancy Denton<br />
and Douglas Massey (1988) established that Hispanic and Asian segregation declines<br />
markedly from low to high socioeconomic status, supporting Massey’s (1979) earlier research<br />
on Hispanics. Joe Darden (1987) also found that Hispanic–white residential segregation varied<br />
by class in Chicago in 1980 data, but black–white segregation did not.<br />
Following the 2000 census, studies indicated that there have been no declines in Hispanic<br />
and Asian segregation in recent decades (<strong>Iceland</strong> et al. 2002; Lewis Mumford Center 2001). It<br />
could be that continued high levels of immigration from Latin America and Asia have contributed<br />
to the lack of a decline in Asian–white and Hispanic–white segregation in recent<br />
decades, as the spatial assimilation model would predict (Borjas 1995; <strong>Iceland</strong> 2004), although<br />
the lack of decline in general is also consistent with the place stratification model. Research that<br />
supports the spatial assimilation view showed that discrimination against Hispanics in the housing<br />
market declined between 1989 and 2000, yet, over the same period, discrimination against<br />
Hispanics in the rental market remained unchanged (Ross and Turner 2005; Turner et al. 2002).<br />
Notably, not all studies point in the same direction for Hispanics and Asians. Charles (2001b)<br />
found that class differences explained virtually none of the difference in Asian–white segregation<br />
in Los Angeles in 1990, although a more substantial fraction of Hispanic–white segregation<br />
could be attributed to SES differences. Charles has speculated that self-segregation plays a large<br />
role among Asians, especially since many in the Los Angeles area are recent immigrants.<br />
In summary, past studies have provided some support for both the spatial assimilation<br />
and the place stratification perspectives. The predictive power of place stratification is probably<br />
stronger overall, while the spatial assimilation model does a better job of explaining Asian<br />
and Hispanic residential patterns than it does African American patterns. The long history of<br />
racism and racial conflict between African Americans and whites has undoubtedly contributed<br />
to the residential patterns we see for these groups today, even in the context of r<strong>edu</strong>ctions<br />
in formal barriers to integration and in discrimination.<br />
Hypotheses<br />
At the outset of this analysis we posed a set of questions that guide this study. Below,<br />
these questions are followed by hypotheses from each theoretical perspective concerning the<br />
findings we would expect based on the theories.
Race, Class, and Residential Segregation 253<br />
1. Do the levels of segregation of blacks, Hispanics, and Asians from non-Hispanic whites<br />
vary by SES? According to the spatial assimilation model, the answer would be yes. The<br />
place stratification model would predict that the effect of SES is relatively small—racial<br />
stratification in society trumps class differences in determining residential patterns.<br />
2. Does SES play a substantially smaller role in explaining black–white segregation than<br />
Asian–white and Hispanic–white segregation? Race differences by themselves do not<br />
play a prominent role in the spatial assimilation model (though differences in acculturation<br />
might). According to the place stratification model, however, SES should certainly<br />
play a smaller role in explaining black–white differences because of greater racism<br />
and discrimination against African Americans than other racial and ethnic groups<br />
in society.<br />
3. Has black–white segregation declined relative to Asian–white and Hispanic–white segregation<br />
in recent years? Such a decline would support the spatial assimilation model,<br />
which generally does not predict differences across racial groups (again outside those<br />
associated with SES and acculturation). The place stratification model would predict<br />
strong continued differences across racial and ethnic groups.<br />
4. Has there been a change in the effect of SES on racial and ethnic residential patterns?<br />
An increase in the effect of SES would provide support the spatial assimilation model<br />
and not really the place stratification model.<br />
Data and Methods<br />
Restricted 1990 and 2000 long-form census files provided the data for this analysis of<br />
residential segregation. 1 While residential segregation can occur at any geographic level, we<br />
have chosen to focus on metropolitan areas as reasonable approximations of housing markets.<br />
We present estimates for all metropolitan statistical areas (MSAs) and primary metropolitan<br />
statistical areas (PMSAs), together referred to as metropolitan areas. The building<br />
blocks for all metropolitan areas are counties except in New England. There, they are based<br />
on city and town boundaries, as they were in most Census Bureau tabulations of metropolitan<br />
area statistics until the Census Bureau issued the most recent set of guidelines in 2003<br />
(U.S. Census Bureau 2003). The data on population counts in all metropolitan areas are by<br />
census tract for Hispanics and for all racial groups. The census data also furnish counts of<br />
these groups by income, occupation, <strong>edu</strong>cation, and other characteristics. To ensure comparability,<br />
when presenting data for 1990 and 2000, we used the 2000 boundaries of metropolitan<br />
areas, as defined by the Office of Management and Budget (OMB) on June 30, 1999. By<br />
this definition, there were 331 metropolitan areas in our analysis, and census tracts constituted<br />
the unit of analysis within metropolitan areas. 2 Census tracts, which typically have<br />
between 2,500 and 8,000 inhabitants, are defined with local input and are intended to represent<br />
neighborhoods. Typically, they do not change much from census to census, except to<br />
subdivide. In addition, census tracts are, by far, the analytical unit most often selected by<br />
other researchers (e.g., Logan et al. 2004; Massey and Denton 1993). 3<br />
1. The U.S. Census Bureau granted permission for the use of these internal files and none of the statistics presented<br />
in this article violate respondent confidentiality rules.<br />
2. The segregation estimates presented in the descriptive tables (means across all metropolitan areas) are weighted<br />
by the population size of the minority and socioeconomic group in question. This has the advantage of giving relatively<br />
little weight to metropolitan areas with small populations of the group in question, where index scores are sometimes<br />
highly variable and skewed by random factors (<strong>Iceland</strong> et al. 2002).<br />
3. Choosing a smaller unit of analysis increases segregation scores, as smaller units tend to be more homogenous.<br />
For example, the average metropolitan area dissimilarity score for African Americans was 0.640 when using census<br />
tracts, but moderately higher at 0.669 when using block groups (<strong>Iceland</strong> and Steinmetz 2003). Census tract and blockgroup<br />
based scores, however, are very highly correlated, so it is unlikely that using an alternate unit would affect conclusions<br />
about the effect of class on segregation over time.
254 ICELAND/WILKES<br />
The 1990 census collected information on four racial groups: white; black; American<br />
Indian, Eskimo, or Aleut; and Asian or Pacific Islander. A separate question asked whether an<br />
individual was of Hispanic origin. After much research and public comment during the<br />
1990s, OMB revised the racial classification for Census 2000 to include five categories: white;<br />
black or African American; American Indian or Alaska Native; Asian; and Native Hawaiian or<br />
other Pacific Islander. It also allowed individuals to report more than one race. Census 2000<br />
figures indicate that 6.8 million, or 2.4 percent of the population, reported more than one<br />
race. This study focuses on the residential patterns of African Americans, Hispanics, Asians<br />
and Pacific Islanders, and non-Hispanic whites. 4 For 2000, minority groups in this analysis<br />
included individuals who identified as being a member of that minority group, either alone or<br />
in combination with another race. Non-Hispanic whites consist of those who marked only<br />
white and who indicated that they were not Hispanic. 5<br />
This analysis uses the index of dissimilarity to measure residential patterns. The dissimilarity<br />
index (D) is a measure of evenness, and is computed as:<br />
n<br />
<br />
D .5 x i X y i Y<br />
i=1<br />
where n is the number of tracts in a metropolitan area, x i<br />
is the population size of the minority<br />
group of interest in tract i, X is the population of the minority group in the metropolitan<br />
area as a whole, y i<br />
is the population of the reference group (usually non-Hispanic whites) in<br />
tract i, and Y is the population of the reference group in the metropolitan area as a whole.<br />
Dissimilarity ranges from 0 (complete integration) to 1 (complete segregation) and essentially<br />
measures the percentage of a group’s population that would have to change residence<br />
for each neighborhood to have the same percentage of that group as the metropolitan area<br />
overall. Consider a hypothetical metropolitan area where 20 percent of the population is<br />
African American. If every single neighborhood within the metropolitan area is 20 percent<br />
African American, then the dissimilarity score would equal 0. If some neighborhoods contained<br />
only African American residents and the rest had none, then the score would equal 1.<br />
Other distributions fall somewhere in between. A dissimilarity score of 0.90 would indicate<br />
that 90 percent of the African American population would need to move to other neighborhoods<br />
in order for African Americans to be equally distributed across neighborhoods. A good<br />
rule of thumb is that scores less than 0.30 indicate low segregation, 0.30 to 0.60 indicate<br />
moderate segregation, and scores over 0.60 indicate a very high level of segregation (Massey<br />
and Denton 1993).<br />
There are certainly other measures available that capture different dimensions of segregation<br />
(see <strong>Iceland</strong> et al. 2002; Massey and Denton 1988; Massey, White, and Phua 1996; Reardon<br />
and O’Sullivan 2004), however, this analysis relies on the dissimilarity index because it is<br />
easily interpreted and remains, by far, the most widely used segregation index. 6 Although we<br />
4. We do not examine residential patterns of American Indians and Alaska Natives because changes in the way<br />
the question on race was asked in the 2000 census had the largest effect on the segregation indexes of this group (<strong>Iceland</strong><br />
et al. 2002)<br />
5. Our more inclusive racial definition means that the minority group definitions are not mutually exclusive.<br />
Some of those who are African American may also, for example, be Asian. Other work has shown that adopting a race<br />
definition where a person is considered in a group if he or she chooses only that particular group has little effect on African<br />
American segregation calculations and a modest effect on Asian segregation calculations (<strong>Iceland</strong> et al. 2002,<br />
Appendix A). The similarity of scores across group definitions results, in large part, from the fact that the proportion of<br />
people who marked two or more race groups in the 2000 census was small (2.4 percent). Hispanic indexes are not<br />
affected by this specific issue since Hispanic origin is asked in a separate question. Methodologically, the most important<br />
issue is to ensure that the two groups used in any given index calculation are mutually exclusive, which is indeed the<br />
case in this analysis.<br />
6. It should be noted that one feature of the dissimilarity index is that low scores can be achieved in metropolitan<br />
areas that are not particularly diverse overall (and thus its component neighborhoods are not diverse either). We also<br />
considered presenting findings using another common segregation measure—the isolation index—but decided against it
Race, Class, and Residential Segregation 255<br />
are aware that the dissimilarity index is but one common measure of segregation, we use the<br />
terms “segregation” and “dissimilarity” interchangeably, throughout. Dissimilarity or segregation<br />
“scores” in the discussion below refer to the values of the dissimilarity index for a particular<br />
group in question.<br />
We look at the three traditional dimensions of socioeconomic status: income, occupation,<br />
and <strong>edu</strong>cation, and add a fourth—poverty status—which is a function of income. Thus,<br />
we measure class in more ways than most previous studies, many of which examine only one<br />
dimension. In general, the problem with treating only income (or <strong>edu</strong>cation or occupation)<br />
as “class” is that it overlooks the other important indicators of socioeconomic status. Status<br />
group communities often form around various sets of commonalities that include income,<br />
occupation status, and <strong>edu</strong>cational attainment (Weber 1968; White 1987). While theory does<br />
not provide strong predictions about which dimension of SES is most important in determining<br />
residential patterns, some previous empirical analyses indicate that there may be some<br />
modest differences when alternative SES indicators are used (Clark and Ware 1997; Darden<br />
1987; Darden and Kamel 2000; Massey 1988). Although the evidence is somewhat mixed,<br />
income may be the least important measure of socioeconomic status for explaining black–<br />
white segregation, while <strong>edu</strong>cation may be a little more important (Clark and Ware 1997;<br />
Darden 1987; Darden and Kamel 2000).<br />
Because the dissimilarity index involves pair-wise comparisons, it is preferable to have a<br />
relatively small number of categories within each of the SES dimensions. Education is split<br />
into four fairly standard groups used in analyses: less than high school, high school graduate,<br />
some college, and college graduate (e.g., St. John and Clymer 2000). Occupations are also<br />
split into four general categories sometimes used by other researchers: managerial, professional,<br />
and technical; sales and administrative; service occupations; and farming, precision<br />
crafts, and operators (e.g., Darden and Kamel 2000). We split income groups into four categories,<br />
as do some other studies (Darden and Kamel 2000; Massey and Fischer 1999). For this<br />
study, the groups are represented by approximate household income quartiles in 1990 and in<br />
2000. Finally, we include an indicator of poverty (e.g., Fischer 2003). 7 In the multivariate<br />
analysis we also include an additional control for percent native born, as this may play a role<br />
in the residential patterns of Asians and Hispanics in particular (<strong>Iceland</strong> and Lake 2004).<br />
When we present mean segregation scores for different racial groups by SES, one important<br />
methodological issue in the descriptive analysis is who the reference group should be.<br />
Many previous studies, when focusing on the effect of class, chose, for example, to look at<br />
the segregation of middle class African Americans from middle class whites, in other words,<br />
segregation “controlling for class” (Clark and Ware 1997; Darden 1987; Darden and Kamel<br />
2000; Denton and Massey 1988; Farley 1977). In one sense, this is an appropriate comparison<br />
if one wants to look at issues of “locational attainment” related to the place stratification<br />
for two reasons. First, the isolation index is strongly affected by the relative size of groups being compared in metropolitan<br />
areas, such that larger groups will be more isolated than smaller groups, holding other factors constant. While this is<br />
not an inherently undesirable feature of an index, it does mean that when we look at isolation scores for specific SES<br />
groups, we find that larger SES groups are often characterized by higher levels of isolation (e.g., the nonpoor of all race<br />
groups are much more isolated than the poor). We would like this study to focus explicitly on how evenly groups are<br />
distributed across neighborhoods, and how this varies by socioeconomic status, thus the dissimilarity index is the more<br />
appropriate measure. Second, there are already many comparisons included in this study (comparisons across race,<br />
class, and time) such than adding another index adds yet another dimension to already numerous comparisons. It<br />
should be noted that the most basic conclusions of this study actually do not change very much if isolation is used in<br />
addition to dissimilarity, though the addition of isolation does add greater complexity and produce a more mixed set of<br />
patterns due to the properties of the isolation index mentioned above. See <strong>Iceland</strong>, Sharpe, and Steinmetz (2005) for a<br />
study that focused on African American class segregation using both the dissimilarity and isolation indexes.<br />
7. For the <strong>edu</strong>cation segregation indexes, only individuals age 25 and over are included in the analysis. For the<br />
occupation indexes, only workers are included. Household income indexes omit people in group quarters, while the<br />
poverty indexes do not include people not in the poverty universe—such as people in institutions, military group quarters,<br />
and college dormitories.
256 ICELAND/WILKES<br />
model because it can help answer the question: Are African Americans and whites of the<br />
same class living in similar neighborhoods?<br />
It is not necessarily appropriate, however, to “control for class” if the goal is to test the<br />
spatial assimilation model. The spatial assimilation model would not predict, for example, that<br />
the segregation score of higher-SES blacks from higher SES whites would be lower than that of<br />
lower-SES blacks from lower-SES whites. This spatial assimilation model holds, rather, that<br />
SES (and acculturation) differences across groups help to explain overall patterns. Because<br />
this study does not focus on issues of locational attainment, we would argue that the most<br />
appropriate comparison here is to look at whether higher SES African Americans, Hispanics,<br />
and Asians are less segregated from non-Hispanics whites as a whole. One implication is that<br />
if SES levels rose for any of these groups in the future, then overall segregation between<br />
whites and blacks, Hispanics, or Asians would decline as SES rose for each of these minority<br />
groups. This type of reference group comparison has also been used by some other studies<br />
(e.g., Massey and Fischer 1999; and St. John and Clymer 2000, who used both methods).<br />
In order to capture both of these perspectives, however, we calculate the dissimilarity<br />
indexes both ways. First, we present dissimilarity indexes for each minority SES group vis-àvis<br />
all non-Hispanic whites (the second method described above, but our preferred method).<br />
Second, we compare the segregation of each minority SES group vis-à-vis non-Hispanic<br />
whites of the same SES. Our descriptive tables also contain a third comparison: We calculate<br />
indexes that look at class segregation within race groups. This comparison helps to provide<br />
perspective for the racial and ethnic dissimilarity scores.<br />
Results<br />
Table 1 presents the percentage of each group that is within a particular socioeconomic<br />
category. As expected, blacks and Hispanics tend to be more concentrated in lower SES categories<br />
than Asians and Pacific Islanders or whites. For example, a higher proportion of non-<br />
Hispanic whites than African Americans or Hispanics are in the top household income category,<br />
not poor, have a B.A. degree or higher, and are in managerial, professional, or technical<br />
occupations.We generally see declines in the proportion of blacks and Hispanics in the lowest<br />
SES categories between 1990 and 2000. There is also an increase in the proportion of all<br />
racial/ethnic groups who were in managerial, professional, and technical occupations.<br />
Table 2 presents the dissimilarity indexes using the different reference groups described<br />
earlier. Several patterns emerge. First, we see—as previous studies have documented—that<br />
black–white segregation is higher than that for the other minority groups in the table. Moreover,<br />
even when we consider specific SES categories, we still see that black–white segregation<br />
is higher than Hispanic–white and Asian–white segregation, even when compared to non-<br />
Hispanic whites of the same SES. 8 This supports the place stratification model, which predicts<br />
that blacks would be the most disadvantaged group.<br />
When looking at the first set of indexes where all non-Hispanic whites are the reference<br />
group, we see that for all race groups, higher SES group members tend to be less segregated<br />
from whites than lower SES members, providing support for the hypothesis that SES status<br />
substantially affects patterns of racial segregation. This suggests that an increase in the average<br />
SES of a race group would decrease their segregation from non-Hispanic whites, other<br />
factors being equal. Note that the significance of these findings will be tested in the multivariate<br />
analysis, in which we will also control for other metropolitan and group characteristics.<br />
8. It should be noted that one of the properties of the dissimilarity index is that the overall segregation score for<br />
each race group is not simply an average of the segregation of each component class group. For example, it is possible<br />
for each Asian SES group to have higher segregation from non-Hispanic whites than Asians as a whole if each Asian SES<br />
group tends to occupy their own residential niches but Asians as a whole are more evenly spread across neighborhoods.
Race, Class, and Residential Segregation 257<br />
Table 1 • Distribution of Race Groups across Socioeconomic Status Categories in U.S. Metropolitan Areas, 1990 and 2000 a<br />
African Americans Hispanics<br />
Asians and<br />
Pacific Islanders Non-Hispanic Whites Total<br />
1990 2000 1990 2000 1990 2000 1990 2000 1990 2000<br />
Household income quartiles<br />
$17,499 ($19,999 in 2000) 35.7 27.9 28.4 21.5 16.3 13.7 15.7 11.4 19.5 15.3<br />
17,500–32,499 (20,000–44,999) 25.4 31.8 28.4 35.0 19.7 22.9 22.4 25.2 23.3 27.4<br />
32,500–49,999 (45,000–74,999) 19.5 23.1 22.1 25.2 21.4 25.6 25.1 28.7 23.9 27.3<br />
50,000 or over (75,000 or over) 19.4 17.3 21.1 18.3 42.5 37.8 36.9 34.7 33.2 30.1<br />
Poverty<br />
Poor 27.7 23.5 24.5 22.2 14.0 12.7 7.6 7.1 12.1 11.8<br />
Nonpoor 72.3 76.5 75.5 77.8 86.0 87.3 92.4 92.9 87.9 88.2<br />
Education (population 25 years and over)<br />
12th grade or less 34.5 24.7 49.8 47.2 22.2 19.5 18.7 12.8 23.1 18.7<br />
High school diploma or equivalent 27.9 28.9 21.4 21.9 18.1 16.7 30.0 28.1 28.7 26.9<br />
Some college 25.4 30.3 19.4 20.1 22.5 21.6 26.7 29.1 25.9 27.8<br />
Bachelor’s degree or higher 12.3 16.1 9.4 10.8 37.2 42.3 24.5 30.1 22.3 26.7<br />
Occupation<br />
Managerial, professional, technical 19.5 23.2 15.2 16.3 34.6 39.8 31.9 36.5 29.1 32.4<br />
Sales and administrative 27.4 28.7 24.0 23.9 28.4 26.3 30.7 28.9 29.6 28.1<br />
Service occupations 24.0 23.5 19.7 22.7 15.4 15.4 12.2 13.5 14.3 16.1<br />
Farming, precision, and operators 29.0 24.7 41.1 37.0 21.6 18.6 25.2 21.1 27.0 23.5<br />
Source: Tabulations of 1990 and 2000 decennial census data. N 331 metropolitan areas.<br />
a Numbers are in percent.
258 ICELAND/WILKES<br />
Table 2 • Dissimilarity Indexes for Socioeconomic Groups, 2000<br />
Segregation of Minority SES Group<br />
from All Non-Hispanic Whites<br />
Segregation of Minority SES Group<br />
from Non-Hispanic Whites of Same SES<br />
(Within Race) (Group Segregation)<br />
by SES Status a<br />
Black Hispanic Asian Black Hispanic Asian Total Black Hispanic Asian White<br />
Total 0.643 0.513 0.422 NA NA NA NA NA NA NA NA<br />
Household income quartiles<br />
$19,999 or less 0.697 0.631 0.603 0.631 0.542 0.534 0.311 0.312 0.284 0.443 0.272<br />
20,000–44,999 0.644 0.568 0.513 0.609 0.513 0.483 0.188 0.185 0.188 0.335 0.190<br />
45,000–74,999 0.615 0.509 0.466 0.614 0.497 0.460 0.146 0.232 0.215 0.286 0.137<br />
75,000 or over 0.597 0.439 0.432 0.629 0.493 0.427 0.325 0.360 0.337 0.386 0.292<br />
Poverty<br />
Poor 0.706 0.646 0.616 0.636 0.548 0.540 0.351 0.317 0.284 0.447 0.299<br />
Nonpoor 0.605 0.486 0.405 0.612 0.495 0.409 0.356 0.326 0.290 0.447 0.300<br />
Education (population 25 years and over)<br />
12th grade or less 0.689 0.621 0.575 0.642 0.521 0.530 0.322 0.281 0.314 0.402 0.271<br />
High school diploma or equivalent 0.643 0.503 0.486 0.628 0.464 0.473 0.166 0.162 0.174 0.280 0.187<br />
Some college 0.602 0.414 0.431 0.600 0.410 0.429 0.121 0.183 0.259 0.231 0.107<br />
Bachelor’s degree or higher 0.552 0.360 0.411 0.574 0.390 0.404 0.342 0.344 0.403 0.368 0.321<br />
Occupation<br />
Managerial, professional, technical 0.563 0.369 0.398 0.576 0.406 0.388 0.244 0.236 0.305 0.324 0.213<br />
Sales and administrative 0.613 0.470 0.440 0.602 0.462 0.432 0.086 0.141 0.174 0.209 0.084<br />
Service occupations 0.642 0.544 0.491 0.611 0.509 0.477 0.166 0.184 0.192 0.299 0.141<br />
Farming, precision, and operators 0.619 0.590 0.530 0.593 0.533 0.513 0.226 0.181 0.232 0.347 0.220<br />
Source: Tabulations of 2000 decennial census data. N 331 metropolitan areas.<br />
a All people of the same race who are not in that particular SES category.
Race, Class, and Residential Segregation 259<br />
Figure 1 • Differences in the Segregation of the Highest and Lowest SES Groups from<br />
non-Hispanic Whites, 2000<br />
However, the effect of class varies by race, as was also hypothesized, such that it tends to<br />
matter less for African Americans than for Hispanics and Asians. For example, among blacks,<br />
the difference between the dissimilarity scores of the highest and lowest income quartiles is<br />
16.9 percent, which is considerably lower than the differences for Hispanics (43.5 percent) or<br />
for Asians and Pacific Islanders (39.5 percent). 9 We see this same type of pattern for poverty,<br />
<strong>edu</strong>cation, and occupation, as illustrated in Figure 1. 10<br />
Comparing the dissimilarity scores between the high and low SES groups also indicates<br />
that only a modest amount of the high overall levels of black segregation can be attributed to<br />
class differences. After all, the dissimilarity scores for even the high SES groups are high in<br />
absolute terms—all are over 0.550. Thus, for blacks, the spatial assimilation model does only<br />
a moderate job of explaining residential patterns.<br />
For Asians and Hispanics, the difference in the segregation of high and low SES people<br />
from non-Hispanics whites is considerable. In fact, for a couple of high SES categories, such<br />
as Hispanics with a B.A. degree or higher or nonpoor Asians, these groups are about as segregated,<br />
or are more segregated, from Hispanics and Asians of other classes, respectively, than<br />
they are from non-Hispanic whites. For example, the dissimilarity score for Hispanics with a<br />
B.A. is 0.360 when the reference group is all non-Hispanic whites, 0.390 when the reference<br />
group is non-Hispanic whites with a B.A. or higher, and 0.403 when the reference group is all<br />
other Hispanics (those with less than a B.A.). More often than not, however, particular SES<br />
groups are indeed more segregated from whites than from other members of the same race.<br />
Another issue meriting discussion is whether the dimension of socioeconomic status that we<br />
consider makes a difference in these comparisons. First, from Figure 1 it does appear that<br />
minority segregation from whites varies across all the SES dimensions in the analysis (income,<br />
9. The computation is: ([0.697 0.597]/0.597), where 0.597 is the dissimilarity score for the highest income<br />
quartile and 0.697 is the score for the lowest quartile.<br />
10. The specific SES groups compared in Figure 1 are: first income quartile versus fourth income quartile; poor<br />
versus not poor; less than high school <strong>edu</strong>cation versus B.A. or greater; and managerial, professional, and technical versus<br />
farming, precision, and operators.
260 ICELAND/WILKES<br />
poverty, <strong>edu</strong>cation, and occupation). 11 Education is the dimension of SES that consistently had<br />
a relatively high level of variation. This corresponds to the findings from Darden (1987) and William<br />
Clark and Julian Ware (1997). Income seems to often be one of the less salient dimensions of<br />
SES. Nevertheless, we do, descriptively, see differences in segregation across all SES dimensions,<br />
such that it would be fair to say that all are important in explaining residential patterns.<br />
Table 3 shows the percentage change in dissimilarity scores from 1990 to 2000. For blacks,<br />
we generally see a decline in the segregation from all whites and from whites of the same SES for<br />
those in higher SES categories. However, as also reported in <strong>Iceland</strong>, Sharpe, and Steinmetz<br />
(2005), segregation from non-Hispanic whites increased for low-SES African Americans. 12<br />
There is no clear pattern for Hispanics and Asians. A small majority of Hispanic SES<br />
groups appeared to experience increases in segregation when looking at either segregation<br />
from all whites or from whites of the same SES, mirroring the overall increase. Neither is<br />
there an obvious pattern for Asians, where low income groups and the poor experienced declines<br />
in segregation, but lower (and the highest) <strong>edu</strong>cational groups may have experienced<br />
increases in segregation. Thus, we cannot conclude that the spatial assimilation model became<br />
a better (or worse) predictor of Asian and Hispanic segregation patterns over the 1990s,<br />
although it did appear to become a better predictor for blacks. This is also tested in the following<br />
multivariate model.<br />
The final set of columns in Table 3 shows that intragroup class segregation tended to<br />
decline for all race groups, except, to some extent, among non-Hispanic whites. That is, in<br />
contrast to patterns that had been described in the 1970s and 1980s by William Julius Wilson<br />
(1996) and Massey (1996), most groups of low SES and high SES African Americans experienced<br />
little change or became less segregated from each other over the 1990s. The same pattern<br />
holds for Hispanics and Asians, where there tended to be less intragroup segregation<br />
across SES groups in 2000 than in 1990.<br />
Multivariate Analysis<br />
While the findings from the descriptive tables are informative, they are only suggestive.<br />
Thus, we ran multivariate models that examine the contributions of race and class to the residential<br />
patterns of different groups, while also controlling for other metropolitan area characteristics.<br />
To gauge how segregation scores differ across race groups in all U.S. metropolitan<br />
areas, we adopted the strategy of pooling the segregation scores of different groups and<br />
including dummy variables for each group (e.g., Massey and Denton 1989; Wilkes and <strong>Iceland</strong><br />
2004). In this analysis, the dependent variable represents the segregation of each racial/<br />
ethnic group by SES from all non-Hispanic whites. For example, for each metropolitan area,<br />
we have dissimilarity scores for African Americans, Asians, and Hispanics in the four income<br />
quartiles for a total of 12 scores for each metropolitan area in a particular model. Because the<br />
same metropolitan areas are included several times in the equation we produce corrected<br />
standard errors using generalized linear regression models that account for the fact that the<br />
independent variables have a correlated error structure. 13<br />
11. It should be noted that these dimensions are all correlated with each other, and that the occupation categories<br />
do not necessarily have a clear rank ordering, except that the “managerial, professional, and technical” category is the<br />
highest SES group of the ones listed.<br />
12. Note that the overall percentage of change in segregation of a race group is not simply an average of the percent<br />
change in segregation of each SES group from non-Hispanic whites. For example, particular SES groups can<br />
become more segregated from whites but segregation of the race group as a whole can decline if the proportion of the<br />
race group in the least-segregated SES group increases while those in the highest segregated SES group declines (i.e., a<br />
compositional shift).<br />
13. Since our goal is to explain variation across metropolitan areas, we run unweighted regression models. Because<br />
of this, the multivariate analyses contain segregation scores for particular racial and ethnic groups (i.e., black, Asian,<br />
and Hispanic) only if there are at least 1,000 people of that group present in the metropolitan area. Segregation indexes<br />
for metropolitan areas with small minority populations are less reliable than those with larger ones (<strong>Iceland</strong> et al. 2002).
Race, Class, and Residential Segregation 261<br />
Table 3 • Percentage Change in Dissimilarity Indexes for Socioeconomic Groups, from 1990 to 2000<br />
Segregation of Minority SES Group<br />
from All Non-Hispanic Whites<br />
Segregation of Minority SES Group<br />
from Non-Hispanic Whites<br />
of Same SES<br />
(Within Race) (Group Segregation)<br />
by SES Status a<br />
Black Hispanic Asian Black Hispanic Asian Total Black Hispanic Asian White<br />
Total 5.7 1.2 1.4 NA NA NA NA NA NA NA NA<br />
Household income quartiles<br />
$17,499 ($19,999 in 2000) 3.8 1.1 2.0 2.6 1.4 2.2 0.6 3.6 3.3 9.5 0.9<br />
17,500–32,499 (20,000–44,999) 1.8 0.8 3.6 0.3 1.3 3.9 11.2 5.2 5.4 12.4 11.0<br />
32,500–49,999 (45,000–74,999) 2.2 0.5 3.7 2.1 0.3 3.3 1.7 2.5 4.8 14.1 2.4<br />
50,000 or over (75,000 or over) 3.8 2.1 0.9 2.6 4.2 2.1 3.3 1.0 4.6 9.1 3.0<br />
Poverty<br />
Poor 2.4 0.7 3.1 1.1 0.9 2.9 5.2 4.1 6.1 10.0 0.4<br />
Nonpoor 0.7 2.7 2.3 0.4 2.7 2.3 4.7 4.1 7.2 8.9 0.9<br />
Education (population 25 years and over)<br />
12th grade or less 3.6 1.3 1.9 3.3 1.4 2.6 8.2 0.5 3.6 0.8 4.2<br />
High school diploma or equivalent 1.7 5.4 2.3 0.4 2.4 2.3 12.5 6.2 12.9 1.7 18.7<br />
Some college 0.9 3.5 0.6 0.7 0.9 0.9 2.3 14.7 7.2 5.1 2.1<br />
Bachelor’s degree or higher 1.5 5.4 1.3 1.7 1.3 1.3 1.9 6.8 5.9 3.1 0.9<br />
Occupation<br />
Managerial, professional, technical 0.4 0.2 1.8 0.3 1.9 2.1 6.1 3.0 3.2 0.1 3.5<br />
Sales and administrative 1.9 4.2 2.0 0.5 1.8 1.4 10.7 8.2 13.2 4.4 –3.4<br />
Service occupations 2.6 2.1 0.5 0.7 1.3 0.5 2.9 1.3 10.1 7.1 1.3<br />
Farming, precision, and operators 2.1 2.4 3.4 1.6 1.4 3.9 2.2 0.4 5.9 1.6 1.6<br />
Source: Tabulations of 1990 and 2000 decennial census data. N 331 metropolitan areas.<br />
a All people of the same race who are not in that particular SES category.
262 ICELAND/WILKES<br />
A key feature of the model is the inclusion of dummy variables indicating whether a particular<br />
segregation score is for: African Americans (omitted category), Asians, and Hispanics,<br />
or for the first, second, third, or fourth income quartile (first quartile omitted). Thus, regression<br />
coefficients will tell us whether Asian segregation scores are systematically lower than<br />
African American scores, whether scores for fourth income quartile groups are systematically<br />
lower than for first income quartile groups, and so forth.<br />
The regressions also contain a set of interaction terms between race and SES category.<br />
These interaction terms go to the heart of the analysis, as summarized in two of the research<br />
questions posed at the beginning of the article: Do levels of segregation from non–Hispanic<br />
whites vary by SES for blacks, Hispanics, and Asians? And does SES play a substantially smaller<br />
role in explaining black–white segregation than Asian–white and Hispanic–white segregation?<br />
The models also contain a number of control variables: region (dummy variables for<br />
Northeast, Midwest, and South, with West being the omitted category), metropolitan area<br />
population size, the size of the particular minority in a given metropolitan area, the percentage<br />
of the minority group that is foreign-born, and then a series of metropolitan controls for<br />
the overall occupational, income, <strong>edu</strong>cational, poverty, and foreign-born composition. 14 The<br />
coefficients for these variables are not shown in the tables for the sake of parsimony and simplicity,<br />
and in order to focus the discussion on our hypotheses. Full table results are available<br />
from the authors.<br />
In addition to models that explain cross-sectional variation in segregation in 2000, we<br />
also run change models, where the dependent variables indicate the change in segregation of<br />
a particular race/SES group from all non-Hispanic whites. This will help us answer questions<br />
about the changing roles of race and class in producing the segregation patterns we observed<br />
over the 1990s.<br />
Tables 4 and 5 show the association between SES indicators and patterns of segregation<br />
in 2000, and changes in segregation from 1990 to 2000. There are four models in the table,<br />
each corresponding to the alternative indicators of SES used. Model 1 shows results by income,<br />
Model 2 by <strong>edu</strong>cation, Model 3 by occupation, and Model 4 by poverty status of the<br />
groups in question.<br />
All models in Table 4 show that Hispanics and Asians are less segregated from non-<br />
Hispanic whites than are blacks, controlling for a variety of metropolitan and group characteristics.<br />
For example, the Hispanic coefficient in Model 1 indicates that Hispanic dissimilarity<br />
scores are, on average, 0.074 lower than black dissimilarity scores, holding other factors<br />
constant (recall that dissimilarity scores range from 0 to 1).<br />
In addition, all models show that higher SES groups have lower segregation scores than<br />
lower SES groups. The interaction terms tend to show that higher SES Hispanics and Asians,<br />
in particular, have lower segregation scores—thus supporting the notion that class differences in<br />
segregation are larger for Hispanics and Asians than African Americans. This is also supported by<br />
other models that used Asians as the reference group, in which the interaction term between<br />
African American and the higher income quartiles are positive and significant, indicating that<br />
high income does less to r<strong>edu</strong>ce black segregation than it does for Asians (not shown).<br />
An example may help illustrate how the coefficients in the table should be interpreted.<br />
The “Asian” coefficient in Model 1 (0.063) indicates that the dissimilarity scores for Asians<br />
are 0.063 points lower than for blacks (the omitted group). The income quartile 4 coefficient<br />
(0.088) indicates that those in the highest income group have dissimilarity scores 0.088<br />
lower than those in the first income quartile. The negative (and statistically significant) sign<br />
of the interaction coefficient between Asian and quartile 4 (0.034) indicates two things:<br />
14. More specifically, the metropolitan area composition variables refer to the combined percentage of non-<br />
Hispanic whites and the minority group in question (the two groups in a particular segregation index) who are in each<br />
of the four occupational, <strong>edu</strong>cational, and income categories, the percentage who are poor, and the percentage who are<br />
foreign born.
Race, Class, and Residential Segregation 263<br />
1) for those in the highest quartile, segregation is further r<strong>edu</strong>ced if one is Asian rather than<br />
African American (that is, the effect of high SES varies by race); and 2) for those who are<br />
Asian, segregation is lower if one is in the highest income quartile rather than in the lowest<br />
income quartile (the effect of being Asian varies by class).<br />
Education is the one exception to the pattern of high SES Asians (in particular) having<br />
lower segregation scores. The positive interaction term for Asians indicates that the difference<br />
in segregation between the high and low <strong>edu</strong>cational categories is less for Asians than it is for<br />
blacks—contrary to expectations and contrary to the findings for the other SES indicators<br />
(income, occupation, and poverty). 15 For Hispanics we still see a wider SES gap by <strong>edu</strong>cation<br />
than among African Americans, except for the highest category (B.A. or above). It is not<br />
entirely clear why <strong>edu</strong>cation for Asians (and to a lesser extent Hispanics) is an exception,<br />
though descriptive statistics in Table 2 do indicate somewhat larger African American differentials<br />
in segregation from all non-Hispanic whites by <strong>edu</strong>cation and somewhat smaller Asian<br />
differentials by <strong>edu</strong>cation than when considering other SES dimensions (particularly income<br />
and poverty status). 16<br />
In summary, the results from Table 4 indicate that: 1) the levels of racial and ethnic segregation<br />
of African Americans, Hispanics, and Asians from non-Hispanic whites vary by class,<br />
as the spatial assimilation model would predict; 2) African Americans are more segregated<br />
from non-Hispanic whites than are other groups, even after controlling for a number of metropolitan<br />
area and group characteristics, as the place stratification model would predict; and<br />
3) SES tends to play a substantially smaller role in explaining black–white segregation than<br />
Asian–white and Hispanic–white segregation, with the exception of <strong>edu</strong>cation, as the place<br />
stratification model would predict.<br />
Table 5 shows the relationship between SES, race/ethnicity, and changes in segregation<br />
from 1990 to 2000—or, more precisely, the 2000 dissimilarity score minus the 1990 dissimilarity<br />
score. The race/ethnicity coefficients indicate that Hispanics and Asians had smaller<br />
increases (or larger declines) in segregation than African Americans had, holding other factors<br />
constant. For example, the 0.039 coefficient for Asians in Model 1 indicates that Asian<br />
dissimilarity increased by 0.039 points less (or declined by 0.039 point more, as the case may<br />
be) than African American dissimilarity scores, holding other factors constant. Results also<br />
indicate that higher SES groups experienced larger declines in segregation than did the lower,<br />
omitted SES categories.<br />
The interaction terms in the models indicate that the effect of SES often varied by race<br />
and ethnicity. A majority of the coefficients indicate that the declines in segregation were not<br />
concentrated in higher SES Asian and Hispanic groups; similar to the descriptive findings in<br />
Table 2, the patterns for these groups in Table 5 are mixed. If anything, the highest Asian SES<br />
groups experienced increases in segregation.<br />
Another example may help in the interpretation of these coefficients. If one were to ask<br />
what the average change in the dissimilarity score for Asians in the top income quartile was<br />
between 1990 and 2000, the following calculation would need to be made: the intercept<br />
(0.049) minus the Asian coefficient (0.039) minus the income quartile 4 coefficient (0.043)<br />
plus the Asian times quartile 4 coefficient (0.043) equals the change in the dissimilarity score<br />
between 1990 and 2000 (0.10). Thus, we would conclude that Asians in the top income<br />
quartile, on average, experienced small increases in segregation in the decade.<br />
15. Although the positive interaction term indicates a smaller SES effect for Asians when considering <strong>edu</strong>cation, it<br />
should be noted that the sum of coefficients still indicate that highly <strong>edu</strong>cated Asians are less segregated than highly<br />
<strong>edu</strong>cated blacks since the negative “Asian” coefficient far exceeds the positive interaction term coefficient.<br />
16. The coefficients for the control variables in the models not shown in Table 4 tend to act as expected. The coefficients<br />
that are statistically significant in at least three of the four models indicated that: segregation is higher in the<br />
Northeast and Midwest than the West (the omitted category), metropolitan areas with larger populations had higher<br />
levels of segregation, and the higher the share of the metropolitan area’s population with some college or a B.A. degree,<br />
the lower the level of segregation.
264 ICELAND/WILKES<br />
Table 4 • Generalized Linear Regressions Indicating the Association between Race, Ethnicity, and SES and Levels of Segregation, 2000<br />
Dependent Variable in All Models: Dissimilarity Score in 2000<br />
Model 1<br />
With Income as<br />
SES Indicator<br />
Model 2<br />
With Education as<br />
SES Indicator<br />
Model 3<br />
With Occupation as<br />
SES Indicator<br />
Model 4<br />
With Poverty as<br />
SES Indicator<br />
Coef. S.E. Coef. S.E. Coef. S.E. Coef. S.E.<br />
Intercept<br />
0.939** 0.308 0.981** 0.340 1.299** 0.351 0.882** 0.312<br />
Group<br />
Black (omitted)<br />
Hispanic 0.074** 0.007 0.074** 0.008 0.053** 0.007 0.056** 0.008<br />
Asian 0.063** 0.010 0.095** 0.011 0.065** 0.010 0.017 0.013<br />
Income<br />
Income quartile 1 ($20,000) (omitted)<br />
Income quartile 2 ($20,000–44,999) 0.067** 0.003<br />
Income quartile 3 ($45,000–74,999) 0.092** 0.004<br />
Income quartile 4 ($75,000) 0.088** 0.006<br />
Hispanic Quartile 2 0.011** 0.004<br />
Hispanic Quartile 3 0.023** 0.005<br />
Hispanic Quartile 4 0.019** 0.007<br />
Asian Quartile 2 0.045** 0.005<br />
Asian Quartile 3 0.048** 0.005<br />
Asian Quartile 4 0.034** 0.007<br />
Education<br />
12th grade or less (omitted)<br />
High school diploma 0.065** 0.004<br />
Some college 0.124** 0.005<br />
Bachelor’s degree or higher 0.136** 0.005<br />
Hispanic High school diploma 0.028** 0.005<br />
Hispanic Some college 0.023** 0.006<br />
Hispanic BA 0.011 0.008
Race, Class, and Residential Segregation 265<br />
Asian High school diploma 0.014* 0.005<br />
Asian Some college 0.030** 0.006<br />
Asian BA 0.034** 0.006<br />
Occupation<br />
Farming, precision, and operators (omitted)<br />
Service occupations 0.012** 0.003<br />
Sales and administrative 0.022** 0.003<br />
Managerial, professional, technical 0.066** 0.004<br />
Hispanic Service occupations 0.026** 0.004<br />
Hispanic Sales and administrative 0.052** 0.005<br />
Hispanic Managerial, professional, technical 0.048** 0.006<br />
Asian Service occupations 0.024** 0.005<br />
Asian Sales and administrative 0.043** 0.005<br />
Asian Managerial, professional, technical 0.024** 0.005<br />
Poverty status<br />
Nonpoor 0.146** 0.004<br />
Hispanic Nonpoor 0.060** 0.006<br />
Asian Nonpoor 0.131** 0.006<br />
N 3,744 3,744 3,744 1,872<br />
Log likelihood 4,188.646 4,237.676 4,379.091 2,163.474<br />
Notes: The unit of analysis is the segregation score for a particular race and SES group in a given metro area. Other controls in the model: region, metro area size, minority group size,<br />
percent of the minority group in question that is foreign-born, and metro area composition by occupational, <strong>edu</strong>cational, and income categories, poverty status, and nativity. See text<br />
for details.<br />
* p 0.05 ** p 0.01.
266 ICELAND/WILKES<br />
Table 5 • Generalized Linear Regressions Indicating the Association between Race, Ethnicity, and SES and Changes in Segregation,<br />
Changes from 1990 to 2000<br />
Dependent Variable in All Models: Changes in Segregation&ret; (2000 dissimilarity score) (1990 dissimilarity score)<br />
Model 1<br />
With Income as<br />
SES Indicator<br />
Model 2<br />
With Education as<br />
SES Indicator<br />
Model 3<br />
With Occupation as<br />
SES Indicator<br />
Model 4<br />
With Poverty as<br />
SES Indicator<br />
Coef. S.E. Coef. S.E. Coef. S.E. Coef. S.E.<br />
Intercept<br />
0.049** 0.014 0.042** 0.015 0.027 0.014 0.001 0.018<br />
Group<br />
Black (omitted)<br />
Hispanic 0.019** 0.005 0.018** 0.006 0.011 0.006 0.036** 0.005<br />
Asian 0.039** 0.006 0.036** 0.006 0.026** 0.006 0.030** 0.006<br />
Income<br />
Income quartile 1 ($20,000) (omitted)<br />
Income quartile 2 ($20,000–44,999) 0.027** 0.004<br />
Income quartile 3 ($45,000–74,999) 0.046** 0.004<br />
Income quartile 4 ($75,000) 0.043** 0.005<br />
Hispanic Quartile 2 0.007 0.006<br />
Hispanic Quartile 3 0.006 0.006<br />
Hispanic Quartile 4 0.017** 0.006<br />
Asian Quartile 2 0.013* 0.007<br />
Asian Quartile 3 0.007 0.007<br />
Asian Quartile 4 0.043** 0.007<br />
Education<br />
12th grade or less (omitted)<br />
High school diploma 0.015** 0.004<br />
Some college 0.022** 0.004<br />
Bachelor’s degree or higher 0.032** 0.005<br />
Hispanic High school diploma 0.006 0.006<br />
Hispanic Some college 0.007 0.006<br />
Hispanic BA 0.036** 0.008
Race, Class, and Residential Segregation 267<br />
Asian High school diploma 0.000 0.006<br />
Asian Some college 0.013* 0.007<br />
Asian BA 0.016* 0.007<br />
Occupation<br />
Farming, precision, and operators (omitted)<br />
Service occupations 0.008* 0.004<br />
Sales and administrative 0.004 0.004<br />
Managerial, professional, technical 0.011* 0.004<br />
Hispanic Service occupations 0.031** 0.007<br />
Hispanic Sales and administrative 0.014* 0.007<br />
Hispanic Managerial, professional, technical 0.028** 0.007<br />
Asian Service occupations 0.009 0.007<br />
Asian Sales and administrative 0.025** 0.007<br />
Asian Managerial, professional, technical 0.000 0.007<br />
Poverty status<br />
Nonpoor 0.010** 0.004<br />
Hispanic Nonpoor 0.050** 0.006<br />
Asian Nonpoor 0.032** 0.006<br />
N 3,744 3,744 3,744 1,872<br />
Log likelihood 4,869.527 4,732.617 4,810.754 2,721.471<br />
Notes: The unit of analysis is the change in segregation score for a particular race and SES group in a given metro area. Other controls in the models: region, change in metro size,<br />
minority group size, % of the minority group in question that is foreign - born, and change in metro composition by occupational, <strong>edu</strong>cational, and income categories, and poverty and<br />
nativity status. See text for details.<br />
* p 0.05 ** p 0.01.
268 ICELAND/WILKES<br />
In other models where Asians are the reference group rather than African Americans,<br />
results confirm that some higher SES African Americans in particular (top income quartile,<br />
B.A. degree or higher, and nonpoor) experienced larger declines in segregation than African<br />
Americans as a whole (not shown). These results suggest that SES—and thus the spatial assimilation<br />
model—are becoming more important in explaining African American segregation from<br />
non-Hispanic whites. The difference in segregation scores between the highest and lowest black<br />
SES groups widened over the 1990s, as also indicated by descriptive findings in Table 3. 17<br />
Conclusion<br />
This article examined the role of race and class in explaining the residential segregation<br />
of African Americans, Hispanics, and Asians from non-Hispanic whites in all U.S. metropolitan<br />
areas over the 1990 to 2000 period. The purpose was to test how well the spatial assimilation<br />
and place stratification perspectives explain patterns of residential segregation. Now we<br />
return to the four specific questions that guided this analysis. The first question asked: Do the<br />
levels of segregation of African Americans, Hispanics, and Asians from non-Hispanic whites<br />
vary by SES? Supporting the spatial assimilation model, our analysis indicated that the<br />
answer is yes. Higher SES groups were less segregated from non-Hispanic whites than were<br />
lower SES groups. The second question was: Does SES play a substantially smaller role in<br />
explaining black–white segregation than Asian–white and Hispanic–white segregation? Supporting<br />
the place stratification model, our answer is yes. We found that while SES mattered<br />
for all groups, higher SES Hispanics and Asians, particularly, had lower segregation scores<br />
than lower SES groups, supporting the notion that class plays a larger role in explaining Hispanic<br />
and Asian residential patterns than it does African American patterns.<br />
Third, we asked: Has black–white segregation declined relative to Asian–white and Hispanic–white<br />
segregation, holding other factors constant? The answer is generally no, thus<br />
supporting the place stratification perspective. Descriptive statistics indicated that the overall<br />
African American dissimilarity score declined in the 1990s while Hispanic and Asian scores<br />
did not change much in either direction. Multivariate models, however, indicated that Asian<br />
and Hispanic dissimilarity scores were more apt to decline than African American scores,<br />
once we controlled for SES and other group and metropolitan area characteristics. Among<br />
those in the highest SES categories (top income quartile, B.A. degree or higher <strong>edu</strong>cation,<br />
and the nonpoor), however, there was little difference in patterns of change across racial and<br />
ethnic groups over the decade.<br />
The answer to the fourth question—“Has there been a change in the effect of SES on<br />
racial and ethnic residential patterns?”—is yes for blacks but no for Hispanics and Asians. In<br />
particular, we found that, for high SES blacks, the difference in segregation from whites<br />
increased compared to that of low SES blacks, over the 1990 to 2000 period, providing some<br />
support for the spatial assimilation model. We saw mixed patterns for Asians and Hispanics.<br />
In short, these findings suggest that socioeconomic differences between race groups play<br />
an important role in the residential patterns we see today, although the effect is stronger for<br />
Asians and Hispanics than for African Americans. The fact that SES matters provides support<br />
for the spatial assimilation perspective, as the implication is that if and as the socioeconomic<br />
17. The coefficients for the control variables that are statistically significant in three of the four models in Table 5<br />
indicated that: segregation increased in metropolitan areas with greater population growth, segregation declined for<br />
groups that experienced an increase the proportion of their population that was foreign-born but increased in metropolitan<br />
areas where there was a general increase in the population that was foreign-born (there could be some collinearity<br />
between these variables; when controls for changes in the metropolitan area share that are foreign-born are not<br />
included in the model, the coefficient for the proportion of the group that is foreign-born is not significant in this way in<br />
most of the models), and segregation declined in metropolitan areas with an increase in the proportion of people in sales<br />
and administrative occupations.
Race, Class, and Residential Segregation 269<br />
status of minority groups rises, we will see increased integration between these racial and<br />
ethnic groups and non-Hispanic whites. And although SES mattered less for African Americans<br />
than other groups in both 1990 and 2000, we did see an increase in the strength of SES<br />
for African Americans over that time, with little clear change for Asians and Hispanics. It<br />
should be noted that the generally lower socioeconomic levels attained by minority group<br />
members are, in part, a result of racial discrimination and do not simply occur by chance.<br />
In addition, we still see some continued support for the place stratification model, which<br />
highlights the role of racial residential preferences and/or discrimination in determining residential<br />
patterns. In general, residential segregation by race and ethnicity tended to be higher<br />
than segregation by SES status. Place stratification also helps explain why African Americans<br />
were more segregated from non-Hispanic whites, and even had smaller declines in segregation<br />
from non-Hispanic whites, than Asians and Hispanics had, after we controlled for SES<br />
and other group-specific and metropolitan area factors. The one exception is that some high<br />
SES African Americans saw patterns of change in segregation that were similar to the patterns<br />
high SES Hispanics and Asians experienced.<br />
How, then, does one reconcile the fact that the overall dissimilarity score fell more for<br />
African Americans over the 1990s than for Hispanics and Asians, even though multivariate<br />
models tell a somewhat different story? The answer is the changing composition of the different<br />
racial and ethnic groups. The 1990s witnessed a significant movement of African Americans<br />
out of some of the lower SES categories (e.g., being in poverty or having less than a high<br />
school <strong>edu</strong>cation). Often this movement was greater for African Americans than it was for<br />
Asians and Hispanics. Low SES blacks, Hispanics, and Asians are all more likely to be more<br />
segregated from non-Hispanic whites than higher SES groups. Thus, compositional changes<br />
in the African American population alone, are likely to have played a role in the overall<br />
decline in black–white segregation.<br />
This implies two things. First, the effect of race and ethnicity on residential patterns has<br />
not narrowed across groups over the 1990s. That is, particular African Americans SES groups<br />
did not experience greater declines in segregation from whites than Hispanics and Asians of<br />
the same SES experienced. The continued importance of race indicates that institutional barriers<br />
to mobility and racial attitudes and preferences warrant sustained attention. Indeed,<br />
while discrimination against African Americans in the housing market declined over the<br />
1990s (Ross and Turner 2005; Turner et al. 2002), such discrimination, or at least the attitudes<br />
that drive residential choices made by whites (Charles 2000; Zubrinsky and Bobo<br />
1996), still play a role in shaping residential patterns.<br />
Second, and perhaps on a more positive note, if African Americans continue to see improvements<br />
in income, <strong>edu</strong>cation, and occupational attainment and decreases in the number<br />
of blacks living in poverty, then we can expect black–white residential segregation to decline<br />
further. The same would be all the more true for Hispanics and Asians, where we see even<br />
larger effects of SES. Hispanics and Asians did not witness a compositional shift to higher SES<br />
categories to the same extent African Americans did over the 1990s. For example, the proportion<br />
of African Americans with a B.A. or more increased by 32 percent—higher than the<br />
14 to 15 percent increases for Asians and Hispanics or the 23 percent increase for non-<br />
Hispanic whites. Future research should continue to investigate the role of SES on racial and<br />
ethnic residential segregation and determine whether the role of class in explaining residential<br />
patterns continues to increase.<br />
A related issue that merits further consideration is the role that nativity plays in segregation<br />
patterns. The fact that many Hispanics and Asians are foreign-born probably helps<br />
explain why there was no general decline in the segregation of Hispanics and Asians from<br />
non-Hispanic whites in the 1990s, as the foreign-born are more segregated than the nativeborn<br />
(<strong>Iceland</strong> and Lake 2004). Moreover, immigrants are often bifurcated in their SES attainment.<br />
Hispanic immigrants have, on average, lower levels of <strong>edu</strong>cation than other immigrants<br />
while Asian immigrants have, on average, relatively high levels of <strong>edu</strong>cation (Larsen
270 ICELAND/WILKES<br />
2004). This suggests that if the immigration of low SES Hispanics to the United States were to<br />
continue, this would tend to raise levels of Hispanic–white segregation, at least in the short<br />
run. Likewise, the continued immigration of relatively high SES Asians suggests that immigration<br />
may not have as strong an effect on Asian–white segregation. In short, how immigrants<br />
and their children fare in both <strong>edu</strong>cation and the labor market in the coming years is<br />
likely to play a very important role in determining future patterns of residential segregation<br />
among Asians and Hispanics in the United States.<br />
References<br />
Adelman, Robert M. 2004. “Neighborhood Opportunities, Race, and Class: The Black Middle Class and<br />
Residential Segregation.” City and Community 3:43–63.<br />
Adelman, Robert M., Hui-shien Tsao, Stewart E. Tolnay, and Kyle D. Crowder. 2001. “Neighborhood Disadvantage<br />
Among Racial and Ethnic Groups: Residential Location in 1970 and 1980.” Sociological<br />
Quarterly 42:603–32.<br />
Alba, Richard D. and John Logan. 1991. “Variations on Two Themes: Racial and Ethnic Patterns in the<br />
Attainment of Suburban Residence.” Demography 28:431–53.<br />
———. 1993. “Minority Proximity to Whites in Suburbs: An Individual-Level Analysis of Segregation.”<br />
American Journal of Sociology 98:1388–1427.<br />
Alba, Richard D., John Logan, and Brian J. Stults. 2000. “How Segregated are Middle-Class African<br />
Americans?” Social Problems 47:543–58.<br />
Bauman, Kurt J. and Nikki L. Graf. 2003. Educational Attainment: 2000. U.S. Census Bureau, Census 2000<br />
Brief Series, C2KBR-24. Washington, DC: U.S. Government Printing Office.<br />
Bayer, Patrick, Robert McMillan, and Kim S. Rueben. 2004. “What Drives Racial Segregation? New Evidence<br />
Using Census Microdata.” Journal of Urban Economics 56:397–407.<br />
Bishaw, Ale and John <strong>Iceland</strong>. 2003. Poverty: 1999. U.S. Census Bureau, Census 2000 Brief Series,<br />
C2KBR-19. Washington, DC: U.S. Government Printing Office.<br />
Borjas, George. 1995. “Ethnicity, Neighborhoods, and Human-Capital Externalities.” American Economic<br />
Review 85:365–90.<br />
Bobo, Lawrence and Camille Zubrinsky. 1996. “Attitudes Toward Residential Integration: Perceived Status<br />
Differences, Mere In-Group Preference, or Racial Prejudice?” Social Forces 74:883–909.<br />
Charles, Camille Z. 2000. “Neighborhood Racial-Composition Preferences: Evidence from a Multiethnic<br />
Metropolis.” Social Problems 47:379–407.<br />
———. 2001a. “Processes of Residential Segregation.” Pp. 217–71 in Urban Inequality: Evidence from Four<br />
Cities, edited by A. O’Connor, C. Tilly, and L. D. Bobo. New York: Russell Sage Foundation.<br />
———. 2001b. “Socioeconomic Status and Segregation.” Pp. 271–89 in Problem of the Century: Racial Stratification<br />
in the United States, edited by E. Anderson and D. S. Massey. New York: Russell Sage Foundation.<br />
———. 2003. “Dynamics of Racial Residential Segregation.” Annual Review of Sociology 29:167–207.<br />
Charles, Camille Z., Gniesha Y. Dinwiddie, and Douglas S. Massey. 2004. “The Continuing Consequences<br />
of Segregation: Family Stress and College Academic Performance.” Social Science Quarterly 85:1353–73.<br />
Clark, William A.V. 1986. “Residential Segregation in American Cities: A Review and interpretation.”<br />
Population Research and Policy Review 5:95–127.<br />
———. 1988. “Understanding Residential Segregation in American Cities: Interpreting the Evidence, a<br />
Reply to Galster.” Population Research and Policy Review 7:113–21.<br />
———. 1991. “Residential Preferences and Neighborhood Racial Segregation: A Test of the Schelling Segregation<br />
Model.” Demography 28:1–19.<br />
———. 1992. “Residential Preferences and Residential Choices in a Multiethnic Context.” Demography<br />
29:451–66.<br />
Clark, William A. V. and Julian Ware. 1997. “Trends in Residential Integration by Socioeconomic Status<br />
in Southern California.” Urban Affairs Review 32:825–43.<br />
Cutler, David M. and Edward L. Glaeser. 1997. “Are Ghettos Good or Bad?” The Quarterly Journal of Economics<br />
112:827–72.
Race, Class, and Residential Segregation 271<br />
Cutler, David M., Edward L. Glaeser, and Jacob L. Vigdor. 1999. “The Rise and Decline of the American<br />
Ghetto.” Journal of Political Economy 107:455–506.<br />
Darden, Joe T. 1987. “Socioeconomic Status and Racial Residential Segregation: Blacks and Hispanics in<br />
Chicago.” International Journal of Comparative Sociology 28:1–13.<br />
Darden, Joe T. and Sameh M. Kamel. 2000. “Black Residential Segregation in the City and Suburbs of<br />
Detroit: Does Socioeconomic Status Matter?” Journal of Urban Affairs 22:1–13.<br />
Denton, Nancy and Douglas S. Massey. 1988. “Residential Segregation of Blacks, Hispanics, and Asians<br />
by Socioeconomic Status and Generation.” Social Science Quarterly 69:797–817.<br />
Emerson, Michael O., George Yancy, and Karen J. Chai. 2001. “Does Race Matter in Residential Segregation?<br />
Exploring the Preferences of White Americans.” American Sociological Review 66:922–35.<br />
Erbe, Brigitte M. 1975. “Race and Socioeconomic Segregation.” American Sociological Review 40:801–12.<br />
Fainstein, Norman. 1993. “Race, Class and Segregation: Discourses about African Americans.” International<br />
Journal of Urban and Regional Research 17:384–403.<br />
Farley, John 1995. “Race Still Matters: The Minimal Role of Income and Housing Cost as Causes of Housing<br />
Segregation in St. Louis, 1990.” Urban Affairs Review 31:244–54.<br />
Farley, Reynolds. 1977. “Residential Segregation in Urbanized Areas of the United States in 1970: An<br />
Analysis of Social Class and Racial Differences.” Demography 14:497–518.<br />
Farley, Reynolds, Elaine Fielding, and Maria Krysan. 1997. “The Residential Preferences of Blacks and<br />
Whites: A Four Metropolis Analysis.” Housing Policy Debate 8:763–800.<br />
Farley, Reynolds, Charlotte Steeh, Maria Krysan, Tara Jackson, and Keith Reeves. 1994. “Stereotypes and<br />
Segregation: Neighborhoods in the Detroit Area.” American Journal of Sociology 100:750–80.<br />
Fischer, Claude S., Gretchen Stockmayer, Jon Stiles, and Michael Hout. 2004. “Distinguishing the Geographic<br />
Levels and Social Dimensions of U.S. Metropolitan Segregation, 1960–2000.” Demography 41:<br />
37–59.<br />
Fischer, Mary J. 2003. “The Relative Importance of Income and Race in Determining Residential Outcomes<br />
in U.S. Urban Areas, 1970–2000.” Urban Affairs Review 38:669–96.<br />
Freeman, Lance. 2000. “Minority Housing Segregation: A Test of Three Perspectives.” Journal of Urban<br />
Affairs 22:15–35.<br />
Friedman, Samantha and Gregory D. Squires. 2005. “Does the Community Reinvestment Act Help Minority<br />
Access Traditionally Inaccessible Neighborhoods?” Social Problems 52:209–31.<br />
Fronczek, Peter and Patricia Ann Johnson. 2003. Occupations: 2000. U.S. Census Bureau, Census 2000<br />
Brief, C2KBR-25. Washington, DC: U.S. Government Printing Office.<br />
Galster, George. 1988. “Residential Segregation in American Cities: A Contrary Review.” Population Research<br />
and Policy Review 7:93–112.<br />
Glaeser, Edward L., Matthew E. Kahn, and Jordon Rappaport. 2000 (April). “Why Do the Poor Live in<br />
Cities?” Discussion Paper No. 1891. Harvard Institute of Economic Research, Harvard University,<br />
New Haven, CT.<br />
Goering, John M. and Ron Wienk, eds. 1996. Mortgage Lending, Racial Discrimination and Federal Policy.<br />
Washington, DC: Urban Institute Press.<br />
Harrison, Roderick J. and Claudette Bennett. 1995. “Racial and Ethnic Diversity.” Pp. 141–210 in State<br />
of the Union: America in the 1990s. Vol. 2. Social Trends, edited by R. Farley. New York: Russell Sage<br />
Foundation.<br />
<strong>Iceland</strong>, John. 2004. “Beyond Black and White: Residential Segregation in Multiethnic America.” Social<br />
Science Research 33:248–71.<br />
<strong>Iceland</strong>, John and Cynthia Lake. 2004. “The Effect of Immigration on Residential Segregation in U.S.<br />
Metropolitan Areas, 2000.” Paper presented at the 2004 Population Association of America meetings,<br />
April 1–3, in Boston, MA.<br />
<strong>Iceland</strong>, John, Cicely Sharpe, and Erika Steinmetz. 2005. “Class Differences in African American Residential<br />
Patterns in U.S. Metropolitan Areas: 1990–2000.” Social Science Research 34:252–66.<br />
<strong>Iceland</strong>, John and Erika Steinmetz. 2003 (July). “The Effects of Using Census Block Groups Instead of<br />
Census Tracts When Examining Residential Housing Patterns.” U.S. Census Bureau Working Paper.<br />
Retrieved March 31, 2005, from http://www.census.gov/hhes/www/housing/resseg/pdf/unit_of_<br />
analysis.pdf.<br />
<strong>Iceland</strong>, John, Daniel H. Weinberg, and Erika Steinmetz. 2002. Racial and Ethnic Residential Segregation in<br />
the United States: 1980–2000. U.S. Census Bureau, Census Special Report, CENSR-3. Washington, DC:<br />
U.S. Government Printing Office.<br />
Krysan, Maria and Reynolds Farley. 2002. “The Residential Preferences of Blacks: Do They Explain Persistent<br />
Segregation?” Social Forces 80:937–80.
272 ICELAND/WILKES<br />
Larsen, Luke J. 2004. The Foreign-Born Population in the United States: 2003. U.S. Census Bureau, Current<br />
Population Reports, Series P20-551. Washington, DC: U.S. Government Printing Office.<br />
Lewis Mumford Center. 2001 (April 3). “Ethnic Diversity Grows, Neighborhood Integration Lags Behind.”<br />
Report by the Lewis Mumford Center. (Revised December 18, 2001). Retrieved March 31,<br />
2005, from http://mumford1.dyndns.org/cen2000/WholePop/WPreport/MumfordReport.pdf.<br />
Logan, John and Richard D. Alba. 1995. “Who Lives in Affluent Suburbs? Racial Differences in Eleven<br />
Metropolitan Regions.” Sociological Focus 28:353–64.<br />
Logan, John, Brian Stults, and Reynolds Farley. 2004. “Segregation of Minorities in the Metropolis: Two<br />
Decades of Change.” Demography 41:1–22.<br />
Massey, Douglas S. 1979. “Effects of Socioeconomic Factors on the Residential Segregation of Spanish<br />
Americans in United States Urbanized Areas.” American Sociological Review 44:1015–22.<br />
———. 1996. “The Age of Extremes: Concentrated Affluence and Poverty in the Twenty-first Century.”<br />
Demography 33:395–412.<br />
———. 2004. “Segregation and Stratification: A Biosocial Perspective.” Du Bois Review 1:1–19.<br />
Massey, Douglas S., Gretchen A. Condran, and Nancy A. Denton. 1987. “The Effect of Residential Segregation<br />
on Black Social and Economic Well-Being.” Social Forces 66:29–56.<br />
Massey, Douglas S. and Nancy A. Denton. 1988 “The Dimensions of Residential Segregation.” Social<br />
Forces 67:281–315.<br />
———. 1989. “Hypersegregation in U.S. Metropolitan Areas: Black and Hispanic Segregation along Five<br />
Dimensions.” Demography 26:373–91.<br />
———. 1993. American Apartheid: Segregation and the Making of the Underclass. Cambridge, MA: Harvard University<br />
Press.<br />
Massey, Douglas S. and Mitchell L. Eggers. 1990. “American Apartheid: Segregation and the Making of<br />
the Underclass.” American Journal of Sociology 95:1153–88.<br />
Massey, Douglas S. and Mary J. Fischer. 1999. “Does Rising Income Bring Integration? New Results for<br />
Blacks, Hispanics, and Asians in 1990.” Social Science Research 28:316–26.<br />
Massey, Douglas S. and Brendan P. Mullan. 1984. “Processes of Hispanic and Black Spatial Assimilation.”<br />
American Journal of Sociology 89:836–73.<br />
Massey, Douglas S., Michael J. White, and Voon-Chin Phua. 1996. “The Dimensions of Segregation Revisited.”<br />
Sociological Methods and Research 25:172–206.<br />
Meyer, Stephen Grant. 2000. As Long As They Don’t Move Next Door: Segregation and Racial Conflict in American<br />
Neighborhoods. Lanham, MD: Rowman & Littlefield.<br />
Park, Robert E. 1925. The City. Chicago: University of Chicago Press.<br />
Pascal, Anthony. 1967. The Economics of Housing Segregation. Santa Monica, CA: Rand.<br />
Pattillo-McCoy, Mary. 1999. Black Picket Fences: Privilege and Peril among the Black Middle Class. Chicago: University<br />
of Chicago Press.<br />
———. 2000. “The Limits of Out-Migration for the Black Middle Class.” Journal of Urban Affairs 22:225–41.<br />
Reardon, Sean F. and David O’Sullivan. 2004. “Measures of Spatial Segregation.” Sociological Methodology<br />
34:121–62.<br />
Ross, Stephen L. and Margery A. Turner. 2005. “Housing Discrimination in Metropolitan America: Explaining<br />
Changes between 1989 and 2000.” Social Problems 52:152–80.<br />
Santiago, Anne M. and Margaret G. Wilder. 1991. “Residential Segregation and Links to Minority Poverty:<br />
The Case for Latino in the United States.” Social Problems 38:492–515.<br />
Sims, Mario. 1999. “High-Status Residential Segregation among Racial and Ethnic Groups in Five Metro<br />
Areas, 1980–1990.” Social Science Quarterly 80:556–73.<br />
St. John, Craig and Robert Clymer. 2000. “Racial Residential Segregation by Level of Socioeconomic Status.”<br />
Social Science Quarterly 81:701–15.<br />
Taeuber, Karl E. and Alma F. Taeuber. 1965. Negroes in Cities: Residential Segregation and Neighborhood<br />
Change. Chicago: Aldine.<br />
Timberlake, Jeffrey M. 2004. “Change in Racial and Ethnic Inequality in American Cities, 1970 to 2000.”<br />
Paper presented at the 2004 Annual Meeting of the Population Association of America, April 1–3, in<br />
Boston, MA.<br />
Turner, Margery A. and Stephen L. Ross. 2003. Discrimination in Metropolitan Housing Markets: Phase 2—<br />
Asians and Pacific Islanders of the HDS 2000. Washington, DC: U.S. Department of Housing and Urban<br />
Development.<br />
Turner, Margery A., Stephen L. Ross, George Galster, and John Yinger. 2002. Discrimination in Metropolitan
Race, Class, and Residential Segregation 273<br />
Housing Markets: National Results from Phase 1 of the Housing Discrimination Study (HDS). Washington<br />
DC: U.S. Department of Housing and Urban Development.<br />
U.S. Census Bureau. 2002. American FactFinder Detailed Tables. Table P152A-I. “Median Household Income<br />
in 1999 (Dollars).” Census 2000 data from Summary File 3. Retrieved March 31, 2005, from http://<br />
factfinder.census.gov/home/saff/main.html?_langen&_ts.<br />
———. 2003. Summary File 1 Technical Documentation: 2000. Census of Population and Housing, Series<br />
SF1/12 (RV), Washington, DC: U.S. Government Printing Office.<br />
Weber, Max. 1968. Economy and Society, translated and edited G. Roth and C. Wittich. New York: Bedminster<br />
Press.<br />
White, Michael. J. 1987. American Neighborhoods and Residential Differentiation. New York: Russell Sage<br />
Foundation.<br />
White, Michael J. and Jennifer E. Glick. 1999. “The Impact of Immigration on Residential Segregation.”<br />
Pp. 345–72 in Immigration and Opportunity, edited by F. D. Bean and S. Bell-Rose. New York: Russell<br />
Sage Foundation.<br />
White, Michael J. and Sharon Sassler. 2000. “Judging Not Only by Color: Ethnicity, Nativity, and Neighbhorhood<br />
Attainment.” Social Science Quarterly 81:997–1013.<br />
Wilkes, Rima and John <strong>Iceland</strong>. 2004. “Hypersegregation in the Twenty-First Century.” Demography 41:<br />
23–36.<br />
Williams, Richard. 2005. “The Changing Face of Inequality in Home Mortgage Lending.” Social Problems<br />
52:181–208.<br />
Wilson, William Julius. 1996. When Work Disappears: The World of the New Urban Poor. New York: Alfred A.<br />
Knopf<br />
Yinger, John. 1995. Closed Doors, Opportunities Lost: The Continuing Costs of Housing Discrimination. New York:<br />
Russell Sage Foundation.<br />
Zubrinsky, Camille and Lawrence Bobo. 1996. “Prismatic Metropolis: Race and Residential Segregation<br />
in the City of Angels.” Social Science Research 25:335–74.
Reproduced with permission of the copyright owner. Further reproduction prohibited without permission.