Keith Busse - Steel Dynamics, Inc.
Keith Busse - Steel Dynamics, Inc.
Keith Busse - Steel Dynamics, Inc.

You also want an ePaper? Increase the reach of your titles
YUMPU automatically turns print PDFs into web optimized ePapers that Google loves.
<strong>Keith</strong> <strong>Busse</strong><br />
Chairman & CEO<br />
Theresa Wagler<br />
Chief Financial Officer<br />
Basic Materials Conference, KeyBanc Capital Markets, Boston<br />
1<br />
September 15, 2009
Forward-Looking Statements<br />
Parts of this presentation and statements made pertaining to it may express the company’s s opinions, expectations or projections regarding<br />
future events or future results, in contrast with statements that reflect historical facts. These predictive statements, which are generally<br />
preceded or accompanied by such conditional words as “anticipate, anticipate,” “intend”, “estimate, estimate,” “plan, plan,” “seek, seek,” “project” or “expect, expect,” or by the<br />
words “may”, ”should” or “could, could,” are intended to operate as “forward looking statements” of the kind permitted by the Private Securities<br />
Litigation Reform Act of 1995. That legislation protects such predictive statements by creating a “safe harbor” from liability in the event that a<br />
particular prediction does not turn out as anticipated.<br />
Forward-looking statements are not guarantees of future performance, , and one should not place undue reliance on such statements. Forward<br />
looking statements speak only as of the date of their release and are subject to many uncertainties, many of which are outside of our control,<br />
that could cause actual results to differ materially from those that were anticipated.<br />
Some, but not necessarily all, of the factors that could cause such<br />
predictive statements to turn out other than as anticipated or predicted<br />
include, among others: cyclical changes in supply and demand affecting<br />
steel and scrap metal prices and consumption; increased price competition<br />
affecting sales or margins; excess domestic or global steelmaking capacity<br />
and imports of low priced steel; the duration and continued effects of a<br />
prolonged economic recession upon general industrial activity and upon<br />
the demand for our products; difficulties in integrating acquired<br />
businesses; risks and uncertainties involving new products or new<br />
technologies; changes in the availability or cost of steel scrap or substitute<br />
materials; increases in energy costs; occurrence of unanticipated equipment<br />
failures and plant outages; labor unrest; and the effect of the elements on<br />
production or consumption.<br />
In addition, we refer you to SDI’s s detailed explanation of these and other<br />
factors and risks that may cause such predictive statements to turn out<br />
differently, as set forth in our most recent Annual Report on Form 10-K and<br />
in other reports which we from time to time file with the Securities and<br />
Exchange Commission, available publicly on the SEC Web site,<br />
www.sec.gov, and on the SDI Web site, www.steeldynamics.com<br />
2<br />
September 15, 2009
Financial Results<br />
(Amounts in millions)<br />
2007<br />
Percent<br />
2008 Change<br />
1H 2009<br />
• Net Sales $4,385 $8,081 +84%<br />
$1,607<br />
• Net <strong>Inc</strong>ome 395 463 17%<br />
• Oper. <strong>Inc</strong>ome 691 855 24%<br />
(104)<br />
(107)<br />
• Cash Flow<br />
from Operations<br />
428<br />
775<br />
81%<br />
286<br />
• Diluted EPS<br />
$2.01<br />
$2.38<br />
18%<br />
$(0.56)<br />
3<br />
September 15, 2009
Net Sales: 1996-2008<br />
$8.1 billion<br />
$ billions<br />
8.0<br />
7.0<br />
6.0<br />
5.0<br />
4.0<br />
3.0<br />
2.0<br />
1.0<br />
1H 2009<br />
$1.6 billion<br />
1996<br />
1997<br />
1998<br />
1999<br />
2000<br />
2001<br />
2002<br />
2003<br />
2004<br />
2005<br />
2006<br />
2007<br />
2008<br />
2009<br />
4<br />
September 15, 2009
SDI’s s Strengths<br />
• Diversified product mix<br />
• Technologically advanced assets<br />
• Strong production capability<br />
• Unique employee culture<br />
• Growth profile<br />
• Low cost structure/<br />
excellent profit potential<br />
5<br />
September 15, 2009
A Winning Culture<br />
• Performance-based incentive<br />
compensation<br />
• Employees have keen sense<br />
of ownership<br />
• Minimal bureaucracy<br />
• Productive teams<br />
• Adaptable and fast to react<br />
• Passionate<br />
6<br />
September 15, 2009
Business Segments<br />
• <strong>Steel</strong> Operations<br />
• Metals Recycling and<br />
Ferrous Resources<br />
• <strong>Steel</strong> Fabrication<br />
7<br />
September 15, 2009
Strategic Direction<br />
• Sustain employee operating culture<br />
• Grow organically in steel<br />
– Future greenfield<br />
– Expand existing facilities<br />
• Pursue M&A growth opportunities<br />
• Backward integrate to secure consistent<br />
supply of raw materials<br />
• Integrate downstream to diversify<br />
portfolio of value-added steel products<br />
8<br />
September 15, 2009
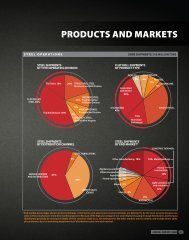
<strong>Steel</strong> Operations Shipments<br />
SWVA, <strong>Inc</strong>.<br />
265,000 tons<br />
Roanoke Bar<br />
530,000 tons<br />
Flat Roll Division<br />
2.3 million tons<br />
Engineered Bar<br />
566,000 tons<br />
Structural and Rail<br />
1.1 million tons<br />
The Techs<br />
824,000 tons<br />
2008<br />
9<br />
September 15, 2009
<strong>Steel</strong> Mills<br />
• Flat Roll Division<br />
• Structural & Rail Division<br />
• Engineered Bar Products Division<br />
• Roanoke Bar Division<br />
• <strong>Steel</strong> of West Virginia, <strong>Inc</strong>.<br />
<strong>Steel</strong> Finishing Facilities<br />
• The Techs (3 facilities)<br />
• Jeffersonville Galvanizing<br />
• Flat Roll Cold Finishing Mill<br />
• Bar Finishing<br />
Butler, Indiana<br />
Columbia City, Indiana<br />
Pittsboro, Indiana<br />
Roanoke, Virginia<br />
Huntington, West Virginia<br />
Pittsburgh, Pennsylvania<br />
Jeffersonville, Indiana<br />
Butler, Indiana<br />
Pittsboro, Indiana<br />
10<br />
September 15, 2009
<strong>Steel</strong> Operations Shipments: 1996-2008<br />
7.0<br />
6.0<br />
5.0<br />
4.0<br />
3.0<br />
2.0<br />
1.0<br />
0<br />
Millions of tons<br />
1997<br />
1996 1998 1999 2000 2001 2002 2003 2004 2005 2006 2007<br />
2008<br />
1996<br />
5.6 million<br />
2009<br />
Current<br />
Capacity<br />
7.7 million<br />
tons<br />
(including<br />
The Techs)<br />
1H 2009<br />
1.6 million<br />
tons<br />
11<br />
September 15, 2009
Structural & Rail Division<br />
Columbia City, Indiana<br />
Loading Wide-Flange Beams<br />
Structural and Rail Division<br />
12<br />
12<br />
September 15, 2009
<strong>Steel</strong> Shipments: Growth and Product Diversification<br />
Long Products<br />
SWVA<br />
Roanoke Bar<br />
Engineered Bar<br />
Structural & Rail<br />
The Techs<br />
Sheet Products<br />
Flat Roll Division<br />
13<br />
September 15, 2009
<strong>Steel</strong> Operations: Revenue growth and operating income<br />
$ billions<br />
6.0<br />
External <strong>Steel</strong> Sales<br />
$5.5B<br />
$180<br />
160<br />
Operating <strong>Inc</strong>ome per Ton<br />
$153<br />
5.0<br />
4.0<br />
140<br />
120<br />
$100<br />
3.0<br />
80<br />
2.0<br />
60<br />
1.0<br />
40<br />
20<br />
2004 2005 2006 2007 2008<br />
2004 2005 2006 2007 2008<br />
14<br />
September 15, 2009
OmniSource Profile<br />
Ferrous capacity<br />
Nonferrous volume<br />
Employees<br />
Locations<br />
Shredders<br />
7.0 million tons<br />
>1 billion lbs.<br />
2,500<br />
>70<br />
11<br />
2 nd largest ferrous scrap<br />
processor in North America<br />
New shredder at Indianapolis, mid-2008<br />
15<br />
September 15, 2009
Kalamazoo<br />
OmniSource Locations<br />
Midwest<br />
Southeast<br />
16<br />
September 15, 2009
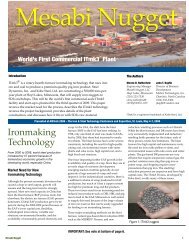
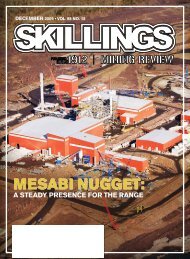
Mesabi Nugget<br />
Hoyt Lakes, Minnesota<br />
97% pure iron nuggets<br />
July 2009 photo<br />
17<br />
• Expected start-up Q4 2009<br />
• Planned 500,000 metric tons per year<br />
• $270 million project<br />
• 81% SDI / 19% Kobe <strong>Steel</strong><br />
• Plan to mine and concentrate<br />
taconite on site to produce iron<br />
feedstock for nugget plant(s)<br />
September 15, 2009
Mesabiʼs s environmentally friendly ITmk3 ironmaking process<br />
will produce only 4% of the carbon gases of blast furnaces<br />
Hoyt Lakes, Minnesota<br />
Gaseous Emissions<br />
Mesabi Mining, LLC<br />
Blast furnace process<br />
KG per MT of <strong>Steel</strong> produced<br />
ITmk3 process<br />
Carbon gases<br />
18 September 15, 2009 •<br />
•
Capitalization<br />
June 30, 2009<br />
$ Millions<br />
Cash $18<br />
Senior Secured $874 Revolver, due 2012<br />
7 3/8% Senior Notes, due 2012<br />
6 3/4% Senior Notes, due 2015<br />
7 3/4% Senior Notes, due 2016<br />
5.125% Convertible Senior Notes, due 2014<br />
Other loans<br />
Total Debt 53%<br />
$ 114<br />
700<br />
500<br />
500<br />
288<br />
43<br />
$2,145<br />
Shareholders’ Equity 47% 1,924<br />
Total Capitalization $4,069<br />
19<br />
September 15, 2009
Debt Maturities<br />
$ millions<br />
2,000<br />
$1.6 B<br />
*<br />
Cash from<br />
operations<br />
1,000<br />
$1.0 B<br />
$288<br />
0<br />
$1 $1<br />
$0<br />
2010 2011 2012 2013 2014 2015–<br />
20<br />
*<br />
$700 million of 7 3/8% senior notes,<br />
$874 million Senior Revolver matures July 2012<br />
September 15, 2009
Amended Covenants<br />
First Lien Leverage<br />
• Maximum of 2.50:1.00 through September 2010<br />
• Maximum of 3.00:1.00 December 2010 to maturity<br />
Total Debt Leverage<br />
• Covenant suspended until December 31, 2010<br />
after which it returns to a maximum of 5.00:1.00<br />
Interest Coverage Ratio<br />
• Minimum of 1.25:1.00 through December 2009<br />
• Minimum of 2.00:1.00 March 2010 to June 2010<br />
• Minimum of 2.50:1.00 September 2010 to maturity<br />
Borrowing Base Initiated<br />
• 85% of eligible accounts receivable<br />
and 65% of eligible inventory<br />
21<br />
September 15, 2009
2008 Cost of Goods Sold by Operating Segment<br />
<strong>Steel</strong><br />
2% 3%<br />
Metals Recycling<br />
Ferrous Resources<br />
<strong>Steel</strong><br />
Fabrication<br />
Gas and electricity<br />
Payroll and benefits<br />
22<br />
September 15, 2009