Job outlook for college graduates - Bureau of Labor Statistics
Job outlook for college graduates - Bureau of Labor Statistics
Job outlook for college graduates - Bureau of Labor Statistics

Create successful ePaper yourself
Turn your PDF publications into a flip-book with our unique Google optimized e-Paper software.
14<br />
Occupational Outlook Quarterly • Winter 2004-05
<strong>Job</strong> <strong>outlook</strong> <strong>for</strong> <strong>college</strong> <strong>graduates</strong><br />
by Jill N. Lacey and Olivia Crosby<br />
You’ve heard it again and again: Having a <strong>college</strong><br />
degree leads to higher earnings and more career<br />
opportunities. But is it true?<br />
For the most part, it is. When it comes to paychecks<br />
and prospects, conventional wisdom is right. On average,<br />
<strong>college</strong> <strong>graduates</strong> earn more money, experience less unemployment,<br />
and have a wider variety <strong>of</strong> career options<br />
than other workers do. A <strong>college</strong> degree also makes it<br />
easier to enter many <strong>of</strong> the fastest growing, highest paying<br />
occupations. In some occupations, in fact, having a<br />
degree is the only way to get your start.<br />
According to statistics and projections from the U.S.<br />
<strong>Bureau</strong> <strong>of</strong> <strong>Labor</strong> <strong>Statistics</strong> (BLS), <strong>college</strong> <strong>graduates</strong> will<br />
continue to have bright prospects. Data consistently show<br />
that workers who have a bachelor’s or graduate degree<br />
have higher earnings and lower unemployment than<br />
workers who have less education. And between 2002 and<br />
2012, more than 14 million job openings are projected to<br />
be filled by workers who have a bachelor’s or graduate<br />
degree and who are entering an occupation <strong>for</strong> the first<br />
time.<br />
A <strong>college</strong> education can be costly, <strong>of</strong> course, in terms<br />
<strong>of</strong> both time and money. But the rewards can be bigger<br />
than the sacrifices if a degree helps you to qualify <strong>for</strong> occupations<br />
that interest you.<br />
Keep reading to learn about the benefits <strong>of</strong> having<br />
a <strong>college</strong> degree and the demand <strong>for</strong> <strong>college</strong> <strong>graduates</strong>.<br />
Jill N. Lacey, (202) 691-5806, and Olivia Crosby, (202) 691-5716, are economists in the<br />
Office <strong>of</strong> Occupational <strong>Statistics</strong> and Employment Projections, BLS.<br />
You’ll also find out which occupations are expected to<br />
<strong>of</strong>fer the most job openings <strong>for</strong> people who are entering<br />
them <strong>for</strong> the first time. Many <strong>of</strong> these occupations employ<br />
workers who have more education than a bachelor’s<br />
degree. A box beginning on page 21 shows which occupations<br />
usually <strong>of</strong>fer the biggest financial rewards <strong>for</strong><br />
getting a graduate degree.<br />
In this article, a <strong>college</strong> graduate is defined as a<br />
person who has a bachelor’s, master’s, or doctoral<br />
(Ph.D.) degree or a pr<strong>of</strong>essional degree, such as one in<br />
law or medicine. For a discussion <strong>of</strong> associate degrees or<br />
other levels <strong>of</strong> education, see the companion article, “<strong>Job</strong><br />
<strong>outlook</strong> <strong>for</strong> people who don’t have a bachelor’s degree,”<br />
beginning on page 3 in this issue <strong>of</strong> the Quarterly.<br />
College <strong>graduates</strong>: In demand<br />
and doing well<br />
More people are going to <strong>college</strong> now than ever be<strong>for</strong>e,<br />
in part because <strong>of</strong> the career advantages that a <strong>college</strong><br />
degree confers. College-educated workers’ higher earnings<br />
and lower unemployment are good reasons to go<br />
to <strong>college</strong>, and these benefits are also evidence <strong>of</strong> the<br />
demand <strong>for</strong> <strong>college</strong> <strong>graduates</strong>. Higher earnings show that<br />
employers are willing to pay more to have <strong>college</strong> <strong>graduates</strong><br />
work <strong>for</strong> them. And lower unemployment means that<br />
15<br />
Winter 2004-05 • Occupational Outlook Quarterly
Percent<br />
<strong>college</strong> <strong>graduates</strong> are more likely to find a job when they<br />
want one.<br />
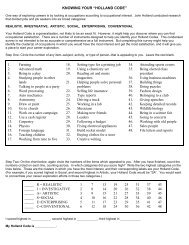
More people going to <strong>college</strong><br />
The number <strong>of</strong> people who have a <strong>college</strong> degree has<br />
been increasing steadily. According to Current Population<br />
Survey data, the number <strong>of</strong> people aged 25 and older who<br />
have a <strong>college</strong> degree grew from 35 million to 52 million<br />
between 1992 and 2004, an increase <strong>of</strong> almost 50 percent.<br />
By mid-2004, nearly 28 percent <strong>of</strong> people aged 25 and<br />
older had a bachelor’s or graduate degree. (See chart 1.)<br />
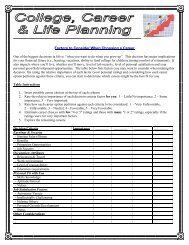
Higher earnings, lower unemployment<br />
As a whole, <strong>college</strong>-educated workers earn more money<br />
than workers who have less education. In 2003, workers<br />
who had a bachelor’s degree had median weekly earnings<br />
<strong>of</strong> $900, compared with $554 a week <strong>for</strong> high school<br />
<strong>graduates</strong>—that’s a difference <strong>of</strong> $346 per week, or a<br />
62 percent jump in median earnings. (Median earnings<br />
show that half <strong>of</strong> the workers in the educational category<br />
earned more than that amount, and half earned less.)<br />
For workers who had a master’s, doctoral, or pr<strong>of</strong>essional<br />
degree, median earnings were even higher. In<br />
addition to earning more money, workers who had more<br />
education were also less likely to be unemployed. Chart<br />
2 shows the median earnings and unemployment rates <strong>for</strong><br />
workers at various levels <strong>of</strong> educational attainment.<br />
Taken together, higher earnings and more regular<br />
employment amount to large differences in income over<br />
a lifetime. (See, <strong>for</strong> example, “More education means<br />
higher earnings—<strong>for</strong> life: Synthetic worklife earnings<br />
estimates by highest level <strong>of</strong> educational attainment,” the<br />
OOChart in the fall 2002 Quarterly.)<br />
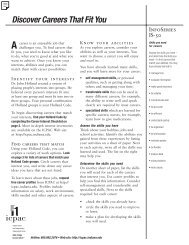
Higher earnings <strong>for</strong> workers who have a <strong>college</strong><br />
degree are part <strong>of</strong> a long-term trend. Even when adjusted<br />
<strong>for</strong> inflation, the wages <strong>of</strong> <strong>college</strong>-educated workers have<br />
Chart 1<br />
Percent <strong>of</strong> population aged 25 and older with a bachelor’s or graduate degree, 1992-2004<br />
28<br />
27<br />
26<br />
25<br />
24<br />
23<br />
22<br />
21<br />
16<br />
20<br />
1992 1993 1994 1995 1996 1997 1998 1999 2000 2001 2002 2003 2004<br />
Source: Current Population Survey<br />
Year<br />
Occupational Outlook Quarterly • Winter 2004-05
Chart 2<br />
Unemployment and earnings <strong>for</strong> full-time workers aged 25 and over, by educational attainment, 2003<br />
Unemployment rate<br />
8.8%<br />
Education<br />
Less than a high school<br />
diploma<br />
$396<br />
Median weekly earnings<br />
5.5<br />
High school diploma,<br />
including GED<br />
554<br />
5.2<br />
Some <strong>college</strong>, no degree<br />
622<br />
4.8% - National unemployment rate National median weekly earnings - $662<br />
4.0<br />
Associate degree<br />
672<br />
3.3<br />
Bachelor’s degree<br />
900<br />
2.9<br />
Master’s degree<br />
1,064<br />
1.7<br />
Pr<strong>of</strong>essional degree<br />
1,307<br />
Source: Current Population Survey<br />
2.1<br />
Doctoral degree<br />
1,349<br />
been rising over the past decade. (See chart 3.) Moreover,<br />
the earnings <strong>for</strong> <strong>college</strong>-educated workers have been increasing<br />
faster than the earnings <strong>for</strong> workers who do not<br />
have a bachelor’s degree.<br />
10<br />
The trouble with averages<br />
<strong>Statistics</strong> about <strong>college</strong> <strong>graduates</strong> paint a rosy—and<br />
numerically accurate—picture <strong>of</strong> overall employment.<br />
But the data are based on <strong>college</strong> <strong>graduates</strong> as a whole.<br />
For every graduate who earns more than the median, another<br />
earns less. And while unemployment rates are low<br />
overall, many <strong>college</strong> <strong>graduates</strong> sometimes have trouble<br />
finding work, especially if they wait <strong>for</strong> the type <strong>of</strong> job<br />
they want.<br />
The career prospects <strong>of</strong> individuals depend on many<br />
factors besides having a <strong>college</strong> degree. These factors<br />
include the local job market, the type <strong>of</strong> degree they have,<br />
their level <strong>of</strong> experience and skill, and the occupation<br />
they are trying to enter.<br />
Openings and where they will be<br />
Between 2002 and 2012, BLS projects 56 million job<br />
openings <strong>for</strong> workers who are entering an occupation <strong>for</strong><br />
the first time. Of these, at least 14 million are expected to<br />
0 2<br />
4 6 8<br />
be filled by <strong>college</strong>-educated workers. More than half<br />
<strong>of</strong> these openings are expected to come from the need<br />
to fill newly created jobs.<br />
The remaining openings <strong>for</strong> <strong>college</strong>-educated<br />
workers are projected to come from the need to replace<br />
workers who leave an occupation permanently.<br />
With many <strong>of</strong> today’s <strong>college</strong>-educated workers poised<br />
to retire, replacement needs are expected to be great,<br />
especially in large occupations.<br />
In some occupations, most workers have bachelor’s<br />
or graduate degrees. In other occupations, education<br />
levels are more varied.<br />
Many <strong>of</strong> the occupations that are expected to have<br />
the most openings <strong>for</strong> <strong>college</strong> <strong>graduates</strong> are in the<br />
business, computers and engineering, education, counseling,<br />
and healthcare fields.<br />
“Pure <strong>college</strong>” occupations<br />
For this analysis, it is assumed that each future job<br />
opening will be <strong>for</strong> a <strong>college</strong>-educated worker. In<br />
these “pure <strong>college</strong>” occupations, at least 60 percent<br />
<strong>of</strong> current workers aged 25-44 have a bachelor’s or<br />
graduate degree, fewer than 20 percent have a high<br />
school diploma or less education, and fewer than 20<br />
17<br />
Winter 2004-05 • Occupational Outlook Quarterly
18<br />
percent have some <strong>college</strong> courses but less education than<br />
a bachelor’s degree. Even if some workers do not have a<br />
bachelor’s or graduate degree, all openings are counted<br />
as being <strong>for</strong> <strong>college</strong>-educated workers because that most<br />
accurately reflects the job market new workers face. (For<br />
more about the methods used to count job openings, see<br />
the section beginning on page 25.)<br />
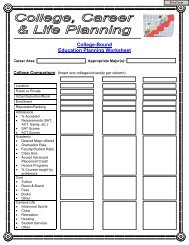
BLS projects that pure-<strong>college</strong> occupations will provide<br />
about 6.8 million openings over the 2002-12 decade<br />
<strong>for</strong> <strong>college</strong> <strong>graduates</strong> who are entering an occupation <strong>for</strong><br />
the first time. Chart 4 shows the 20 pure-<strong>college</strong> occupations<br />
expected to provide the most openings during the<br />
projections decade. Like nearly all pure-<strong>college</strong> occupations,<br />
all but one <strong>of</strong> the occupations on the chart have<br />
earnings above $27,380, the 2002 median <strong>for</strong> all workers.<br />
Despite high numbers <strong>of</strong> job openings, jobseekers<br />
can face strong competition when trying to enter<br />
Chart 3<br />
Real (inflation-adjusted) average annual earnings, by educational attainment, 1991-2001<br />
Mean weighted annual earnings, in 2001 dollars<br />
60,000<br />
55,000<br />
50,000<br />
45,000<br />
40,000<br />
35,000<br />
30,000<br />
25,000<br />
20,000<br />
some occupations, such as public relations specialists or<br />
management analysts. Because these occupations <strong>of</strong>fer<br />
high earnings and prestige and because workers can<br />
qualify with many different <strong>college</strong> majors, the number<br />
<strong>of</strong> qualified workers who want these jobs could be greater<br />
than the number <strong>of</strong> openings. Analyses <strong>of</strong> job competition<br />
are possible <strong>for</strong> a few occupations, ones <strong>for</strong> which<br />
there is anecdotal evidence or <strong>for</strong> which other data exist.<br />
To qualify <strong>for</strong> many <strong>of</strong> the occupations shown on chart 4,<br />
workers need more than a bachelor’s degree. In three <strong>of</strong><br />
the occupations—lawyers, physicians and surgeons, and<br />
pharmacists—a pr<strong>of</strong>essional degree is required. Similarly,<br />
physical therapists now train <strong>for</strong> their occupation only in<br />
a master’s or doctoral degree program.<br />
In other occupations, educational requirements are<br />
more flexible. About one-fourth <strong>of</strong> management analysts<br />
have a master’s degree, <strong>for</strong> example, but many analysts<br />
do not have education<br />
Bachelor's or graduate degree<br />
Associate degree<br />
Some <strong>college</strong>, no degree<br />
High school diploma or less<br />
1991 1992 1993 1994 1995 1996 1997 1998 1999 2000 2001<br />
Year<br />
beyond a bachelor’s<br />
degree. School teachers,<br />
too, <strong>of</strong>ten have a<br />
graduate degree, but<br />
many teachers earn<br />
that degree after they<br />
begin their careers;<br />
while employed, they<br />
take graduate-level<br />
courses to gain skills,<br />
qualify <strong>for</strong> higher<br />
salaries, and maintain<br />
certification. In many<br />
occupations, employment<br />
and advancement<br />
opportunities<br />
improve with attainment<br />
<strong>of</strong> a graduate<br />
degree, even when<br />
one is not required<br />
<strong>for</strong> career entry.<br />
Education level<br />
<strong>of</strong>ten determines<br />
the type <strong>of</strong> work<br />
a person can do<br />
within an occupation.<br />
Psychologists, <strong>for</strong> example,<br />
usually need<br />
a doctoral degree to<br />
Occupational Outlook Quarterly • Winter 2004-05
Chart 4<br />
“Pure <strong>college</strong>” occupations with the most job openings <strong>for</strong> <strong>college</strong> <strong>graduates</strong> entering the occupation <strong>for</strong> the first time,<br />
projected 2002-12<br />
Openings (thousands)<br />
Median annual<br />
earnings, 2002<br />
Postsecondary teachers<br />
Elementary school teachers,<br />
except special education<br />
Secondary school teachers,<br />
except special and vocational education<br />
458<br />
547<br />
960<br />
$49,090<br />
41,780<br />
43,950<br />
<strong>Job</strong> openin<br />
Accountants and auditors<br />
405<br />
47,000<br />
Management analysts<br />
Special education teachers<br />
Computer s<strong>of</strong>tware engineers,<br />
applications<br />
Lawyers<br />
Physicians and surgeons<br />
Middle school teachers,<br />
except special and vocational education<br />
Computer s<strong>of</strong>tware engineers,<br />
systems s<strong>of</strong>tware<br />
Clergy<br />
Pharmacists<br />
Child, family, and school<br />
social workers<br />
Education administrators, elementary<br />
and secondary school<br />
Educational, vocational, and<br />
school counselors<br />
Public relations specialists<br />
Rehabilitation counselors<br />
Mechanical engineers<br />
Market research analysts<br />
255<br />
233<br />
218<br />
207<br />
191<br />
182<br />
156<br />
144<br />
114<br />
111<br />
99<br />
86<br />
75<br />
69<br />
69<br />
66<br />
60,340<br />
43,450<br />
70,900<br />
90,290<br />
145,600+<br />
41,820<br />
74,040<br />
33,110<br />
77,050<br />
33,150<br />
71,490<br />
44,100<br />
41,710<br />
25,840<br />
62,880<br />
53,810<br />
do independent, clinical work, but some school psychologists<br />
do not need this level <strong>of</strong> education. Social workers<br />
can get some jobs with a bachelor’s degree, but to work<br />
in a clinical setting, they <strong>of</strong>ten need a graduate degree.<br />
“Mixed education” occupations<br />
Many <strong>college</strong> <strong>graduates</strong> work in occupations that employ<br />
workers who have a variety <strong>of</strong> education levels. Over the<br />
2002-12 decade, about 23 million openings are projected<br />
to be in occupations in which the number <strong>of</strong> <strong>college</strong>educated<br />
workers is significant—20 percent or more—but<br />
<strong>for</strong> which <strong>college</strong> is not the only level <strong>of</strong> education workers<br />
have. For example, <strong>of</strong> the 1.1 million job openings<br />
projected <strong>for</strong> registered nurses, over 650,000 are projected<br />
to be filled by bachelor’s or graduate degree holders<br />
based on current educational attainment patterns. Overall,<br />
<strong>of</strong> the 23 million job openings in these “mixed education”<br />
occupations, BLS expects 7.5 million to be filled by<br />
<strong>college</strong> <strong>graduates</strong>.<br />
Chart 5 shows the mixed-education occupations that<br />
are expected to provide the most openings over the projections<br />
decade <strong>for</strong> <strong>college</strong> <strong>graduates</strong> who are entering an<br />
occupation <strong>for</strong> the first time. In several <strong>of</strong> these occupations,<br />
such as registered nurses, police and sheriff’s patrol<br />
<strong>of</strong>ficers, and wholesale and manufacturing sales representatives,<br />
the education levels <strong>of</strong> workers have been rising.<br />
When hiring workers, some employers prefer their new<br />
employees to be <strong>college</strong> <strong>graduates</strong>, even though many<br />
0 200 400 600 800 1,000<br />
19<br />
Winter 2004-05 • Occupational Outlook Quarterly
Chart 5<br />
“Mixed education” occupations with the most job openings <strong>for</strong> <strong>college</strong> <strong>graduates</strong> entering the occupation <strong>for</strong> the first time,<br />
projected 2002-12<br />
Openings (thousands)<br />
Median annual<br />
earnings, 2002<br />
Retail salespersons<br />
2,077<br />
$17,710<br />
Registered nurses<br />
1,101<br />
48,090<br />
General and operations managers<br />
762<br />
68,210<br />
Customer service representatives<br />
741<br />
26,240<br />
Sales representatives, wholesale and manufacturing,<br />
except technical and scientific products<br />
First-line supervisors/managers<br />
<strong>of</strong> retail sales workers<br />
First-line supervisors/managers <strong>of</strong> <strong>of</strong>fice and<br />
administrative support workers<br />
Police and sheriff's patrol <strong>of</strong>ficers<br />
486<br />
409<br />
313<br />
662<br />
42,730<br />
29,700<br />
38,820<br />
42,270<br />
Computer systems analysts<br />
237<br />
62,890<br />
Computer support specialists<br />
216<br />
39,100<br />
Preschool teachers, except<br />
special education<br />
Social and human service assistants<br />
204<br />
202<br />
19,270<br />
23,370<br />
Chief executives<br />
197<br />
126,260<br />
Financial managers<br />
195<br />
73,340<br />
Computer programmers<br />
Sales representatives, wholesale and manufacturing,<br />
technical and scientific products<br />
Sales managers<br />
190<br />
182<br />
168<br />
Openings <strong>for</strong> <strong>college</strong> <strong>graduates</strong>,<br />
projected 2002-12<br />
Openings <strong>for</strong> people who<br />
do not have a bachelor's degree<br />
60,290<br />
55,740<br />
75,040<br />
Computer and in<strong>for</strong>mation systems managers<br />
154<br />
85,240<br />
Network systems and data<br />
communications analysts<br />
Medical and health services managers<br />
128<br />
119<br />
58,420<br />
61,370<br />
20<br />
existing workers do not have a degree.<br />
Sometimes, as is <strong>of</strong>ten the case <strong>for</strong> preschool teachers<br />
and social and human service assistants, having a degree<br />
benefits workers beyond helping them get the job. It may<br />
qualify workers to take on more complex tasks in the occupation,<br />
<strong>for</strong> example, or increase workers’ opportunities<br />
<strong>for</strong> advancement and responsibility.<br />
In other occupations—such as retail salespersons and<br />
customer service representatives—workers from every<br />
education level are represented even though most qualify<br />
after a few weeks or months <strong>of</strong> on-the-job training. A degree<br />
is not required, and many <strong>college</strong> <strong>graduates</strong> choose<br />
these occupations <strong>for</strong> reasons unrelated to education or<br />
training, such as plentiful opportunities or flexible hours.<br />
Mixed-education occupations make it difficult to<br />
measure with certainty the demand <strong>for</strong> <strong>college</strong> <strong>graduates</strong>.<br />
Defining a <strong>college</strong>-level occupation is highly subjective.<br />
Some openings in an occupation might require a degree;<br />
<strong>for</strong> other openings, a degree might be useful; and <strong>for</strong> still<br />
other openings, a degree might not make much <strong>of</strong> a difference.<br />
0 500 1,000 1,500 2,000 2,500<br />
Occupations with increasing demand:<br />
Trends and themes<br />
As a whole, occupations that employ mostly <strong>college</strong><br />
<strong>graduates</strong> are expected to gain new jobs faster than other<br />
types <strong>of</strong> occupations. Between 2002 and 2012, pure<strong>college</strong><br />
occupations are projected to grow 22 percent<br />
(continued on page 24)<br />
Occupational Outlook Quarterly • Winter 2004-05
The pay<strong>of</strong>f <strong>for</strong> graduate school: Earnings premiums by degree<br />
Table 1 shows the most common areas <strong>of</strong> study <strong>for</strong> <strong>college</strong><br />
<strong>graduates</strong> by academic degree. In many occupations, earning<br />
an advanced degree usually leads to higher earnings. This<br />
difference in earnings is commonly referred to as an earnings<br />
premium. But an advanced degree is worth more in some<br />
career fields than in others.<br />
Table 2 shows how much more money was earned in<br />
various occupations by workers who have an advanced degree<br />
compared with workers who have a bachelor’s degree. Data are<br />
reported only <strong>for</strong> occupations in which 10,000 or more workers<br />
held a bachelor’s degree and another 10,000 or more workers<br />
held a graduate or pr<strong>of</strong>essional degree. The in<strong>for</strong>mation in the<br />
table is based on 2000, 2001, 2002, and 2003 data from the<br />
Current Population Survey. The data from these 4 years were<br />
averaged to increase statistical reliability by increasing the<br />
number <strong>of</strong> workers surveyed.<br />
For most occupations, having an advanced degree<br />
increased median earnings—and the higher the degree, the<br />
larger the earnings premium. On average, having a master’s<br />
degree increased earnings by 21 percent over a bachelor’s<br />
degree. Among occupations <strong>for</strong> which there were reliable data,<br />
almost all <strong>of</strong>fered an increase in median earnings <strong>for</strong> workers<br />
who have a master’s degree. Physical therapists and network<br />
and communications systems administrators were exceptions,<br />
perhaps because many <strong>of</strong> the workers who have an advanced<br />
degree in these occupations were recent entrants and so<br />
earned less.<br />
Earnings premiums were highest in occupations that<br />
usually require an advanced degree. Psychologists have the<br />
highest earnings premium <strong>of</strong> any occupation, with master’s<br />
degree holders earning 78 percent and doctoral degree holders<br />
earning 132 percent more than bachelor’s degree holders.<br />
Many jobs in this field require a doctorate.<br />
In addition, education-related occupations paid higher<br />
than average earnings premiums <strong>for</strong> both master’s and doctoral<br />
degrees.<br />
Occupations such as management analysts, counselors,<br />
social workers, biological scientists, and market and survey<br />
researchers also paid higher than average premiums <strong>for</strong> a<br />
graduate degree.<br />
The financial benefits <strong>of</strong> advanced degrees might be<br />
understated in many occupations because newer workers are<br />
more likely to have an advanced degree, and these workers<br />
might earn less because they have less experience. The<br />
occupation <strong>of</strong> pharmacist, <strong>for</strong> example, averages some <strong>of</strong> the<br />
lowest earnings premiums <strong>for</strong> advanced degrees. In part, this is<br />
because new pharmacists now need a pr<strong>of</strong>essional degree, so<br />
the workers who have a bachelor’s degree almost always have<br />
more experience than other workers do.<br />
Overall, occupations that provide above-average earnings<br />
premiums <strong>for</strong> advanced degrees are usually those in which<br />
most workers have at least a bachelor’s degree. Earnings<br />
premiums are the highest in occupations that value advanced<br />
degrees. If a bachelor’s degree is the most education that is<br />
required in an occupation, earning an advanced degree will not<br />
always increase median earnings significantly.<br />
Table 1<br />
Number <strong>of</strong> <strong>college</strong> degrees earned and most common areas <strong>of</strong> study, 2001-02<br />
Degree Number <strong>of</strong> degrees earned, 2001-02 Most common areas <strong>of</strong> study<br />
Bachelor’s 1,375,000<br />
Business management and administrative services<br />
Education<br />
Social sciences and history<br />
Master’s 491,000<br />
Education<br />
Business management and administrative services<br />
Health pr<strong>of</strong>essions and related sciences<br />
Doctoral 45,000<br />
Education<br />
Engineering<br />
Psychology<br />
Biological and life sciences<br />
Pr<strong>of</strong>essional 82,000<br />
Law and legal studies<br />
Health pr<strong>of</strong>essions and related sciences<br />
Theological studies and religious vocations<br />
Total 1,993,000<br />
Source: National Center <strong>for</strong> Education <strong>Statistics</strong>, U.S. Department <strong>of</strong> Education<br />
21<br />
Winter 2004-05 • Occupational Outlook Quarterly
22<br />
Table 2<br />
Employment and median earnings by occupation and educational attainment, 2000-03<br />
Occupation<br />
Bachelor’s<br />
degree<br />
Median weekly earnings<br />
Master’s<br />
degree<br />
Pr<strong>of</strong>essional<br />
degree<br />
Doctoral<br />
degree<br />
Earnings premiums (percent)<br />
Master’s<br />
over<br />
bachelor’s<br />
Pr<strong>of</strong>essional<br />
over<br />
bachelor’s<br />
Doctoral<br />
over<br />
master’s<br />
Total, all occupations $838 $1,016 $1,240 $1,280 21% 48% 26%<br />
Accountants and auditors 868 1,078 1,053 24 21<br />
Actors, producers, and directors 917 1,072 17<br />
Architects, except naval 1,049 1,066 2<br />
Athletes, coaches, umpires, and related<br />
workers<br />
740 745 1<br />
Chief executives 1,657 1,765 1,664 1,907 7 0.4 8<br />
Clergy 702 731 865 895 4 23 22<br />
Clinical laboratory technologists and<br />
technicians<br />
766 856 12<br />
Compliance <strong>of</strong>ficers, except<br />
agriculture, construction, health and 960 1,090 14<br />
safety, and transportation<br />
Computer and in<strong>for</strong>mation systems<br />
managers<br />
1,415 1,640 16<br />
Computer and mathematical<br />
occupations<br />
1,080 1,237 1,326 1,442 15 23 17<br />
Computer programmers 1,037 1,141 10<br />
Computer scientists and<br />
systems analysts<br />
1,099 1,201 9<br />
Computer s<strong>of</strong>tware engineers 1,201 1,363 1,579 13 16<br />
Computer support specialists 847 996 18<br />
Database administrators 1,158 1,368 18<br />
Network and computer<br />
systems administrators<br />
1,069 1,012 -5<br />
Network systems and data<br />
communications analysts<br />
1,026 1,171 14<br />
Operations research analysts 1,058 1,140 8<br />
Counselors, social workers, and<br />
other community and social service 630 820 946 926 30 50 13<br />
specialists<br />
Counselors 614 819 33<br />
Social workers 622 813 31<br />
Designers 769 970 26<br />
Dietitians and nutritionists 646 766 19<br />
Editors 769 965 25<br />
Education administrators 765 1,136 1,297 1,392 48 70 23<br />
Elementary and middle school teachers 683 888 871 1159 30 28 31<br />
Occupational Outlook Quarterly • Winter 2004-05
Employment and median earnings by occupation and educational attainment, 2000-03 (continued)<br />
Occupation<br />
Bachelor’s<br />
degree<br />
Median weekly earnings<br />
Master’s<br />
degree<br />
Pr<strong>of</strong>essional<br />
degree<br />
Doctoral<br />
degree<br />
Earnings premiums (percent)<br />
Master’s<br />
over<br />
bachelor’s<br />
Engineering managers $1,526 $1,667 9%<br />
Pr<strong>of</strong>essional<br />
over<br />
bachelor’s<br />
Engineers 1,154 1,364 $1,050 $1,484 18 -9% 9%<br />
Aerospace engineers 1,235 1,331 8<br />
Chemical engineers 1,304 1,429 10<br />
Civil engineers 1,081 1,252 16<br />
Computer hardware engineers 1,142 1,537 35<br />
Electrical and electronics engineers 1,221 1,440 18<br />
Environmental engineers 976 1,239 27<br />
Industrial engineers, including<br />
health and safety<br />
1,092 1,250 14<br />
Mechanical engineers 1,147 1,373 20<br />
Financial managers 1,096 1,470 34<br />
Human resources managers 1,080 1,257 16<br />
Human resources, training, and<br />
labor relations specialists<br />
813 1,035 27<br />
Lawyers 927 1,144 1,519 1,527 23 64 33<br />
Librarians 636 848 33<br />
Life scientists 725 867 885 964 20 22 11<br />
Biological scientists 672 892 908 33 2<br />
Medical scientists 690 854 1,009 24 18<br />
Loan counselors and <strong>of</strong>ficers 930 1,196 29<br />
Management analysts 1,131 1,413 25<br />
Marketing and sales managers 1,157 1,440 24<br />
Medical and health services managers 1,021 1,209 1,557 1,586 18 52 31<br />
Personal financial advisors 1,089 1,394 28<br />
Pharmacists 1,338 1,377 1,402 1,366 3 5 -1<br />
Physical scientists 894 1,060 1,387 19 31<br />
Chemists and materials scientists 879 1,016 1,333 16 31<br />
Environmental scientists and<br />
geoscientists<br />
886 1,062 20<br />
Physical therapists 920 910 -1<br />
Physician assistants 1,085 1,143 5<br />
Physicians and surgeons 818 1,037 1,444 1,469 27 77 42<br />
Police and sheriff patrol <strong>of</strong>ficers 845 984 16<br />
Postsecondary teachers 700 867 1,155 1,205 24 65 39<br />
Preschool and kindergarten teachers 618 808 31<br />
Doctoral<br />
over<br />
master’s<br />
23<br />
Winter 2004-05 • Occupational Outlook Quarterly
Employment and median earnings by occupation and educational attainment, 2000-03<br />
(continued)<br />
Median weekly earnings<br />
Earnings premiums (percent)<br />
Master’s Pr<strong>of</strong>essional Doctoral<br />
Bachelor’s Master’s Pr<strong>of</strong>essional Doctoral<br />
over over over<br />
degree degree degree degree<br />
Occupation<br />
bachelor’s bachelor’s master’s<br />
Public relations specialists $815 $1,099 35%<br />
Purchasing managers 1,205 1,458 21<br />
Registered nurses 893 1,062 $904 19 1%<br />
Secondary school teachers 734 914 922 $1,108 25 26 21%<br />
Securities, commodities, and financial<br />
services sales agents<br />
1,099 1,556 42<br />
Social and community service<br />
managers<br />
745 912 22<br />
Social scientists and related workers 831 1,010 1,289 22 28<br />
Market and survey researchers 851 1,175 38<br />
Psychologists 520 928 1,206 78 30<br />
Special education teachers 670 889 33<br />
Tax examiners, collectors, preparers,<br />
and revenue agents<br />
878 1,018 16<br />
Writers and authors 768 908 18<br />
Source: Current Population Survey. Data are not reported <strong>for</strong> those categories with fewer than 10,000 workers employed or <strong>for</strong> categories containing fewer than<br />
50 observations.<br />
24<br />
(continued from page 20)<br />
overall, considerably faster than the 15-percent average<br />
growth projected <strong>for</strong> all occupations. Eighteen <strong>of</strong> the 20<br />
pure-<strong>college</strong> occupations in chart 4 are projected to grow<br />
faster than the 15-percent average <strong>for</strong> all occupations.<br />
Looking at job growth is important because occupations<br />
that are gaining jobs quickly are, in effect, showing<br />
rapidly increasing demand <strong>for</strong> workers. Some <strong>of</strong> the<br />
economic trends that are creating growth in pure-<strong>college</strong><br />
and mixed-education occupations are described below by<br />
career field.<br />
Business, finance, and sales. The growing complexity<br />
<strong>of</strong> business is expected to increase the demand <strong>for</strong><br />
<strong>college</strong> <strong>graduates</strong> in business and financial occupations.<br />
More workers will be needed to manage rising personal<br />
incomes, increased regulation <strong>of</strong> financial activity, and<br />
growing competition among businesses.<br />
Sales occupations are expected to grow along with<br />
the overall economy. Although numerous workers in<br />
these occupations do not have a <strong>college</strong> degree, many<br />
others do. Having a degree is especially valued in occupations<br />
involving sales <strong>of</strong> complex scientific or technical<br />
products.<br />
Computers and engineering. The demand <strong>for</strong> new<br />
products and new technology is expected to continue to<br />
drive growth in computer and engineering occupations.<br />
Occupations in emerging engineering specialties, including<br />
biotechnology and environmental engineering, are<br />
expected to gain jobs rapidly over the projections decade.<br />
However, these specialties are expected to remain small<br />
and provide fewer openings than larger engineering specialties,<br />
such as mechanical and computer engineering.<br />
Counseling, social service, and psychology. Numerous<br />
social trends are projected to increase the number<br />
<strong>of</strong> counselors, social workers, and psychologists needed<br />
over the 2002-12 decade. More schools are hiring trained<br />
counselors. At the same time, more people are seeking<br />
counseling <strong>for</strong> family problems, substance abuse, and<br />
mental disorders. And to ease overcrowding at prisons,<br />
many <strong>of</strong>fenders are being sent instead to rehabilitation<br />
facilities—where counselors, social workers, and psychologists<br />
are employed to assist them.<br />
Education. Most opportunities in the field <strong>of</strong> education<br />
will come from the need to replace the many teach-<br />
Occupational Outlook Quarterly • Winter 2004-05
ers and administrators who are expected to retire over the<br />
2002-12 decade. But additional positions are projected<br />
because <strong>of</strong> ef<strong>for</strong>ts to reduce class sizes and because <strong>of</strong><br />
increasing enrollments at <strong>college</strong>s and universities.<br />
Healthcare. As the population ages, the need <strong>for</strong><br />
healthcare will increase, fueling the need <strong>for</strong> more healthcare<br />
practitioners. Moreover, improvements in medical<br />
technology will create more medical and rehabilitative<br />
treatments. Those treatments are prescribed and <strong>of</strong>ten<br />
administered by workers who have a <strong>college</strong> degree.<br />
How these numbers were developed<br />
There are many ways to measure job <strong>outlook</strong> by education,<br />
and each method has both strengths and limitations.<br />
This analysis focuses on future job openings because job<br />
openings show how many new workers will be able to<br />
enter an occupation.<br />
Deciding which job openings will be filled by <strong>college</strong><br />
<strong>graduates</strong> was more complicated. Counselors and jobseekers<br />
<strong>of</strong>ten ask which occupations are “<strong>college</strong> level.”<br />
But answering that question is difficult because workers<br />
in most occupations come from many different educational<br />
backgrounds. This analysis used the education<br />
levels <strong>of</strong> current workers as an objective way to account<br />
<strong>for</strong> this variation.<br />
Like any analysis based on projections and estimates,<br />
however, this one has limitations to its accuracy. Understanding<br />
these limitations will help readers to better use<br />
the results.<br />
workers in an occupation, such as when an increased use<br />
<strong>of</strong> computer s<strong>of</strong>tware creates a greater need <strong>for</strong> s<strong>of</strong>tware<br />
engineers. The way a good or service is provided can also<br />
lead to more jobs in an occupation. Rather than relying<br />
solely on teachers and administrators to guide and<br />
educate students, <strong>for</strong> example, more schools are hiring<br />
counselors and psychologists, creating more openings <strong>for</strong><br />
those workers. In the same way, a decrease in the demand<br />
<strong>for</strong> a good or service or a change in production methods<br />
can reduce the number <strong>of</strong> jobs and openings in an occupation.<br />
The second source <strong>of</strong> job openings is replacement<br />
needs. To estimate how many workers will need to be<br />
replaced during the projections decade, BLS analysts<br />
studied the ages <strong>of</strong> current workers and the length <strong>of</strong><br />
time that workers in each occupation usually remain. In<br />
occupations that require high levels <strong>of</strong> training, workers<br />
tend to stay longer. In other occupations, especially those<br />
that have shorter training periods, workers tend to leave<br />
or retire more quickly.<br />
<strong>Job</strong> openings <strong>for</strong> <strong>college</strong> <strong>graduates</strong>. After analysts<br />
projected the number <strong>of</strong> job openings <strong>for</strong> workers entering<br />
an occupation, they estimated how many <strong>of</strong> those<br />
openings would be <strong>for</strong> <strong>college</strong> <strong>graduates</strong>. Using in<strong>for</strong>mation<br />
from 2000, 2001, and 2002 Current Population<br />
Survey data, analysts classified current workers’ educational<br />
attainment into one <strong>of</strong> three categories: A high<br />
school diploma or less, some <strong>college</strong> but no bachelor’s or<br />
graduate degree, or a bachelor’s or graduate degree. If at<br />
Methods used<br />
To estimate the demand <strong>for</strong> <strong>college</strong> <strong>graduates</strong> between<br />
2002 and 2012, BLS analysts got specific. First, they projected<br />
the number <strong>of</strong> job openings <strong>for</strong> workers entering<br />
each <strong>of</strong> more than 500 occupations over the decade. Next,<br />
analysts estimated how many <strong>of</strong> those openings would be<br />
filled by <strong>college</strong> <strong>graduates</strong>.<br />
Measuring job openings. <strong>Job</strong> openings come from<br />
two sources: The need to fill newly created jobs and the<br />
need to replace workers who retire or leave an occupation<br />
permanently <strong>for</strong> other reasons.<br />
To estimate the number <strong>of</strong> newly created jobs, analysts<br />
projected how much each occupation would grow<br />
or decline between 2002 and 2012. An occupation might<br />
gain jobs <strong>for</strong> many reasons. Sometimes, the demand <strong>for</strong><br />
a specific good or service creates the need <strong>for</strong> additional<br />
25<br />
Winter 2004-05 • Occupational Outlook Quarterly
26<br />
least 20 percent <strong>of</strong> workers in an occupation<br />
belonged to a given educational category, that<br />
level was deemed significant. Expected openings<br />
were divided among each <strong>of</strong> these significant education<br />
categories, according to how common each category was.<br />
For example, the occupation <strong>of</strong> administrative<br />
services managers includes workers in each educational<br />
category: About 23 percent have a high school diploma<br />
or less, 37 percent have some <strong>college</strong> coursework or an<br />
associate degree but no bachelor’s degree, and 41 percent<br />
have a bachelor’s or graduate degree. Projected openings<br />
were divided among the education categories using those<br />
percentages.<br />
For some occupations, a bachelor’s or graduate degree<br />
was the only education level common enough to be<br />
significant. At least 60 percent <strong>of</strong> workers in the occupation<br />
were <strong>college</strong> <strong>graduates</strong>. And fewer than 20 percent <strong>of</strong><br />
workers belonged to the other two educational categories.<br />
In these 115 “pure <strong>college</strong>” occupations, every projected<br />
opening was considered to be <strong>for</strong> a <strong>college</strong> graduate.<br />
In addition to using the three educational attainment<br />
categories, this article provides specific in<strong>for</strong>mation about<br />
the types <strong>of</strong> degrees commonly required in some occupations.<br />
This type <strong>of</strong> in<strong>for</strong>mation comes from the occupational<br />
analyses conducted <strong>for</strong> the Occupational Outlook<br />
Handbook.<br />
Earnings data. This analysis uses earnings data from<br />
two surveys: The Current Population Survey and the<br />
Occupational Employment <strong>Statistics</strong> survey. Earnings<br />
data from the Current Population Survey, which includes<br />
in<strong>for</strong>mation about workers’ education levels, were used<br />
to compare earnings by education. Earnings data from<br />
the Occupational Employment <strong>Statistics</strong> survey, which<br />
is more comprehensive, provide median earnings <strong>for</strong> an<br />
occupation as a whole.<br />
The two surveys are<br />
different. The Current<br />
Population Survey is a<br />
household survey that<br />
asks workers themselves<br />
to give earnings, occupational,<br />
and other<br />
types <strong>of</strong> in<strong>for</strong>mation;<br />
it includes<br />
self-employed workers.<br />
The Occupational<br />
Employment <strong>Statistics</strong> survey, an<br />
establishment survey, asks employers to<br />
provide earnings and occupational in<strong>for</strong>mation<br />
about their workers; it does not include the selfemployed.<br />
Limitations <strong>of</strong> the data<br />
To measure job openings <strong>for</strong> <strong>college</strong> <strong>graduates</strong>, BLS analysts<br />
needed to make assumptions about the future. First,<br />
analysts assumed that the education levels in each occupation<br />
would remain roughly the same over the 2002-12<br />
decade. In reality, the educational characteristics <strong>of</strong> some<br />
occupations change over time. Many occupations—such<br />
as registered nurses and police <strong>of</strong>ficers—have had a<br />
gradual increase in the number <strong>of</strong> workers who have a<br />
bachelor’s degree.<br />
Analysts also ignored education levels that were<br />
uncommon in an occupation; as stated previously, at<br />
least 20 percent <strong>of</strong> workers in an occupation had to have<br />
a given level <strong>of</strong> education <strong>for</strong> it to be considered significant.<br />
So, <strong>for</strong> example, even though almost 17 percent <strong>of</strong><br />
engineering technicians have a <strong>college</strong> degree, none <strong>of</strong><br />
that occupation’s projected openings were counted as<br />
openings <strong>for</strong> <strong>college</strong> <strong>graduates</strong>.<br />
Another limitation <strong>of</strong> this study is that it focuses on<br />
the number <strong>of</strong> job openings projected in an occupation.<br />
But job openings give only a partial view <strong>of</strong> the prospects<br />
that workers can expect. The number <strong>of</strong> people who will<br />
compete <strong>for</strong> those openings is also important. For most<br />
occupations, however, BLS analysts do not have enough<br />
in<strong>for</strong>mation to analyze the competition <strong>for</strong> jobs.<br />
Finally, the accuracy <strong>of</strong> this study is limited by its use<br />
<strong>of</strong> survey data. Surveys are always subject to some error<br />
because not every worker is counted and because the<br />
in<strong>for</strong>mation gathered is sometimes incorrect. In addition,<br />
the education levels <strong>of</strong> many occupations could not be de-<br />
Occupational Outlook Quarterly • Winter 2004-05
termined with statistical accuracy because the number <strong>of</strong><br />
workers surveyed was too small. In those cases, analysts<br />
substituted the education levels <strong>of</strong> similar occupations or<br />
groups <strong>of</strong> occupations that had larger numbers <strong>of</strong> workers.<br />
Even with its assumptions and limitations, however,<br />
there is evidence that estimating future job openings using<br />
the analysis described here produces accurate results.<br />
When existing jobs are separated into educational categories<br />
in such a way, the results closely match current<br />
numbers.<br />
For more in<strong>for</strong>mation<br />
This article shows expected job openings in only a few <strong>of</strong><br />
the occupations available to workers who have a <strong>college</strong><br />
degree. To compare the expected job openings in every<br />
occupation studied, see the 2004-05 Occupational Projections<br />
and Training Data bulletin, which also explains<br />
in detail the methods used in this analysis. The bulletin<br />
is available online at www.bls.gov/emp/optd/home.htm<br />
and is available <strong>for</strong> sale by calling the Superintendent <strong>of</strong><br />
Documents toll-free at 1 (866) 572-1800.<br />
To learn more about the occupations described in this<br />
article and in the bulletin, see the 2004-05 Occupational<br />
Outlook Handbook. The Handbook describes the job <strong>outlook</strong>,<br />
education and training requirements, and job duties<br />
<strong>of</strong> nearly 270 occupations and is available in many libraries<br />
and career centers and online at www.bls.gov/oco.<br />
BLS is not the only organization that gathers data on<br />
the demand and earnings <strong>for</strong> <strong>college</strong> <strong>graduates</strong>. Associations,<br />
both pr<strong>of</strong>essional ones <strong>for</strong> specific occupations and<br />
general ones like the National Association <strong>of</strong> Colleges<br />
and Employers, <strong>of</strong>ten do surveys on employers’ hiring<br />
needs, workers’ education levels, and workers’ earnings.<br />
Find contact in<strong>for</strong>mation <strong>for</strong> these associations in the Occupational<br />
Outlook Handbook or at your local library.<br />
If you are considering <strong>college</strong>, the U.S. Department<br />
<strong>of</strong> Education provides additional in<strong>for</strong>mation and<br />
assistance, including in<strong>for</strong>mation about financial aid.<br />
Most <strong>college</strong> students receive some <strong>for</strong>m <strong>of</strong> financial aid<br />
through programs administered by the Department <strong>of</strong> Education.<br />
The Department provides applications <strong>for</strong> grants<br />
and loans, lists resources <strong>for</strong> finding scholarships, and<br />
maintains a searchable database <strong>of</strong> <strong>college</strong>s and universities<br />
by location, available majors, enrollment, and other<br />
characteristics. Call the financial aid hotline toll-free at 1<br />
(800) 4FED-AID (433-3243); write the Federal Student<br />
Aid In<strong>for</strong>mation Center, P.O. Box 84, Washington, DC<br />
20044-0084; or visit online at www.studentaid.ed.gov.<br />
Projections and education statistics are a few <strong>of</strong> the<br />
factors to consider when deciding on a career. Other<br />
considerations, including working conditions, personal<br />
interests and strengths, and local labor market conditions,<br />
are also important. Career centers and labor market<br />
in<strong>for</strong>mation <strong>of</strong>fices can help you explore these matters.<br />
Find your local one-stop career center and labor market<br />
in<strong>for</strong>mation <strong>of</strong>fice by visiting America’s Service Locator<br />
online at www.servicelocator.org or by calling the U.S.<br />
Department <strong>of</strong> <strong>Labor</strong>’s toll-free career hotline, 1 (877)<br />
US2-JOBS (872-5627).<br />
A job search is about more than job <strong>outlook</strong>. Choosing<br />
an occupation that is projected to have many opportunities<br />
can ease your way into employment—but in the<br />
end, it takes only one job opening to begin finding career<br />
satisfaction.<br />
27<br />
Winter 2004-05 • Occupational Outlook Quarterly