BIOSAFOR - BIOSALINE (AGRO) FORESTRY - Central Soil Salinity ...
BIOSAFOR - BIOSALINE (AGRO) FORESTRY - Central Soil Salinity ...
BIOSAFOR - BIOSALINE (AGRO) FORESTRY - Central Soil Salinity ...

You also want an ePaper? Increase the reach of your titles
YUMPU automatically turns print PDFs into web optimized ePapers that Google loves.
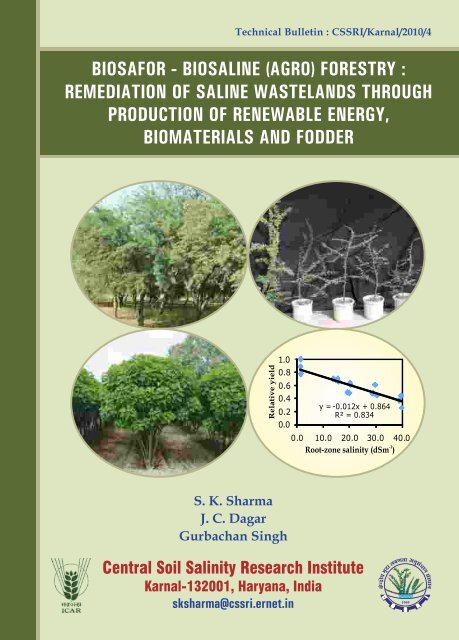
Technical Bulletin : CSSRI/Karnal/2010/4<br />
<strong>BIOSAFOR</strong> - <strong>BIOSALINE</strong> (<strong>AGRO</strong>) <strong>FORESTRY</strong> :<br />
REMEDIATION OF SALINE WASTELANDS THROUGH<br />
PRODUCTION OF RENEWABLE ENERGY,<br />
BIOMATERIALS AND FODDER<br />
Relative yield<br />
1.0<br />
0.8<br />
0.6<br />
0.4<br />
0.2<br />
0.0<br />
y = -0.012x + 0.864<br />
R² = 0.834<br />
0.0 10.0 20.0 30.0 40.0<br />
-1<br />
Root-zone salinity (dSm )<br />
S. K. Sharma<br />
J. C. Dagar<br />
Gurbachan Singh<br />
<strong>Central</strong> <strong>Soil</strong> <strong>Salinity</strong> Research Institute<br />
Karnal-132001, Haryana, India<br />
sksharma@cssri.ernet.in<br />
1969
Technical Bulletin : CSSRI/Karnal/2010/4<br />
<strong>BIOSAFOR</strong> - <strong>BIOSALINE</strong> (<strong>AGRO</strong>) <strong>FORESTRY</strong> :<br />
REMEDIATION OF SALINE WASTELANDS THROUGH<br />
PRODUCTION OF RENEWABLE ENERGY,<br />
BIOMATERIALS AND FODDER<br />
S. K. Sharma<br />
J. C. Dagar<br />
Gurbachan Singh<br />
<strong>Central</strong> <strong>Soil</strong> <strong>Salinity</strong> Research Institute<br />
Karnal- 132001, Haryana, India<br />
sksharma@cssri.ernet.in<br />
C<br />
S<br />
1969<br />
S<br />
R<br />
I
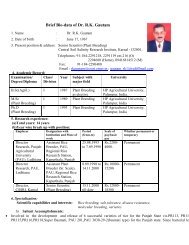
Citation :<br />
Sharma, S.K., Dagar, J.C. and Singh, Gurbachan. 2010. Biosafor - Biosaline (Agro) Forestry :<br />
Remediation of Saline Wastelands through Production of Renewable Energy, Biomaterials and<br />
Fodder. <strong>Central</strong> <strong>Soil</strong> <strong>Salinity</strong> Research Institute, Karnal - 132 001 (Haryana), India. Technical<br />
Bulletin : CSSRI/Karnal/2010/4, pp 26.<br />
Published by :<br />
Director, <strong>Central</strong> <strong>Soil</strong> <strong>Salinity</strong> Research Institute,<br />
Zarifa Farm, Kachwa Road, Karnal - 132 001 (Haryana), India<br />
Telephone : +91-184-2290501; Fax : +91-184-2290480, 2292489<br />
E-mail : director@cssri.ernet.in<br />
Website : www.cssri.org<br />
Designed & Printed at :<br />
Azad Hind Stores (P) Ltd.<br />
SCO 34, Above VanHeusen, Sector 17-E, Chandigarh<br />
Tel.: +91-172-2704511-514; Telefax : +91-172-2704513<br />
E-mail : ahsprinters@gmail.com
<strong>BIOSAFOR</strong> - <strong>BIOSALINE</strong> (<strong>AGRO</strong>) <strong>FORESTRY</strong> : REMEDIATION OF<br />
SALINE WASTELANDS THROUGH PRODUCTION OF RENEWABLE ENERGY,<br />
BIOMATERIALS AND FODDER<br />
S. K. Sharma, J. C. Dagar and Gurbachan Singh<br />
<strong>Central</strong> <strong>Soil</strong> <strong>Salinity</strong> Research Institute, Karnal- 132001,<br />
Haryana, India<br />
sksharma@cssri.ernet.in<br />
Biosaline agriculture (agro-forestry) seeks to change the problem of salinity into an opportunity. It uses the<br />
productivity of plants capable to grow under saline conditions that surpass the ranges of the classical crops<br />
and halophytes in combination with unconventional saline water resources and improved soil and water<br />
management. The main focus of the project is the remediation of saline wastelands through cultivation of<br />
biomass for energy production, bio-materials and fodder and focussing on the tree component of<br />
agroforestry systems. For example, in saline areas trees and salt-tolerant plants can be an alternative to<br />
conventional agriculture. Trees on saline wastelands produce timber for construction or for energy i.e.<br />
charcoal for cooking or electricity production through gassifires. They also function as windscreens, protect<br />
the soil against erosion, add organic matter and nitrogen in soil, help in breaking hard pans in alkali soils and<br />
above all sequester carbon helping in mitigating climate change.<br />
Background & Status<br />
<strong>BIOSAFOR</strong> research project is one of the first projects where knowledge from different disciplines in<br />
agricultural research from Agroforestry, <strong>Soil</strong> Science, Plant Sciences via GIS and policy making are combined<br />
in a research project on biosaline agriculture funded by European Union. The research focuses on tree<br />
species, largely from arid and semi-arid areas. Although for some species like Eucalyptus tereticornis or<br />
Prosopis juliflora information is available on eco-climatic conditions, for most species considered not much is<br />
known besides anecdotic knowledge. Main thrust of the project was to select a number of salt-tolerant species<br />
with good production characteristics for saline environments and to produce relevant salinity data about<br />
these species through pot trials and field surveys. As no information or very little information is available on<br />
systematic evaluation of seedlings at juvenile stage for their salt tolerance hence pot studies were included in<br />
this project. For the first time extensive knowledge is generated regarding many forest tree species and<br />
salinity thresholds and curves are defined.<br />
While traditional fresh water agriculture mainly focuses on preventing salinity in the soil and considers<br />
salinity levels of 8 dS/m (the classical USDA salinity classification ends at 16 dS/m), this research also<br />
considers extremely saline and sodic soil and water conditions. Some of the pot trials therefore include high<br />
salinity ranges up to 42 dS/m. Innovative approaches for the economic reuse of saline wastelands offering<br />
agronomic opportunities, which are not competing with the traditional agriculture for food, are in the main<br />
focus of the project.<br />
Current debate around bio energy and their relation to food security shows that there is a tremendous need<br />
for sustainable bio-fuels, which are not competing with traditional agricultural food crops. The production of<br />
woody biomass from land which is not suitable for any traditional agricultural production would therefore<br />
be a unique opportunity especially for countries like India and others. India being a fast growing economy<br />
with large import of crude oil makes it more important to develop such indigenous resources.<br />
The overall objective of the <strong>BIOSAFOR</strong> project is twofold:<br />
1) To contribute to the development of biosaline agro-forestry systems for various saline environments<br />
(local/regional approach) and parallel to that<br />
1
2) To explore the potentials and options for biomass production in saline environments (globally)<br />
The specific objectives are:<br />
• to indicate the special role of biosaline agro-forestry for degraded areas with saline soils and/or areas<br />
with brackish water resources<br />
• contribute to the regeneration of saline wastelands<br />
• to select and screen tree species for the production of biomass in specific saline environments<br />
• to develop agro-forestry systems for biomass production in different kinds of saline environments<br />
• to assess the economic and environmental performance of selected biosaline agroforestry production<br />
systems<br />
• to estimate the amount of biomass that can globally be produced in saline environments<br />
• to assess the potential contribution of biomass from saline environments to a sustainable biomass<br />
respectively biofuel and biomaterial supply in developing countries and the European Union<br />
• to disseminate the results to relevant gremia (decision makers, politicians) in the EU and to organizations<br />
dealing with salinity globally, especially biosaline networks<br />
Various objectives of the consortium project were targeted to be achieved by working in different work<br />
packages 1 to 6 involving specific partners having specializations and track record. Table 1 shows<br />
involvement and participation of different partners in various work packages. CSSRI Karnal contributed to<br />
maximum number of packages and made significant contributions leading to success of this consortium<br />
project. Most significant achievements were in the pot trials and field studies on saline and sodic areas<br />
focusing on long-term plantations involving important multipurpose tree species.<br />
Table 1 : Involvement and participation of CSSRI and other partners in various work packages.<br />
WP 1 (Pot Trials)<br />
WP 2 (Field Case Studies)<br />
WP 3 (GIS, <strong>Soil</strong>, Water)<br />
WP 4 (Cropping Potential)<br />
WP 5 (Supply Chain)<br />
WP 6 (Policy)<br />
ICBA, BARI, PARC, CSSRI, CITA<br />
ICBA, BARI, PARC, CSSRI, CAZRI<br />
ACACIA, UHOH, BARI, PARC, CSSRI, CAZRI<br />
UU, OASE, BARI, PARC, CSSRI<br />
UU, OASE, BARI, PARC, CSSRI<br />
UU, OASE, BARI, PARC, CSSRI<br />
2
India Scenario<br />
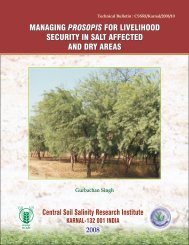
India has 6.73 million hectare area affected by salinity and sodicity in different states (Fig. 1 and Table 2) and<br />
the salinity affected areas are increasing due to secondary salinization and other factors. A sizeable portion of<br />
these salt affected soils are highly deteriorated making relabilitation of such lands difficult due to lack of<br />
resources, such lands being community lands and being owned by resource poor farmers using costly<br />
chemical amendments. Revegetation of such lands through different land uses viz. plantation of multipurpose<br />
tree species including energy plantation are some of the options to meet the fuel, fodder, timber and<br />
energy needs is promising in view of fuelwood, energy, fodder shortages and environmental benefits. This<br />
approach is known to have the potential to reclaim wastelands and provide livelihood security through<br />
regular employment generation. Due to large population, India can not afford any diversion of agriculture<br />
land to meet its fast rising energy demands which have to be met from such marginal areas only. Therefore,<br />
primary requirements are:<br />
• Use marginal soil & water resources<br />
• Not compete with food production and conventional forestry products<br />
• Improve or balance biodiversity<br />
• Proper GHG accounting and land-use management.<br />
• Not disrupt tropical rainforests etc<br />
This has additional advantage of strengthening local communities without any disruption. Woody biomass<br />
has the highest carbon values, trees perform many other useful environmental services and biomass for<br />
energy has the potential to be a key lever for rural development.<br />
3
Fig. 1 : Map and Table 2 : showing the extent and distribution of salt affected soils in India (these figures are<br />
based on the data and reconciled figures on the salt-affected areas in different states by CSSRI, NRSA<br />
and NBSS & LUP, 2006)<br />
Sr.<br />
No.<br />
State<br />
Saline<br />
soils<br />
(ha)<br />
Alkali<br />
soils<br />
(ha)<br />
Coastal<br />
saline soil<br />
(ha)<br />
1 Andhra Pradesh 0 196609 77598<br />
2 A & N islands 0 0 77000<br />
3 Bihar 47301 105852 0<br />
4 Gujarat 1218255 541430 462315<br />
5 Haryana 49157 183399 0<br />
6 Jammu & Kashmir 0 17500 0<br />
7 Karnataka 1307 148136 586<br />
8 Kerala 0 0 20000<br />
9 Maharashtra 177093 422670 6996<br />
10 Madhya Pradesh 0 139720 0<br />
11 Orissa 0 0 147138<br />
12 Punjab 0 151717 0<br />
13 Rajasthan 195571 179371 0<br />
14 Tamil Nadu 0 354784 13231<br />
15 Uttar Pradesh 21989 1346971 0<br />
16 West Bengal 0 0 441272<br />
Total 1710673 3788159 1246136<br />
Total<br />
(ha)<br />
274207<br />
77000<br />
153153<br />
2222000<br />
232556<br />
17500<br />
150029<br />
20000<br />
606759<br />
139720<br />
147138<br />
151717<br />
374942<br />
368015<br />
1368960<br />
441272<br />
6744968<br />
4
WORK PACKAGE 1<br />
The objective of WP 1 at CSSRI was to select a number of tree species/ accessions/varieties with good<br />
production characteristics for saline environments and to produce relevant salinity data about these species.<br />
Methods<br />
Nurseries of ten species namely, Prosopis alba (0465), Prosopis alba, Prosopis juliflora, Acacia nilotica, Eucalyptus<br />
tereticornis, Tamarix articulata, Pongamia pinnata, Jatropha curcas, Terminalia arjuna and Cassia siamea were<br />
planted in 20 kg capacity porcelain pots filled with thoroughly washed coarse river sand. Six months old<br />
uniform seedlings were planted. All the pots were supplied with half-strength Hoagland's nutrient solution<br />
(Annexure I) for the first week and subsequently supplemented with mixture of salts as per the composition.<br />
-1<br />
EC level of non-saline control pots was 0.40 dS m . A salt mixture of NaCl, CaCl 2 and MgSO 4 was used to<br />
impose salinities (Annexure I). In most of the pot and solution culture studies reported in literature, single salt<br />
namely NaCl is used to impose salt stress. In natural saline conditions, saline conditions normally occur due<br />
to the presence of mixture of salts namely NaCl, Na2SO 4, CaCl 2, CaSO 4, MgSO 4 etc. with predominance of<br />
NaCl. More over, single salts are normally more toxic in nature having more detrimental effects on plants.<br />
Therefore, we used salt mixture to impose salinity treatments to simulate natural conditions so that more<br />
realistic results are obtained. Therefore, the four levels of salinity treatments were created by using salts<br />
mixture and by increasing salt concentration in step-wise increments. Four salinity levels of 7.5, 12.0, 15.5 and<br />
-1<br />
19.0 dS m were achieved in two, three, four and five increments, respectively in the subsequent three weeks.<br />
This approach using slow and step-wise increments of salinity helps the plants to adjust and avoid shocks due<br />
to sudden imposition of salinity.<br />
-1<br />
For the second year, the salinity levels were further stepped up with the maximum level up to 42 dS m .<br />
Mixture of NaCl and CaCl 2 salts was used to create salinities during the second year as per the decision taken<br />
in the Technical Review Meeting of the project held in ICBA, Dubai during July 2008 (Fig. 2). Eight<br />
replications per treatment were maintained out of which four replicates per treatment were harvested,<br />
washed and sampled after fourteen months of salinity treatment and the remaining after two years of<br />
salinization and separated in to roots, stem and leaves and processed for chemical analysis. Data on shoot<br />
biomass (stem, branches and leaves) and total plant biomass (all plant parts i.e. roots, stem, branches and<br />
leaves) were used to generate salinity response curves for these tree species.<br />
Fig. 2 : Participants of the Technical Review Meeting of Biosafor project from July 20 to 22, 2008<br />
at International Center for Biosaline Agriculture (ICBA), Dubai, UAE<br />
for discussions on methodologies and programmes.<br />
5
• Growth parameters (shoot height, number of branches and roots) and biomass (weight of stem, leaves and<br />
root) data of the plants were recorded periodically (Fig. 3).<br />
• At harvest, biomass of root, shoot and leaf components were recorded for fresh and dry weight Table 3, 4).<br />
• <strong>Soil</strong> and irrigation/drainage water were also recorded for maintaining salinity levels.<br />
• A similar database was used by all partners for recording all the data.<br />
• <strong>Salinity</strong> curves were prepared for all the test species, based on USDA 'Salt' model for determining C t, C 50<br />
and C 0 values. Since the USDA model deals with crop species having low to moderate tolerance to salinity<br />
-1<br />
and deals with salinity levels below 20 dS m , the salinity curves were not properly representative,<br />
therefore we modified the earlier methodology for tree saplings using other methods like the best fit line<br />
and equation (Fig. 4).<br />
Results<br />
— <strong>Salinity</strong> tolerance of the locally available species : Eucalyptus tereticornis, Prosopis juliflora, P. alba, and P.<br />
glandulosa, Acacia nilotica, Terminalia arjuna, Tamarix articulata, Pongamia pinnata, Jatropha curcas and<br />
Cassia siamea; and exotic germplasm (germplasm brought from other countries): Acacia salicina, A. ampliceps and<br />
Casuarina glauca were worked out in pot trials and field studies. Mechanisms of tolerance and growth<br />
were studied and salt tolerance curves were developed<br />
— Among local species /accessions (s/a), Tamarix articulata, Prosopis alba, P. juilfora and P. glandulosa showed<br />
higher biomass from trials in India. They also showed higher C 50 and C 0 (22-36 dS/m) values, indicating<br />
that local s/a have high potential for bioforestry projects.<br />
— Species that showed higher biomass and salinity tolerance include Acacia ampliceps accessions, with C 0<br />
values varying from 21-41 dS/m.<br />
— Acacia, Casuarina, Eucalyptus, Prosopis and Tamarix species/accessions (s/a) occupy the top positions<br />
among tree species that are salt tolerant and provide higher biomass.<br />
Table 3 : Effect of five levels of salinity on different plant growth parameters of plants harvested after two<br />
years of salinization.<br />
Treatment<br />
(dS/m)<br />
1.4<br />
15<br />
20<br />
30<br />
40<br />
1.4<br />
15<br />
20<br />
30<br />
40<br />
1.4<br />
15<br />
20<br />
30<br />
40<br />
Pl. ht<br />
( cm)<br />
No. of<br />
brs/pl<br />
Stem<br />
wt<br />
(g)<br />
Leaf wt<br />
(g)<br />
Root<br />
wt<br />
(g)<br />
Total<br />
plant wt<br />
(g)<br />
No.of<br />
roots<br />
Root<br />
length<br />
(cm)<br />
Eucalyptus terticornis<br />
188.8 12 204.7 66.7 183.4 454.8 21 131.3<br />
171.3 9 118.8 30.4 67.0 216.2 13 96.0<br />
123.0 6 40.6 23.5 68.7 132.8 10 50.1<br />
115.3 5 28.7 - 21.2 49.9 8 29.0<br />
98.0 5 16.5 - 15.7 32.2 6 27.7<br />
Tamarix articulata<br />
177.5 9 127.4 32.9 80.8 241.1 25 128.0<br />
176.0 11 119.1 46.5 116.1 281.7 25 113.8<br />
173.8 9 93.8 39.4 76.2 209.4 23 103.8<br />
168.8 9 90.2 43.8 100.0 234.0 21 89.8<br />
155.0 7 73.6 35.5 61.4 170.4 14 66.3<br />
Acacia nilotica<br />
190.8 28 274.4 12.9 89.8 377.1 25 84.8<br />
145.0 20 125.3 5.2 54.9 185.4 20 62.0<br />
120.0 11 98.3 3.8 27.8 129.9 16 46.0<br />
103.8 7 24.3 12.7 37.0 8 32.0<br />
93.0 6 21.8 17.8 39.6 6 32.3<br />
6
Treatment<br />
(dS/m)<br />
1.4<br />
15<br />
20<br />
30<br />
40<br />
1.4<br />
15<br />
20<br />
30<br />
40<br />
1.4<br />
15<br />
20<br />
30<br />
40<br />
1.4<br />
12<br />
18<br />
24<br />
30<br />
1.4<br />
12<br />
18<br />
24<br />
30<br />
1.4<br />
12<br />
18<br />
24<br />
30<br />
Pl. ht.<br />
( cm)<br />
Prosopis glandulosa<br />
176.3 20 238.9 26.5 226.6 492.0 36 246.8<br />
165.3 15 189.5 41.1 192.0 422.6 28 192.5<br />
157.8 10 154.9 47.2 143.2 345.3 22 153.5<br />
157.3 6 99.3 26.2 78.6 204.1 15 116.5<br />
127.7 5 92.0 26.1 63.2 181.3 14 100.3<br />
Prosopis alba (0465)<br />
189.0 17 212.4 9.1 118.3 339.7 27 148.0<br />
170.8 11 141.8 54.0 112.2 308.0 21 144.7<br />
152.7 13 140.1 20.1 101.2 261.4 19 131.0<br />
150.8 7 141.3 32.5 80.0 253.8 16 115.9<br />
145.5 5 125.2 15.8 72.7 213.7 15 103.8<br />
Prosopis juliflora<br />
205.0 17 257.0 26.5 115.0 398.4 27 135.3<br />
170.0 13 195.4 24.0 97.1 316.5 22 115.5<br />
164.5 13 171.1 20.8 93.4 285.4 21 98.3<br />
151.0 10 153.9 18.6 59.7 232.2 14 94.0<br />
137.5 6 104.2 17.1 51.3 172.6 13 83.7<br />
Pongamia pinnata<br />
120.0 4 65.7 34.0 121.8 221.5 21 118.8<br />
90.5 4 28.8 18.7 62.9 110.3 14 84.5<br />
85.8 3 32.4 16.3 35.9 84.6 12 64.5<br />
78.0 2 28.3 42.7 71.0 10 52.3<br />
62.3 2 21.5 10.0 24.8 56.3 8 41.3<br />
Terminalia arjuna<br />
132.0<br />
117.0<br />
110.8<br />
105.0<br />
89.6<br />
63.2<br />
61.8<br />
54.0<br />
45.6<br />
32.8<br />
No. of<br />
brs/pl<br />
18<br />
13<br />
13<br />
8<br />
7<br />
10<br />
3<br />
3<br />
2<br />
Stem<br />
wt.<br />
(g)<br />
113.4 58.9<br />
90.3 38.3<br />
60.5 19.9<br />
26.4<br />
28.3 21.3<br />
Jatropha curcas<br />
300.2<br />
130.0<br />
131.5<br />
52.1<br />
13.0<br />
Leaf wt.<br />
(g)<br />
150.0<br />
38.1<br />
23.4<br />
13.5<br />
0 0.0<br />
Root<br />
wt.<br />
(g)<br />
123.3<br />
78.6<br />
61.2<br />
34.9<br />
28.7<br />
204.6<br />
45.0<br />
43.6<br />
19.2<br />
16.1<br />
Total<br />
plant wt.<br />
(g)<br />
295.6<br />
207.1<br />
141.6<br />
61.4<br />
78.3<br />
654.8<br />
213.2<br />
198.5<br />
84.8<br />
29.1<br />
No. of<br />
roots<br />
20<br />
15<br />
10<br />
7<br />
6<br />
22<br />
14<br />
13<br />
10<br />
7<br />
Root<br />
length<br />
(cm)<br />
81.8<br />
78.6<br />
72.0<br />
62.4<br />
59.2<br />
65.0<br />
50.0<br />
46.8<br />
46.3<br />
43.3<br />
Table 4 : Effect of five levels of salinity on different plant growth parameters of exotic species imported from<br />
Australia in plants harvested after one and half year of salinization.<br />
Treatment<br />
(dS/m)<br />
1.4<br />
15<br />
20<br />
30<br />
40<br />
Pl. ht.<br />
(cm)<br />
189.3<br />
154.8<br />
125.8<br />
96.0<br />
70.3<br />
No. of<br />
branches<br />
15<br />
12<br />
12<br />
4<br />
4<br />
Acacia ampliceps<br />
Stem Leaf<br />
wt. (g) wt. (g)<br />
128.0 164.0<br />
111.7 130.5<br />
45.4 91.3<br />
31.4 65.5<br />
23.7 56.6<br />
Root<br />
wt. (g)<br />
105.0<br />
66.4<br />
60.2<br />
36.7<br />
28.6<br />
Total<br />
Pl. wt. (g)<br />
397.0<br />
308.7<br />
196.9<br />
133.6<br />
108.9<br />
No. of<br />
Roots<br />
23<br />
19<br />
15<br />
12<br />
9<br />
Root<br />
length<br />
85<br />
74<br />
58<br />
42<br />
35<br />
7
Treatment<br />
(dS/m)<br />
1.4<br />
15<br />
20<br />
30<br />
40<br />
1.4<br />
15<br />
20<br />
30<br />
40<br />
Pl. ht.<br />
(cm)<br />
216.0<br />
164.8<br />
160.8<br />
107.5<br />
70.0<br />
152.0<br />
131.7<br />
131.7<br />
119.7<br />
101.7<br />
No. of<br />
branches<br />
22<br />
15<br />
14<br />
8<br />
3<br />
20<br />
16<br />
14<br />
6<br />
5<br />
Stem<br />
wt. (g)<br />
Acacia saliciana<br />
71.7 30.9<br />
53.8 21.3<br />
52.7 21.7<br />
39.4 18.5<br />
12.7 12.7<br />
Casuarina glauca<br />
64.5<br />
38.1<br />
15.0<br />
12.7<br />
5.8<br />
Abbreviations- Ht.- height, wt.- weight, Brs.- branches<br />
Leaf<br />
wt. (g)<br />
77.8<br />
55.1<br />
32.2<br />
28.2<br />
7.1<br />
Root<br />
wt. (g)<br />
121.8<br />
56.3<br />
50.7<br />
9.3<br />
6.3<br />
64.8<br />
51.6<br />
31.5<br />
29.5<br />
13.0<br />
Total<br />
Pl. wt. (g)<br />
224.3<br />
131.5<br />
125.1<br />
67.3<br />
31.6<br />
207.1<br />
144.7<br />
78.8<br />
70.3<br />
25.8<br />
No. of<br />
Roots<br />
28<br />
22<br />
16<br />
11<br />
8<br />
25<br />
18<br />
16<br />
9<br />
7<br />
Root<br />
length<br />
92<br />
85<br />
78<br />
62<br />
41<br />
78<br />
66<br />
51<br />
39<br />
31<br />
Fig. 3 : Photographs of forest tree species grown in pots and continuously exposed to different levels of salinity<br />
(1.4, 7.5, 12.0, 15.5 & 19.0 dS/ m for photographs on left side and 1.4, 18, 28, 36 & 40 dS/ m on right side).<br />
Tamarix articulata<br />
Prosopis juliflora<br />
8
Acacia nilotica<br />
Eucalyptus tereticornis<br />
Prosopis glandulosa<br />
9
Prosopis alba (0465)<br />
Pongamia pinnata<br />
Terminalia arjuna<br />
Jatropha curcas<br />
10
Cassia siamea<br />
Acacia ampliceps and Acacia salicina (plants and roots)<br />
Casuarina glauca plants and root<br />
11
Fig. 4 : Salt tolerance curves and equations for different forest tree species.<br />
Relative yield<br />
1.0<br />
0.8<br />
0.6<br />
0.4<br />
0.2<br />
0.0<br />
y = -0.012x + 0.864<br />
R² = 0.834<br />
0.0 10.0 20.0 30.0 40.0<br />
-1<br />
Root-zone salinity (dSm )<br />
Relative yield<br />
1.0<br />
0.8<br />
0.6<br />
0.4<br />
0.2<br />
0.0<br />
y = -0.0118x + 1.1153<br />
R 2 = 0.6703<br />
0.0 10.0 20.0 30.0 40.0<br />
-1<br />
Root-zone salinity (dSm )<br />
<strong>Salinity</strong> response curves of Prosopis juliflora and Tamarix articulata showing higher tolerance to salinity stress.<br />
Relative yield<br />
1.0<br />
0.8<br />
0.6<br />
0.4<br />
0.2<br />
0.0<br />
y = -0.024 x + 0.894<br />
R² = 0.860<br />
0 20 40<br />
-1<br />
Root-zone salinity (dSm )<br />
Relative yield<br />
1.0<br />
0.8<br />
0.6<br />
0.4<br />
0.2<br />
0.0<br />
y = -0.019 x + 0.8778<br />
R 2 = 0.7824<br />
0.0 10.0 20.0 30.0 40.0<br />
-1<br />
Root-zone salinity (dSm )<br />
<strong>Salinity</strong> response curves of Eucalyptus tereticornis and Pongamia pinnata showing moderate tolerance to salinity stress.<br />
Relative yield<br />
1.00<br />
0.80<br />
0.60<br />
0.40<br />
0.20<br />
0.00<br />
y = -0.024x + 0.9505<br />
R 2 = 0.862<br />
0.0 20.0 40.0<br />
-1<br />
Root-zone salinity (dSm )<br />
Acacia nilotica -best fit line and equation<br />
12
Relative Yield<br />
1.0<br />
0.8<br />
0.6<br />
0.4<br />
0.2<br />
0.0<br />
Prosopis glandulosa<br />
<strong>Salinity</strong> Curve : Shoot biomass<br />
y = -0.0205 x + 1.053<br />
R 2 = 0.8881<br />
0.0 10.0 20 .0 30.0 40.0<br />
Root-zone salinity (EC e in dSm -1 )<br />
Prosopis glandulosa-best fit line and equation<br />
Relative Yield<br />
1.0<br />
0.8<br />
0.6<br />
0.4<br />
0.2<br />
Jatropha curcas<br />
<strong>Salinity</strong> Curve : Shoot biomass<br />
y = -0.0219 x + 0.8361<br />
R 2 = 0.7949<br />
0.0<br />
0.0 10.0 20.0 30.0 40.0<br />
Root-zone salinity (EC e in dSm -1 )<br />
Jatropha curcas-best fit line and equation<br />
Relative Yield<br />
1.0<br />
0.8<br />
0.6<br />
0.4<br />
0.2<br />
Terminalia arjuna<br />
<strong>Salinity</strong> Curve : Shoot biomass<br />
y = -0.0206 x + 0.8761<br />
R 2 = 0.9054<br />
0.0<br />
0 10 20 30 40<br />
Root-zone salinity (EC e in dSm -1 )<br />
Terminalia arjuna-best fit line and equation<br />
13
Acacia ampliceps<br />
Threshold Slope: Shoot biomass<br />
Acacia ampliceps : Shoot biomass<br />
1.0<br />
1.0<br />
Relative yield<br />
0.8<br />
0.6<br />
0.4<br />
0.2<br />
Relative yield<br />
0.8<br />
0.6<br />
0.4<br />
0.2<br />
y = -0.0209x + 0.9941<br />
R 2 = 0.9101<br />
0.0<br />
0 10 20 30 40<br />
Root-zone <strong>Salinity</strong> (EC e in dS.m -1 )<br />
Acacia ampliceps- Threshold model<br />
0.0<br />
0.0 10.0 20.0 30.0 40.0<br />
Root-zone <strong>Salinity</strong> (EC e in dS.m -1 )<br />
Acacia ampliceps-best fit line<br />
1.0<br />
Acacia salicina<br />
Threshold Slope: Shoot biomass<br />
1.0<br />
Acacia salicina :<br />
Shoot biomass<br />
Relative yield<br />
0.8<br />
0.6<br />
0.4<br />
0.2<br />
Rel ative y ield<br />
0.8<br />
0.6<br />
0.4<br />
0.2<br />
y = -0.021x + 0.8715<br />
R 2 = 0.925<br />
0.0<br />
0 10 20 30 40<br />
Root-zone <strong>Salinity</strong> (EC e in dS.m -1 )<br />
Acacia salicina- Threshold model<br />
0.0<br />
0.00 10.00 20.00 30.00 40.00<br />
Root-zone salinity (EC e in dSm -1 )<br />
Acacia salicina-best fit line and equation<br />
Casuarina glauca<br />
Threshold Slope: Shoot biomass<br />
1.0<br />
Casuarina glauca-shoot biomass<br />
1.0<br />
0.8<br />
y = -0.021x + 0.9496<br />
R 2 = 0.914<br />
Relative yield<br />
0.8<br />
0.6<br />
0.4<br />
0.2<br />
Relative y ield<br />
0.6<br />
0.4<br />
0.2<br />
0.0<br />
0 5 10 15 20 25 30 35 40<br />
Root-zone <strong>Salinity</strong> (EC e in dS.m -1 )<br />
Casuarina glauca- Threshold model<br />
0.0<br />
0.0 10.0 20.0 30.0 40.0<br />
Root-zone salinity (EC e in dSm -1 )<br />
Casuarina glauca best fit line and equation<br />
Research Achievements of Work Package 1 at CSSRI Karnal<br />
v <strong>Salinity</strong> tolerance of locally available species: Eucalyptus tereticornis, Prosopis species, (3) Acacia nilotica,<br />
Terminalia arjuna, Tamarix articulata, Pongamia pinnata, Jatropha curcas and Cassia siamea; and exotic<br />
germplasm : Acacia salicina, A. ampliceps & Casuarina glauca were worked out in pot trials and field studies.<br />
Mechanisms of tolerance and growth were studied and salt tolerance curves were developed<br />
v Tamarix articulata and Prosopis juliflora showed maximum tolerance followed by Acacia nilotica, Eucalyptus<br />
tereticornis, Prosopis alba and Prosopis glandulosa showing moderate salinity tolerance, whereas Terminalia<br />
arjuna, Pongamia pinnata, Jatropha curcas and Cassia siamea coming at the bottom of the list<br />
14
v Among the exotic species Acacia salicina, Acacia ampliceps and Casuarina glauca showed good salinity<br />
tolerance and biomass production potential<br />
Research Achievements of Wp 1 for Overall Project<br />
§ More than 70 tree species/accessions (s/a) were tested for all countries with different soil, water and<br />
climatic conditions.<br />
§ Forty five (s/a) successfully survived under different salinity conditions.<br />
§ In most cases, a given s/a have been tested at least in two different countries, whereas, local s/a have been<br />
tested in one site (country as well).<br />
§ Among local species/accessions, Prosopis alba, P. juilfora and P. glandulosa showed higher biomass. They<br />
also showed higher C50 and C0 (22-36 dS/m) values, indicating that local species/accessions have high<br />
potential for bioforestry projects.<br />
§ Species that showed higher biomass and salinity tolerance include Acacia ampliceps accessions, with C 0<br />
values varying from 21-41 dS/m. However, their threshold salinity ranges are very low (2.63-6.41 dS/m)<br />
WORK PACKAGE 2<br />
Objective of this work package was to acquire specific information on saline sites where the trees do prevail<br />
naturally and the performance of these trees in various – saline environments thereby enabling conclusions<br />
on best practices.<br />
Methods<br />
Selection of sites in partner countries was first based on broader criteria:<br />
— The site should be classified as saline and/or sodic and/or waterlogged in its typical definition<br />
— Plantations should be at least in a 5 ha area and of 5 years or older<br />
— Accessibility of the plantation to the project staff<br />
Within each sites, selection of individual trees were based on either (i) salinity/sodicity categories within the<br />
plantation area; and (ii) growth categories of individual trees – if there was no heterogeneity on soil salinity<br />
data.<br />
Studies at the case study sites having plantations on saline and sodic lands - eight in India, five in Pakistan<br />
and two in Bangladesh were conducted and /or monitored providing very useful data to establish<br />
relationship between growth and biomass of the test species based on real long-term data on plantations on<br />
saline and sodic lands.<br />
Results<br />
Studies at the case study sites having plantations on saline and sodic lands - eight in India , five in Pakistan<br />
and two in Bangladesh were conducted and /or monitored providing very useful data to establish<br />
relationship between growth and biomass of the test species based on real long-term data on plantations on<br />
saline and sodic lands. CSSRI, Karnal conducted studies at five sites, namely Saraswati, Shivri (Lucknow)<br />
and Karnal on sodic soils and Hisar and Sampla for saline soils to measure and estimate the potential of<br />
mature salt tolerant trees in various saline environments.<br />
Biomass Production in Sodic <strong>Soil</strong>s<br />
Biomass of trees at CSSRI, Karnal<br />
Based on historic data available at CSSRI, Karnal, when trees were raised on alkali soil during 1980s, biomass<br />
of ten years old Prosopis juliflora, Acacia nilotica, Casuarina equesitifolia and Eucalyptus tereticornis was<br />
harvested and found to be 156, 129, 113 and 89 kg per tree total biomass (biomass obtained in annual loppings<br />
in the previous years is not included) (Fig. 5).<br />
15
-1<br />
Biomass of Ten years old plantation (kg tree ) at CSSRI, Karnal on alkali soils (Historical data)<br />
155.8<br />
-1<br />
Biomass (Kg tree )<br />
160<br />
140<br />
120<br />
100<br />
80<br />
60<br />
40<br />
20<br />
129.2<br />
112.6<br />
89.1<br />
0<br />
P. juliflora A.nilotica C.equisetifolia E. tereticornis<br />
Tree Species<br />
Fig. 5 : Biomass (kg/tree) of ten years old trees harvested from sodic soil<br />
Biomass of trees at Saraswati Range Forest<br />
This case study site is situated at Bichhian Reserve Forest of Saraswati Range in Kurukshetra District,<br />
Haryana on about 30 ha severely sodic land. The climate of the area is sub-tropical, semi-arid and monsoonic<br />
type. The mean annual rainfall is about 52 cm, of which nearly 70% is received in the months of July to<br />
September. The pan evaporation exceeds precipitation throughout the year except during the period of<br />
monsoon rains. The soil of the experimental farm was highly sodic having pH more than 10 up to 2 m depth.<br />
-1<br />
The electrical conductivity (EC 2) of the surface 15 cm layer varied from 2.2 to 5.4 dS m . There is the presence<br />
of precipitated CaCO3 layers at various depths with CaCO 3 content varying from negligible at the surface to<br />
about 24% up to one meter depth. The soil was very low in organic carbon and nitrogen but sufficient in<br />
phosphorus and potash. The groundwater used for irrigation was also sodic with pH 8.3 and Residual<br />
-1<br />
Sodium Carbonate (RSC) ranging from 7.2 to 10.8 me 1 .<br />
Studies were initiated in 1992 and 30 multipurpose tree species were planted using auger holes filled with a<br />
uniform soil mixture of original soil, 3 kg gypsum, 8 kg FYM, 20 g ZnSO 4 per auger hole. The trees were<br />
established on high pH (>10) soil using high RSC water (7.2 – 10.8 meq/l) in a space of 2 m x 4 m. Based on the<br />
survival and harvested above-ground biomass of 7 years old trees (harvested during 1998), Tamarix articulata<br />
produced highest biomass followed by Acacia nilotica and Prosopis juliflora (Fig. 6). Eucalyptus tereticornis,<br />
Pithecellobium dulce, Terminalia arjuna, Dalbergia sissoo, Cordia rothii, Kigelia pinnata and Parkinsonian aculeata<br />
16
were also found tolerant to high sodicity with more than 70% survival rate but could not produce satisfactory<br />
biomass.<br />
Tamarix articulata ameliorated the soil by causing maximum reduction in pH and ESP in seven years and was<br />
followed by Prosopis juliflora and Acacia nilotica. Organic content in 0-15 cm layer increased from 0.05 to 0.28%<br />
under Tamarix articulata, from 0.04 to 0.30% under P. juliflora and from 0.02 to 0.14% under Acacia nilotica in 7<br />
years. The increase in organic carbon in the lower layers was, however lower.<br />
Air- dried aboveground biomass of different tree species estimated after 7 years<br />
of growth on highly sodic soil<br />
100<br />
90<br />
97.3<br />
80<br />
69.8<br />
Total Biomass (t/ha)<br />
70<br />
60<br />
50<br />
40<br />
30<br />
51.3<br />
20<br />
14.4<br />
10<br />
4<br />
2.7 1.8<br />
1.5 1.2 1.2<br />
0<br />
Ta An Pj Et Pd Ta Ds Cr Kp Pa<br />
Tree Species<br />
Fig. 6 : Air-dried above ground biomass (t/ha) of trees at Saraswati Range Forest site<br />
Ta= Tamarix articulata, An= Acacia nilotica, Pj=Prosopis juliflora, Et= Eucalyptus tereticornis, Pd=Pithecellobium dulce,<br />
Ta= Terminalia arjuna, Ds= Dalbergia sissoo, Cr= Cordia rothii, Kp= Kigellia pinnata, Pa= Parkinsonia acumilata<br />
Biomass of trees grown on a highly alkali soil at Shivri farm, Lucknow<br />
0<br />
These studies were carried out at Shivri farm located 20 km away from Lucknow, Uttar Pradesh (26 47' 58” N<br />
0<br />
and 80 46' 24” E) at an elevation of 100 m. The annual rainfall varies from 700 to 1000 mm (average 800 mm),<br />
0<br />
80% of which occurs during the months of July to September. The mean monthly temperature varies from 21<br />
0<br />
C in January to 40.5 C in June. The evaporation exceeds the rainfall for all the months except July and August.<br />
The ground water table fluctuates seasonally between 5-7 m.<br />
Examination of the profiles revealed that the soil as alkali in nature, fine loamy, mixed, hypothermic and<br />
classified as Sodic Ustochrept. The soil contained about 40 cm thick CaCO 3 concretion layer at about 80 to 120<br />
cm. At the time of planting, soil pH at the surface was 10.6 and ranged from 10.0 to 10.6 in different layers up<br />
to the depth of 1 m with ESP values of 89- 92.<br />
Six to nine months old seedlings of 10 multipurpose tree species were planted in auger holes (45 cm diameter<br />
at the surface and 20 cm at the bottom) 120 cm deep. Row to row and plant to plant distances were 4 m x 3 m.<br />
The auger holes were filled with a mixture of original soil, 4 kg Gypsum, 10 kg Farm Yard manure and 20 kg<br />
silt.<br />
Survival of Prosopis juliflora, Terminalia arjuna, Pongamia pinnata, Acacia nilotica, Casuarina equisetifolia and<br />
Pithocellobium dulce was > 95% after 10 years of planting. Maximum plant height after 10 years of planting was<br />
observed in Eucalyptus tereticornis followed by Casuarina equisetifolia and Prosopis juliflora. However,<br />
maximum diameter at breast height was recorded in Acacia nilotica, Eucalyptus tereticornis and Prosopis<br />
juliflora. These studies suggested that in addition to reclaiming these sodic soils, the tree-based systems also<br />
increased microbial biomass, microbial N and C in otherwise very low or dead mass of degraded sodic soils.<br />
17
Out of the ten species planted and harvested after 14 years growth on these highly deteriorated sodic soils<br />
maximum biomass production was achieved in the Eucalyptus tereticornis, Acacia nilotica, Prosopis juliflora and<br />
Casuarina equisetifolia giving 231, 217, 208 and 197 kg bole weight per plant respectively, whereas Prosopis alba,<br />
Pithocelbium dulce, Terminalia arjuna, Pongamia pinnata, Azhadirachta indica and Cassia siamea species provided<br />
relatively lower bole weight of 133, 100, 97, 84, 83 and 52 kg per plant, respectively (Fig. 7). Thus these four<br />
species, namely Eucalyptus tereticornis, Acacia nilotica, Prosopis juliflora and Casuarina equisetifolia can be<br />
helpful in reclamation and productive utilisation of these soils. The harvested boles are shown in Fig. 8.<br />
Bolebiomass (kg/tree)<br />
250<br />
200<br />
150<br />
100<br />
50<br />
231<br />
217<br />
208<br />
197<br />
133<br />
100 97<br />
84 83<br />
52<br />
0<br />
E. tereticornis<br />
P. juliflora<br />
A. nilotica<br />
C. equisatifolia<br />
P. alba<br />
P. dulce<br />
T. arjuna<br />
Pongamia<br />
A. indica<br />
C.siamea<br />
Fig. 7 : Biomass production (kg/tree) by 14 years old trees on a highly sodic soil in<br />
Lucknow (Biomass figures represent biomass at the final harvest and<br />
does not include lopped biomass over the previous years)<br />
Fig. 8 : The boles of trees harvested after 14 years of growth in highly sodic soils<br />
18
Table 5 : Regression equations of tolerant trees raised in highly alkaline soil at Shivri farm of CSSRI, RRS<br />
Lucknow harvested after 15 years of planting (n=4).<br />
Acacia nilotica Y = -1511.605 + 2.749 * X 1<br />
+ 150.949 * X 2<br />
Casuarina equisetifolia Y = -1236.578 + 2.012 * X 1<br />
+ 124.334 * X 2<br />
P. juliflora Y = -688.080 + 13.256 * X 1<br />
+ 9.378 * X 2<br />
E. tereticornis Y = -699.671 - 2.285 * X 1<br />
+ 76.398 * X 2<br />
Terminalia arjuna Y = -272.162 + 1.677 * X 1<br />
+ 31.073 * X 2<br />
Azadirachta indica Y = -20.296 + 2.242 * X 1<br />
- 3.314 * X 2<br />
Pongamia pinnata Y = -233.254 + 4.514 * X 1<br />
+ 16.333 * X 2<br />
P. alba Y = 203.152 + 5.820 * X 1<br />
- 53.071 * X 2<br />
R 2 = 0.999<br />
St. E.of Estimate = 13.3<br />
R 2 = 0.998<br />
St. E. of Estimate = 11.9<br />
R 2 = 0.987<br />
St. E of Estimate = 29.4<br />
R 2 = 0.974<br />
St. E. of Estimate = 20.0<br />
R 2 = 0.967<br />
St. E. of Estimate = 10.2<br />
R 2 = 0.916<br />
St. E. of Estimate = 19.0<br />
R 2 = 0.987<br />
St. E. of Estimate = 4.5<br />
A perfect fit<br />
Pithocelubium dulce Y = -44.039 + 1.889 * X 1 + 5.565 * X 2<br />
Cassia siamea Y = -88.602 + 1.683 * X 1 + 10.019 * X 2<br />
R 2 = 0.960<br />
St. E. of Estimate = 12.5<br />
R 2 = 0.847<br />
St. E. of Estimate = 8.1<br />
Y is the estimated biomass (Kg / tree); X is the girth (cm) and X is height (m) of the tree. Measured values for biomass<br />
1 2<br />
from plants harvested have been used.<br />
Biomass Production in Saline <strong>Soil</strong>s<br />
Biomass at Sampla : At Sampla study site, plantation was raised on saline soils by sub-surface planting and<br />
irrigated initially with saline water in furrows. The initial ECe of soil ranged from 20 to 36 dS/m. The plants<br />
100<br />
98<br />
96<br />
90<br />
80<br />
70<br />
67<br />
-1<br />
Biomass (t ha )<br />
60<br />
50<br />
40<br />
41<br />
28<br />
28<br />
38<br />
30<br />
30<br />
20<br />
10<br />
0<br />
A.nilotica A. tortilis E.<br />
camaldulensis<br />
P. juliflora C.equisetifolia C. glauca C. obesa L. leucocephala<br />
Fig. 9 : Biomass (t/ha) of trees grown in saline soil at Sampla<br />
19
were raised in 4 m x 4 m spacing. After nine years of growth it was found that Prosopis juliflora was the most<br />
successful species yielding highest biomass (harvested in 1998) followed by Casuarina glauca and Acacia<br />
nilotica (Fig. 9).<br />
Biomass of trees at Bir Reserve Forest Hisar<br />
0 0<br />
These studies were carried out at Bir Reserve Forest, Hisar (29 10'N and 75 44'E with altitude of 220 m above<br />
mean sea level. The climate is semi-arid monsoon type with annual rainfall of around 471 mm with most of<br />
the rainfall occurring during July to September. Open pan evaporation is around 1950 mm which exceeds the<br />
rainfall throughout the year. The lowest temperatures are observed during the months of December and<br />
January and frost also do occur. The maximum temperatures are observed in the months of May and June<br />
0<br />
with temperature rising to 47 C with an<br />
0<br />
average of 42 C during June. Saplings of 31<br />
tree species were raised on highly degraded<br />
calcareous soil and were planted in furrows<br />
(15 cm deep and 60 cm wide) in auger holes<br />
having plant to plant distance of 2.0 m and row<br />
to row distance of 2.5 m. Plants were provided<br />
irrigation using saline water (ECiw 8.5-10.5<br />
dS/m) by applying water only to furrows in<br />
the initial three years only. After eight years of<br />
growth it was found that Tamarix articulata<br />
produced the maximum biomass (harvested<br />
in 2000-2001) followed by Acacia nilotica,<br />
Prosopis juliflora and Eucalyptus tereticornis<br />
(Fig. 10).<br />
250<br />
Biomass of trees at 8 & 16 years of age<br />
200<br />
After 8 Years<br />
After 16 Years<br />
-1<br />
Biomass (t ha )<br />
150<br />
100<br />
50<br />
0<br />
Ta An Pj At Cs Et Ai Af Pd Ma<br />
Tree species<br />
Fig. 10 : Biomass (t/ha) of trees grown at at Hisar<br />
Af- Acacia farnesiana, An- Acacia nilotica, At - Acacia tortilis, Ai- Azadirachta indica, Cs – Cassia siamea, Et - Eucalyptus<br />
tereticornis, Gu- Guazuma ulmifolia, Ma - Melia azedarach, Pd - Pithecelubium dulce, Pj - Prosopis juliflora, Ta- Tamarix<br />
articulata<br />
20
Tamarix articulata<br />
Prosopis juliflora<br />
Acacia nilotica<br />
Acacia tortilis<br />
Research Highlights of Work Package 2<br />
Studies at the case study sites having plantations on saline and sodic lands - eight in India, five by CSSRI and<br />
three by CAZRI were conducted and /or monitored providing very useful data to establish relationship<br />
between growth and biomass of the test species based on real long-term data on plantations on saline and<br />
sodic lands.<br />
v<br />
v<br />
v<br />
v<br />
v<br />
Actual data on biomass production potential of 5, 10 and 15 years old field plantations grown on severely<br />
affected saline and sodic soils at five study areas were generated. These plantations were also monitored<br />
in terms of plant growth parameters and their contribution towards soil physical, chemical properties<br />
and environmental amelioration<br />
Regression equations for biomass calculation of trees based on actual harvested total biomass (kg/tree),<br />
girth at breast height (cm) and total height (m) were developed to predict biomass in similar situations<br />
and age of the plants without harvesting the trees<br />
These equations and data have been used to make non-destructive projections on biomass production at<br />
regional and global levels for similar species in saline and sodic lands<br />
These 7, 10 and14 years old plantations resulted in significant reclamation of highly deteriorated soils<br />
and improvement in physical and chemical properties. Upper surface soils (0-30 cm) pH was reduced<br />
from initial 10.6 to ~8.0<br />
Regression curves relating harvested biomass, girth and plant height were developed and validated.<br />
These curves have been used in estimation of biomass production potential of these species on saline and<br />
21
sodic soils thus enabling non-destructive estimates at regional and global levels for similar saline and<br />
sodic lands<br />
v<br />
v<br />
Regression curves relating harvested biomass, girth and plant height were developed and validated. A<br />
database was established in MS Access to link the different subsets of field data and be able to assess and<br />
evaluate case study data.<br />
The work carried out by CSSRI was highly appreciated as it provided very useful data to establish<br />
relationship between growth and biomass of the test species based on real long-term data on plantations<br />
on saline and sodic lands.<br />
WORK PACKAGE 3<br />
The objective of WP 3 is to assess and provide the data and information that are needed to characterize and<br />
describe the eco-physiological conditions for the production of biomass in agro forestry systems in saline<br />
areas.<br />
Generally the conditions for biomass production and the biomass yields strongly depend on the ecophysiological<br />
site conditions such as soil properties and water supply. Thus, information on soil<br />
characteristics and water resources are prerequisite for the characterization of saline areas with respect to the<br />
conditions they provide for agro forestry.<br />
Therefore the objective of this work package was to assess and provide the data and information that are<br />
needed to characterize and describe the eco-physiological conditions for the production of biomass in agro<br />
forestry systems in saline areas with the following conditions:<br />
n<br />
n<br />
n<br />
n<br />
Easy reclaimable saline wastelands suitable for agricultural crops excluded<br />
Only moderately to strongly salt affected soils considered (>8dS/m)<br />
Only irrigation for establishment stage; use of groundwater permitted<br />
Brackish water potential suitable, providing good drainage and leaching<br />
Potential areas and biomass production based on models were mapped. Collected spatial data was<br />
integrated with pot trial - and case study area data using SASOTER – land suitability modeling and GIS<br />
spatial database.<br />
Deliverables<br />
Database on qualities and quantities of water & soil resources in the different saline environments in the case<br />
study areas<br />
Characterization of water resources for the irrigation of biomass plantations in saline areas<br />
GIS-based maps of salinity (water and soil) and cropping potentials for saline areas in the participating<br />
countries<br />
Accordingly, hydrological data available at regional and local scale in case study areas were collected and<br />
reviewed. A GIS analysis was performed to find potential areas requiring irrigation in Haryana, India based<br />
on climate related factors. Also using Haryana as a sample, cost per unit for groundwater irrigation was<br />
estimated district-wise based on a sample field survey. A water resources overview for India, Pakistan and<br />
Bangladesh was delivered to University of Hohenheim.<br />
All available Salt affected soil (SAS) maps for the 12 Indian states were updated by University of Hohenheim<br />
with additional information from the paper “<strong>Soil</strong> Resource Maps” provided by CSSRI. Some 300 soil profiles<br />
were put into the SOTER database. In addition, the digital SAS maps were overlaid with the groundwater<br />
depth maps for the further development of the SOTER structure. After that the new terrain components were<br />
manually defined in MS Excel and imported into the IBM DBII database developed for <strong>BIOSAFOR</strong> called<br />
SASOTER.<br />
22
A test simulation for the suitability of Acacia, Prosopis and Eucalyptus based on the collected tree<br />
requirements from literature was carried out for the Pilot area Haryana state. The number of limiting factors<br />
for the tree growth at the regional scale were discussed and the thresholds refined according to the expert<br />
knowledge in the <strong>BIOSAFOR</strong> consortium.<br />
• A regional biomass production model was developed. All available Salt affected soil (SAS) maps were<br />
updated by University of Hohenheim with additional information provided by CSSRI. The SOTER<br />
database for <strong>BIOSAFOR</strong> was further developed and finalised with the input of some 500 soil profiles. For<br />
the further development of the SOTER structure digital SAS maps were overlaid with the groundwater<br />
depth maps. From the growth parameters biomass accumulation was calculated. Furthermore a mean<br />
annual increase (MAI) of the biomass accumulation was calculated for each tree species. Linear<br />
regressions of the relation between soil ECe and MAI for the most prominent tree species at the Case<br />
Study Areas were established.<br />
For WP 3 a regional biomass production model was developed. All available Salt affected soil (SAS) maps<br />
were updated by University of Hohenheim with additional information provided by CSSRI.<br />
The SOTER database for <strong>BIOSAFOR</strong> was further developed and finalised with the input of some 500 soil<br />
profiles. For the further development of the SOTER structure digital SAS maps were overlaid with the<br />
groundwater depth maps.<br />
The required hydrological data was collected and harmonised at case study scale and at regional scale and a<br />
water resources overview for India, Bangladesh and Pakistan was performed. A GIS was developed with<br />
hydrological and salinity data received from Bangladesh, India and Pakistan. GIS analysis have been carried<br />
out on the locations affected by waterlogging in India pre and post monsoon. GIS analysis was carried out to<br />
find potential areas requiring irrigation in Haryana, India based on climate related factors. For the same area<br />
per unit for groundwater irrigation was estimated.<br />
Recent data on salt affected areas in India has been converted in GIS format, harmonized at the same scale<br />
and projection, and imported into the database. For Bangladesh groundwater salinity data was digitized and<br />
interpolated. Finally Indian state boundaries were updated in the current geo-database of <strong>BIOSAFOR</strong>.<br />
From the growth parameters biomass accumulation was calculated. Furthermore a mean annual increase<br />
(MAI) of the biomass accumulation was calculated for each tree species. The sensitivity of parameters like<br />
soil ECe, pH groundwater depth etc. was tested. Linear regressions of the relation between soil ECe and MAI<br />
for the most prominent tree species at the CSA's were established.<br />
WORK PACKAGE 4<br />
<strong>Salinity</strong> mainly occurs in areas with high evaporation, little precipitation level, high oceanic water tables<br />
and/or irrigated agriculture. Typical areas with salinity problems are river deltas in arid or semi-arid areas,<br />
inland areas with shallow watertables or coastal deserts. Already today salinity is affecting an area<br />
responsible for as much as 10% of all agricultural output and every year the area of salt affected land increases<br />
by 10 million hectares.<br />
Objective of this work package is to characterize and quantify the arid and semi-arid areas affected by salinity<br />
and to assess their (global) biomass production potential.<br />
Conclusions<br />
• Large potentials from slightly and moderately salt-affected areas: 40 and 17 EJ per year<br />
• Small potentials from highly and extremely salt-affected areas: 2 and 3 EJ per year<br />
• Current land use is a limiting factor, but potentials are significant<br />
• Further research: reliability of the yield estimates, accuracy of spatial data, current use of shrub and<br />
herbaceous covered areas, more detailed cost assessments, more species.<br />
23
WORK PACKAGE 5<br />
The objective of this work package is to identify promising agro-systems for biosaline biomass systems, to<br />
describe biomass supply and export chains and to analyse these chains under economic and environmental<br />
aspects.<br />
The attractiveness of biomass production systems on saline areas (biosaline biomass systems) depends on<br />
their economic performance and whether other services, like for example the regeneration of degraded land,<br />
can be combined with these systems. The objective of this work package is to identify promising agrosystems<br />
for biosaline biomass systems, to describe biomass supply and export chains and to analyse these chains<br />
under economic and environmental aspects.<br />
Optimized biosaline biomass systems, including multiple land use options, will in discussion with the<br />
project partner and with stakeholder in the case study areas, be chosen for those saline areas that have been<br />
identified as being promising in terms of biomass production potentials. The choice will consider tree<br />
specific information on the biomass properties for energetic and material (pulp and paper) use as analysed in<br />
WP2. Biomass supply chains, including the production, harvest, storage, transport (also international trade)<br />
and use of the biomass will be described in detail. An economic analysis of these biosaline biomass chains<br />
will be performed to show the biomass supply costs and to compare the competitiveness of different biomass<br />
supply chains. Ecological (e.g. water use, demand for agrochemicals, GHG emissions, energy consumption)<br />
and social criteria (e.g. employment effects, additional income for farmers) with relevance for the<br />
performance of biosaline biomass systems will be identified and the supply chains will be evaluated by these<br />
criteria. Tools like LCA and environmental impact analysis will be used to perform the chain analysis.<br />
Deliverables<br />
Economic potentials of biomass production on saline areas<br />
Socio-economic and environmental performance of promising biosaline biomass supply chains and<br />
identification of sustainable biosaline biomass supply chains.<br />
To estimate economic potentials of saline biomass production based on cropping potentials and on<br />
production costs. Cost calculations were carried out based on a generalised crop production system for forest<br />
plantations. Data were taken from the literature.<br />
• Fertilisation: The costs of fertilizers were estimated using the nutrient balance methodology.<br />
Nutrients taken up by the crop during its growth must be replenished by fertilizers in order to maintain<br />
the soil's nutrient composition.<br />
• Harvesting: Two levels of mechanisation were defined, traditional (manual harvesting, using chainsaws<br />
and limited use of other machines) and fully mechanised. Which harvesting system is applied depends<br />
on the labour costs in each country, so for each country the harvest system with the lowest costs was<br />
determined.<br />
• Maintenance: A manual system in developing countries is assumed and a mechanized system in<br />
economies of transition and developed countries.<br />
Activities carried out<br />
Collection of data on costs of biosaline agroforestry in the case study areas through questionnaires developed<br />
and distributed by the University of Utrecht.<br />
WORK PACKAGE 6<br />
The objective of this work package was to elaborate recommendations for the implementation and<br />
sustainable performance of biosaline biomass systems and to show how policy measures could support a<br />
sustainable biomass supply from biosaline biomass production.<br />
24
Biosaline biomass could contribute to a sustainable biofuel supply of developing countries and of the<br />
European Union (EU). For the EU this is true as well for biomass produced on European sites (e.g. in Spain) as<br />
for biomass that will be imported from other than EU countries. Objective of this work package is to elaborate<br />
recommendations for the implementation and sustainable performance of biosaline biomass systems and to<br />
show how policy measures can support a sustainable biomass supply from biosaline biomass production.<br />
Description of work<br />
Based on the information gained mainly from WP2, WP4 and WP5 and in joint discussion with the whole<br />
project group recommendations will be elaborated on:<br />
• the optimal choice of saline areas for biomass production<br />
• the optimal performance of biosaline agrosystems in terms of choice of species and varieties and<br />
production technology<br />
• the optimal biosaline biomass systems with regard to economic and environmental performance<br />
• implementation of sustainable biosaline biofuel supply and trade chains<br />
• policy measures that can support the implementation of sustainable biomass supply from biosaline<br />
biomass production workshops to inform the local stakeholders of biosaline biomass chains and EU<br />
politicians will be performed by the DEV participants. A final workshop to present project results was<br />
held in New Delhi in April 2010.<br />
Deliverables<br />
Identification of the overall constraints for the implementation and sustainable performance of biosaline<br />
biomass systems<br />
Analysis of - and recommendations on - policy measures to support a sustainable biomass supply from<br />
biosaline biomass production<br />
Background documents to be presented at the workshops on biosaline biomass in DEV countries<br />
Policy briefs and dissemination materials for the workshop on biosaline biomass in Brussels<br />
Research Achievements Overall<br />
Regression curves relating harvested biomass, girth and plant height were developed and validated. A<br />
database was established in MS Access to link the different subsets of field data and be able to assess and<br />
evaluate case study data. The work carried out by CSSRI was highly appreciated. They were able to provide<br />
very useful data to establish relationship between growth and biomass of the test species based on real longterm<br />
data on plantations on saline and sodic lands.<br />
Studies at the case study sites having plantations on saline and sodic lands - eight in India, five in Pakistan<br />
and two in Bangladesh were conducted and /or monitored providing very useful data to establish<br />
relationship between growth and biomass of the test species based on real long-term data on plantations on<br />
saline and sodic lands.<br />
— Regression equations for biomass calculation of trees based on actual harvested total biomass (kg/tree),<br />
girth at breast height (cm) and total height (m) were developed to predict biomass in similar situations<br />
and age of the plants<br />
— These equations and data have been used to make non-destructive projections at regional and global<br />
levels for similar saline and sodic lands<br />
Hydrological data available at regional and local scale in case study areas including India, Pakistan and<br />
Bangladesh were collected and reviewed. A GIS analysis was performed to find potential areas requiring<br />
25
irrigation in Haryana, India based on climate related factors. Also using Haryana as a sample, cost per unit<br />
for groundwater irrigation was estimated district-wise based on a sample field survey. A water resources<br />
overview for India, Pakistan and Bangladesh was delivered to University of Hohenheim.<br />
All available Salt affected soil (SAS) maps for the 12 Indian states were updated by University of Hohenheim<br />
with additional information from the paper “<strong>Soil</strong> Resource Maps” provided by CSSRI. Some 300 soil profiles<br />
were put into the SOTER database. In addition, the digital SAS maps were overlaid with the groundwater<br />
depth maps for the further development of the SOTER structure. After that the new terrain components were<br />
manually defined in MS Excel and imported into the IBM DBII database developed for <strong>BIOSAFOR</strong> called<br />
SASOTER.<br />
A test simulation for the suitability of Acacia, Prosopis and Eucalyptus based on the collected tree<br />
requirements from literature was carried out for the Pilot area Haryana state. Number of limiting factors for<br />
the tree growth at the regional scale were discussed and the thresholds refined according to the expert<br />
knowledge in the <strong>BIOSAFOR</strong> consortium.<br />
Economic potentials of saline biomass production based on cropping potentials and on production costs<br />
were estimated. Cost calculations were carried out based on a generalised crop production system for forest<br />
plantations with data are taken from the literature.<br />
Third Annual Meeting of the Project, "<strong>BIOSALINE</strong> (<strong>AGRO</strong>)<br />
<strong>FORESTRY</strong>: Remediation of Saline Wastelands through<br />
Production of Renewable Energy, Biomaterials and Fodder"<br />
at University of Hohenheim, Stuttgart, Germany from 12 to 15<br />
June, 2009.<br />
Scientists from Biosafor project Review meeting being<br />
shown the bioenergy and biodiesel experiments on alkali<br />
fields at CSSRI Karnal farms.<br />
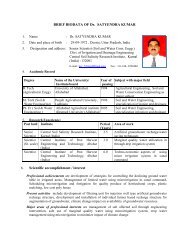
Acknowledgements<br />
Authors express their sincere thanks to the Indian Council of Agriculture Research (ICAR), New Delhi and<br />
to Dr. S. Ayappan, Director General, ICAR and Dr. A. K. Singh, Deputy Director General (NRM), ICAR, Dr.<br />
Jeannette Hoek, Director, OASE, Amsterdam and Co-ordinator, Biosafor Project for approvals and<br />
guidance. Thanks are due to the European Union, Brussels for financing the consortium project. We also<br />
acknowledge the contributions made by Mr. R. K. Prasad, Technical Assistant, Dr. Manoj K. Singh, Research<br />
Associate, Dr. Y. P. Singh, Principal Scientist, CSSRI, RRS, Lucknow and other colleagues. Thanks are due to<br />
Mr. Randhir Singh for help in its publication.<br />
26