Parametric vs. neural network models for the estimation of ...
Parametric vs. neural network models for the estimation of ...
Parametric vs. neural network models for the estimation of ...

You also want an ePaper? Increase the reach of your titles
YUMPU automatically turns print PDFs into web optimized ePapers that Google loves.
ARTICLE IN PRESS<br />
Int. J. Production Economics 91 (2004) 165–177<br />
<strong>Parametric</strong> <strong>vs</strong>. <strong>neural</strong> <strong>network</strong><strong>models</strong> <strong>for</strong> <strong>the</strong> <strong>estimation</strong> <strong>of</strong><br />
production costs: A case study in <strong>the</strong> automotive industry $<br />
Sergio Cavalieri a , Paolo Maccarrone b, *, Roberto Pinto a<br />
a University <strong>of</strong> Bergamo, Bergamo, Italy<br />
b Dipt. di Ingegneria Gestionale, Politecnico di Milano, Piazza Leonardo da Vinci, 32 Milan 20133, Italy<br />
Received 11 March 2002; accepted 19 August 2003<br />
Abstract<br />
This paper aims at illustrating <strong>the</strong> compared results <strong>of</strong> <strong>the</strong> application <strong>of</strong> two different approaches—respectively<br />
parametric and artificial <strong>neural</strong> <strong>network</strong>techniques—<strong>for</strong> <strong>the</strong> <strong>estimation</strong> <strong>of</strong> <strong>the</strong> unitary manufacturing costs <strong>of</strong> a new<br />
type <strong>of</strong> brake disks produced by an Italian manufacturing firm. The results seem to confirm <strong>the</strong> validity <strong>of</strong> <strong>the</strong> <strong>neural</strong><br />
<strong>network</strong><strong>the</strong>ory in this application field, but not a clear superiority with respect to <strong>the</strong> more ‘‘traditional’’ parametric<br />
approach: in particular, <strong>the</strong> ANN seems to be characterised by a better trade-<strong>of</strong>f between precision and cost <strong>of</strong><br />
development, while a critical point—especially in <strong>the</strong> specific application context—is represented by <strong>the</strong> reduced<br />
possibility <strong>of</strong> interpreting output data (which is critical <strong>for</strong> <strong>the</strong> ‘‘optimisation’’ <strong>of</strong> design solutions during <strong>the</strong> new<br />
product development process).<br />
r 2003 Published by Elsevier B.V.<br />
Keywords: Cost <strong>estimation</strong>; <strong>Parametric</strong> <strong>models</strong>; Artificial <strong>neural</strong> <strong>network</strong>s; New product development process; Target costing<br />
1. Introduction<br />
The <strong>estimation</strong> <strong>of</strong> future production costs is a<br />
key factor in determining <strong>the</strong> overall per<strong>for</strong>mance<br />
<strong>of</strong> a new product development (NPD) process: <strong>the</strong><br />
earlier this in<strong>for</strong>mation is known, <strong>the</strong> better <strong>the</strong><br />
trade-<strong>of</strong>f between costs and product per<strong>for</strong>mances<br />
will be managed.<br />
$ This article is due to <strong>the</strong> joint work<strong>of</strong> <strong>the</strong> three authors.<br />
Anyway, Sergio Cavalieri has written Sections 4 and 5. Paolo<br />
Maccarrone has written Sections 1–3,7 and 8 and Roberto<br />
Pinto has written Section 6.<br />
*Corresponding author. Tel.: +39-02-2399-2766; fax: +39-<br />
02-2399-2720.<br />
E-mail address: paolo.maccarrone@polimi.it<br />
(P. Maccarrone).<br />
Typically, <strong>the</strong> cost per unit <strong>of</strong> a given finished<br />
good is <strong>the</strong> sum <strong>of</strong> different kind <strong>of</strong> resources—<br />
raw materials, components, energy, machinery,<br />
plants, etc.—and <strong>the</strong> quantification <strong>of</strong> <strong>the</strong> use <strong>of</strong><br />
each resource is extremely difficult in <strong>the</strong> first<br />
stages <strong>of</strong> <strong>the</strong> life cycle (and particularly in <strong>the</strong> early<br />
phases <strong>of</strong> <strong>the</strong> product development process), given<br />
<strong>the</strong> reduced amount <strong>of</strong> in<strong>for</strong>mation and <strong>the</strong> low<br />
level <strong>of</strong> definition <strong>of</strong> <strong>the</strong> project.<br />
However, it is just in <strong>the</strong>se phases that <strong>the</strong><br />
availability <strong>of</strong> <strong>the</strong> estimated production cost data<br />
is crucial, since most <strong>of</strong> <strong>the</strong> costs that will be<br />
sustained in <strong>the</strong> following stages are implicitly<br />
determined by <strong>the</strong> choices made during <strong>the</strong><br />
elaboration <strong>of</strong> <strong>the</strong> concept and <strong>the</strong> detailed design<br />
<strong>of</strong> <strong>the</strong> new product.<br />
0925-5273/$ - see front matter r 2003 Published by Elsevier B.V.<br />
doi:10.1016/j.ijpe.2003.08.005
ARTICLE IN PRESS<br />
166<br />
S. Cavalieri et al. / Int. J. Production Economics 91 (2004) 165–177<br />
For this reason, different techniques and<br />
approaches have been developed to cope with <strong>the</strong><br />
problem <strong>of</strong> <strong>the</strong> <strong>estimation</strong> <strong>of</strong> manufacturing costs<br />
in highly uncertain contexts. In particular, this<br />
article shows <strong>the</strong> results <strong>of</strong> a study aimed at<br />
comparing <strong>the</strong> results <strong>of</strong> <strong>the</strong> application <strong>of</strong> two <strong>of</strong><br />
<strong>the</strong>se techniques: <strong>the</strong> parametric approach (perhaps<br />
<strong>the</strong> most diffused in practice) and a predictive<br />
model based on <strong>the</strong> <strong>neural</strong> <strong>network</strong>s <strong>the</strong>ory, which<br />
has known great diffusion in <strong>the</strong> last years in very<br />
different application contexts.<br />
This paper has a fur<strong>the</strong>r seven sections. The<br />
following one (Section 2) deals with <strong>the</strong> strategic<br />
relevance <strong>of</strong> cost management in <strong>the</strong> modern<br />
competitive scenarios, Section 3 consists <strong>of</strong> a brief<br />
review <strong>of</strong> <strong>the</strong> main cost <strong>estimation</strong> approaches that<br />
can be found in literature, while Section 4<br />
illustrates <strong>the</strong> basic <strong>the</strong>oretical elements <strong>of</strong> artificial<br />
<strong>neural</strong> <strong>network</strong>s (ANNs). The remaining four<br />
sections are devoted to <strong>the</strong> illustration <strong>of</strong> <strong>the</strong> case<br />
study: in particular, Section 5 describes <strong>the</strong><br />
application context (<strong>the</strong> characteristics <strong>of</strong> <strong>the</strong> firm,<br />
<strong>of</strong> <strong>the</strong> product and <strong>of</strong> production technologies),<br />
while <strong>the</strong> following illustrates <strong>the</strong> design, development<br />
and refinement phases <strong>of</strong> <strong>the</strong> two <strong>models</strong>.<br />
The quantitative and qualitative comparison <strong>of</strong> <strong>the</strong><br />
results is contained in Section 7, while <strong>the</strong> last<br />
section is devoted to <strong>the</strong> conclusions.<br />
2. The strategic relevance <strong>of</strong> <strong>the</strong> cost variable in <strong>the</strong><br />
new product development process<br />
The ever growing competitive pressures that<br />
characterise most sectors <strong>for</strong>ce firms to develop<br />
business strategies based on a large number <strong>of</strong><br />
differentiation factors: higher quality and service<br />
levels, as well as customisation and continuous<br />
innovation must be made compatible with lower<br />
costs <strong>for</strong> firms to stay competitive in <strong>the</strong> market<br />
and be pr<strong>of</strong>itable.<br />
The research <strong>of</strong> organisational, technological<br />
and managerial solutions and tools that can shift<br />
<strong>the</strong> trade-<strong>of</strong>f frontier between costs and differentiation<br />
is <strong>the</strong>n <strong>of</strong> fundamental importance in <strong>the</strong>se<br />
contexts. In this perspective, a great step <strong>for</strong>ward<br />
comes from <strong>the</strong> attention that has been given to<br />
<strong>the</strong> ‘‘process view’’ in all <strong>the</strong> managerial and<br />
organisational disciplines: <strong>the</strong> development <strong>of</strong> <strong>the</strong><br />
<strong>the</strong>ory <strong>of</strong> ‘‘management by processes’’ has led to<br />
<strong>the</strong> gradual elimination <strong>of</strong> functional barriers. In<br />
firms that adopt this approach, each functional<br />
manager is made responsible not only <strong>for</strong> <strong>the</strong><br />
results <strong>of</strong> his unit, but also on <strong>the</strong> overall<br />
effectiveness <strong>of</strong> <strong>the</strong> processes in which his unit is<br />
involved, according to an input–output logic<br />
which is typical <strong>of</strong> <strong>the</strong> process view (Berliner and<br />
Brimson, 1988; Zeleny, 1988; Hammer and Stanton,<br />
1999).<br />
Of course, this process re-orientation requires a<br />
radical cultural change to be effectively implemented,<br />
and must be supported by an ad hoc reengineering<br />
<strong>of</strong> <strong>the</strong> organisational structure and <strong>of</strong><br />
<strong>the</strong> management control systems, with particular<br />
regard to <strong>the</strong> per<strong>for</strong>mance measurement systems.<br />
In particular, <strong>the</strong> R&D department is one <strong>of</strong> <strong>the</strong><br />
areas most involved in this process <strong>of</strong> organisational<br />
change. Being constituted mainly by people<br />
with technical or scientific competencies, during<br />
<strong>the</strong> new product development (NPD) process this<br />
unit traditionally puts much more emphasis on<br />
<strong>the</strong> technologically innovative contents and on <strong>the</strong><br />
absolute per<strong>for</strong>mance <strong>of</strong> <strong>the</strong> product, than on <strong>the</strong><br />
impact <strong>of</strong> <strong>the</strong> adopted solutions on <strong>the</strong> economics<br />
and on related figures (like <strong>the</strong> manufacturing<br />
costs or <strong>the</strong> contribution margin generated by <strong>the</strong><br />
new product). In this sense, <strong>the</strong> process view <strong>of</strong> <strong>the</strong><br />
firm can be <strong>of</strong> great help in making designers and<br />
product engineers more aware <strong>of</strong> <strong>the</strong> critical role<br />
played in determining <strong>the</strong> overall economic per<strong>for</strong>mance<br />
<strong>of</strong> <strong>the</strong> firm, as proved by <strong>the</strong> ‘‘life cycle<br />
costing’’ <strong>the</strong>ory (Blanchard, 1979; Fabrycky, 1991;<br />
Shields and Young, 1991).<br />
Indeed, <strong>the</strong> life cycle <strong>the</strong>ory states that, although<br />
<strong>the</strong> great majority <strong>of</strong> costs <strong>of</strong> a finished good are<br />
generated in <strong>the</strong> manufacturing/distribution stage<br />
(given also <strong>the</strong> repetitive nature <strong>of</strong> <strong>the</strong>se activities<br />
<strong>for</strong> almost all kind <strong>of</strong> products), most <strong>of</strong> <strong>the</strong>se<br />
costs are implicitly determined in <strong>the</strong> early phases<br />
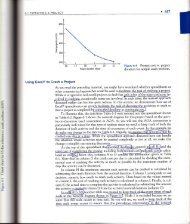
<strong>of</strong> development. In Fig. 1, this is shown by <strong>the</strong><br />
different pr<strong>of</strong>ile <strong>of</strong> <strong>the</strong> ‘‘actual costs’’ and <strong>of</strong> <strong>the</strong><br />
‘‘committed costs’’ curves: <strong>the</strong> latter is built<br />
‘‘translating’’ <strong>the</strong> costs occurred in <strong>the</strong> various<br />
stages <strong>of</strong> <strong>the</strong> life cycle backto <strong>the</strong> instant in which<br />
<strong>the</strong> different decisional processes that implicitly<br />
fixed those costs tookplace.
ARTICLE IN PRESS<br />
S. Cavalieri et al. / Int. J. Production Economics 91 (2004) 165–177 167<br />
Cumulated<br />
costs<br />
Concept definition,<br />
Design and Engineering<br />
Committed costs<br />
Actual costs<br />
Manufacturing/Distribution/<br />
Post-sale<br />
Fig. 1. Committed costs and actual costs along <strong>the</strong> life cycle <strong>of</strong><br />
a product.<br />
These considerations have led to <strong>the</strong> development<br />
<strong>of</strong> design rules and techniques, whose objective is to<br />
help engineers and designers in <strong>the</strong>ir decisional<br />
processes and make <strong>the</strong>m aware <strong>of</strong> <strong>the</strong> implications<br />
<strong>of</strong> <strong>the</strong> alternative design solutions on <strong>the</strong> future<br />
costs <strong>of</strong> <strong>the</strong> product (Ulrich and Eppinger, 1995).<br />
These approaches can be named differently,<br />
according to <strong>the</strong> specific application context and<br />
<strong>the</strong> emphasis given to <strong>the</strong> economic figures<br />
(Huang, 1996):<br />
* Design <strong>for</strong> manufacturing/assembly: design rules<br />
finalised to <strong>the</strong> standardisation <strong>of</strong> components<br />
and to <strong>the</strong> simplification <strong>of</strong> <strong>the</strong> production<br />
processes (ei<strong>the</strong>r fabrication or assembly processes).<br />
* (Re-)design to cost: while <strong>the</strong> rules included in<br />
<strong>the</strong> previous category can be ra<strong>the</strong>r generic and<br />
qualitative in nature, this approach is usually<br />
more structured and analytical: indeed, its aim<br />
is <strong>the</strong> quantification <strong>of</strong> <strong>the</strong> economic impact <strong>of</strong><br />
<strong>the</strong> different design solutions adopted 1 .<br />
* Target costing: this management <strong>the</strong>ory changes<br />
in a quite radical way <strong>the</strong> approach to <strong>the</strong><br />
1 It must be noted that sometimes <strong>the</strong> term ‘‘redesign to cost’’<br />
is used with a totally different meaning: it is referred to <strong>the</strong><br />
redesign <strong>of</strong> business processes, and not <strong>of</strong> products, and<br />
includes all <strong>the</strong> organisational tools and rules aimed at <strong>the</strong><br />
redesign <strong>of</strong> business processes in a cost-reduction perspective<br />
(someway similar to BPR <strong>the</strong>ory).<br />
t<br />
development <strong>of</strong> a new product (Hiromoto,<br />
1988; Sakurai, 1989; Ansari et al., 1997;<br />
Cooper, 1997); while in <strong>the</strong> ‘‘traditional’’<br />
process <strong>the</strong> economic-financial evaluation is<br />
conducted only after <strong>the</strong> concept definition<br />
phase (if not later), according to <strong>the</strong> target<br />
costing philosophy (particularly diffused in<br />
Japan automotive industry) <strong>the</strong> starting<br />
point consists in <strong>the</strong> determination <strong>of</strong> <strong>the</strong><br />
estimated market price <strong>of</strong> <strong>the</strong> new product.<br />
This in<strong>for</strong>mation, coupled with <strong>the</strong> expected<br />
(desired) pr<strong>of</strong>itability margin, leads to <strong>the</strong><br />
identification <strong>of</strong> <strong>the</strong> sustainable production cost<br />
per unit. All <strong>the</strong> subsequent design and development<br />
phases must <strong>the</strong>n be ‘‘cost’’ driven<br />
(i.e., all decisions must be made according to<br />
<strong>the</strong> final objective <strong>of</strong> meeting <strong>the</strong> target<br />
production cost). The overall production cost<br />
is <strong>the</strong>n divided into its components and ‘‘second<br />
level’’ target costs are <strong>the</strong>n identified <strong>for</strong> all<br />
purchased parts and <strong>for</strong> internal conversion<br />
activities: in particular, <strong>the</strong> target purchase<br />
costs are discussed with all <strong>the</strong> suppliers, in a<br />
ra<strong>the</strong>r classical bargaining approach aimed at<br />
price reduction.<br />
All <strong>the</strong>se managerial approaches highlight <strong>the</strong><br />
strategic relevance <strong>of</strong> <strong>the</strong> in<strong>for</strong>mation regarding<br />
<strong>the</strong> future manufacturing cost <strong>of</strong> <strong>the</strong> product (or <strong>of</strong><br />
its components): in <strong>the</strong> life cycle <strong>the</strong>ory <strong>the</strong> overall<br />
objective resides on <strong>the</strong> minimisation <strong>of</strong> <strong>the</strong><br />
cumulated life cycle cost. Hence, <strong>the</strong> first step<br />
consists in estimating <strong>the</strong> ‘‘occurred costs’’ curve<br />
(and, <strong>the</strong>n, <strong>the</strong> manufacturing costs, which represent<br />
<strong>the</strong> most important element). Similarly, in a<br />
firm which adopts <strong>the</strong> target cost approach, <strong>the</strong><br />
anticipated knowledge <strong>of</strong> <strong>the</strong> estimated future<br />
manufacturing costs is fundamental to understanding<br />
whe<strong>the</strong>r <strong>the</strong> target cost can really be<br />
reached or not (according to <strong>the</strong> gap between <strong>the</strong><br />
target cost and <strong>the</strong> data resulting from <strong>the</strong><br />
application <strong>of</strong> a cost <strong>estimation</strong> technique). Moreover,<br />
if an assembler firm can make reliable<br />
predictions about <strong>the</strong> production costs <strong>of</strong> its<br />
suppliers (<strong>for</strong> purchased components), its bargaining<br />
power will be higher due to <strong>the</strong> reduction <strong>of</strong><br />
in<strong>for</strong>mation asymmetry (Porter, 1980): this appears<br />
particularly critical in <strong>the</strong> target cost
ARTICLE IN PRESS<br />
168<br />
S. Cavalieri et al. / Int. J. Production Economics 91 (2004) 165–177<br />
approach, due to <strong>the</strong> ‘‘pressure’’ that is made on<br />
suppliers to meet <strong>the</strong> objective.<br />
All <strong>the</strong>se considerations justify <strong>the</strong> ef<strong>for</strong>ts that<br />
have been made in <strong>the</strong> field <strong>of</strong> cost <strong>estimation</strong><br />
techniques in recent years. The next section is<br />
devoted to <strong>the</strong> illustration <strong>of</strong> <strong>the</strong> state <strong>of</strong> <strong>the</strong> art,<br />
with particular regard to <strong>the</strong> latest developments.<br />
3. The cost <strong>estimation</strong> techniques<br />
In literature, three main quantitative approaches<br />
can be identified <strong>for</strong> cost <strong>estimation</strong><br />
purposes.<br />
(a) Analogy-based techniques: <strong>the</strong>se techniques<br />
belong to <strong>the</strong> category <strong>of</strong> qualitative <strong>estimation</strong><br />
methods. They are based on <strong>the</strong> definition<br />
and analysis <strong>of</strong> <strong>the</strong> degree <strong>of</strong> similarity<br />
between <strong>the</strong> new product and ano<strong>the</strong>r one,<br />
which has been (or is being) already produced<br />
by <strong>the</strong> firm. The underlying concept is to<br />
derive <strong>the</strong> <strong>estimation</strong> from actual in<strong>for</strong>mation<br />
regarding real products. However, many<br />
problems exist in <strong>the</strong> application <strong>of</strong> this<br />
approach, due to:<br />
* <strong>the</strong> difficulties in <strong>the</strong> operationalisation <strong>of</strong><br />
<strong>the</strong> concept <strong>of</strong> ‘‘degree <strong>of</strong> similarity’’ (how<br />
to measure it?);<br />
* <strong>the</strong> difficulty <strong>of</strong> incorporating in this parameter<br />
<strong>the</strong> effect <strong>of</strong> technological progress<br />
and <strong>of</strong> context factors.<br />
This kind <strong>of</strong> techniques is mainly adopted in<br />
<strong>the</strong> first phase <strong>of</strong> <strong>the</strong> development process <strong>of</strong> a<br />
product, because it allows obtaining a rough<br />
but reliable <strong>estimation</strong> <strong>of</strong> <strong>the</strong> future costs<br />
involved.<br />
(b) <strong>Parametric</strong> <strong>models</strong>: according to <strong>the</strong>se techniques,<br />
<strong>the</strong> cost is expressed as an analytical<br />
function <strong>of</strong> a set <strong>of</strong> variables (so, <strong>the</strong>y belong<br />
to <strong>the</strong> quantitative methods category). These<br />
usually consist in some features <strong>of</strong> <strong>the</strong> product<br />
(per<strong>for</strong>mances, morphological characteristics,<br />
type <strong>of</strong> materials used), which are supposed to<br />
influence mainly <strong>the</strong> final cost <strong>of</strong> <strong>the</strong> product<br />
(known also as ‘‘cost drivers’’). These analytical<br />
functions are usually named ‘‘Cost<br />
Estimation Relationships’’ (CER), and are<br />
built through <strong>the</strong> application <strong>of</strong> statistical<br />
methodologies (see <strong>the</strong> NASA handbookon<br />
parametric cost estimating, <strong>for</strong> example). They<br />
can be adopted during <strong>the</strong> development <strong>of</strong><br />
new products and as a control during <strong>the</strong><br />
implementation, providing a target <strong>for</strong> <strong>the</strong><br />
final cost <strong>of</strong> <strong>the</strong> product. Although <strong>the</strong>y are<br />
mainly used <strong>for</strong> <strong>the</strong> <strong>estimation</strong> <strong>of</strong> <strong>the</strong> cost <strong>of</strong><br />
large projects (such as in <strong>the</strong> aeronautical<br />
field), <strong>the</strong>y could be effective also <strong>for</strong> <strong>the</strong><br />
<strong>estimation</strong> <strong>of</strong> <strong>the</strong> cost <strong>of</strong> those products, where<br />
<strong>the</strong> cost drivers could be easily identified.<br />
(c) Engineering approaches: in this case <strong>the</strong><br />
<strong>estimation</strong> is based on <strong>the</strong> detailed analysis<br />
<strong>of</strong> <strong>the</strong> manufacturing process and <strong>of</strong> <strong>the</strong><br />
features <strong>of</strong> <strong>the</strong> product. The estimated cost<br />
<strong>of</strong> <strong>the</strong> product is calculated in a very analytical<br />
way, as <strong>the</strong> sum <strong>of</strong> its elementary components,<br />
constituted by <strong>the</strong> value <strong>of</strong> <strong>the</strong> resources used<br />
in each step <strong>of</strong> <strong>the</strong> production process (raw<br />
materials, components, labour, equipment,<br />
etc.). Due to this, <strong>the</strong> engineering approach<br />
can be used only when all <strong>the</strong> characteristics <strong>of</strong><br />
<strong>the</strong> production process and <strong>of</strong> <strong>the</strong> product are<br />
well defined.<br />
These can be considered as ‘‘classical’’ approaches<br />
to cost <strong>estimation</strong>: passing from <strong>the</strong> first<br />
to <strong>the</strong> last <strong>the</strong> average precision <strong>of</strong> <strong>the</strong> methodology<br />
increases (and its cost too, <strong>of</strong> course). But it is<br />
also clear that <strong>the</strong> choice between <strong>the</strong> three<br />
methodologies is not completely free. Each <strong>of</strong><br />
<strong>the</strong>m is suited to different stages <strong>of</strong> <strong>the</strong> NPD<br />
process, given <strong>the</strong>ir different degree <strong>of</strong> analyticity<br />
and <strong>the</strong> different amount <strong>of</strong> input data needed.<br />
4. Artificial <strong>neural</strong> <strong>network</strong>s <strong>for</strong> cost <strong>estimation</strong><br />
In <strong>the</strong> last years a new approach, based on <strong>the</strong><br />
<strong>the</strong>ory <strong>of</strong> ANNs, has grown in popularity. ANNs<br />
are inspired to <strong>the</strong> human brain functionality and<br />
structure, which can be represented as a <strong>network</strong><br />
<strong>of</strong> densely interconnected elements called neurons.<br />
The connections between neurons are called synapses<br />
and could have different levels <strong>of</strong> electrical
ARTICLE IN PRESS<br />
S. Cavalieri et al. / Int. J. Production Economics 91 (2004) 165–177 169<br />
conductivity, which is referred to as <strong>the</strong> weight<br />
<strong>of</strong> <strong>the</strong> connection.<br />
This <strong>network</strong><strong>of</strong> neurons and synapses stores <strong>the</strong><br />
knowledge in a ‘‘distributed’’ manner: <strong>the</strong> in<strong>for</strong>mation<br />
is coded as an electrical impulse in <strong>the</strong><br />
neurons and is stored by changing <strong>the</strong> weight (i.e.<br />
<strong>the</strong> conductivity) <strong>of</strong> <strong>the</strong> connections.<br />
ANNs inherit <strong>the</strong> above-explained structure:<br />
<strong>the</strong>y are composed <strong>of</strong> a large number <strong>of</strong> elaboration<br />
units (<strong>the</strong> neurons) linked via a weighted<br />
connections (<strong>the</strong> synapses). An ANN reacts to<br />
inputs by per<strong>for</strong>ming <strong>the</strong> sum <strong>of</strong> <strong>the</strong> weighted<br />
impulse <strong>of</strong> <strong>the</strong> neurons: <strong>the</strong> result activates one or<br />
more specific output neurons which provide <strong>the</strong><br />
answer <strong>of</strong> <strong>the</strong> net.<br />
Ano<strong>the</strong>r similarity between ANNs and a brain is<br />
<strong>the</strong> learning approach. Like <strong>the</strong> human brain, an<br />
ANN needs to be trained, which means that it<br />
needs to store knowledge by means <strong>of</strong> <strong>the</strong><br />
elaboration <strong>of</strong> a set <strong>of</strong> training data (also called<br />
patterns), which represent <strong>the</strong> experience ‘‘cumulated’’<br />
by <strong>the</strong> ANN. This training campaign allows<br />
<strong>the</strong> <strong>network</strong>designer to ‘‘fine tune’’ <strong>the</strong> weight <strong>of</strong><br />
<strong>the</strong> connections between neurons, by storing <strong>the</strong><br />
specific knowledge included in <strong>the</strong> patterns.<br />
Moreover, one <strong>of</strong> <strong>the</strong> most important characteristic<br />
<strong>of</strong> ANNs is <strong>the</strong>ir ability to infer from <strong>the</strong>ir<br />
knowledge <strong>the</strong> answer to questions (inputs) that<br />
<strong>the</strong>y have never seen be<strong>for</strong>e. This is referred to as<br />
<strong>the</strong> generalisation ability <strong>of</strong> <strong>the</strong> ANNs. This<br />
feature <strong>of</strong> ANNs reduces <strong>the</strong> amount <strong>of</strong> data<br />
needed in <strong>the</strong> training phase.<br />
To summarise, <strong>the</strong> ANNs represent a powerful,<br />
non-linear and parallel computing approach that<br />
could be used to per<strong>for</strong>m fast and complex<br />
computations.<br />
4.1. Multilayer ANNs<br />
There are a multitudes <strong>of</strong> ANNs structures and<br />
different classification frameworks. For examples,<br />
ANNs could be classified according to <strong>the</strong> learning<br />
method or to <strong>the</strong> organisation <strong>of</strong> <strong>the</strong> neurons (see,<br />
<strong>for</strong> example, Chester, 1993).<br />
The one that have been used in this workis<br />
called Multilayer Perceptron (MLP), in which<br />
neurons are organised in several layers: <strong>the</strong> first<br />
is <strong>the</strong> input layer (fed by a pattern <strong>of</strong> data), while<br />
X 1<br />
Y 1<br />
X 2<br />
Y 2<br />
X 3<br />
Y 3<br />
X 4<br />
Input layer<br />
Neuron<br />
Hidden layers<br />
<strong>the</strong> last is <strong>the</strong> output layer (which provides <strong>the</strong><br />
answer to <strong>the</strong> presented pattern). Between input<br />
and output layers <strong>the</strong>re could be several o<strong>the</strong>r<br />
hidden layers (see Fig. 2). The number <strong>of</strong> hidden<br />
layers has an important role in determining <strong>the</strong><br />
generalisation ability <strong>of</strong> <strong>the</strong> MLP.<br />
MLP represents a tool, which is able to identify<br />
<strong>the</strong> relationships between different data sets,<br />
although <strong>the</strong> <strong>for</strong>m <strong>of</strong> <strong>the</strong>se relationships is not<br />
defined ex ante. For this reason <strong>the</strong>y are called<br />
‘‘universal regression tools’’ (Horniket al., 1989).<br />
4.2. Application <strong>of</strong> ANNs<br />
Synapse<br />
Fig. 2. The structure <strong>of</strong> an MLP.<br />
This approach has known <strong>the</strong> first applications<br />
in <strong>the</strong> manufacturing sector <strong>for</strong> planning, emulation<br />
and management <strong>of</strong> production processes and<br />
plants. For example, Cavalieri and Taisch (1996)<br />
and Cavalieri et al. (1995, 1997) have developed<br />
ANNs <strong>for</strong> <strong>the</strong> design <strong>of</strong> hybrid intelligent systems<br />
and <strong>of</strong> process plants, while Zhang et al. (1996)<br />
illustrate <strong>the</strong> use <strong>of</strong> a <strong>neural</strong> <strong>network</strong>-based model<br />
<strong>for</strong> <strong>the</strong> <strong>estimation</strong> <strong>of</strong> <strong>the</strong> packaging cost, based on<br />
<strong>the</strong> geometrical characteristics <strong>of</strong> <strong>the</strong> packaged<br />
product (<strong>the</strong> so-called ‘‘feature based cost’’).<br />
However, it must be underlined that <strong>the</strong> <strong>neural</strong><br />
<strong>network</strong><strong>the</strong>ory has been applied in <strong>the</strong> most<br />
disparate sectors: <strong>for</strong> example, O’Rourke (1998)<br />
deals with <strong>neural</strong> <strong>network</strong>s <strong>for</strong> <strong>the</strong> <strong>estimation</strong> <strong>of</strong><br />
<strong>the</strong> market value <strong>of</strong> equity stocks, and concludes<br />
that <strong>the</strong> results achieved are better than those <strong>of</strong> a<br />
linear predictive model.<br />
Y 4<br />
Output layer
ARTICLE IN PRESS<br />
170<br />
S. Cavalieri et al. / Int. J. Production Economics 91 (2004) 165–177<br />
5. The case study<br />
The objective <strong>of</strong> <strong>the</strong> research was to compare <strong>the</strong><br />
results achieved with <strong>the</strong> application <strong>of</strong> a traditional<br />
cost <strong>estimation</strong> technique with those<br />
obtained through <strong>the</strong> design and implementation<br />
<strong>of</strong> an ad hoc ANN.<br />
Given <strong>the</strong> objectives and specific application<br />
context <strong>of</strong> <strong>the</strong> cost <strong>estimation</strong> methodology in <strong>the</strong><br />
analysed firm, <strong>the</strong> preference among <strong>the</strong> ‘‘classical’’<br />
methodologies has gone to <strong>the</strong> parametric<br />
model. In fact, <strong>the</strong> analogy-based approach has<br />
been judged as too approximate, while <strong>the</strong><br />
engineering analysis was not applicable, since <strong>the</strong><br />
cost <strong>of</strong> a purchased part (and <strong>the</strong> detailed specifics<br />
<strong>of</strong> <strong>the</strong> production process <strong>of</strong> <strong>the</strong> suppliers) were<br />
not known to <strong>the</strong> firm.<br />
The interest <strong>for</strong> this kind <strong>of</strong> comparative<br />
analysis derives also from <strong>the</strong> still poor literature<br />
on this topic; indeed, <strong>the</strong> main references found<br />
are <strong>the</strong> following:<br />
* an analysis <strong>of</strong> <strong>the</strong> results <strong>of</strong> <strong>the</strong> application <strong>of</strong><br />
ANN <strong>vs</strong>. regression <strong>models</strong> <strong>for</strong> <strong>the</strong> determination<br />
<strong>of</strong> product costs in assembly industries<br />
(Shtub and Zimmermann, 1993);<br />
* <strong>the</strong> workby Mason and Smith (1997), who<br />
compare <strong>the</strong> per<strong>for</strong>mances <strong>of</strong> regression and<br />
<strong>neural</strong> <strong>network</strong>approaches <strong>for</strong> cost <strong>estimation</strong><br />
purposes. The results show that <strong>the</strong> ANN-based<br />
<strong>models</strong> are characterised by higher precision,<br />
especially when <strong>the</strong> analytical expression that<br />
links input and output variables is not known,<br />
or when it cannot be expressed in polynomial<br />
<strong>for</strong>m.<br />
The analysis was conducted through a real case<br />
study provided by an industrial company operating<br />
in <strong>the</strong> automotive sector.<br />
The main mission <strong>of</strong> <strong>the</strong> company is <strong>the</strong> design,<br />
production and sale <strong>of</strong> braking components and<br />
integrated systems <strong>for</strong> civil and industrial vehicles,<br />
as well as <strong>for</strong> racing applications.<br />
The customers are mainly very large industrial<br />
contractors (<strong>the</strong> major automotive multinational<br />
companies), which in <strong>the</strong> last decade have almost<br />
completely outsourced <strong>the</strong> production <strong>of</strong> braking<br />
components.<br />
The high degree <strong>of</strong> competition that characterises<br />
<strong>the</strong> sector <strong>for</strong>ces firms to search <strong>for</strong><br />
differentiation elements; but at <strong>the</strong> same time,<br />
due to <strong>the</strong> relatively poor bargaining power (with<br />
respect to large customers) great attention is paid<br />
to price levels. Hence, one <strong>of</strong> <strong>the</strong> strategic<br />
objectives that have been identified by <strong>the</strong> company<br />
top management consists <strong>of</strong> <strong>the</strong> analysis and<br />
reduction <strong>of</strong> product costs (both purchasing costs<br />
<strong>of</strong> components and internal production and<br />
assembly costs).<br />
In this context, <strong>the</strong> adoption <strong>of</strong> <strong>for</strong>mal methodologies<br />
<strong>for</strong> <strong>the</strong> accurate <strong>estimation</strong> <strong>of</strong><br />
manufacturing costs <strong>of</strong> new products has<br />
been considered <strong>of</strong> great importance in order to<br />
pursue <strong>the</strong> claimed strategic objective <strong>of</strong> <strong>the</strong><br />
company.<br />
In particular, this study focuses on <strong>the</strong><br />
<strong>estimation</strong> <strong>of</strong> <strong>the</strong> production costs <strong>of</strong> cast<br />
iron disk brakes, which are <strong>the</strong>n assembled<br />
with o<strong>the</strong>r components to produce braking systems,<br />
but can be also sold directly in <strong>the</strong> after<br />
market.<br />
The overall production system <strong>of</strong> this typology<br />
<strong>of</strong> diskbrakes is sketched out in Fig. 3. Two main<br />
production phases can be identified:<br />
* Foundry, which produces raw disks starting<br />
from cast iron;<br />
* Mechanical manufacturing, which produces <strong>the</strong><br />
finished disks with <strong>the</strong> dimensional and surface<br />
features as specified in <strong>the</strong> project specifications.<br />
These disks are <strong>the</strong>n assembled with o<strong>the</strong>r<br />
components in order to get a final diskbraking<br />
system.<br />
Raw<br />
mat.<br />
FOUNDRY<br />
O<strong>the</strong>r<br />
components<br />
FINISHING<br />
Finished<br />
disk<br />
ASSEMBLY<br />
Finished<br />
braking system<br />
Fig. 3. The production process <strong>of</strong> a car braking disk.
ARTICLE IN PRESS<br />
S. Cavalieri et al. / Int. J. Production Economics 91 (2004) 165–177 171<br />
The cost <strong>estimation</strong> modelling techniques can be<br />
used to quantify a reference cost value <strong>for</strong> <strong>the</strong> raw<br />
diskand <strong>the</strong> finished diskas well. It must be<br />
underlined that some <strong>of</strong> <strong>the</strong> production phases can<br />
be partially or totally outsourced: in particular, <strong>the</strong><br />
foundry activities (which include <strong>the</strong> core preparation,<br />
melting and molding phases) are almost fully<br />
outsourced, and <strong>the</strong> same is happening also <strong>for</strong> <strong>the</strong><br />
finishing stage. Hence, <strong>the</strong> availability <strong>of</strong> reliable<br />
cost <strong>estimation</strong> <strong>models</strong> is <strong>of</strong> fundamental importance<br />
both in <strong>the</strong> product development phase<br />
(totally internalised), and <strong>for</strong> <strong>the</strong> determination <strong>of</strong><br />
<strong>the</strong> price <strong>of</strong> purchased parts.<br />
6. The design <strong>of</strong> <strong>the</strong> parametric and <strong>neural</strong> <strong>models</strong><br />
The development <strong>of</strong> <strong>the</strong> two <strong>estimation</strong> techniques<br />
has been accomplished through <strong>the</strong> development<br />
<strong>of</strong> <strong>the</strong> design phases, which will be hereby<br />
described.<br />
6.1. Problem definition and data collection<br />
The first phase consisted in <strong>the</strong> clear definition<br />
<strong>of</strong> <strong>the</strong> project objectives and constraints. This<br />
aspect appears quite important in a company,<br />
which has recently re-engineered its internal<br />
organisation by moving from a functional structure<br />
to a more process-oriented view. Objectives,<br />
strategies and activities to be implemented must be<br />
accepted and shared by all <strong>the</strong> main actors <strong>of</strong> <strong>the</strong><br />
product design process, which, in this case, were<br />
mainly constituted by product designers and those<br />
responsible <strong>for</strong> purchasing activities.<br />
Once <strong>the</strong> problem and <strong>the</strong> methodology to be<br />
used had been defined, it was necessary to proceed<br />
to <strong>the</strong> analysis <strong>of</strong> product data, and to <strong>the</strong><br />
identification <strong>of</strong> <strong>the</strong> in<strong>for</strong>mation sources and <strong>of</strong><br />
<strong>the</strong> corresponding business functions responsible<br />
<strong>for</strong> <strong>the</strong>ir maintenance and update.<br />
In this case, <strong>the</strong> main typologies <strong>of</strong> data are:<br />
* Technological data, related to <strong>the</strong> production<br />
processes.<br />
* Design data, related to <strong>the</strong> morphological<br />
features <strong>of</strong> <strong>the</strong> product.<br />
Table 1<br />
The identified cost drivers<br />
Cost driver<br />
Raw diskweight<br />
Kind <strong>of</strong> material<br />
Number and type <strong>of</strong> foundry cores<br />
Type <strong>of</strong> disk<br />
Geometric shape<br />
* Cost data, such as raw material costs, labour<br />
costs, etc.<br />
The main sources <strong>of</strong> in<strong>for</strong>mation were <strong>the</strong><br />
Design and Engineering Department, <strong>the</strong> Procurement<br />
Department and <strong>the</strong> Accounting Department.<br />
Table 1 reports <strong>the</strong> most meaningful cost drivers<br />
identified during <strong>the</strong> analysis <strong>of</strong> product data. One<br />
<strong>of</strong> <strong>the</strong> main characteristics <strong>of</strong> <strong>the</strong>se drivers is <strong>the</strong>ir<br />
quite simple quantification even in <strong>the</strong> preliminary<br />
phases <strong>of</strong> <strong>the</strong> product development process, when<br />
only first raw design specifications are being<br />
assessed.<br />
6.2. Data analysis and regression<br />
Once <strong>the</strong> product cost drivers have been defined,<br />
it is necessary to evaluate <strong>the</strong> consistency <strong>of</strong><br />
<strong>the</strong> available data, in terms <strong>of</strong> measurability,<br />
reliability and completeness (i.e. real in<strong>for</strong>mation<br />
content). In particular, with regard to <strong>the</strong><br />
last point, data could result in being not suitable<br />
or not sufficient <strong>for</strong> <strong>the</strong> purpose—which inevitably<br />
leads to recycles on <strong>the</strong> previous phases—or<br />
<strong>the</strong>y could be redundant—which causes inefficiencies.<br />
Measurability deals with <strong>the</strong> problem <strong>of</strong> assigning<br />
a range <strong>of</strong> values to each variable or driver. In<br />
<strong>the</strong> case <strong>of</strong> qualitative variables, this could imply<br />
<strong>the</strong> decomposition <strong>of</strong> <strong>the</strong> <strong>estimation</strong> problem, and,<br />
hence, <strong>the</strong> generation <strong>of</strong> several parametric <strong>models</strong>.<br />
This was <strong>the</strong> case <strong>of</strong> <strong>the</strong> variable ‘‘type <strong>of</strong><br />
disk’’, whose values turned out to be <strong>the</strong> product<br />
families, according to <strong>the</strong> tree-like structure illustrated<br />
in Fig. 4.<br />
A first level classification between traditional<br />
(full) and special disks, and <strong>the</strong> fur<strong>the</strong>r subdivision
ARTICLE IN PRESS<br />
172<br />
S. Cavalieri et al. / Int. J. Production Economics 91 (2004) 165–177<br />
NORMAL<br />
BRAKE DISKS<br />
SPECIAL<br />
CARS OTHER VEHICLES CARS OTHER VEHICLES<br />
I<br />
Fig. 4. The different families <strong>of</strong> brake disks in <strong>the</strong> case study.<br />
Unit cost<br />
5y’<br />
4y’<br />
3y’<br />
2y’<br />
y’<br />
R 2 =0.60<br />
x’ 2x’ 3x’ 4x’ 5x’<br />
Weight<br />
Fig. 5. The correlationship between weight and unit manufacturing<br />
cost <strong>of</strong> <strong>the</strong> different products.<br />
in two different application fields (automotive and<br />
industrial sectors) led to <strong>the</strong> partition <strong>of</strong> <strong>the</strong> whole<br />
problem into four more consistent sub-problems,<br />
without loss <strong>of</strong> generality.<br />
Once <strong>the</strong> statistical consistency <strong>of</strong> <strong>the</strong> sample set<br />
<strong>of</strong> data had been tested, statistical and linear<br />
regression <strong>models</strong> have been used to find out <strong>the</strong><br />
one-to-one relationships between each <strong>of</strong> <strong>the</strong><br />
selected cost drivers and <strong>the</strong> dependent variable<br />
(i.e. <strong>the</strong> product cost).<br />
Fig. 5 shows <strong>the</strong> linear correlation between one<br />
<strong>of</strong> <strong>the</strong> cost drivers, <strong>the</strong> weight <strong>of</strong> <strong>the</strong> raw disk, and<br />
<strong>the</strong> product cost. As can be easily noticed both<br />
from <strong>the</strong> graph and by <strong>the</strong> analysis <strong>of</strong> <strong>the</strong><br />
coefficient R 2 ; <strong>the</strong> in<strong>for</strong>mation given by this simple<br />
model is quite significant. However, from a more<br />
thorough analysis <strong>of</strong> <strong>the</strong> figure it is quite evident<br />
that this simple regression model lacks robustness,<br />
due to <strong>the</strong> significant variances between some<br />
couples <strong>of</strong> data. Hence, <strong>the</strong> simple regression<br />
model so far illustrated must be completed by<br />
some o<strong>the</strong>r parameters to improve its per<strong>for</strong>mances.<br />
6.3. The design <strong>of</strong> <strong>the</strong> parametric model<br />
In order to complete <strong>the</strong> in<strong>for</strong>mation provided<br />
by <strong>the</strong> linear regression model, a Cost Estimation<br />
Relationship (CER) has been developed, based on<br />
a regression model, as illustrated in Eq. (1):<br />
<br />
C ¼ FC þ Cco Nco þ<br />
Crm TF<br />
1 SC<br />
<br />
W; ð1Þ<br />
where <strong>the</strong> meaning <strong>of</strong> <strong>the</strong> single terms <strong>of</strong> <strong>the</strong> model<br />
is reported in Table 2.<br />
The analytical expression includes also three<br />
corrective factors, which are mainly due to <strong>the</strong> fact<br />
that foundry activities can be per<strong>for</strong>med in<br />
different production systems (both internal and<br />
<strong>of</strong> third parties). More precisely:<br />
* trans<strong>for</strong>mation <strong>of</strong> cast iron (TF): takes into<br />
account <strong>the</strong> different conversion costs sustained<br />
in <strong>the</strong> different plants <strong>for</strong> producing raw disks<br />
from cast iron;<br />
* scrap rate (SC): represents <strong>the</strong> rate <strong>of</strong> scraps or<br />
wastes due to <strong>the</strong> characteristics <strong>of</strong> foundry<br />
operations (which can have a relevant impact<br />
on final costs);<br />
* fixed cost (FC): is a corrective factor.<br />
It must be underlined that, although this paper<br />
focuses on <strong>the</strong> illustration <strong>of</strong> <strong>the</strong> parametric model<br />
<strong>for</strong> foundry activities, <strong>the</strong> same approach has been<br />
applied also to <strong>the</strong> subsequent manufacturing<br />
phase, and led to <strong>the</strong> identification <strong>of</strong> <strong>the</strong><br />
analytical function described in Eq. (2):<br />
C ¼ðC turn þ Cm mill þ Cm grnd þ Cm oil þ Cm balanc<br />
þ Cm ind þ Pack þ CgÞSh:<br />
ð2Þ<br />
Table 2<br />
Parameters and coefficients in <strong>the</strong> foundry model<br />
Term Coeff./Param Description<br />
C — Unit cost <strong>of</strong> diskbrake<br />
FC Coefficient Fixed cost factor<br />
Cco Coefficient Core cost (per kg <strong>of</strong> cast iron)<br />
Nco Parameter Number <strong>of</strong> cores<br />
Crm Parameter Unit cost <strong>of</strong> raw material<br />
(cast iron, h/Kg)<br />
SC Coefficient Scrap rate (/100)<br />
TF Coefficient Cast iron/steel conversion factor<br />
W Parameter Weight
ARTICLE IN PRESS<br />
S. Cavalieri et al. / Int. J. Production Economics 91 (2004) 165–177 173<br />
In this case, each term represents a component<br />
<strong>of</strong> <strong>the</strong> cost related to <strong>the</strong> execution <strong>of</strong> <strong>the</strong> different<br />
manufacturing operations (turning, milling, grinding,<br />
lubrication, balancing, etc.). Some <strong>of</strong> <strong>the</strong>se<br />
variables turned out to be quite independent from<br />
<strong>the</strong> morphological characteristics <strong>of</strong> <strong>the</strong> disk, and<br />
<strong>the</strong>y have been assigned mean values. Conversely,<br />
o<strong>the</strong>r variables are strongly affected by this<br />
parameter: it is <strong>the</strong> case <strong>of</strong> turning and milling<br />
operations, whose working time depends to a great<br />
extent on <strong>the</strong> geometric size <strong>of</strong> <strong>the</strong> disk.<br />
The values <strong>of</strong> <strong>the</strong> coefficients <strong>of</strong> both <strong>models</strong><br />
that have been assigned in order to minimise <strong>the</strong><br />
mean absolute percentage error (MAPE) are<br />
defined in Eq. (3):<br />
MAPE ¼<br />
1<br />
n<br />
X n<br />
i¼1<br />
<br />
<br />
jEstimated cost i Actual cost i j<br />
100 : ð3Þ<br />
Estimated cost i<br />
6.4. The design and training <strong>of</strong> <strong>the</strong> artificial <strong>neural</strong><br />
<strong>network</strong><br />
In <strong>the</strong> discussed case, ANN represents a valid<br />
tool <strong>for</strong> <strong>the</strong> identification <strong>of</strong> <strong>the</strong> transfer function<br />
<strong>of</strong> <strong>the</strong> analysed processes, through an implicit link<br />
between <strong>the</strong> input value—<strong>the</strong> morphological and<br />
technological characteristics <strong>of</strong> <strong>the</strong> disk—and <strong>the</strong><br />
output value—<strong>the</strong> cost.<br />
With regard to <strong>the</strong> specific <strong>neural</strong> architecture<br />
used, given <strong>the</strong> peculiar purposes <strong>of</strong> <strong>the</strong> application,<br />
<strong>the</strong> multilayer perceptron (MLP) has been<br />
preferred, since it usually leads to <strong>the</strong> most<br />
satisfactory results, as reported in e.g. Hornik<br />
et al. (1989).<br />
The proper structure has been selected after<br />
having tested more ANN configurations with<br />
different numbers <strong>of</strong> hidden layers, different<br />
numbers <strong>of</strong> neurons <strong>for</strong> each level, and different<br />
inter-unit connection mechanisms, as illustrated in<br />
Table 3.<br />
The learning algorithm adopted is a typical one<br />
<strong>for</strong> this type <strong>of</strong> ANN: <strong>the</strong> backpropagation<br />
algorithm with momentum and a flat spot<br />
elimination term.<br />
The set <strong>of</strong> patterns has been divided into two<br />
subsets: one has been used as a training set (in<br />
Table 3<br />
Alternative configurations <strong>of</strong> ANN<br />
ANN<br />
order to adjust <strong>the</strong> weight <strong>of</strong> <strong>the</strong> connections and<br />
store <strong>the</strong> knowledge) and <strong>the</strong> o<strong>the</strong>r one has been<br />
used as a validation set to evaluate <strong>the</strong> responses <strong>of</strong><br />
<strong>the</strong> net to unseen patterns (in order to evaluate <strong>the</strong><br />
degree <strong>of</strong> generalisation).<br />
The results <strong>of</strong> this testing phase are reported in<br />
Fig. 6: <strong>the</strong> per<strong>for</strong>mance indicators used are <strong>the</strong><br />
MAPE and <strong>the</strong> Generalisation factor (Gf), which<br />
is defined as<br />
Gf ¼ k n 100;<br />
Number <strong>of</strong> neurons per layer<br />
Hidden layer 1 Hidden layer 2<br />
1 3 0<br />
2 5 0<br />
3 7 0<br />
4 9 0<br />
5 3 5<br />
6 5 3<br />
7 5 4<br />
8 6 3<br />
ð4Þ<br />
where n is <strong>the</strong> number <strong>of</strong> patterns that compose <strong>the</strong><br />
validation set and k is <strong>the</strong> number <strong>of</strong> such patterns<br />
estimated with an error less <strong>the</strong>n 5% (this value<br />
having been fixed as a threshold level).<br />
It is quite evident that <strong>the</strong> two-layer configuration<br />
shows better per<strong>for</strong>mances than <strong>the</strong> onelayer<br />
one. This result is a fur<strong>the</strong>r confirmation<br />
<strong>of</strong> some <strong>the</strong>oretical assumptions reported in<br />
literature (Chester, 1993), where <strong>the</strong> superiority<br />
<strong>of</strong> a two-layer solution is put in relationship with<br />
its shorter training times (given <strong>the</strong> same number<br />
<strong>of</strong> connections) and <strong>the</strong> better rate <strong>of</strong> output<br />
prediction.<br />
7. Comparison <strong>of</strong> <strong>the</strong> results <strong>of</strong> <strong>the</strong> two approaches<br />
The parametric and ANN <strong>models</strong> have been<br />
tested and validated by comparing <strong>the</strong> results<br />
provided by <strong>the</strong>se <strong>models</strong> with <strong>the</strong> actual costs <strong>of</strong><br />
<strong>the</strong> twenty most relevant components (raw disks)<br />
purchased or manufactured by <strong>the</strong> firm (<strong>the</strong>
ARTICLE IN PRESS<br />
174<br />
S. Cavalieri et al. / Int. J. Production Economics 91 (2004) 165–177<br />
3.00%<br />
2.50%<br />
2.00%<br />
1.50%<br />
1.00%<br />
0.50%<br />
0.00%<br />
95.00%<br />
90.00%<br />
85.00%<br />
80.00%<br />
75.00%<br />
30 50 70 90 35 53 54 63 30 50 70 90 35 53 54 63<br />
MAPE<br />
Fig. 6. The <strong>estimation</strong> error and <strong>the</strong> generalisation factor.<br />
Generalisation factor<br />
relevance being calculated in terms <strong>of</strong> incidence <strong>of</strong><br />
sales).<br />
The statistical analyses showed <strong>the</strong> superiority<br />
<strong>of</strong> <strong>the</strong> parametric model with respect to <strong>the</strong> simple<br />
regression line: <strong>the</strong> average MAPE fell from 15%<br />
to about 6%. But <strong>the</strong> different releases <strong>of</strong> <strong>the</strong><br />
<strong>neural</strong> <strong>network</strong>registered even better per<strong>for</strong>mances.<br />
This outcome can be easily seen in<br />
Fig. 7, which shows <strong>the</strong> average MAPE <strong>of</strong> <strong>the</strong><br />
estimated production costs <strong>of</strong> <strong>the</strong> different part<br />
numbers (aggregated by production plant).<br />
Similarly, Fig. 8 shows <strong>the</strong> compared <strong>estimation</strong><br />
error <strong>of</strong> <strong>the</strong> two <strong>models</strong> on <strong>the</strong> twenty selected part<br />
numbers: <strong>the</strong> maximum value is about 15% <strong>for</strong> <strong>the</strong><br />
parametric model, while <strong>the</strong> <strong>neural</strong> <strong>network</strong>never<br />
reaches <strong>the</strong> 10% threshold, and only in six cases is<br />
above 5%.<br />
Of course, <strong>the</strong> superiority <strong>of</strong> <strong>the</strong> <strong>neural</strong> <strong>network</strong><br />
could derive from a poor design <strong>of</strong> <strong>the</strong> parametric<br />
model (although this seems not to be <strong>the</strong> case <strong>of</strong><br />
<strong>the</strong> analysed problem). But, apart from absolute<br />
superiority judgements, what emerges is <strong>the</strong><br />
robustness <strong>of</strong> <strong>the</strong> ANN, which leads to excellent<br />
results on all <strong>of</strong> <strong>the</strong> validation samples, thus<br />
contradicting those who say that this methodology,<br />
thanks to its many free parameters, allows <strong>the</strong><br />
error on data used <strong>for</strong> its construction to go to<br />
zero, while <strong>the</strong> overall per<strong>for</strong>mance (<strong>the</strong> mean<br />
error on <strong>the</strong> population in general) can be far less<br />
satisfactory (Mason and Smith, 1997) 2 .<br />
2 This point is linked to <strong>the</strong> bias/variance problem examined<br />
by Geman et al. (1992), which is particularly critical in case <strong>of</strong><br />
‘‘resubstitution’’ validation method, where <strong>the</strong> construction set<br />
6.00%<br />
5.00%<br />
4.00%<br />
3.00%<br />
2.00%<br />
1.00%<br />
0.00%<br />
P1 P2 P3 P4 P5<br />
MAPE <strong>Parametric</strong> model<br />
MAPE Artificial Neural Network<br />
Fig. 7. The average <strong>estimation</strong> error <strong>of</strong> <strong>the</strong> two approaches<br />
(five plants).<br />
But it is also interesting to extend <strong>the</strong> analysis<br />
beyond <strong>the</strong> quantitative data to include also some<br />
qualitative considerations.<br />
The most relevant point concerns <strong>the</strong> inherent<br />
logic <strong>of</strong> <strong>the</strong> two approaches: while <strong>the</strong> use <strong>of</strong> a<br />
parametric model requires <strong>the</strong> specification <strong>of</strong> <strong>the</strong><br />
analytical expression <strong>of</strong> <strong>the</strong> relationship that links<br />
input and output, this is not necessary with a<br />
<strong>neural</strong> <strong>network</strong>. Hence, <strong>the</strong> ANN is characterised<br />
by <strong>the</strong> possibility to determine autonomously <strong>the</strong><br />
most appropriate <strong>for</strong>m <strong>of</strong> <strong>the</strong> relationship. This<br />
(footnote continued)<br />
is identical to <strong>the</strong> validation set. In this case, <strong>the</strong> model can be<br />
severely biased, as proved by Twomey and Smith (1993). Given<br />
<strong>the</strong>ir inherent characteristics, <strong>neural</strong> <strong>network</strong>s are supposed to<br />
be particularly affected by this problem (hence, <strong>the</strong> resubstitution<br />
validation method should be avoided).
ARTICLE IN PRESS<br />
S. Cavalieri et al. / Int. J. Production Economics 91 (2004) 165–177 175<br />
ANN<br />
<strong>Parametric</strong> model<br />
19<br />
17<br />
15<br />
13<br />
11<br />
9<br />
7<br />
5<br />
3<br />
1<br />
-15% -10% -5% 0% 5% 10%<br />
Fig. 8. The compared <strong>estimation</strong> error <strong>for</strong> <strong>the</strong> 20 selected components (percent values).<br />
can be seen both as a strength and a weakness;<br />
indeed:<br />
* <strong>the</strong> ex ante analysis <strong>of</strong> <strong>the</strong> problem is much<br />
leaner and faster, and in <strong>the</strong> case <strong>of</strong> very<br />
complex or innovative problems <strong>the</strong> outcome is<br />
not dependent on <strong>the</strong> ability <strong>of</strong> <strong>the</strong> analysts to<br />
find <strong>the</strong> key independent variables and <strong>the</strong> most<br />
appropriate kind <strong>of</strong> analytical expression;<br />
* at <strong>the</strong> same time, <strong>the</strong> impossibility to know <strong>the</strong><br />
kind <strong>of</strong> relationship can be seen as a limit <strong>of</strong> <strong>the</strong><br />
<strong>neural</strong> <strong>network</strong>approach, since it is not clear<br />
how <strong>the</strong> results are achieved. In o<strong>the</strong>r terms, in<br />
<strong>the</strong> <strong>neural</strong> <strong>network</strong>approach <strong>the</strong> object <strong>of</strong><br />
analysis is treated as a ‘‘blackbox’’; hence, it is<br />
impossible to give a <strong>the</strong>oretical interpretation to<br />
<strong>the</strong> results provided by <strong>the</strong> tool, especially in <strong>the</strong><br />
case <strong>of</strong> unpredicted or (at least intuitively)<br />
unjustified values. This fact has <strong>of</strong>ten led to<br />
some scepticism about this methodology in<br />
several application contexts, due also to <strong>the</strong><br />
difficulty that its ‘‘sponsors’’ face when <strong>the</strong>y are<br />
asked to prove <strong>the</strong> quality <strong>of</strong> <strong>the</strong> outcome in<br />
case <strong>of</strong> counterintuitive or questionable results.<br />
Moreover, it could be objected that if <strong>the</strong><br />
knowledge <strong>of</strong> <strong>the</strong> <strong>for</strong>m <strong>of</strong> <strong>the</strong> relationship is not<br />
needed to implement a <strong>neural</strong> <strong>network</strong>approach,<br />
it is never<strong>the</strong>less necessary to pre-determine <strong>the</strong><br />
structure <strong>of</strong> <strong>the</strong> <strong>network</strong>. The answers that can<br />
be given to this critical consideration are <strong>the</strong><br />
following:<br />
* <strong>the</strong> application contexts <strong>of</strong> <strong>the</strong> <strong>network</strong>structures<br />
that have been developed so far (multilayer,<br />
Adaptive Resonance Theory or ART,<br />
self-organising, etc.) are quite well known, and<br />
<strong>the</strong> identification <strong>of</strong> <strong>the</strong> most appropriate<br />
structure is <strong>the</strong>n facilitated;<br />
* <strong>the</strong> s<strong>of</strong>tware packages <strong>for</strong> <strong>the</strong> design <strong>of</strong> <strong>neural</strong><br />
<strong>network</strong>s are generally provided with tools<br />
aimed at evaluating <strong>the</strong> ‘‘learning attitude’’ <strong>of</strong><br />
<strong>the</strong> <strong>network</strong>, and, in case <strong>of</strong> negative response,<br />
at implementing <strong>the</strong> appropriate modifications.<br />
Ano<strong>the</strong>r point that is <strong>of</strong>ten cited by <strong>the</strong> users <strong>of</strong><br />
parametric <strong>models</strong> is <strong>the</strong> excellent (or at least<br />
satisfactory) quality/ cost ratio. But <strong>the</strong> implementation<br />
cost <strong>of</strong> a <strong>neural</strong> <strong>network</strong>is generally quite<br />
similar to that <strong>of</strong> a parametric model (<strong>the</strong> lower<br />
costs <strong>of</strong> preliminary analyses being balanced by<br />
<strong>the</strong> higher costs <strong>of</strong> developing and testing <strong>the</strong><br />
ANN). Instead, <strong>the</strong> higher robustness <strong>of</strong> <strong>the</strong><br />
methodology, and <strong>the</strong> consequent higher propensity<br />
to deal with redundant or wrong in<strong>for</strong>mation<br />
enable <strong>the</strong> elimination or consistent reduction <strong>of</strong>
ARTICLE IN PRESS<br />
176<br />
S. Cavalieri et al. / Int. J. Production Economics 91 (2004) 165–177<br />
<strong>the</strong> activities <strong>of</strong> data analysis, which are generally<br />
very time consuming (and, hence, quite expensive).<br />
Ano<strong>the</strong>r strength <strong>of</strong> <strong>neural</strong> <strong>network</strong>s is related<br />
to <strong>the</strong>ir flexibility to changes made in <strong>the</strong> structure<br />
<strong>of</strong> <strong>the</strong> analysed system once <strong>the</strong> development <strong>of</strong><br />
<strong>the</strong> model has been already completed. For<br />
example, if <strong>the</strong> production process <strong>of</strong> <strong>the</strong> firm is<br />
modified through <strong>the</strong> implementation <strong>of</strong> new<br />
technologies, while <strong>the</strong> parametric model must be<br />
completely revised and re-tested, using a <strong>neural</strong><br />
<strong>network</strong>it will be sufficient to conduct a new<br />
training program with a new set <strong>of</strong> data (<strong>the</strong><br />
structure <strong>of</strong> <strong>the</strong> <strong>network</strong>may not even be<br />
modified).<br />
On <strong>the</strong> o<strong>the</strong>r hand, <strong>neural</strong> <strong>network</strong>s are<br />
completely data-driven: an adequate set <strong>of</strong> construction<br />
data is <strong>the</strong>n required, while a CER <strong>for</strong> a<br />
parametric model can be also deduced from<br />
technical considerations on <strong>the</strong> production process<br />
and on <strong>the</strong> kind <strong>of</strong> resources used (as <strong>for</strong> <strong>the</strong><br />
typical engineering estimating approach), provided<br />
that it can be subsequently validated.<br />
8. Conclusions<br />
The use <strong>of</strong> cost <strong>estimation</strong> predictive <strong>models</strong> in<br />
<strong>the</strong> first stages <strong>of</strong> <strong>the</strong> product development process<br />
is <strong>of</strong> fundamental importance to ‘‘optimise’’ <strong>the</strong><br />
concept <strong>of</strong> <strong>the</strong> new product according to <strong>the</strong> firm’s<br />
overall competitive strategy and key success<br />
factors. The anticipated knowledge <strong>of</strong> cause-effect<br />
relationships between design solutions and <strong>the</strong><br />
production costs is extremely useful both <strong>for</strong><br />
internal manufacturing activities, and <strong>for</strong> purchased<br />
parts.<br />
The choice <strong>of</strong> <strong>the</strong> predictive model is generally<br />
based on <strong>the</strong> classical cost/ benefit ratio: in this<br />
sense, <strong>the</strong> regression <strong>models</strong> have <strong>of</strong>ten been<br />
preferred. But <strong>the</strong> more recently developed ANNs<br />
seem to represent a valid alternative, especially<br />
when <strong>the</strong> CER <strong>for</strong>m is not known, and cannot be<br />
logically argued (since in this case psychological<br />
barriers deriving from <strong>the</strong> impossibility to check<br />
<strong>the</strong> relationship with common sense can be overcome<br />
more easily). In <strong>the</strong> case study illustrated in<br />
this paper, with respect to a parametric model <strong>the</strong><br />
ANN has shown better results in all <strong>the</strong> validation<br />
samples, and no significant variance problems (i.e.<br />
<strong>the</strong> dependence <strong>of</strong> <strong>the</strong> model on <strong>the</strong> data set used<br />
to construct it) have emerged.<br />
Anyway, to foster <strong>the</strong> diffusion <strong>of</strong> this methodology<br />
it is necessary to make it more ‘‘transparent’’<br />
to <strong>the</strong> analyst, by developing s<strong>of</strong>tware tools<br />
which reproduce in a comprehensible, easy-to-use<br />
way <strong>the</strong> behaviour <strong>of</strong> <strong>the</strong> <strong>network</strong>.<br />
Acknowledgements<br />
The authors are thankful to Mr. Massimo<br />
Berlato <strong>for</strong> his important contribution to <strong>the</strong><br />
research project during <strong>the</strong> elaboration <strong>of</strong> his<br />
M.Sc. Thesis, and to <strong>the</strong> technical staff <strong>of</strong> <strong>the</strong><br />
company <strong>for</strong> <strong>the</strong> collaboration in <strong>the</strong> development<br />
<strong>of</strong> <strong>the</strong> industrial case study.<br />
References<br />
Ansari, S.L., Bell, J.A., The CAM-I Target Cost Core Group<br />
(Eds.), 1997. Target Cost. The Next Frontier in Strategic<br />
Cost Management. Irwin, New York.<br />
Berliner, C., Brimson, J.A. (Eds.), 1988. Cost Management <strong>for</strong><br />
Today’s Advanced Manufacturing. Harvard Business<br />
School Press, Boston.<br />
Blanchard, B.S., 1979. Design and Manage to Life Cycle Cost.<br />
M/A Press, Portland.<br />
Cavalieri, S., Taisch, M., 1996. Neural <strong>network</strong>s in hybrid<br />
intelligent manufacturing systems, Proceedings <strong>of</strong> <strong>the</strong><br />
APMS ‘96—International Conference on Advances in<br />
Production Systems, 4th–6th November, Kyoto.<br />
Cavalieri, S., Garetti, M., Taisch, M., 1995. A predictive <strong>neural</strong><br />
<strong>network</strong>modelling system <strong>for</strong> process plants, Proceedings <strong>of</strong><br />
<strong>the</strong> 13th International Conference on Production Research,<br />
6th–10th August, Jerusalem, pp. 571–573.<br />
Cavalieri, S., Rabe, M., Taisch, M., 1997. A <strong>neural</strong> <strong>network</strong><br />
approach to <strong>the</strong> plant design problem, Proceedings <strong>of</strong> <strong>the</strong><br />
First International Conference on Engineering Design and<br />
Automation, 18th–21st March, Bangkok.<br />
Chester, J., 1993. Neural Networks. A Tutorial. Prentice Hall,<br />
New York.<br />
Cooper, R., 1997. Target Costing and Value Engineering.<br />
Productivity Press, Portland.<br />
Fabrycky, W.J., 1991. Life Cycle Cost and Economic Analysis.<br />
Prentice Hall, New York.<br />
Geman, S., Bienenstock, E., Doursat, R., 1992. Neural<br />
<strong>network</strong>s and <strong>the</strong> bias/variance dilemma. Neural Computation<br />
4, 1–58.
ARTICLE IN PRESS<br />
S. Cavalieri et al. / Int. J. Production Economics 91 (2004) 165–177 177<br />
Hammer, M., Stanton, S., 1999. How Process Enterprise Really<br />
Work. Harvard Business School Press, Cambridge, MA,<br />
London, November–December, pp. 108–118.<br />
Hiromoto, T., 1988. Ano<strong>the</strong>r hidden edge—Japanese management<br />
accounting. Harvard Business Review, July–August.<br />
Hornik, K., Stinchcombe, M., White, H., 1989. Multilayer<br />
feed<strong>for</strong>ward <strong>network</strong>s are universal approximators. Neural<br />
Networks 2, 359–366.<br />
Huang, G.Q., 1996. Design <strong>for</strong> X. Concurrent Engineering<br />
Imperatives. Chapman & Hall, London.<br />
Mason, A.K., Smith, A.E., 1997. Cost <strong>estimation</strong> predictive<br />
modeling: Regression versus <strong>neural</strong> <strong>network</strong>. The Engineering<br />
Economist 42 (2), 137–162.<br />
NASA, <strong>Parametric</strong> Cost Estimating Handbook, http://<br />
www.jsc.nasa.gov/bu2/pcehg.html.<br />
O’Rourke, B., 1998. Neural nets <strong>for</strong>ecast futures prices.<br />
Financial Engineering News, http://fenews.com/1998/<br />
Issue3/029802.htm.<br />
Porter, M.E., 1980. Competitive Strategy—Techniques <strong>for</strong><br />
Analysing Industries and Competitors. The Free Press,<br />
New York.<br />
Sakurai, M., 1989. Target costing and how to use it. Journal <strong>of</strong><br />
Cost Management 3 (Summer).<br />
Shields, M.D., Young, S.M., 1991. Managing product life cycle<br />
costs: An organisational model. Journal <strong>of</strong> Cost Management<br />
5 (Fall).<br />
Shtub, A., Zimmermann, Y., 1993. A <strong>neural</strong>-<strong>network</strong>-based<br />
approach <strong>for</strong> estimating <strong>the</strong> cost <strong>of</strong> assembly systems.<br />
International Journal <strong>of</strong> Production Economics 32 (2),<br />
189–207.<br />
Twomey, J.M., Smith, A.E., 1993. Nonparametric error<br />
<strong>estimation</strong> methods <strong>for</strong> validating artificial <strong>neural</strong> <strong>network</strong>s.<br />
Intelligent Engineering Systems through Artificial Neural<br />
Networks 3, 233–238.<br />
Ulrich, K.T., Eppinger, S.D., 1995. Product Design and<br />
Development. McGraw-Hill International Editions, New<br />
York.<br />
Zeleny, M., 1988. What is integrated process management.<br />
Human Systems Management 7, 265–267.<br />
Zhang, Y.F., Fuh, J.Y., Chan, W.T., 1996. Feature-based cost<br />
<strong>estimation</strong> <strong>for</strong> packaging products using <strong>neural</strong> <strong>network</strong>s.<br />
Computers in Industry 32, 95–113.