

track
track
track

You also want an ePaper? Increase the reach of your titles
YUMPU automatically turns print PDFs into web optimized ePapers that Google loves.
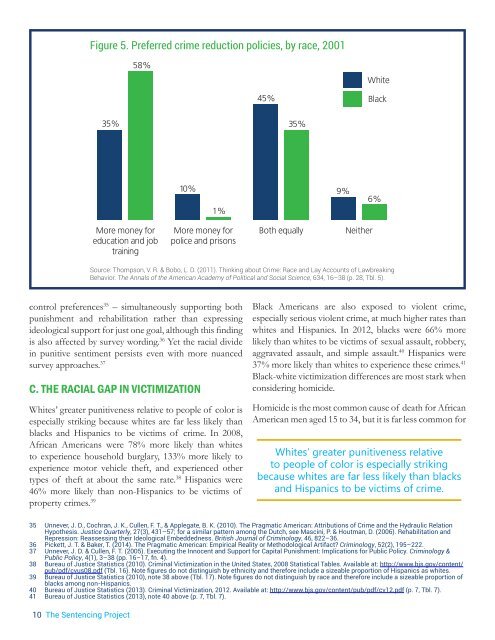
Figure 5. Preferred crime reduction policies, by race, 2001<br />
58%<br />
White<br />
45%<br />
Black<br />
35%<br />
35%<br />
10%<br />
1%<br />
9%<br />
6%<br />
More money for<br />
education and job<br />
training<br />
More money for<br />
police and prisons<br />
Both equally<br />
Neither<br />
Source: Thompson, V. R. & Bobo, L. D. (2011). Thinking about Crime: Race and Lay Accounts of Lawbreaking<br />
Behavior. The Annals of the American Academy of Political and Social Science, 634, 16–38 (p. 28, Tbl. 5).<br />
control preferences 35 – simultaneously supporting both<br />
punishment and rehabilitation rather than expressing<br />
ideological support for just one goal, although this finding<br />
is also affected by survey wording. 36 Yet the racial divide<br />
in punitive sentiment persists even with more nuanced<br />
survey approaches. 37<br />
C. THE RACIAL GAP IN VICTIMIZATION<br />
Whites’ greater punitiveness relative to people of color is<br />
especially striking because whites are far less likely than<br />
blacks and Hispanics to be victims of crime. In 2008,<br />
African Americans were 78% more likely than whites<br />
to experience household burglary, 133% more likely to<br />
experience motor vehicle theft, and experienced other<br />
types of theft at about the same rate. 38 Hispanics were<br />
46% more likely than non-Hispanics to be victims of<br />
property crimes. 39<br />
Black Americans are also exposed to violent crime,<br />
especially serious violent crime, at much higher rates than<br />
whites and Hispanics. In 2012, blacks were 66% more<br />
likely than whites to be victims of sexual assault, robbery,<br />
aggravated assault, and simple assault. 40 Hispanics were<br />
37% more likely than whites to experience these crimes. 41<br />
Black-white victimization differences are most stark when<br />
considering homicide.<br />
Homicide is the most common cause of death for African<br />
American men aged 15 to 34, but it is far less common for<br />
Whites’ greater punitiveness relative<br />
to people of color is especially striking<br />
because whites are far less likely than blacks<br />
and Hispanics to be victims of crime.<br />
35 Unnever, J. D., Cochran, J. K., Cullen, F. T., & Applegate, B. K. (2010). The Pragmatic American: Attributions of Crime and the Hydraulic Relation<br />
Hypothesis. Justice Quarterly, 27(3), 431–57; for a similar pattern among the Dutch, see Mascini, P. & Houtman, D. (2006). Rehabilitation and<br />
Repression: Reassessing their Ideological Embeddedness. British Journal of Criminology, 46, 822–36.<br />
36 Pickett, J. T. & Baker, T. (2014). The Pragmatic American: Empirical Reality or Methodological Artifact? Criminology, 52(2), 195–222.<br />
37 Unnever, J. D. & Cullen, F. T. (2005). Executing the Innocent and Support for Capital Punishment: Implications for Public Policy. Criminology &<br />
Public Policy, 4(1), 3–38 (pp. 16–17, fn. 4).<br />
38 Bureau of Justice Statistics (2010). Criminal Victimization in the United States, 2008 Statistical Tables. Available at: http://www.bjs.gov/content/<br />
pub/pdf/cvus08.pdf (Tbl. 16). Note figures do not distinguish by ethnicity and therefore include a sizeable proportion of Hispanics as whites.<br />
39 Bureau of Justice Statistics (2010), note 38 above (Tbl. 17). Note figures do not distinguish by race and therefore include a sizeable proportion of<br />
blacks among non-Hispanics.<br />
40 Bureau of Justice Statistics (2013). Criminal Victimization, 2012. Available at: http://www.bjs.gov/content/pub/pdf/cv12.pdf (p. 7, Tbl. 7).<br />
41 Bureau of Justice Statistics (2013), note 40 above (p. 7, Tbl. 7).<br />
10 The Sentencing Project